Abstract
The first version operational Hurricane Analysis and Forecast System (HAFS) implemented the Vortex Initialization (VI) technique to optimize tropical cyclone structure and intensity, which was adopted from the Hurricane Weather Research and Forecasting system (HWRF) and does not initialize cloud hydrometeors and vertical velocity. This limitation in the VI caused the inconsistency issue between hurricane vortex and its cloud in the model initial condition. A new VI, which can relocate or cycle cloud hydrometeors and vertical velocity, has been developed to solve this issue. For the cold start, the VI simply relocates the cloud and vertical velocity fields of Global Forecasting System (GFS) analysis; for the warm start, the cloud and vertical velocity associated with a hurricane in the GFS analysis are replaced by the fields extracted from the 6 h HAFS forecast of a previous cycle. This new VI has been tested for the 2023 HAFS-A real-time experiment configuration, and another sensitivity experiment without relocating or cycling both cloud and vertical velocity is conducted to examine the effect of the new VI. A comparison of the results reveals that the new VI improves the intensity forecast and generates a very realistic initial cloud field in correct position. Validating the model initial conditions with observed radar data reveals that the new VI captures the secondary eyewall of major hurricanes and asymmetric convective structure of weak tropical storms. This improvement of the cloud field in the model initial condition through the new VI expects to provide a better background for further data assimilation. Additional sensitivity experiment that only relocates or cycles cloud hydrometeors without correcting the vertical velocity field results in poorer intensity forecasts, which highlights the importance of vertical velocity in the model initial condition.
1. Introduction and Motivation
Initialization of a tropical cyclone (TC) vortex or vortex initialization (VI) has long been a challenging issue for numerical model developers because the features of TCs are not well resolved in low-resolution global analysis data. For example, Global Forecasting System (GFS) version 16, operated by the National Center for Environmental Prediction (NCEP), has ~13 km resolution, which remains insufficient for resolving TC structure. However, the strongest wind in TCs exists in a very small area, and the convective burst, which plays a critical role in rapid intensification, has a scale of several kilometers. These facts strongly suggest that the TC vortex in the low-resolution global analysis is insufficient for the initial condition for regional hurricane models, mainly when the TC is strong. Therefore, a procedure to improve the TC vortex structure in the global analysis is required for regional hurricane models, and substantial efforts have been invested in TC vortex improvement in the model initial condition.
The main streams of research in TC initialization improvement include data assimilation (DA), dynamically initialized vortex, and bogus vortex methods. DA is an advanced method that can improve the TC vortex structure by using various observation data, such as satellite data, dropsonde, and airborne Doppler radar from reconnaissance flights [1,2,3,4,5]. The bogus vortex algorithm is the method most frequently used by the numerical weather community [6,7,8] and has had a long history of use since its introduction in pioneering research by [9] at the Geophysical Fluid Dynamics Laboratory (GFDL). The bogus vortex method removes a weak and broad TC vortex in the global analysis by using a sophisticated filtering method developed by [10] and adds a new TC vortex constructed by using observed data (e.g., maximum wind speed and central pressure), hydrostatic and gradient wind balance relationships. In recent years, a new method, the dynamically initialized vortex method, has been introduced to build a TC vortex through model integration not using an idealized bogus TC vortex [11,12]. In this method, the TC vortex generated through model integration is extracted and merged back into the model initial condition. Many studies have demonstrated that the bogus vortex and dynamically initialized vortex methods produce better intensity forecasts by improving the TC vortex structure in the model initial condition [9,10,11].
The NCEP has been using very sophisticated VI methods for its operational hurricane model, including a Hurricane Weather Research and Forecasting (HWRF) model, Hurricanes in a Multi-scale Ocean coupled Non-hydrostatic (HMON) model [13], and Hurricane Analysis and Forecast System (HAFS) based on [14]. Although NCEP’s VI method was originally developed for HWRF, it has also been used for HMON and HAFS because of its excellent capabilities. The basic concept of this VI method combines the dynamically initialized vortex method and bogussing algorithm (schematic diagram in Figure 1).
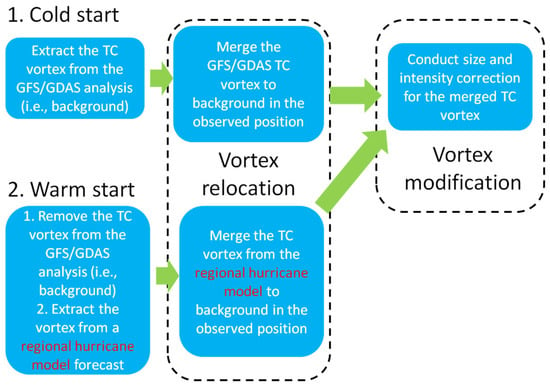
Figure 1.
Schematic diagram that describes the standard VI procedure that is used in HAFS. If the observed maximum wind speed of a TC is equal to or greater (lower) than warm start threshold, it is warm (cold) start. The warm start threshold for HAFS-A (i.e., HAFS version operated by NCEP) is shown in the Table 1.
As illustrated in Figure 1, the TC vortex is extracted from GFS analysis (for cold start) or the 6 h forecast field from the previous cycle of the regional hurricane model (for warm start) through a state-of-the-art filtering method similar to that in [10]. Subsequently, a vortex relocation (VR) procedure is conducted: the TC vortex is merged to the observation location of the background field (i.e., GFS analysis) because the TC vortex in the background field is sometimes not in the observed position. After VR, intensity and size correction are conducted by using the observed maximum wind speed, 34 kt wind radii, and the radius of maximum wind from the Tropical Cyclone Vitals Database (TCVitals). This vortex modification procedure adjusts the intensity of the TC vortex to the observed maximum wind speed of TCVitals. In this VI method, the criterion for warm start is based on the observed maximum wind speed (Figure 1). Readers are referred to [14] for more detailed information regarding NCEP’s VI method. This method was also implemented in the first operational version of HAFS (HAFSv1) and will be used in the next operational version.
Although NCEP’s VI procedure is a highly useful method for HAFS, its limitations must be considered. As described above, NCEP’s VI method was developed for HWRF, which is based on the Weather Research and Forecast model, whereas HAFS is based on the Unified Forecast System model and a finite-volume cubed-sphere dynamical core [19,20,21]. Because HWRF and HAFS differ, VI must be adjusted for the new HAFS model. Of note, the cloud and vertical velocity fields are zero in the initial condition of HWRF but not HAFS, and the original NCEP VI is not designed to handle these variables. The original NCEP VI, which is used for HWRF and HMON, improves horizontal wind, temperature, specific humidity, and pressure, but not cloud and vertical velocity fields. In the initialization process of the operational HAFSv1 model, the cloud field simply comes from GFS analysis without any correction. Consequently, inconsistencies exist between the cloud field and other variables associated with a TC vortex, thus generating a weird HAFS initial condition. Therefore, this article introduces a new VI method that can substantially improve the cloud and vertical velocity fields of the HAFS model initial field through the relocation–cycling procedure. This update has two benefits: (a) since vertical velocity is a prognostic variable in the finite-volume cubed-sphere dynamical core [22], it would be better to include this variable in the new HAFS VI; and (b) because VI is performed before DA, this VI update should provide more accurate background fields for assimilating cloud-related observations, e.g., radar reflectivity and cloudy radiances. Ref. [23] already pointed out that, due to the lack of cloud hydrometeor relocation procedure, more advanced cloudy radiance data assimilation was not possible in the operational HWRF model. Thus, the cloud hydrometeor relocation–cycling procedure of the new VI method will make such data assimilation possible in HAFS.
Section 2 describes the details of the new VI method that improves the cloud and vertical velocity fields of the HAFS initial condition. Section 3 shows the effects of the updated VI on the HAFS forecast, according to various sensitivity experiments. Section 4 and Section 5 describe detailed analyses of these sensitivity experiments. Section 6 summarizes the results and new findings of interest from the updated HAFS-VI.
2. Cloud and Vertical Velocity Improvements in the New VI
2.1. Details Regarding the New VI
Similarly to descriptions in [14], during the HAFS-VI procedure, horizontal and vertical velocities, specific humidity, and temperature from GFS and HAFS forecast fields are interpolated into a 30 × 30 degree storm-centered domain that has 0.02 degree resolution and 81 vertical hybrid levels. After VR and vortex modification are conducted in this 30 × 30 degree VI domain, the VI procedure generates a VI analysis field that contains a corrected TC vortex. Subsequently, all variables for this VI analysis field are re-interpolated into the HAFS model grid points to prepare for model initialization. In the new VI (Herein, “original VI (or old VI)” indicates the VI that has no cloud and vertical velocity relocation–cycling procedure, whereas “new VI” indicates the advanced method adding relocation–cycling capability to the original VI), the relocation or cycling capability of cloud variables and vertical velocity is added to the original HAFS-VI procedure to enable the VI to handle these new variables properly. Thus, cloud variables and vertical velocity are also interpolated into the VI domain during the relocation–cycling procedure. Here, “cloud variables” indicate five cloud hydrometeors (cloud water, rain water, graupel, snow, and cloud ice) and other cloud prognostic variables. Two major cloud microphysics options are available for HAFS: the GFDL microphysics scheme [24,25,26], which has only five cloud hydrometeor variables, and the Thompson microphysics scheme [27,28], which has two additional cloud variables (cloud ice water number concentration and rain number concentration). Therefore, the new VI relocates or cycles five and seven cloud variables for the GFDL and Thompson microphysics schemes, respectively.
Procedures for cloud variables and the vertical velocity of the model initial condition differ regarding whether a particular cycle is a cold start or a warm start, as illustrated in Figure 2. For a cold start, the GFS cloud variables within 6 degrees of the TC center are relocated along the storm. For a warm start, the GFS cloud fields within 6 degrees of the best track TC center are replaced by the HAFS cloud fields from the previous 6 h forecast. That is, the HAFS cloud field is merged into the GFS cloud field in the warm start case. The same relocation and cycling method is applied to the vertical velocity field but is conducted within 3 degrees of the observed TC center (Figure 2).
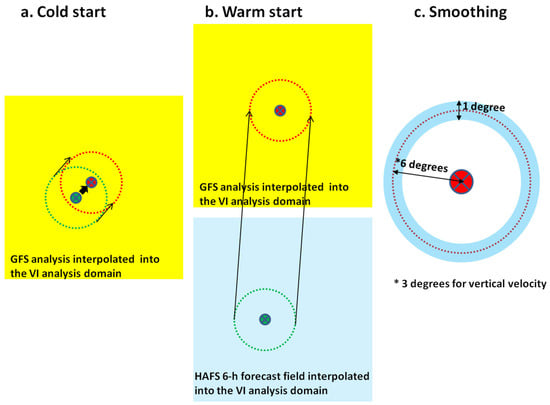
Figure 2.
Schematic diagram that describes the cloud and vertical velocity (a) relocation procedure for the cold start, (b) cycling procedure for the warm start, where X marks with red and green circles indicate the observed TC vortex and GFS (or HAFS) TC vortex locations, respectively. The red circle indicates the region where cloud or vertical velocity field will be replaced by new fields from the green circle region. (c) Schematic diagram that illustrates the annulus region (in light blue shaded) where the smoothing is applied after the relocation or cycling procedure is carried out. The X mark with a red circle indicates the observed TC vortex position.
Due to the distinct scales of the cirrus field and TC vortex itself, different radii are used for the cloud field and vertical velocity. In the upper troposphere, the cirrus cloud field of the TC, primarily made up of cloud ice, extends widely from the storm’s center, with snow particles sometimes falling from this upper-level cloud. To capture the cirrus cloud and its precipitation, modifying the cloud field in a large area is preferable; thus, 6 degrees is selected. A 3 degree radius is applied to the vertical velocity field, closely associated with low- and mid-level convection because convection associated with TCs usually exists within ~3 degrees of the center. However, these ranges could be tuned in the future if necessary.
As illustrated in Figure 2c, after the cloud and vertical velocity fields are relocated or cycled, 9-point smoothing is performed five or ten times in a ring-shaped area with a width of 1 degree along the boundary of the area, where the cloud and vertical velocity have been changed, to reduce the sharp gradient of the fields. When these variables are relocated or cycled, they maintain the same pressure level before and after the VI procedure. Details of this procedure are described in the Appendix A separately.
2.2. Example Cases
This subsection describes details regarding cloud and vertical velocity improvement in this new VI by showing the VI domain data where relocation/cycling are processed.
Figure 3 illustrates the cloud “relocation” for the cold start cycle of tropical depression 26L at 0600 UTC on 5 October 2020. Before the relocation procedure, the low-level GFS TC vortex center and its associated rainwater were located south of the best track position (red X) (Figure 3a,b). As shown in this example, in the GFS analysis, both the TC vortex and the cloud of the TC are not located in the observed positions, thus justifying the relocation of cloud variables. After VI, both the TC vortex and cloud hydrometeors are shifted to the correct positions in the VI analysis (Figure 3c,d). In the lower and upper levels, the cloud hydrometeor is situated east and northeast of the TC vortex circulation center, respectively, thus suggesting that the relocation was performed very well.
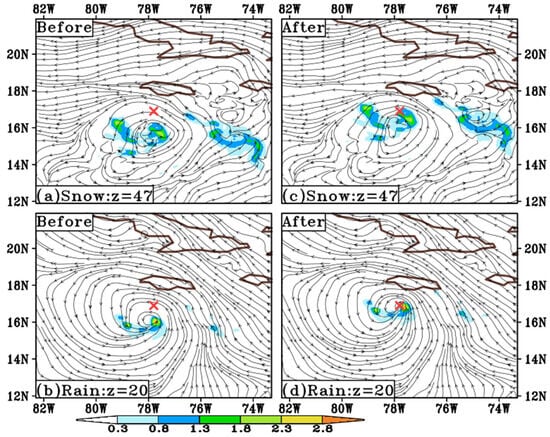
Figure 3.
(a) Snow mixing ratio (g kg−1) and streamline of GFS analysis (for the cycle of tropical depression 26L at 0600 UTC on 5 October 2020), which is interpolated into the 47th level of VI analysis domain (before the relocation procedure). The red X mark denotes the observed TC position. (b) As in (a) except for rain water mixing ratio (g kg−1) and streamline of GFS analysis, which is interpolated into the 20th level of VI analysis domain. (c) As in (a) except for the VI analysis after the relocation procedure. (d) As in (b) except for the VI analysis after the relocation procedure.
For the warm start, the cycle for hurricane Delta (26L 2020) at 1800 UTC on 6 October 2020 is shown as an example because the storm was at peak intensity with a maximum wind speed of 120 kt in the middle of the Caribbean Sea (Figure 4). In Figure 4a, the cloud ice associated with the cirrus cloud field exists within ~3 degrees in the GFS analysis. However, in the 6 h forecast results from the previous HAFS cycle, the model TC accompanies a broader cloud ice field, as observed for many other intense TCs (Figure 4b). Thus, the cloud ice pattern in Figure 4b appears more reasonable. This finding also justifies the selection of 6 degrees to relocate or cycle cloud variables; if the cloud were cycled or relocated in a smaller area (e.g., 3 degrees), the VI would miss the cloud ice information of the outer cirrus field of TCs. The cloud ice is close to the cirrus field, thus affecting the outgoing longwave radiation on the top of the cloud. This aspect could affect future DA if cloud radiance DA is used in HAFS; therefore, cloud ice must be handled carefully in VI. Figure 4c illustrates the final cloud ice field from the VI analysis. The GFS cloud ice variable within 6 degrees of the TC center is replaced by the 6 h HAFS forecast results from the previous cycle. The same cycling strategy is applied to low-level cloud water (Figure 5). In the GFS analysis, the eyewall convection of Delta is located to the east of the best track position (X mark in Figure 5a), but after the cycling of cloud variables, the eyewall convection moves to the correct position in the VI analysis (cf. Figure 5a,c). Interestingly, the 6 h HAFS forecast well reproduces the spiral rainband extending from the southern hemisphere of the TC to the Yucatan peninsula (Figure 5b).
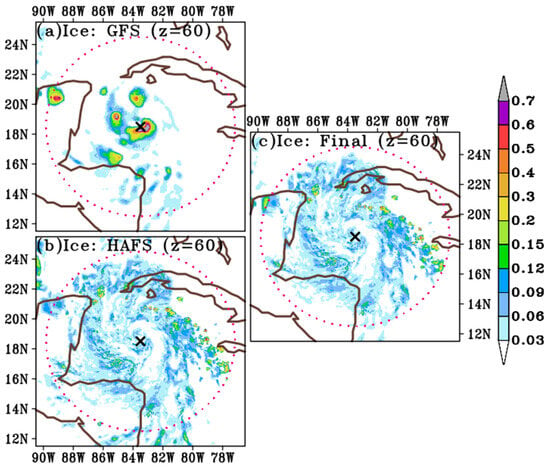
Figure 4.
(a) Cloud ice mixing ratio (g kg−1) of GFS analysis (for the cycle of Hurricane Delta 26L at 1800 UTC on 6 October 2020), which is interpolated into the 60th level of VI analysis domain. The black X mark and red dotted circle denote the observed TC position and 6 degrees radius, respectively. (b) As in (b) except for the cloud ice mixing ratio (g kg−1) of HAFS 6 h forecast from the previous cycle. (c) As in (b) except for the cloud ice mixing ratio (g kg−1) after the cycling procedure (i.e., merging HAFS cloud field into GFS analysis).
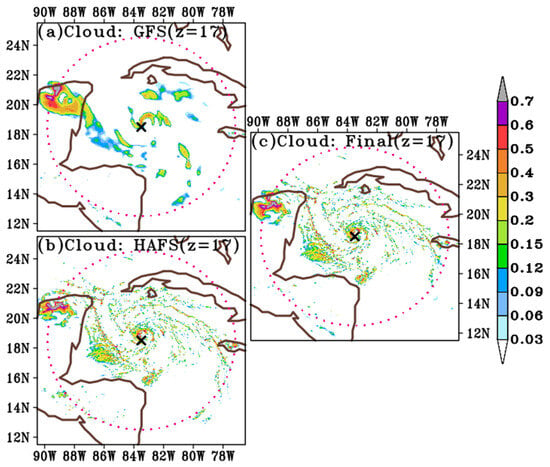
Figure 5.
(a) Cloud water mixing ratio (g kg−1) of GFS analysis (for the cycle of Hurricane Delta 26L at 1800 UTC on 6 October 2020), which is interpolated into the 17th level of VI analysis domain. The black X mark and red dotted circle denote the observed TC position and 6 degrees radius, respectively. (b) As in (b) except for the cloud water mixing ratio (g kg−1) of HAFS 6 h forecast from the previous cycle. (c) As in (b) except for the cloud water mixing ratio (g kg−1) after the cycling procedure (i.e., merging HAFS cloud field into GFS analysis).
Notably, in this new VI, vertical velocity in the model initial condition is relocated or cycled because this variable is non-zero at the model initial time. Figure 6 displays an example of vertical velocity improvement in the new VI for the cycle of the Western Pacific Typhoon Roke (2022) at 0600 UTC on 29 September 2022. According to the Joint Typhoon Warning Center, the intensity of Roke was 70 kt, and the minimum central pressure was 985 hPa, indicating a warm start cycle. In VI analysis from the old VI, only horizontal wind, pressure, temperature, and specific humidity are modified through relocation or a cycling process, whereas the vertical velocity simply comes from GFS analysis without any relocation or cycling process (Figure 6a). Figure 6a clearly illustrates that, although the surface pressure center is shifted from the GFS vortex center (green cross) to the best track position (black X), the updraft from GFS analysis, which was located to the northeast of the GFS vortex center, still exists in the wrong position. The output from the model initial time (HAFS model output files are generated in 3 h intervals in standard Gridded Binary (i.e., GRIB2) format, and the first output file contains the model result at 90 s, corresponding to the first model time step of HAFS-A. Herein, “the model output from the initial time” or ”model initial condition” indicates this first output file because the model output at 90 s (i.e., the first model time step) could be treated as the model initial time) reveals that the model TC has realistic vertical velocity in the core region (Figure 6b). Therefore, in the old VI system, although the vertical velocity from VI analysis is weird, the HAFS model generates its own vertical velocity field as soon as the model integration is initiated. In the new VI analysis, compared with the old VI analysis, the vertical velocity field is much more realistic, because it is cycled from the 6 h forecast result of the previous cycle (cf. Figure 6a,c). Because this realistic vertical velocity is ingested into the model, the vertical velocity of the model initial time resembles that in the VI analysis (Figure 6d). The impact of vertical velocity relocation and cycling on the HAFS intensity forecast is discussed in Section 5.
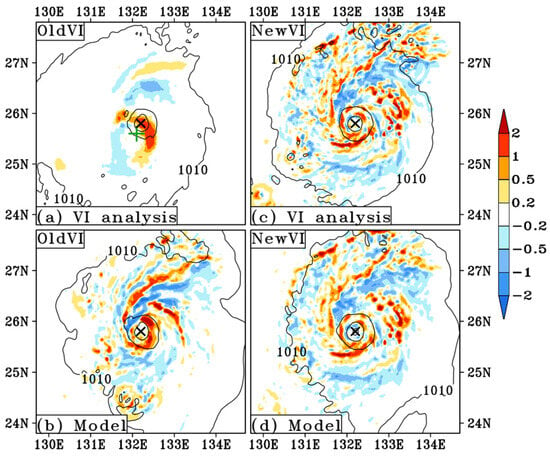
Figure 6.
(a) Vertical velocity near 800 hPa level (shaded: m s−1) and surface pressure (contoured at 10 hPa intervals) of VI analysis from the old VI for the cycle of Typhoon Roke at 0600 UTC on 29 September 2022. (b) As in (a) except for the model initial condition output from the old VI. (c) As in (a) except for the VI analysis from the new VI. (d) As in (a) except for the model initial condition output from the new VI. The green cross in (a) and black X indicate the GFS TC vortex and observed TC locations, respectively.
3. Effects of the Updated VI on the HAFS Forecast
3.1. Experimental Configuration
The new VI with a vertical velocity and cloud relocation/cycling system was used for HAFSv1.1A real-time experiments in 2023. HAFSv1.1 is more advanced than the operational HAFSv1 and was tested to prepare the operational HAFSv2 for 2024. This article focuses on HAFSv1.1A, which is operated by NCEP. Differences between HAFSv1.1A and operational HAFSv1A are summarized in Table 1. One major difference between these configurations is in VI because (i) vertical velocity and cloud relocation/cycling are introduced, and (ii) the warm cycling threshold is decreased to 40 kt because cycling of the HAFS cloud field could provide a finer cloud structure than the GFS cloud field; this advantage is demonstrated in the following section.

Table 1.
Main feature of HAFSv1A and HAFSv1.1A.
As shown in Table 2, three experiments are conducted to study how the cloud and vertical velocity fields of the HAFS initial condition affect the forecast. The control experiment is HFXA, which is identical to the HAFSv1.1A real-time experiment and uses the new VI, whereas the HFNN experiment does not use vertical velocity and cloud relocation/cycling capabilities to examine the effects of the new VI. The HFNN experiment uses the non-relocated cloud and vertical velocity fields from the GFS analysis for model initialization regardless of warm or cold start, which is identical to the old VI. Although the primary aim of this new VI is improving the cloud field in the model initial condition, studying the influence of vertical velocity on the forecast is worthwhile because how the vertical velocity affects the HAFS forecast had not been examined previously. Therefore, the HFNW experiment, which only relocates or cycles the cloud field, is conducted to analyze the influence of vertical velocity on the HAFS forecast. A total of 13 (2021 TC cases (Sam, Ida, Henri, Grace, Elsa), 2022 TC cases (Ian, Fiona, Earl, Daniel), and 2023 TC cases (Franklin, Lee, Margot, Nigel)) North Atlantic hurricanes between 2021 and 2023 are selected for these VI experiments. These experiments include long-lived hurricanes to gather the number of cycles for the longer forecast lead time (i.e., between days 3 and 5).

Table 2.
Configuration for three experiments based on HAFSv1.1A.
3.2. Overall Statistics from Three VI Experiments
Figure 7a,b summarize the intensity forecast results from the three VI experiments. The HFXA experiment (i.e., HAFSv1.1) yields more encouraging results than the HFNN experiment, which shows that the relocation/cycling of cloud and vertical velocity does improve the overall intensity forecast of HAFS. Unexpectedly, the HFNW experiment, which only relocates or cycles cloud variables, yields somewhat poorer results than the HFNN experiment, which has no relocation/cycling capability for cloud and vertical velocity. This compelling result suggests the importance of vertical velocity in the HAFS intensity forecast. Further details are discussed in Section 5. The three VI experiments exhibit no difference in wind bias; thus, improving the cloud and vertical velocity in the model initial condition does not affect the wind bias (Figure 7c). Storm size and track error are also not significantly influenced by the new VI, as expected (Figure 7d,e). Because the cloud and vertical velocity fields in the storm region are only modified by this new VI, this change does not affect the large-scale flow that determines the storm motion. Figure 8 shows the performance of experiments for several examples of hurricane cases. Generally, the intensity error of the HFXA experiment is better than or similar to that of the HFNN experiment, except for Hurricane Ida. In addition, consistent with the findings in Figure 7, the HFNW experiment has a tendency toward greater intensity error than the HFXA or HFNN experiments.
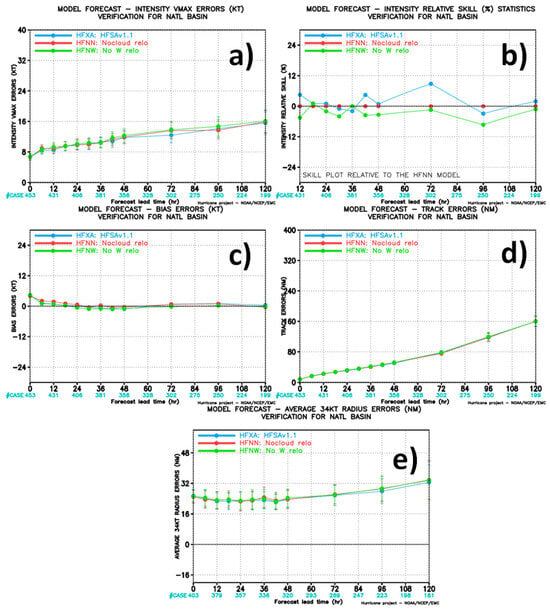
Figure 7.
Statistics for (a) the maximum wind speed intensity error (unit: kt), (b) intensity relative skill with respect to the HFNN experiment (unit: %), (c) the wind bias (unit: kt), (d) the track error (unit: nm), and (e) 34 kt wind radius error (unit: nm).
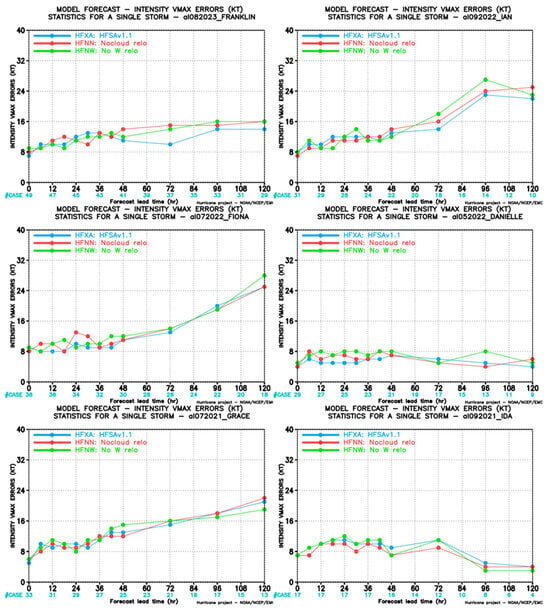
Figure 8.
The maximum wind speed intensity error (unit: kt) for Franklin, Ian, Fiona, Danielle, Grace, and Ida.
4. Detailed Structure Analysis
4.1. Model Initial Cloud Structure Improvements
Figure 9 illustrates how the new VI improves the model initial condition for the cold start case of tropical storm Ida (2021 09L). According to the TCVitals, at 0000 UTC on 27 August 2021, Ida was a weak tropical storm with 35 kt intensity; thus, this cycle is a cold start in which the cloud is relocated in the GFS analysis. A high composite radar reflectivity region greater 15 dBZ covers the 850 hPa vortex center in the new VI (Figure 9d). This consistency between the radar reflectivity and the vortex circulation center is not found in the old VI because the relative locations of radar reflectivity and the vortex center in the old VI show that the vortex is only relocated, whereas the cloud field is not (cf. Figure 9a,d). The high radar reflectivity is mainly linked to precipitation particles like snow and rainwater (see Figure 9b,c,e,f). It is important to note that the distribution of 600 hPa cloud water and 700 hPa rainwater indicates that the cloud hydrometeors are not located near the 850 hPa vortex in the old VI, which seems unreasonable based on the patterns shown in Figure 9c,f.
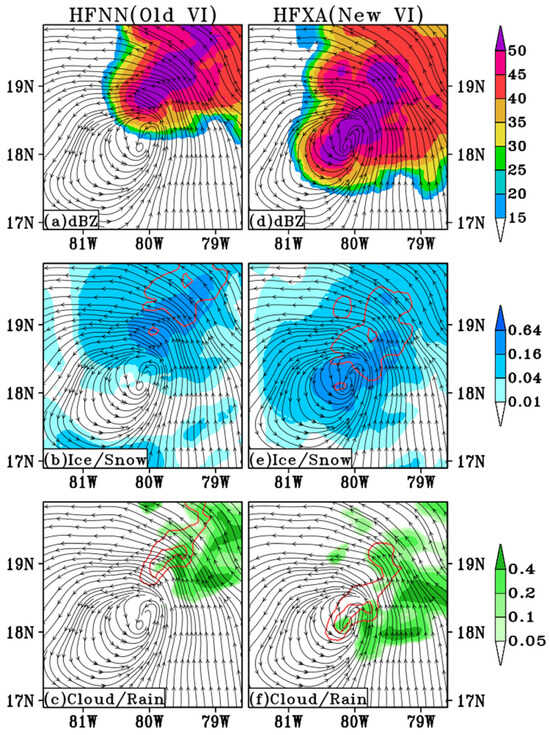
Figure 9.
850 hPa streamline of the HFNN experiment model initial condition for the cycle of Tropical Storm Ida 09L at 0000 UTC on 27 August 2021 superimpose with (a) composite radar reflectivity (shaded: dBZ), (b) 300 hPa cloud ice mixing ratio (shaded: g kg−1), 450 hPa snow mixing ratio contoured at 1 g kg−1 intervals, (c) 600 hPa cloud water mixing ratio (shaded: g kg−1), 750 hPa rain water mixing ratio contoured at 1 g kg−1 intervals. (d–f) As in (a–c) except for the HFXA experiment.
Because 40 kt is used for the warm cycling threshold, and stronger TCs have more organized convection, the effects of cloud and vertical velocity cycling would be much more significant in stronger storms. The cycle of Hurricane Lee (2023 13L) at 0600 UTC on 8 September 2023 is shown as an example of a warm start case (Figure 10). At that time, Hurricane Lee had intensified to a powerful category 5 hurricane with a wind speed of 145 knots while moving west–northwestward. Compared to the overall composite radar reflectivity pattern in Figure 10a, Figure 10d reveals that the eye of the hurricane and the low-level vortex center are well aligned. And the hurricane’s eye structure is very clear in the new VI, thus indicating that this new VI system corrects the cloud field position in the model initial condition (Figure 10d). In Figure 10b,c,e,f, the cloud condensation fields, such as 450 hPa snow and 700 hPa rainwater, reveal a more solid eyewall structure in the new VI. Moreover, the 600 hPa cloud water field of the new VI exhibits a more organized eyewall structure than that of the old VI.
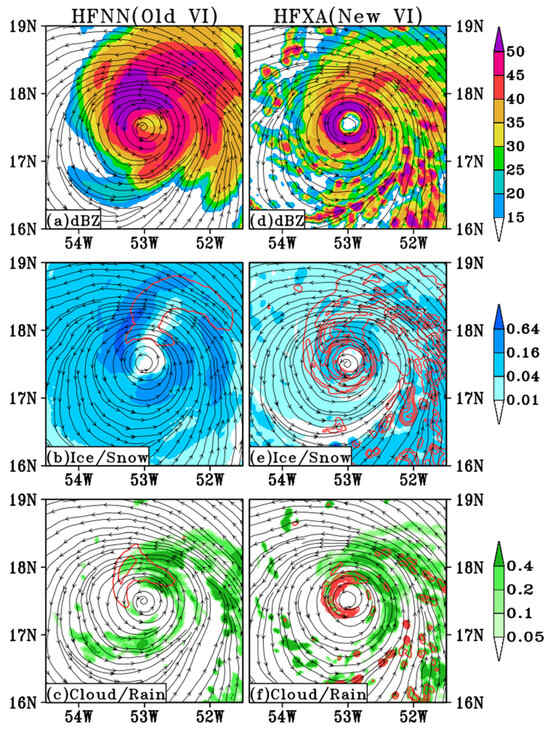
Figure 10.
850 hPa streamline of the HFNN experiment model initial condition for the cycle of Hurricane Lee 13L at 0600 UTC on 8 September 2023 superimpose with (a) composite radar reflectivity (shaded: dBZ), (b) 300 hPa cloud ice mixing ratio (shaded: g kg−1), 450 hPa snow mixing ratio contoured at 1 g kg−1 intervals, (c) 600 hPa cloud water mixing ratio (shaded: g kg−1), 750 hPa rain water mixing ratio contoured at 1 g kg−1 intervals. (d–f) As in (a–c) except for the HFXA experiment.
The results of these cold and warm start cases demonstrate that the new VI improves the overall cloud field of the model initial condition by correcting the cloud field location and providing a more realistic cloud structure.
4.2. Model Initial Condition Validation with Respect to Observations
The radar reflectivity of the model initial condition is validated against the 2 km resolution tail Doppler radar (TDR) data of the Tropical Cyclone Radar Archive of Doppler Analyses with Recentering (TC-RADAR) [29], because TDR data have proven very useful in validating the model simulated storm structures [30,31,32,33,34]. Figure 11 shows the 2 km level radar reflectivity from the TDR, HFXA, and HFNN experiments for several major hurricane cases. According to the NHC report [35], Hurricane Ian underwent an eyewall replacement cycle when it passed near Cuba before 0000 UTC on 28 September, and this feature is shown in the TDR data (Figure 11a). Surprisingly, the cycle of the new VI experiment initialized at 1800 UTC on 27 September 2022 captures this double eyewall structure when the observed maximum wind speed was 105 kt (Figure 11d). Although the radius of outer eyewall convection in Figure 11d is somewhat larger than that in the observation (Figure 11a), the inner eyewall and the moat to the south and east of the hurricane center are remarkably well reproduced in the initial condition of the HFXA experiment. Because the HFNN experiment is initialized with non-relocated cloud fields of the GFS analysis, it produces a very unrealistic prominent eyewall feature (Figure 11g). At 0000 UTC on 27 September 2021, Hurricane Sam had an intensity of 130 kt, and the overall structure of the double eyewall pattern in TDR data resembles the HAFS initial condition (cf. Figure 11b,e). The chunk of inner eyewall convection to the west of the hurricane center and the moat in the southeastern quadrant of the core region inside the outer eyewall are visible in the initial condition in the HFXA experiment. The observed pinhole eyewall feature is not captured in the HFXA experiment, possibly because of the model resolution. The 1.8 km resolution of the moving nest appears to be insufficient to resolve a very small pinhole in the real observations. Nonetheless, the initial convective structure of the HFXA experiment in Figure 11e is much better than that of the HFNN experiment in Figure 11h, which does not have an eye structure. The HFXA experiment also reproduces the secondary eyewall structure in the initial condition of major hurricane Fiona when the maximum wind speed of this storm was 115 kt at 0000 UTC on 22 September 2022 (Figure 11c,f). Figure 11c,f show that the radius of the outer eyewall convection and the extent of the southern moat are larger than those in the observations (i.e., in TDR data), thus suggesting that cloud fields extracted from the previous forecast cycle sometimes might not capture all observed cloud features. Despite its limitations, Figure 11f reveals much more realistic results than Figure 11i, because the eyewall with incorrect size is located in a completely incorrect position in the HFNN experiment. Therefore, Figure 11 demonstrates the encouraging results of the relocation/cycling of cloud and vertical velocity capability that can produce a realistic convective structure for major hurricanes in the model initial condition.
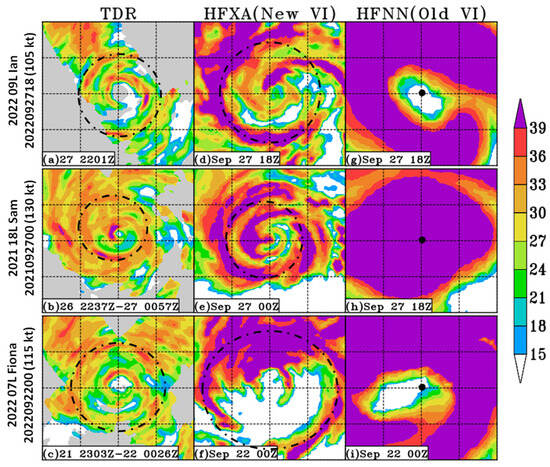
Figure 11.
The 2 km level radar reflectivity (shaded: dBZ) from (a) TDR data at 2200 UTC on 27 September 2022 (Ian case), (b) TDR data averaged from 2237 UTC 26 to 0057 UTC on 27 September 2021 (Sam case), (c) TDR data averaged from 2203 UTC 21 to 0026 UTC on 22 September 2022 (Fiona case), the HFXA experiment initial condition for (d) the cycle 1800 UTC on 27 September 2022, (e) the cycle 0000 UTC on 27 September 2021, (f) the cycle 0000 UTC on 22 September 2022, and the HFNN experiment initial condition for (g) the cycle 1800 UTC on 27 September 2022, (h) the cycle 0000 UTC on 27 September 2021, (i) the cycle 0000 UTC on 22 September 2022. Domain coverage is 200 by 200 km with respect to the hurricane center, where the size of each box is 50 by 50 km. In (a–c), observed storm intensity is denoted in the left of each panel, and gray shading is the region where TDR data values do not exist. Dotted lines indicate the outer eyewall convection. The hurricane center is denoted as black circles in (g–i). TDR data are available at https://www.aoml.noaa.gov/ftp/pub/hrd/data/radar/level3/ (accessed on 7 July 2024).
Figure 12 shows the same radar reflectivity and the model initial condition for the weak cycles when the storm intensity does not reach the hurricane stage (i.e., maximum wind speed less than 65 kt). This figure validates whether the new VI can provide a better convection structure for weak systems at the model initial time. Grace (2021 07L) was a weak tropical storm with an intensity of 45 kt at 1200 UTC on 17 August 2021. Although the environment was favorable with vertical wind shear of ~10 kt, the storm’s convective structure was poorly organized (Figure 12a). As indicated by the three solid lines in Figure 12a, two major convective lines are associated with storm Grace: a spiral-shaped convective line wrapping the storm center from the northern semicircle to the southeastern quadrant and another zonally elongated convective line in the southwestern quadrant. The HFXA experiment produces these convective lines in the model initial condition, whereas the HFNN experiment does not, because the cloud field in the GFS analysis, which is used for the initial condition of the HFNN experiment, is too lopsided to the northeast (cf. Figure 12d,g). Furthermore, the convection region in the southwestern quadrant is completely missed in the HFNN experiment. For the cycle of Henri (2021 08L) at 0000 UTC on 21 August 2021, both the HFXA and HFNN experiments capture the sheared structure of this storm (Figure 12b,e,h). The intensity of tropical storm Henri was 60 kt, with the sheared convective structure attributed to a moderate northwesterly vertical wind shear (14.3 kt). However, the initial condition of HFXA has a finer convective structure compared to the HFNN experiment, as the cloud variables are cycled from the HAFS forecast. Figure 12c,f,i illustrate the cycle of Earl (2022 06L) at 0000 UTC on 6 September 2022, when this storm was a 60 kt tropical storm, experiencing very strong southwesterly vertical wind shear with ~25 kt magnitude. Although TDR data do not cover most of the southwestern quadrant of Earl, the overall distribution of radar reflectivity in Figure 12c suggests that the convection is most active in the northeastern quadrant, whereas it is not that active in the southwestern quadrant. For the initial condition of this cycle, the HFXA experiment seems to generate better results than the HFNN experiment (cf. Figure 12f,i). Although both experiments capture the broad convection region in the northeastern quadrant, the meridionally oriented convective line to the east of the storm center does not extend far enough south in the HFNN experiment (Figure 12i). Moreover, the strong convection in the southwestern quadrant of the HFNN experiment appears very unrealistic, because the convection in this region, which corresponds to the upshear side, should be suppressed by the influence of strong southwesterly vertical wind shear. The HFXA experiment clearly shows that the convection in the southwestern quadrant is properly suppressed. Therefore, Figure 12 supports that the new VI provides a better and more realistic cloud field than the old VI for weak or shear storm cases.
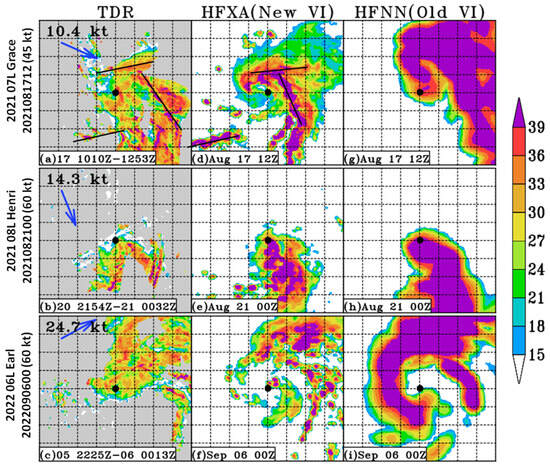
Figure 12.
The 2 km level radar reflectivity (shaded: dBZ) from (a) TDR data averaged from 1010 UTC to 1253 UTC on 17 August 2021 (Grace case), (b) TDR data averaged from 2154 UTC 20 to 0032 UTC on 21 August 2021 (Henri case), (c) TDR data averaged from 2225 UTC 05 to 0013 UTC on 6 September 2022 (Earl case), the HFXA experiment initial condition for (d) the cycle 1200 UTC on 17 August 2021, (e) the cycle 0000 UTC on 21 August 2021, (f) the cycle 0000 UTC on 6 September 2022, and the HFNN experiment initial condition for (g) the cycle 1200 UTC on 17 August 2021, (h) the cycle 0000 UTC on 21 August 2021, (i) the cycle 0000 UTC on 6 September 2022. Domain coverage is 400 by 400 km with respect to the hurricane center, where the size of each box is 50 by 50 km. The hurricane center is denoted as black circles. In (a–c), observed storm intensity is denoted in the left of each panel, and gray shading is the region where TDR data values do not exist. Vertical wind shear intensity (unit: kt) and direction (blue arrow) calculated from GFS analysis is shown in (a–c). TDR data are available at https://www.aoml.noaa.gov/ftp/pub/hrd/data/radar/level3/ (accessed on 7 July 2024).
5. Important Effects of Vertical Velocity on the Intensity Forecast
As discussed in Section 3, the HFNW experiment, which applies relocating or cycling to only the cloud field without vertical velocity, has the lowest intensity forecast skill among the three experiments. Therefore, this section describes a brief analysis of possible reasons for the intensity forecast degradation in the HFNW experiment. The cycle of Danielle (2022 05L) at 0000 UTC on 4 September 2022, and the cycle of Franklin (2023 08L) at 0000 UTC on 25 August 2023, are chosen for analyses because the intensity forecast of the HFNW experiment is overall worse than that of the HFXA experiment for these two storm cases (Figure 8).
Figure 13a clearly shows that, unlike the HFXA experiment, which successfully predicts hurricane Danielle with an 80 kt intensity peak after 24 h, the HFNW experiment fails to capture the intensification of Hurricane Danielle during the first 24 h period. The vertical wind shear in these two experiments does not exhibit a noticeable difference because the storm tracks are similar in these experiments (Figure 13a,b). Similar tracks strongly indicate that the two storms in these experiments are under similar environmental conditions; therefore, the environment is not the main reason for the intensity forecast degradation in the HFNW experiment. Instead, the initial conditions of these two experiments show notable differences for the cycle of Danielle at 0000 UTC on 4 September 2022 (Figure 13c–f). The 2 km level radar reflectivity and updraft are more organized within a 100 km radius of the hurricane center in the HFXA experiment than the HFNW experiment, and strong convection and updraft exist primarily more than 100 km west of the hurricane center in the HFNW experiment (cf. Figure 13c,d). The azimuthally averaged radar reflectivity and updraft also illustrate that the storm is better organized in the initial condition of the HFXA experiment, which has a deeper updraft region along the eyewall of the hurricane (cf. Figure 13e,f). Because the hurricanes appear to be exposed to similar environmental conditions in these experiments, a different initial vortex may cause varied forecast results in the hurricanes experiments. The evolution of 2 km level radar reflectivity and updraft shows that the HFXA experiment already maintains a well-defined updraft region, where the vertical velocity is greater 0.2 m s−1, after the forecast is initiated (Figure 13g). However, the hurricane in the HFNW experiment fails to develop the updraft along in the eyewall during the first 60 h forecast period (Figure 13h). This different evolution of storm structure suggests that the initial vortex structure might explain why the HFXA experiment does not predict the intensity well for this cycle.
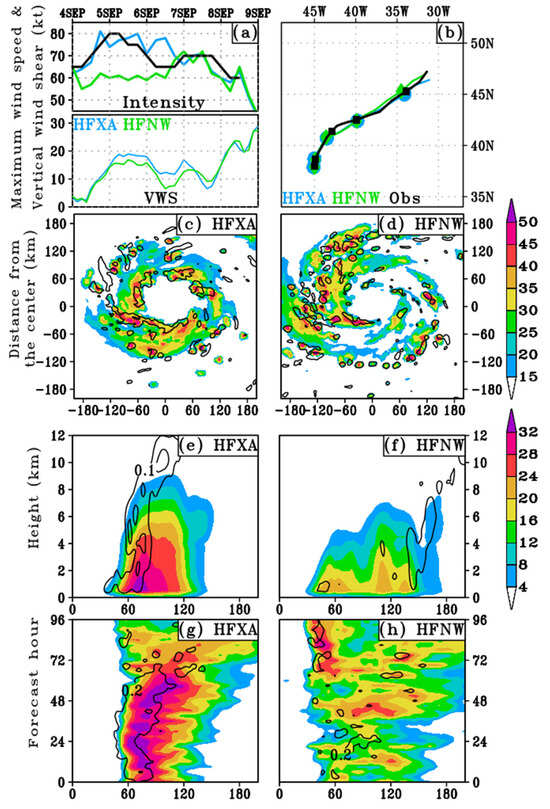
Figure 13.
(a) Time series of forecasted storm intensity and vertical wind shear from HFXA (blue) and HFNW (green) experiments for the cycle of Danielle (2022 05L) at 0000 UTC on 4 September 2022. Observed storm intensity is denoted as black line. (b) Storm tracks from HFXA (blue), HFNW (green) experiments, and observation (black). Storm position at every 24 h is marked. (c) 2 km radar reflectivity (shaded: dBZ) and 2 km vertical velocity contoured at 0.3 m s−1 intervals for the model initial condition of the HFXA experiment. (d) As in (c) but for the HFNW experiment. (e) Azimuthally averaged radar reflectivity (shaded: dBZ) and vertical velocity contoured at 0.1 and 0.2 m s−1 for the model initial condition of the HFXA experiment. Horizontal axis is the distance (km) from the TC center. (f) As in (e) but for the HFNW experiment. (g) Time series of azimuthally averaged radar reflectivity (shaded: dBZ) and vertical velocity contoured at 0.2 m s−1 intervals at 2 km level of the HFXA experiment. Horizontal axis is the distance (km) from the TC center. (g) As in (h) but for the HFNW experiment.
For the cycle of Franklin at 0000 UTC on 25 August 2023, the two experiments produce noticeably different intensity forecasts: the HFNW completely fails to predict the intensification of this hurricane after 0000 UTC on 27 August (i.e., after the 48 h forecast lead time) (Figure 14a). Unlike the cycle of Danielle at 0000 UTC on 4 September 2022 (Figure 13), the different environmental conditions between the two experiments play a role in the intensity forecast, because Figure 14a depicts that the strong vertical wind shear exceeding 20 kt during the first 24 h is not reduced in the HFNW experiment after 0000 UTC on 27 August. In addition, the tracks of these two experiments exhibit markedly different patterns during the first 72-h forecast, when the observed storm showed erratic movement (Figure 14b). The official NHC report for Franklin [36] stated that the upper-level trough, which was located to the north of the storm on 25 August, caused erratic movement of the storm, as shown in Figure 14b. Regarding the initial vortex structure, in the HFXA experiment, the storm vortex has slightly stronger convection to the south and stronger low-level winds to the east of the center compared to the HFNW experiment, although the differences are not large (cf. Figure 14c–f). For this cycle of Franklin, because the different vortex in the initial condition interacts with the environment (e.g., upper-level trough), the two experiments predict different tracks. Thus, a different initial vortex structure and its interaction with the environment likely cause the difference in the forecast of Franklin. As the storm moves differently in the two experiments, the storm in the HFXA experiment is influenced by more favorable conditions for development, such as low vertical wind shear, compared to the HFNW experiment.
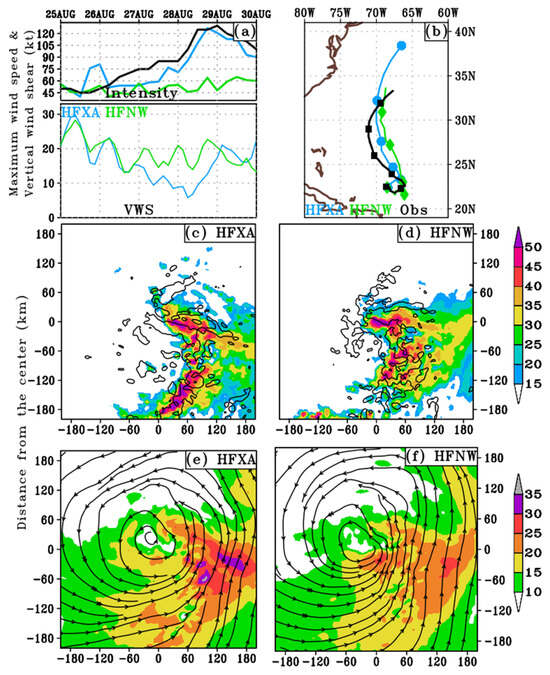
Figure 14.
(a–d) As in Figure 13 but for the cycle of Franklin at 0000 UTC on 25 August 2023. (e) As in (c) but for 2 km wind speed (shade: m s−1) and streamline for the model initial condition of the HFXA experiment. (f) As in (e) but for the HFNW experiment.
The example cases of Danielle and Franklin suggest that the reason for intensity forecast degradation in the HFNW experiment might differ from case to case. For Danielle, excluding vertical velocity relocation/cycling in the VI creates a less organized initial vortex, degrading the intensity forecast. In contrast, for Franklin, the forecasted track is altered, and it worsens the intensity forecast. Although the effects of vertical velocity relocation/cycling on the intensity forecast may vary for different storm cases, the overall statistics (Figure 8) and case analyses (Figure 13 and Figure 14) imply that cycling or relocating both cloud and vertical velocity might be beneficial to the forecast. A plausible reason may be that, because vertical velocity and cloud fields are closely associated, relocating or cycling them simultaneously would produce better forecast. However, a detailed study about the impact of vertical velocity relocation/cycling on the HAFS intensity forecast is beyond the scope of this paper’s topic. Thus, additional research may be needed to study how the vertical velocity field in the HAFS initial conditions affects the forecast.
6. Summary
An innovative cloud and vertical velocity relocation/cycling system has been developed and integrated into the HAFS-VI system. Because the old VI, which is used in the operational HAFS version 1, is inherited from HWRF, it needs to be updated for HAFS, which is based on the Unified Forecast System model. One major difference between HWRF and HAFS is the presence of cloud hydrometeors and vertical velocity in the model initial condition. Due to the absence of cloud and vertical velocity variables in HWRF initial condition, the old VI does not improve or modify these two variables. However, the cloud and vertical velocity fields are included in the initial condition of HAFS; therefore, in the old VI, these two variables are not corrected, whereas other variables are. Consequently, the old VI causes an inconsistency between cloud and other fields of hurricanes, such as wind or pressure.
The new VI can relocate or cycle both cloud hydrometeors and vertical velocity, thus providing a more realistic initial cloud field. For the cold start, it simply relocates the cloud and vertical velocity fields of GFS, whereas for the warm start, the cloud and vertical velocity associated with a hurricane in GFS analysis are replaced by the fields extracted from the 6 h HAFS forecast of the previous cycle. This new HAFS-VI has been tested for the 2023 HAFS-A real-time experiment configuration (i.e., HFXA), and two additional sensitivity experiments are conducted to examine the effects of the new VI. The first sensitivity experiment (i.e., HFNN) simply turns off the relocation or cycling capability for both cloud and vertical velocity using the old VI. The second experiment (i.e., HFNW) only relocates or cycles cloud hydrometeors without correcting the vertical velocity field. The forecast results of the HFXA experiment, using the new VI, show some improvement in the intensity forecast over the HFNN experiment without noticeable effects on the storm size or track forecast. Comparison between the HFXA and HFNN experiments clearly shows that the new VI generates a more realistic cloud field in the correct position in the model initial condition. The convection structure of the model initial condition from relocating/cycling cloud hydrometeors and vertical velocity capability appears encouraging because it captures the double eyewall structure of intense hurricanes or the sheared structure of weak storms observed in TDR data. As shown in Figure 11, for some cases, the new VI is unable to capture all observed TC convective structures, showing the limitation of this new system. However, such inaccuracies are also likely related in part to other model components (e.g., physics or dynamics), and therefore, as indicated by [14], as the model system gets better, the initialized convective structure should improve.
If the vertical velocity is not relocated or cycled in VI, the vertical velocity field in VI analysis is inconsistent with other fields, and the model generates its own vertical velocity as soon as model integration is initiated. Therefore, relocating/cycling vertical velocity allows the model to use the corrected vertical velocity for integration. The results of the HFNW experiment indicate that the overall intensity forecast degradation when the relocating/cycling process is applied to cloud hydrometeors but not to the vertical velocity. The impact of relocating or cycling vertical velocity on the forecast differs depending on the specific case or cycle. In the case analyses in this study, for Danielle, the relocating/cycling vertical velocity generates a stronger initial TC vortex, thus improving the intensity forecast, whereas for Franklin, adjusting the vertical velocity in the VI improves the intensity forecast by changing the TC track. Although further study is needed on the influence of vertical velocity on the intensity forecast, this initial result strongly suggests that relocating/cycling both cloud hydrometeors and vertical velocity in the VI would be beneficial. One possible explanation is that vertical velocity and cloud fields are closely linked. Cloud and convection tend to occur where updraft exists in the core region of a TC. Therefore, relocating or cycling both fields in the VI could have a positive impact on the intensity forecast.
The overall results demonstrate that the new VI improves both the forecast and the cloud fields in the model initial condition. However, one thing to keep in mind is that the major purpose of this new VI is to provide a better background for DA rather than improving the intensity forecast itself. Therefore, as long as the cloud and vertical velocity cycling/relocation do not degrade the forecast, the new VI can be used for HAFS. If the cloud field is corrected in the model initial condition, further DA procedures such as radar reflectivity or cloud radiance assimilation could be performed to improve the forecast. Another strength of this new VI method is that it can be used in the operational hurricane model. Ref. [23] were able to conduct all-sky radiance assimilation in the HWRF model by adding cloud variables cycling capability. However, they had to modify the operational HWRF and Gridpoint Statistical Interpolation analysis system codes [37] to achieve their goal. The cloud relocation–cycling system in the new VI method helps the model developers or researcher to perform cloud-related data assimilation in the operational hurricane model.
Author Contributions
Conceptualization, J.S.; Methodology, J.S., Q.L. and Z.Z.; Software, J.S., Y.W., Q.L. and B.L.; Validation, J.S., B.L. and Z.Z.; Formal Analysis, J.S.; Investigation, J.S.; Resources, A.M. and V.T.; Data Curation, J.S.; Writing—Original Draft Preparation, J.S.; Writing—Review and Editing, J.S., B.L. and Y.W.; Visualization, J.S.; Supervision, A.M. and V.T.; Project Administration and Funding Acquisition, no external funding. All authors have read and agreed to the published version of the manuscript.
Funding
This research received no external funding.
Institutional Review Board Statement
Not applicable.
Informed Consent Statement
Not applicable.
Data Availability Statement
HAFS data generated from the experiment results of this research is archived in the restricted NOAA computer system where the access is not available to the public. The access request for the HAFS data should be directed to the corresponding author. Tropical Cyclone Radar Archive of Doppler Analyses with Recentering (TC-RADAR) of [29], which is used for Figure 11 and Figure 12, is available at https://www.aoml.noaa.gov/ftp/pub/hrd/data/radar/level3/ (accessed on 7 July 2024).
Acknowledgments
The VI experiments were conducted on WCOSS2 and Hera/NOAA RDHPCs. The NOAA HFIP project supports this research, and the authors greatly appreciate this support. The authors thank Xu Lu, Hananeh Jafary, and Mary Hart at EMC for their internal review, because it improved the manuscript significantly. Thanks is also extended to William Miller at ESSIC/NOAA/STAR who polished the part of this manuscript.
Conflicts of Interest
Authors JungHoon Shin, Bin Liu and Yonghui Weng were employed by the company Lynker. The remaining authors declare that the research was conducted in the absence of any commercial or financial relationships that could be construed as a potential conflict of interest.
Appendix A. Relocating–Cycling Cloud and Vertical Velocity at Constant Pressure Level
As described in [14], HAFS model variables (horizontal wind, temperature, and humidity) defined in the 81 hybrid-pressure levels are interpolated into 121 constant pressure levels, as defined by VI codes, when a TC vortex is extracted and modified during the VI procedure. After the VI procedure is completed, all model variables that exist in the 121 constant pressure levels are again interpolated into the HAFS model hybrid-pressure level. The same strategy is applied to new variables (cloud hydrometeors and vertical velocity) in the new VI, so that these new variables can maintain the same pressure level before and after they are moved to the target grid in the VI procedure (Figure A1a). For example, the cloud water variable, which is located near the 900 hPa level, maintains the 900 hPa level after it is relocated to the new grid point. Before the onset of relocation or cycling, cloud hydrometeors and vertical velocity are interpolated into 121 constant pressure levels, as illustrated in the left panel of Figure A1b. These variables are moved to the target grid at a certain pressure level after relocation or cycling. Subsequently, they are interpolated back to the model hybrid-pressure levels of the target grid.
Figure A2 illustrates the example of the cold start case of Delta 2020 26L for the cycle at 0600 UTC on 5 October 2020. In this relocation process, the TC vortex and associated cloud hydrometeors move north–northeastward (Figure A2a,b). The vertical cross section along 77° W shows how the cloud water moves along the constant pressure level (Figure A2c,d). In Figure A2c,d, cloud chunks “A” and “B” that exist where the isobar surfaces are flat simply move to the right (i.e., northward) after the relocation process. However, during the VI procedure, cloud chunks “C” and “D” move to 18.2° N and 20° N, respectively, where the isobar surfaces are bent downward (cf. Figure A2c,d). Because cloud variables maintain the same pressure level during the VI procedure, cloud chunks “C” and “D” are relocated along these bent isobar surfaces (Figure A2d). Because the cloud hydrometeors move north–northeastward in the example case in Figure A2, lateral inflow and outflow of cloud water to this meridionally oriented vertical cross section occur. Consequently, the cloud water mixing ratio in Figure A2c,d slightly differs before and after VI.
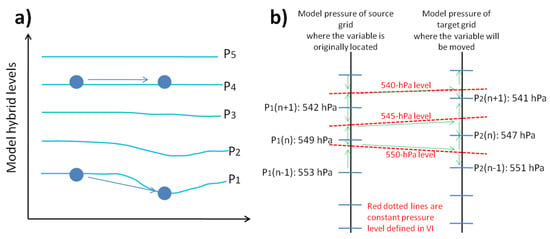
Figure A1.
Schematic diagram that describes (a) how the variables (cloud hydrometeors and vertical velocity which are marked as dark blue circle) move along the isobaric surface of model hybrid levels during the relocation or cycling procedure, where the model isobaric surfaces are denoted as light blue lines, and (b) the variables defined in the model isobaric surfaces (P1) in the source grid point (left) are interpolated into the constant pressure levels (red line) defined in VI and are re-interpolated into the model isobaric surfaces (P2) in the target grid point (right) after those variables were moved into the target grid point.
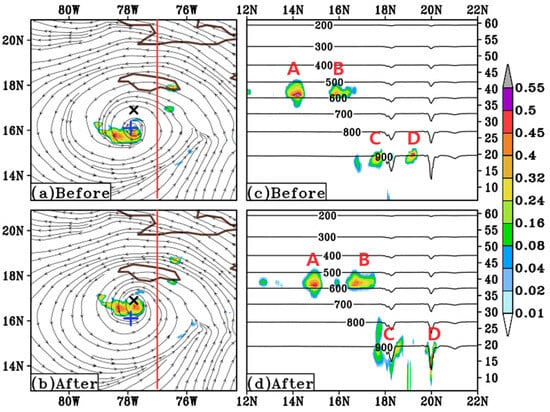
Figure A2.
(a) Cloud water mixing ratio (g kg−1) and streamline of GFS analysis (for the cycle of tropical depression 26L at 0600 UTC on 5 October 2020) which is interpolated into the 32th level of VI analysis domain (before the relocation procedure). The black X and blue cross marks denote the observed TC position and GFS vortex position, respectively. (b) As in (a) but for the VI analysis after the relocation procedure. (c) Vertical cross section of the model isobaric surfaces (contoured at 100 hPa intervals) and cloud water mixing ratio (g kg−1) along the 77° W, which is denoted as red line in (a), of VI analysis domain. Vertical axis indicates the number of VI analysis domain level. (d) As in (c) but for the VI analysis after the relocation procedure.
References
- Aksoy, A.; Lorsolo, S.; Vukicevic, T.; Sellwood, K.J.; Aberson, S.D.; Zhang, F. The HWRF Hurricane Ensemble Data Assimilation System (HEDAS) for high-resolution data: The impact of airborne Doppler radar observations in an OSSE. Mon. Weather Rev. 2012, 140, 1843–1862. [Google Scholar] [CrossRef]
- Weng, Y.; Zhang, F. Assimilating airborne Doppler radar observations with an Ensemble Kalman Filter for convection-permitting hurricane initialization and prediction: Katrina (2005). Mon. Weather Rev. 2012, 140, 841–859. [Google Scholar] [CrossRef]
- Sippel, J.A.; Zhang, F.; Weng, Y.; Tian, L.; Heymsfield, G.M.; Braun, S.A. Ensemble Kalman Filter assimilation of HIWRAP observations of Hurricane Karl (2010) from the unmanned Global Hawk aircraft. Mon. Weather Rev. 2014, 142, 4559–4580. [Google Scholar] [CrossRef][Green Version]
- Lu, X.; Wang, X.; Tong, M.; Tallapragada, V. GSI-based, continuously cycled, dual-resolution hybrid ensemble–variational data assimilation system for HWRF: System description and experiments with Edouard (2014). Mon. Weather Rev. 2017, 145, 4877–4898. [Google Scholar] [CrossRef]
- Li, J.; Li, J.; Velden, C.; Wang, P.; Schmit, T.J.; Sippel, J. Impact of rapid-scan-based dynamical information from GOES-16 on HWRF hurricane forecasts. J. Geophys. Res. Atmos. 2020, 125, e2019JD031647. [Google Scholar] [CrossRef]
- Kwon, I.-H.; Cheong, H.-B. Tropical cyclone initialization with a spherical high-order filter and an idealized three-dimensional bogus vortex. Mon. Weather Rev. 2010, 138, 1344–1367. [Google Scholar] [CrossRef]
- Kwon, I.-H.; Cheong, H.-B.; Kang, H.-G.; Han, H.-J.; Park, J.-R. Structure change of Typhoon Nari (2007) in the weakening stage. Asia-Pac. J. Atmos. Sci. 2010, 46, 327–340. [Google Scholar] [CrossRef]
- Doyle, J.D.; Hodur, R.M.; Chen, S.; Jin, Y.; Moskaitis, J.R.; Wang, S.; Hendricks, E.A.; Jin, H.; Smith, T.A. Tropical Cyclone prediction using COAMPS-TC. Oceanography 2014, 27, 104–115. [Google Scholar] [CrossRef]
- Kurihara, Y.; Bender, M.A.; Ross, R.J. An initialization scheme of hurricane models by vortex specification. Mon. Weather Rev. 1993, 121, 2030–2045. [Google Scholar] [CrossRef]
- Kurihara, Y.; Bender, M.A.; Tuleya, R.E.; Ross, R.J. Improvements in the GFDL hurricane prediction system. Mon. Weather Rev. 1995, 123, 2791–2801. [Google Scholar] [CrossRef]
- Lee, J.-D.; Wu, C.-C. The role of polygonal eyewalls in rapid intensification of Typhoon Megi (2010). J. Atmos. Sci. 2018, 75, 4175–4199. [Google Scholar] [CrossRef]
- Lee, J.-D.; Park, D.-S.R.; Ito, K.; Wu, C.-C. Effects of the assimilation of relative humidity reproduced from T-PARC II and Himawari-8 satellite imagery using dynamical initialization and ocean-coupled model: A case study of Typhoon Lan (2017). J. Geophys. Res. Atmos. 2021, 126, e2020JD034516. [Google Scholar] [CrossRef]
- Mehra, A.; Tallapragada, V.; Zhang, Z.; Liu, B.; Zhu, L.; Wang, W.; Kim, H.-S. Advancing the state of the art in operational tropical cyclone forecasting at NCEP. Trop. Cyclone Res. Rev. 2018, 7, 51–56. [Google Scholar] [CrossRef]
- Liu, Q.; Zhang, X.; Tong, M.; Zhang, Z.; Liu, B.; Wang, W.; Zhu, L.; Zhang, B.; Xu, X.; Trahan, S.; et al. Vortex initialization in the NCEP operational hurricane models. Atmosphere 2020, 11, 968. [Google Scholar] [CrossRef]
- Han, J.; Pan, H.-L. Revision of convection and vertical diffusion schemes in the NCEP Global Forecast System. Weather Forecast. 2011, 26, 520–533. [Google Scholar] [CrossRef]
- Han, J.; Wang, W.; Kwon, Y.C.; Hong, S.-Y.; Tallapragada, V.; Yang, F. Updates in the NCEP GFS cumulus convection schemes with scale and aerosol awareness. Weather Forecast. 2017, 32, 2005–2017. [Google Scholar] [CrossRef]
- Han, J.; Witek, M.L.; Teixeira, J.; Sun, R.; Pan, H.-L.; Fletcher, J.K.; Bretherton, C.S. Implementation in the NCEP GFS of a Hybrid Eddy-Diffusivity Mass-Flux (EDMF) boundary layer parameterization with dissipative heating and modified stable boundary layer mixing. Weather Forecast. 2016, 31, 341–352. [Google Scholar] [CrossRef]
- Iacono, M.J.; Delamere, J.S.; Mlawer, E.J.; Shephard, M.W.; Clough, S.A.; Collins, W.D. Radiative forcing by long-lived greenhouse gases: Calculations with the AER radiative transfer models. J. Geophys. Res. 2008, 113, D13103. [Google Scholar] [CrossRef]
- Lin, S.-J.; Chao, W.C.; Sud, Y.C.; Walker, G.K. A class of the van Leer-type transport schemes and its application to the moisture transport in a general circulation model. Mon. Weather Rev. 1994, 122, 1575–1593. [Google Scholar] [CrossRef][Green Version]
- Lin, S.-J. A “Vertically Lagrangian” finite-volume dynamical core for global models. Mon. Weather Rev. 2004, 132, 2293–2307. [Google Scholar] [CrossRef]
- Chen, X.; Andronova, N.; Leer, B.V.; Penner, J.P.; Boyd, J.P.; Jablonowski, C.; Lin, S.-J. A Control-Volume model of the compressible euler Equations with a vertical Lagrangian coordinate. Mon. Weather Rev. 2013, 141, 2526–2544. [Google Scholar] [CrossRef]
- Harris, L.; Chen, X.; Putman, W.; Zhou, L.; Chen, J.-H. A Scientific Description of the GFDL Finite-Volume Cubed-Sphere Dynamical Core; NOAA Technical Memorandum OAR GFDL; 2021-001; National Oceanic and Atmospheric Administration/Geophysical Fluid Dynamics Laboratory: Princeton, NJ, USA, 2021. [Google Scholar] [CrossRef]
- Wu, T.-C.; Zupanski, M.; Grasso, L.D.; Kummerow, C.D.; Bouckabara, S.-A. All-Sky Radiance Assimilation of ATMS in HWRF: A Demonstration Study. Mon. Weather Rev. 2019, 147, 85–106. [Google Scholar] [CrossRef]
- Lin, Y.-L.; RFarley, D.; Orville, H.D. Bulk parameterization of the snow field in a cloud model. J. Appl. Meteorol. Climatol. 1983, 22, 1065–1092. [Google Scholar] [CrossRef]
- Zhou, L.; Lin, S.-J.; Chen, J.-H.; Harris, L.M.; Chen, X.; Rees, S.L. Toward convective-scale prediction within the next generation global prediction system. Bull. Am. Meteorol. Soc. 2019, 100, 1225–1243. [Google Scholar] [CrossRef]
- Harris, L.; Zhou, L.; Lin, S.-J.; Chen, J.-H.; Chen, X.; Gao, K.; Morin, M.; Rees, S.; Sun, Y.; Tong, M.; et al. GFDL SHiELD: A Unified System for Weather-to-Seasonal Prediction. J. Adv. Model. Earth Syst. 2020, 12, e2020MS002223. [Google Scholar] [CrossRef]
- Thompson, G.; Rasmussen, R.M.; Manning, K. Explicit forecasts of winter precipitation using an improved bulk microphysics scheme. Part I: Description and sensitivity analysis. Mon. Weather Rev. 2004, 132, 519–542. [Google Scholar] [CrossRef]
- Thompson, G.; Eidhammer, T. A study of aerosol impacts on clouds and precipitation development in a large winter cyclone. J. Atmos. Sci. 2014, 71, 3636–3658. [Google Scholar] [CrossRef]
- Fischer, M.S.; Rogers, R.F.; Reasor, P.D.; Gamache, J.F. An analysis of tropical cyclone vortex and convective characteristics in relation to storm intensity using a novel airborne Doppler radar database. Mon. Weather Rev. 2022, 150, 2255–2278. [Google Scholar] [CrossRef]
- Gamache, J.F. Evaluation of a fully three-dimensional variational Doppler analysis technique. In Proceedings of the 28th Conference on Radar Meteorology, Austin, TX, USA, 9–12 September 1997; pp. 422–423. [Google Scholar]
- Reasor, P.D.; Eastin, M.D.; Gamache, J.F. Rapidly intensifying Hurricane Guillermo (1997). Part I: Low-wavenumber structure and evolution. Mon. Weather Rev. 2009, 137, 603–630. [Google Scholar] [CrossRef]
- Rogers, R.F. Convective-scale structure and evolution during a high-resolution simulation of tropical cyclone rapid intensification. J. Atmos. Sci. 2010, 67, 44–70. [Google Scholar] [CrossRef]
- Munsell, E.B.; Zhang, F.; Braun, S.A.; Sippel, J.A.; Didlake, A.C. The inner-core temperature structure of Hurricane Edouard (2014): Observations and ensemble variability. Mon. Weather Rev. 2018, 146, 135–155. [Google Scholar] [CrossRef]
- Shin, J.H. Vortex spin-up process in the extratropical transition of Hurricane Sandy (2012). J. Atmos. Sci. 2019, 76, 3589–3609. [Google Scholar] [CrossRef]
- Bucci, L.; Alaka, L.; Hagen, A.; Delgado, S.; Beven, J. National Hurricane Center Hurricane Ian Report. 2022; 72p. Available online: https://www.nhc.noaa.gov/data/tcr/AL092022_Ian.pdf (accessed on 7 July 2024).
- Beven, J.L., II. National Hurricane Center Hurricane Franklin Report. 2023; 29p. Available online: https://www.nhc.noaa.gov/data/tcr/AL082023_Franklin.pdf (accessed on 7 July 2024).
- Kleist, D.T.; Parrish, D.F.; Derber, J.C.; Treadon, R.; Wu, W.-S.; Lord, S. Introduction of the GSI into the NCEP Global Data Assimilation System. Weather Forecast. 2009, 24, 1691–1705. [Google Scholar] [CrossRef]
Disclaimer/Publisher’s Note: The statements, opinions and data contained in all publications are solely those of the individual author(s) and contributor(s) and not of MDPI and/or the editor(s). MDPI and/or the editor(s) disclaim responsibility for any injury to people or property resulting from any ideas, methods, instructions or products referred to in the content. |
© 2024 by the authors. Licensee MDPI, Basel, Switzerland. This article is an open access article distributed under the terms and conditions of the Creative Commons Attribution (CC BY) license (https://creativecommons.org/licenses/by/4.0/).