Abstract
Emissions of atmospheric pollutants are rapidly increasing over South Asia. A greater understanding of seasonal variability in aerosol concentrations over South Asia is a scientific challenge and has consequences due to a lack of monitoring and modelling of air pollutants. Therefore, this study investigates aerosol patterns and trends over some major cities in the Indo-Gangetic Plain of the South Asia, i.e., Islamabad, Lahore, Delhi, and Dhaka, by using simulations from the Modern -Era Retrospective Analysis for Research and Applications, version 2 (MERRA-2) model and satellite measurements (Moderate Resolution Imaging Spectroradiometer, (MODIS)) from 2000 to 2020. The results show that seasonal MODIS–aerosol optical depth (AOD) during 2000−2020 in Lahore is 0.5, 0.52, 0.92, and 0.71, while in Islamabad 0.25, 0.32, 0.45, and 0.38, in Delhi 0.68, 0.6, 1.0, and 0.77, and in Dhaka 0.79, 0.75, 0.78 and 0.55 values are observed during different seasons, i.e., winter, spring, summer, and autumn, respectively. The analysis reveals a significant increase in aerosol concentrations by 25%, 24%, 19%, and 14%, and maximum AOD increased by 15%, 14%, 19%, and 22% during the winter of the last decade (2011–2020) over Islamabad, Lahore, Delhi, and Dhaka, respectively. In contrast, AOD values decreased during spring by −5%, −12%, and −5 over Islamabad, Lahore, and Delhi, respectively. In Dhaka, AOD shows an increasing trend for all seasons. Thus, this study provides the aerosol spatial and temporal variations over the South Asian region and would help policymakers to strategize suitable mitigation measurements.
1. Introduction
Atmospheric aerosols are key pollutants in the air that can contribute to climatological changes and health impacts [1,2]. Dense haze during wintertime and dust storms during spring over the southern and northern South Asian region have affected millions of people [3,4]. High air pollutants (aerosol concentrations) could increase health issues, e.g., lung cancer, respiratory diseases, and cardiovascular disease [5,6]. Atmospheric aerosols can also alter the earth’s radiation budget [7]. Several studies attempted to examine the aerosols distribution, their optical properties, and their transport in some parts of the South Asian region, particularly the Indo-Gangetic Plain through modeling and observations during the last two decades [8,9,10,11,12,13,14,15]. The Indo-Gangetic Plain is encompassing the northern regions of the Indian subcontinent, including many areas of India, Pakistan, Bangladesh [16]. Some reported studies discussed haze issues over this region [3,17,18]. The primary pollution sources of haze episodes in the winters over the Indo-Gangetic Plain are crop burning, brick kiln emissions, and transportation [19,20,21,22]. Other emission sources in this region may include emissions from industries, construction activities, and conventional cook stoves [19,20]. Hence, geographical conditions such as demographic characteristics, land use, transportation facilities, physical geography, emissions, vegetation, and traffic [23,24] may cause high air pollution levels in Indo-Gangetic Plain at both local and regional scales. However, in-depth analysis and assessment of aerosol optical properties at seasonal and regional scales are required to understand the regional climate better. Recent growth in economic development and traffic congestion issues in some of the major cities in South Asia is responsible for high air pollution levels during previous decades [17,18,25]. Atmospheric pollutants in South Asia are more elevated than the WHO safe limits (e.g., annual mean for PM2.5 is 5 (µg m−3) and PM10 is 15 (µg m−3)) [26] because of industrial activities and population size [8,16,18]. Several studies reported high air pollution levels in the megacities of South Asia [24,27,28,29,30,31,32]. Former studies concluded an overall increase in (atmospheric optical depth) AOD over the region [33,34,35,36]. The previously reported studies [37,38,39,40,41,42] mainly focused on the limited area in a specific country’s region and respective seasons such as winter or summer. Moreover, spatial and temporal variations in aerosols distribution and AOD trends have not been widely discussed in these studies [37,38,39,40,41,42].
The lack of continuous air pollutants measurements in South Asian countries (e.g., Pakistan, India, and Bangladesh) hinders the cognizance of the role of the atmospheric aerosol, limited observational, modeling, and satellite-based studies. Therefore, there is an immense need to study aerosol in this South Asian region. The present study investigates the percent changes in aerosol concentrations, its various components, annual variations, and trends of AOD over the urban environment in South Asia, specifically the Indo-Gangetic Plain, including Islamabad, Lahore, Delhi, and Dhaka during the last two decades. The analysis is performed using the Modern-Era Retrospective Analysis for Research and Applications, version 2 (MERRA-2) model and satellite measurements (Moderate Resolution Imaging Spectroradiometer, (MODIS)). The following questions are addressed in this study:
- (1)
- To what extent aerosol concentration and AOD value has changed over the past 20 years in the major cities of the selected Indo-Gangetic Plain region of South Asia?
- (2)
- How seasonal and spatial-temporal variations influence the distribution of aerosols, its various components (e.g., black carbon, organic carbon, sea salt) and AOD trend in the region based on the satellite data?
The findings of this study will help us better understand the characteristics of long-term trends during the last two decades and inter-comparison in aerosols over South Asia. It will also be useful in determining whether local governments’ countermeasures and policy making have positively mitigated urban air pollution over decadal variations, which is necessary for designing effective strategies and further reducing aerosol concentrations.
2. Materials and Methods
2.1. Case Study
The Indo-Gangetic Plain (IGP) is a 2.5 million km2 fertile plain covering the northern parts of South Asia, including eastern and northern India, the southern plains of Nepal, the eastern parts of Pakistan, and Bangladesh. This study represents AOD over four cities, i.e., Islamabad and Lahore in Pakistan, Delhi in India, and Dhaka in Bangladesh (Figure 1). Islamabad is the capital of Pakistan and is situated at 500 m elevation above sea level (latitude: 33.729° N and longitude: 73.0931° E) with a population of about three million and an area of about 906 km2. The climate is subtropical with four distinct seasons, summer (June–August), autumn (September–November), winter (December–February), and spring (March–May). The average annual rainfall in Islamabad is 1143 mm [19]. Lahore (31.320° N; 74.220° E) is the second-largest city in Pakistan, with a population of approximately 12 million. The climate in Lahore is hot and semi-arid, with relatively wet and extremely hot summers and dry, warm winters [43]. The mean maximum temperatures in summer (April to June) range between 33 °C and 39 °C and in winter months from 17 °C to 22 °C [44]. Delhi (28.7041° N; 77.1025° E) is one of India’s most densely populated cities, with a population density of 11,320 km2 [45] and an estimated total population of 20 million in the year 2021 [45]. It faces extreme temperatures of as low as 4 °C in the winter to 45 °C in the summer. Delhi receives an annual average rainfall of 600–800 mm [46]. Lahore and Delhi face almost the same weather conditions. Dhaka is the capital of Bangladesh, with an estimated population of 9 million living in the city area and over 21 million in the greater Dhaka area [46]. According to the United Nations (UN), it is one of the world’s 33 megacities as of 2018 [46]. The geographical extent of Dhaka city is located between 23.69° and 23.89° N latitudes and 90.33°and 90.44° E longitudes. The city’s climate is typically tropical monsoon with three different seasons, i.e., summer, winter, and monsoon [47]. In Dhaka, 80% of the average annual rainfall falls during the monsoon [48].
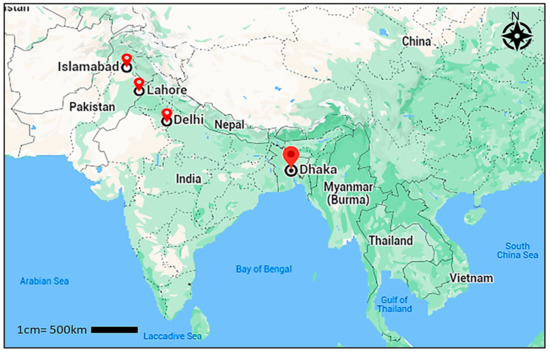
Figure 1.
The geographical location of the four megacities (Islamabad, Lahore, Delhi, and Dhaka) in the Indo-Gangetic Plain in South Asia.
2.2. MODIS Satellite
MODIS is the instrument aboard the NASA’s two Earth Observing System (EOS) satellites, i.e., Terra and Aqua. In this study, the monthly mean Terra AOD data were retrieved to analyze the trends of AOD over the South Asian region (collection 5; level 2 aerosol products) for the period of twenty years (2000–2020). AOD is retrieved from the MODIS data at level 2 at the spatial resolution of 10 km × 10 km [49]. The terra operates at an approximate height of 700 km and provides aerosol data with the interval of one or two days. The MODIS has 7 out of 36 wavelength channels that are used to retrieve aerosols data at the range 0.47–2.12 µm. In this study, level 2 aerosol products were examined; collection 5 retrieval algorithm is used at three wavelengths, i.e., 0.47, 0.66, and 2.12 µm. Then, these three channels are inverted to obtain the final AOD values at 0.55 µm. More details about the retrieval of MODIS data are reported in [38,44,50,51].
2.3. Model Simulations
NASA developed the Modern-Era Retrospective Analysis for Research and Applications, Version 2 (MERRA-2) [52]. The model’s horizontal resolution is 0.625° longitude × 0.5° latitudes, and vertical sigma layers are 20–30 and apply the Goddard earth observing system data assimilation system (GEOS DAS) assimilated meteorological data [52]. Aerosols are simulated in the MERRA-2 by using Goddard Chemistry, Aerosol, Radiation, and Transport (GOCART) model. MERRA-2 aerosol reanalysis datasets were used in this study to estimate aerosol concentrations over South Asia over the last 20 years (2000–2020) for comparison and validation purpose. On various spatial scales, the inter-annual variation and spatiotemporal characteristics of several aerosol types were investigated. MERRA-2 data were also combined with dynamic demographic data to reveal population and age group variations exposed to high aerosol concentrations. Because of its coarse resolution, MERRA-2 is only useful for large-scale studies, such as those on continental and global scales. In small-scale studies or regions with fewer people and limited anthropogenic emissions (e.g., Southwest Pakistan), coarse resolution may be uncertain and exclude spatial features of aerosol distribution in urban areas, resulting in large uncertainties. MERRA-2 can be used to estimate aerosol concentrations over a long period. It has broad temporal coverage, making it ideal for long-term time-series studies [49].
2.4. Methodology
The examination was made in the winter (December, January, and February (DJF)), the spring (March, April, and May (MAM)), the summer (June, July, and August (JJA)), and the autumn (September, October, and November (SON)) for aerosols including black carbon (BC), organic carbon (OC), sulfate, dust mass concentrations, and AOD retrieved from MERRA2 and MODIS. The meteorological variables such as wind speed (m/s) and precipitation (mm) were also studied using MERRA 2 data. Percent changes in AOD were calculated by using Equation (1) [8]:
where
First decade = 2000–2010
Second decade = 2011–2020
Percent changes in aerosol concentrations were calculated by using the following method, Aerosol = avg. sulfate + avg. BC + avg. OC and calculated for the whole period from 2000 to 2020.
3. Results
3.1. Meteorological Parameters
Ambient meteorological conditions (especially wind, stable atmospheric conditions, humidity, mixing height) play a vital role in the distribution of aerosols, AOD trend, and their contribution to environmental issues such as haze, poor air quality, and health issues in the selected urban cities. Figure 2 shows the MERRA2 seasonal wind direction and wind speed over South Asia average from 2000 to 2020. Wind speeds were high over the Arabian Sea and Bay of Bengal and northwesterly during summer. In contrast, the wind speed was low during the autumn season over the South Asian region. During the winter, the wind over the northwestern region of South Asia (Pakistan and Afghanistan) comes from the west direction, called “westerlies”. In the Arabian Sea and Bay of Bengal, the wind direction is from the northeast, called “north easterlies”. By contrast, during spring, the wind direction is westerly over the northwestern region and southerly across the Bay of Bengal.
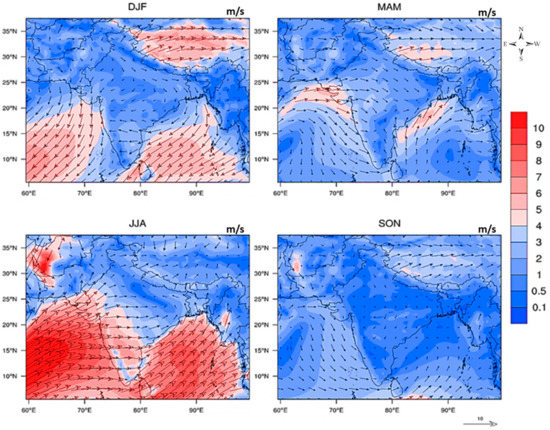
Figure 2.
Seasonal MERRA2 wind speed (m/s) and direction over South Asia from 2000 to 2020.
Figure 3 shows the MERRA2 total surface precipitation (mm/day) climatology over South Asia. In addition, precipitation patterns in four different seasons (winter, spring, summer, and autumn) were analyzed in the selected region from 2000 to 2020. The maximum precipitation was recorded during summer (7.5 mm/day) and a minimum of 1.79 in winters. Precipitation during the spring and autumn seasons was recorded 2.5 and 5 mm/day, respectively. Due to the increasing occurrence of haze and winter fog events and their associated impacts in Northeast Pakistan, detailed information about air pollution levels, sources, and causes of fog, including aerosol formation and enabling meteorological conditions, is required. High PM2.5 concentrations in Pakistan and the South Asia region during autumn and winter are a result of high anthropogenic emissions and meteorological conditions such as weak surface winds, shallow planetary-boundary-layer (PBL), and high relative humidity [3,4]. All these factors play an important role in forming heavily polluted and persistent episodes [4,8].
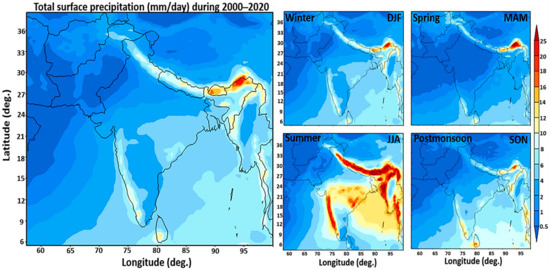
Figure 3.
Seasonal variations in MERRA2 total surface precipitation (mm/day) climatology over South Asia from 2000–2020.
3.2. Seasonal, Spatial, and Temporal Variations of AOD
Figure 4 shows the average MODIS, and MERRA2 Aerosol optical depth (AOD) climatology over South Asia for various seasons during 2000–2020. Both MERRA2 and MODIS showed high concentrations across the Indo-Gangetic Plain during the summer; MODIS–AOD values ranged from 0.8 to 1.0, while MERRA2–AOD values were 0.8–0.9. As discussed in previous section, that maximum precipitation was recorded in the summer. Therefore, a correlation seems to exist between the summer season and precipitation. However, it could be a sporadic positive relationship and may vary spatially [53]. The high AOD values were attributed to two primary factors: (1) high humidity during summer, and (2) sea salt in the air during the monsoon season. AOD values during winter in the eastern and western Indo-Gangetic Plain were 0.4–0.5 and 0.6–0.9, respectively. In contrast, AOD values during autumn over the eastern and western Indo-Gangetic Plain were 0.5–0.6 and 0.6–0.7, respectively.
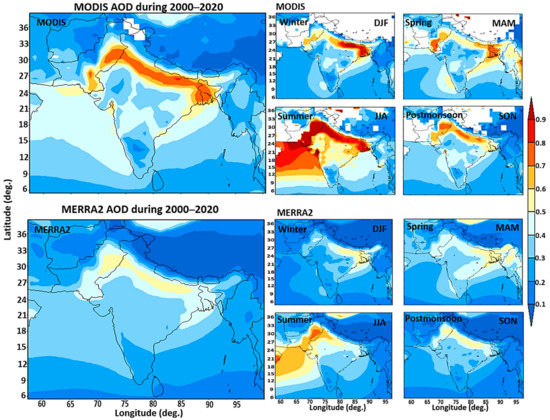
Figure 4.
Mean variations in MODIS and MERRA2 Aerosol optical depth (AOD) and climatology over South Asia from 2000–2020.
Table 1 describes the variability of AOD from the MODIS and MERRA-2 during 20 years in different seasons, i.e., DJF (Winter), MAM (Spring), JJA (Summer), SON (Autumn) at the four locations of Lahore, Islamabad, Delhi, and Dhaka. During the winter and summer, MERRA-2 underestimated the AOD at Lahore, Delhi, and Dhaka while overestimating the AOD in Islamabad. Moreover, the same trend has been observed in autumn for the selected megacities except for Islamabad, where both MERRA-2 and MODIS show similar values. This indicates that regional topography and meteorology play an important role in AOD measurements. In the spring, both MERRA-2 and MODIS values are comparable.

Table 1.
Average AOD over the four megacities during 2000–2020.
Figure 5 shows the comparisons of MERRA2–AOD and MODIS–AOD over four megacities, Islamabad, Lahore, Delhi, and Dhaka. During winter in Lahore, MODIS–AOD values were 0.4–0.8 (average 0.55). Both MODIS and MERRA2 AOD values were 0.4 to 0.6 during the spring season. During summer, MODIS–AOD values were 0.6–1. During the autumn season, MODIS–AOD values were 0.6–08. High AOD values in Lahore during the winter and autumn seasons are attributed to crop burning in the region [8]. In southeast Asia, high AOD values are also attributed to biomass burning in the region [54]. Similarly, the highest AOD values ever were monitored in Indonesia during the 2015 biomass burning [55]. In Islamabad, AOD values were 0.2–0.4 during 2000–2020, while 0.2–0.5 in spring. Maximum AOD values were in the summer, ranging from 0.3 to 0.7. During the autumn season, AOD values were 0.3–0.4. High levels of AOD in Islamabad are attributed to urban expansion and an increase in motor vehicles [44].
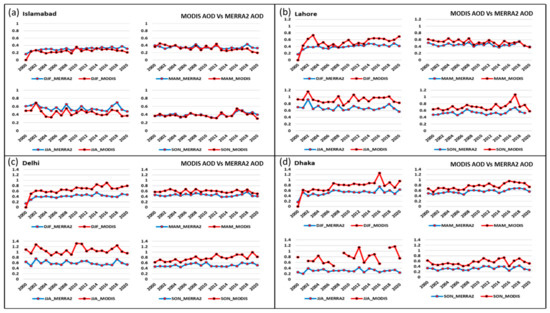
Figure 5.
Seasonal MERRA2 and MODIS–AOD over Islamabad, Lahore, Delhi, and Dhaka from 2000–2020.
In Delhi, AOD values during the winters and summers were 0.2–0.8 and 0.5–1.0, respectively. AOD values in the spring were 0.4–0.6. Thus, the summer season shows the maximum AOD values in Delhi and Lahore. These high values may be attributed to high temperature, humidity, and mineral dust [51]. In the autumn season, AOD values over Delhi were in the range of 0.2–0.8. Dhaka shows a similar trend in all seasons with AOD values, i.e., from 0.3 to 0.8. Hence, AOD values remain almost the same in all seasons except autumn, which shows a slight decrease in AOD during this period.
Figure 6 shows the decadal variations in MODIS and MERRA2 AOD over South Asia and the percent changes during 2000–2020. Generally, AOD in MERRA2 and MODIS increased by 10–25% in the eastern region (Eastern India and Bangladesh) and 3–5% in the western areas (Pakistan and Afghanistan) during the last decade. Figure 7 shows the percent changes over the four megacities during the previous two decades based on MERRA2 AOD.
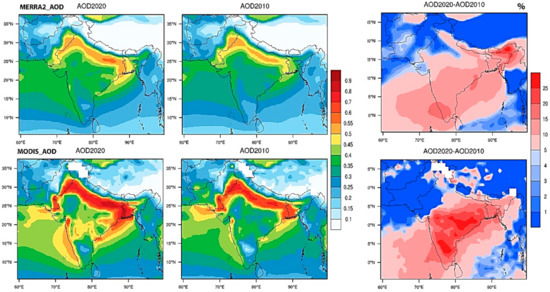
Figure 6.
Decadal variations in MODIS and MERRA2 Aerosol optical depth (AOD) over South Asia average over 2011–2020 (First Column), and 2000–2010 (Second Column) and percent changes based on averaged monthly data ((2011–2020)–(2000–2010)) (Third column).
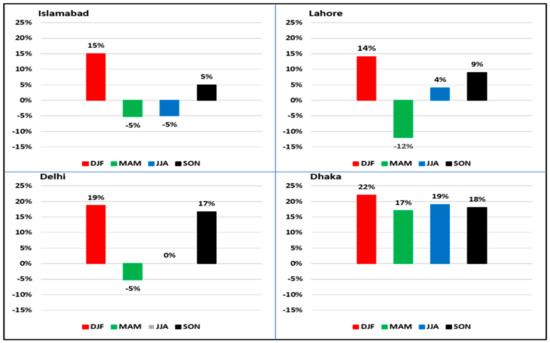
Figure 7.
Seasonal percent changes (average 2011–2020–average 2000–2010) in MERRA-2 AOD over megacities.
Percent changes were calculated using Equation (1). Analysis over Islamabad shows that AOD increased by 15% and 5% during the winter and autumn, respectively, while decreasing during the spring and summer by −5%. In Lahore, AOD increased during the winter, summer, and autumn by 14%, 4%, and 9%, respectively, while it decreased by −12% during the spring. AOD increased in Delhi during the summer and autumn by 19% and 17%, respectively, while reducing in the spring by −5%. Analysis over Dhaka shows that AOD increases during all seasons. AOD increases during the winter, spring, summer, and autumn seasons by 22%, 17%, 19%, and 18%. High AOD values in South Asia are mainly attributed to biomass burning, traffic, and brick kiln [56,57,58]. In other regions, such anthropogenic activities in the background could influence the AOD values. For instance, Burgos et al. [59] demonstrated that the air pollution episode originating in the north central Peninsula (Europe) was mainly a consequence of Canadian biomass burning (BB) events in the summer 2013. It was found that Canadian BB contributed to a 0.53–0.82 AOD average, in contrast to a 0.09 AOD average with no event in the background.
High AODs in Delhi are related to emissions from industrial, residential energy usage, transportation, biomass burning, and meteorological conditions [29,54,60]. Average MODIS–AOD values for Dhaka are very similar to Delhi’s AOD values during winters. In contrast with AOD values in spring, average values were 0.4–1.0, showing an increasing trend. MODIS–AOD values during summer were 0.4–1.2, while MERRA2 were 0.2–0.4. During the autumn season, MODIS–AOD values were 0.4–0.8, while MERRA2 AOD values were 0.2–0.4. Hence, in contrast to MODIS, MERRA2 underestimates the AOD values because of the vast uncertainties that might exist while monitoring emissions from the source [11]. The similar finding was reported by Aldabash et al. [61], namely that MODIS performed better during extreme events than MERRA-2. Shi et al. [62] found that AOD events of haze and dust storms were not determined by MERRA-2.
3.3. Seasonal Aerosols Surface Mass Concentration
Figure 8 shows aerosol components such as sulfate, BC, OC, and sea salt surface mass concentration climatology and seasonal variation during the winter, spring, summer, and autumn seasons over South Asia during 2000–2020. Over the western Indo-Gangetic Plain (NE Pakistan), sulfate aerosol shows 10–16 µg m−3 and 16–20 µg m−3 over the eastern Indo-Gangetic Plain during the winter season, while sulfate exhibits maximum concentrations of 6–8 µg m−3 and 2–4 µg m−3 over the east and western Indo-Gangetic Plain during spring. Sulfate concentrations were 4–6 µg m−3 over the eastern area and 2–5 µg m−3 over the west Indo-Gangetic Plain. During the autumn season, sulfate concentrations were 8–12 µg m−3 and 10–16 µg m−3 over the eastern and western Indo-Gangetic Plain, respectively.
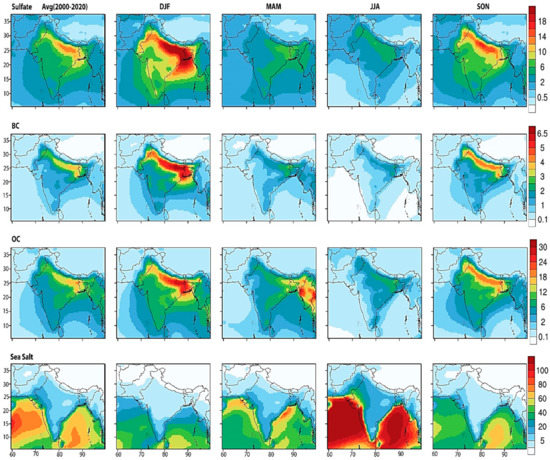
Figure 8.
Seasonal variations in MERRA2 surface concentration of Sulfate, BC, OC, and sea salt (µg m−3) over South Asia during 2000–2020.
During the winter, the level of BC reaches its apex because of the burning of fossil fuels and crop residue in the region stretching between Northern India, Delhi, and Lahore. In the Indo-Gangetic Plain region of South Asia, crop residue burning contributes up to 70% in PM2.5 and over 40% increase in BC concentration during the harvesting season each year [63]. Thus, the stable atmospheric conditions in the region and the temperature inversion in the winter lead to the accumulation of these pollutants. Moreover, the condition contributed to fog formation (smoke and absorbing aerosols, i.e., BC) during the winter of 2014–2017 in Lahore [64] and Delhi [65]. The trend of OC is similar to BC; however, the concentration value of OC is relatively high in contrast to BC. Moreover, southwesterly-to-westerly winds are responsible for the dominating OC over the Northern Bay of Bengal during the seasons of March, April, and May [66].
The marine sea salt transported from the Bay of Bengal may influence the level of ionic variables in aerosols (e.g., sulfates, Potassium, Chloride) during summer. As seasons changed from summer to monsoon, these marine aerosols affected Bangladesh, particularly Dhaka. Norazman et al. [66] also examined that the secondary inorganic aerosol concentration was high during the summer due to humidity, which leads to an increase in scavenging of ions in the monsoon season in Dhaka.
Figure 9 shows seasonal aerosol concentration (µg m−3) over Islamabad, Lahore, Delhi, and Dhaka during 2000–2020. The maximum sulfate concentrations were estimated in Islamabad (10–12 µg m−3) during winter and autumn for 20 years (2000–2020). Lahore shows a similar trend, but higher concentrations were observed in Islamabad. In Lahore, maximum concentrations were 10–20 µg m−3 during winter and autumn. In Delhi and Dhaka, maximum concentrations were 10–22 µg m−3 and 15–25 µg m−3 during winter and autumn. Sulfate concentrations during the spring and summer were 2–7 µg m−3 over Islamabad, Lahore, Delhi, and Dhaka. Overall, analysis of sulfate concentrations over the four megacities has shown an increasing trend during winter and autumn. The reason might be that SO2 emissions increases due to recent fossil fuel combustions in the region, which result in high sulfate concentrations in South Asia [58,67,68]. Sea salt maximum concentrations were high during the summer and minimal during winters over the Arabian Sea and Bay of Bengal. This analysis implied a positive correlation of wind speed (as shown in Figure 2) and sea salt concentration during summer for the Bay of Bengal. Maximum concentrations during summer were 100–120 µg m−3. Thus, the northerly and westerly winds transport the sea salt to the western region, especially over southern Pakistan [65,69].
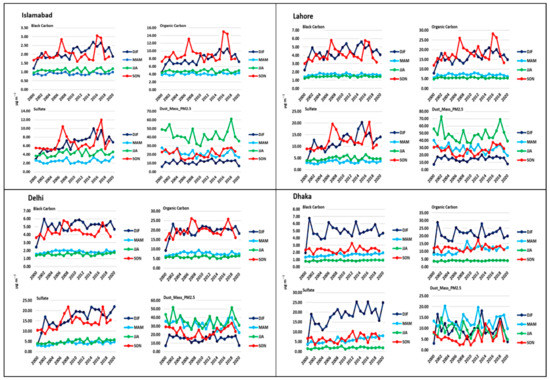
Figure 9.
Seasonal aerosols concentration (µg m−3) over Islamabad, Lahore, Delhi, and Dhaka during 2000–2020.
BC aerosol shows 5–7 µg m−3 and 3–5 µg m−3 concentrations over eastern and western Indo-Gangetic Plain during the winter, respectively, while 1–3 µg m−3 during the spring and summer and 3–5 µg m−3 during the autumn. OC aerosol concentrations over the Indo-Gangetic Plain were 12–25 µg m−3 during the winter, spring, and autumn, while 6–10 µg m−3 during the summer. BC higher concentrations in Islamabad were observed (1.3–3 µg m−3) during the winter and autumn, while higher OC concentrations range were 8–15 µg m−3 and 6–12 µg m−3 during the autumn and winter, respectively. In contrast, OC concentrations in Islamabad were 4–5 µg m−3 during the spring and summer. In Lahore, higher concentrations of BC were 3–6 µg m−3 during the winter and autumn, while maximum concentrations of OC were 15–29 µg m−3 during the autumn and 10–22 µg m−3 during the winter. In Delhi, the higher concentrations of BC were observed during the winter (4–6 µg m−3), while OC higher concentrations were observed during the autumn (15–26 µg m−3). In Dhaka, higher BC concentrations were observed between the autumn and spring, i.e., 10–20 µg m−3, while 4–7 µg m−3 values were found during the winter. The higher OC concentrations were 15–30 µg m−3 during the winter. Thus, analysis of the four megacities exhibits an overall increasing OC and BC concentrations trend during the winter and autumn. Inter-annual variability of meteorological conditions and biomass burning leads to a higher concentration of BC during the winter [70,71] (Figure 2 and Figure 3).
3.4. Seasonal Dust Surface Mass Concentration
Figure 10 shows dust mass concentrations (µg m−3) and wind speed for various seasons over the South Asia region averaged during 2000–2020. The southwestern Indo-Gangetic Plain over the Thar Desert region (Pakistan) was exposed to high dust aerosols (mass concertation: 300–500 µg m−3) during the summer season, while during winter-spring and autumn, low dust aerosols levels (mass concentration: 150–300 µg m−3) were observed. The reason is the northwesterly wind during the spring and summer transported these dust aerosols from the southern region of Pakistan to northern Pakistan and the western and central regions of India. Shahid et al. [3] reported that the dust concentrations in northeastern Pakistan are transported from the Thar Desert.
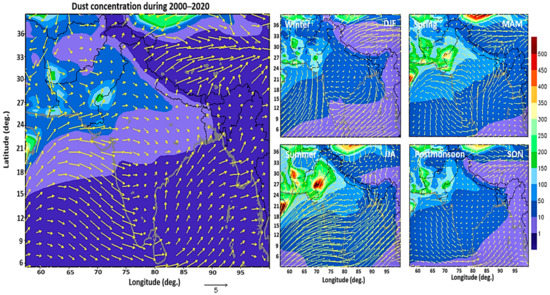
Figure 10.
Climatology and seasonal variations in MERRA2 dust mass concentrations (µg m−3) and wind speed over South Asia during 2000–2020.
3.5. Percent Changes in Aerosol Concentrations over Megacities
Figure 11 and Figure 12 shows the percent changes in aerosol concentration during the last two decades over South Asia and the four megacities. Aerosols generally increased by 10–25% in the eastern region and 5–15% in western regions during the last decade. Aerosols concentration in Islamabad shows a 25% increase during the winter, 4% during the spring and summer, and 3% in the autumn. In Lahore, aerosol concentrations increased during the winter season by 24%, while during spring, summer, and autumn they increased by 2%, 3%, and 6%, respectively. Aerosol concentrations increased in Delhi during winter, spring, summer, and autumn by 19%, 3%, 8%, and 2%, respectively. Analysis of percent changes of aerosols in Dhaka shows that aerosol concentrations increased by 14%, 22%, 6%, and 15% during the winter, spring, summer, and autumn seasons, respectively. The higher AOD over Dhaka is associated with high population density and dust generated due to loading and transportation activities [20,72]. The high level of aerosols observed in the four megacities in the winter is because the atmospheric conditions, i.e., relatively stable in the winter, limit the dispersion of aerosols and other pollutants [65]. Mixing height is another meteorological factor that is directly correlated with the concentration of aerosol [73]. Usually, in the cold season, the mixing height is small, leading to higher aerosol concentrations [73]. Ouyang et al. [74] compared the WHO air quality guidelines and air quality studies in the South Asian region, concluding that the air quality is poor during winter. The effective implementation of the WHO guidelines can bring healthier air quality to these South Asian countries. However, strict guidelines such as 5 µg m−3 for PM2.5 for these countries is a difficult target to achieve because of the presence of the natural abundance of dust aerosols.
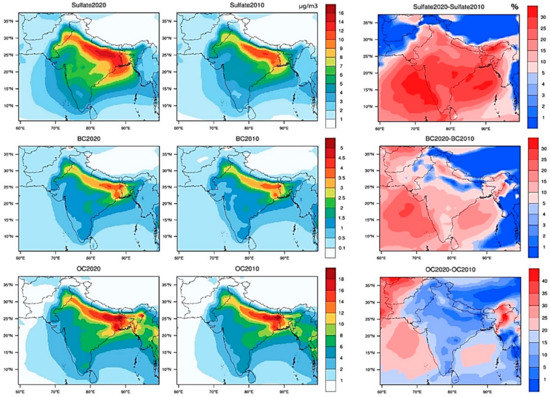
Figure 11.
Decadal variations in aerosol concentrations (µg m−3) over South Asia average over 2011–2020 (First Column), and 2000–2010 (Second Column) and percent changes (average (2011–2020)–average (2000–2010)).
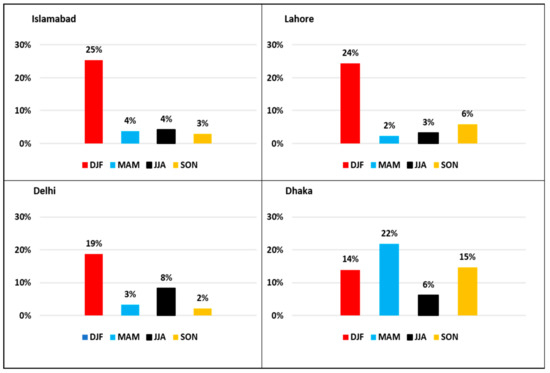
Figure 12.
Percent increase (average 2011–2020–average 2000–2010) in aerosol concentrations over megacities.
4. Conclusions
The distribution of aerosols, variability of aerosols, AOD trends, and percent changes over the major cities in the Indo-Gangetic Plain in South Asia were analyzed during various seasons by using the modern-era retrospective analysis using MERRA-2 model and satellite measurements. The study examined the spatial-temporal and seasonal variation of the aerosols and AOD for four megacities in South Asia (Islamabad, Lahore, Delhi, and Dhaka) during 2000–2020. The comparative analysis over two decades (2000–2010 and 2011–2020) shows that maximum AOD values during the winter of the last decade (2011–2020) have increased by 15%, 14%, 19%, and 22% in Islamabad, Lahore, Delhi, and Dhaka, respectively, while they have decreased during the spring by −5%, −12% and −5 in Islamabad, Lahore, and Delhi, respectively. However, in Dhaka, an increasing trend has been observed for all seasons.
Meteorological variables are associated with the variability of AOD during different seasons. During the summer, AOD increased in Lahore and Dhaka by 4% and 19%, respectively, while it decreased by −5% in Islamabad because of the difference in temperature and humidity. During the autumn, AOD values increased by 5%, 9%, 17%, and 18% in Islamabad, Lahore, Delhi, and Dhaka. Analysis of aerosols shows that maximum aerosol concentrations during the winter of the last decade (2011–2020) have increased by 25%, 24%, 19%, and 14%, while during the spring, aerosols increased by 4%, 2%, 3%, and 22% in Islamabad, Lahore, Delhi, and Dhaka respectively. By contrast, during the summer aerosol concentrations increased minimally, and percent values increased by 4%, 3%, 8%, and 6% in Islamabad, Lahore, Delhi, and Dhaka. In contrast to 2000–2010, for the period 2010–2020, in Islamabad, Lahore, Delhi, and Dhaka, aerosol percent change values have increased by 3%, 6%, 2%, and 15%, respectively. The analysis shows that the AOD values and aerosol concentrations have increased over the past two decades (2000–2020) in South Asian megacities due to anthropogenic activities. The increase in OC and BC concentrations is due to crop burning with a contribution from local transport, while sulfate emissions are increasing due to the rise in transportation activities in South Asia. The comparative analysis of MODIS and MERRA-2 dataset has similar spatial distribution patterns and can capture the dynamic changes of AOD, whereas MERRA-2 slightly underestimated AOD. The reason is its coarse resolution, which is usually suitable for large-scale studies.
Given the above-reported trends from both modeling and observation, we recommend implementing local and global environmental and public health standards across South Asian cities and enacting environmental laws to curb the increases in aerosol concentrations and overall pollution.
Author Contributions
Conceptualization, I.S. and M.Z.S.; methodology, I.S.; validation, I.S., Z.C. and writing—original draft preparation, I.S.; writing—review and editing, Z.C., and Z.A.; supervision, I.S. All authors have read and agreed to the published version of the manuscript.
Funding
This research was funded by the Higher Education Commission (HEC) Pakistan PBAIRP grant # 22-17 for funding to complete this project.
Institutional Review Board Statement
Not applicable.
Informed Consent Statement
Not applicable.
Data Availability Statement
Not applicable.
Acknowledgments
We acknowledge the Higher Education Commission (HEC) Pakistan PBAIRP grant # 22-17 for funding to complete this project.
Conflicts of Interest
The authors declare no conflict of interest and the funders had no role in the design of the study; in the collection, analyses, or interpretation of data; in the writing of the manuscript, or in the decision to publish the results.
References
- Mudu, P.; Velasco, R.P.; Zastenskaya, I.; Jarosinska, D. The importance and challenge of carcinogenic air pollutants for health risk and impact assessment. Eur. J. Public Health 2020, 30, ckaa165.841. [Google Scholar] [CrossRef]
- IPCC. Climate Change 2013: The Physical Science Basis. Contribution of Working Group I to the Fifth Assessment Report of IPCC the Intergovernmental Panel on Climate Change; Stocker, T.F., Qin, D., Plattner, G.-K., Tignor, M., Allen, S.K., Boschung, J., Nauels, A., Xia, Y., Bex, V., Midgley, P.M., Eds.; Cambridge University Press: Cambridge, UK; New York, NY, USA, 2013; Volume AR5. [Google Scholar]
- Shahid, M.Z.; Shahid, I.; Chishtie, F.; Shahzad, M.I.; Bulbul, G. Analysis of a dense haze event over North-eastern Pakistan using WRF-Chem model and remote sensing. J. Atmos. Sol.-Terr. Phys. 2019, 182, 229–241. [Google Scholar] [CrossRef]
- Shahid, M.Z.; Liao, H.; Li, J.; Shahid, I.; Lodhi, A.; Mansha, M. Seasonal Variations of Aerosols in Pakistan: Contributions of Domestic Anthropogenic Emissions and Transboundary Transport. Aerosol Air Qual. Res. 2015, 15, 1580–1600. [Google Scholar] [CrossRef] [Green Version]
- Russell, A.G.; Brunekreef, B. A Focus on Particulate Matter and Health. Environ. Sci. Technol. 2009, 43, 4620–4625. [Google Scholar] [CrossRef] [Green Version]
- Davidson, L.; Borg, M.; Marin, I.; Topor, A.; Mezzina, R.; Sells, D. Processes of Recovery in Serious Mental Illness: Findings from a Multinational Study. Am. J. Psychiatr. Rehabil. 2005, 8, 177–201. [Google Scholar] [CrossRef] [Green Version]
- Haywood, J.; Boucher, O. Estimates of the direct and indirect radiative forcing due to tropospheric aerosols: A review. Rev. Geophys. 2000, 38, 513–543. [Google Scholar] [CrossRef]
- Shahid, M.Z.; Shahid, I.; Zahid, M. Inter-annual variability and distribution of aerosols during winters and aerosol optical thickness over Northeastern Pakistan. Int. J. Environ. Sci. Technol. 2022, 19, 875–888. [Google Scholar] [CrossRef]
- Shi, H.; Wang, Y.; Chen, J.; Huisingh, D. Preventing smog crises in China and globally. J. Clean. Prod. 2016, 112, 1261–1271. [Google Scholar] [CrossRef]
- Vinoj, V.; Rasch, P.J.; Wang, H.; Yoon, J.-H.; Ma, P.-L.; Landu, K.; Singh, B. Short-term modulation of Indian summer monsoon rainfall by West Asian dust. Nat. Geosci. 2014, 7, 308–313. [Google Scholar] [CrossRef]
- Nair, V.S.; Solmon, F.; Giorgi, F.; Mariotti, L.; Babu, S.S.; Moorthy, K.K. Simulation of South Asian aerosols for regional climate studies. J. Geophys. Res. Atmos. 2012, 117, D04209. [Google Scholar] [CrossRef]
- Bollasina, M.A.; Ming, Y.; Ramaswamy, V. Anthropogenic Aerosols and the Weakening of the South Asian Summer Monsoon. Science 2011, 334, 502–505. [Google Scholar] [CrossRef] [PubMed] [Green Version]
- Lawrence, M.G.; Lelieveld, J. Atmospheric pollutant outflow from southern Asia: A review. Atmos. Chem. Phys. 2010, 10, 11017–11096. [Google Scholar] [CrossRef] [Green Version]
- Lau, K.M.; Kim, M.K.; Kim, K.M. Asian summer monsoon anomalies induced by aerosol direct forcing: The role of the Tibetan Plateau. Clim. Dyn. 2006, 26, 855–864. [Google Scholar] [CrossRef] [Green Version]
- Ramanathan, V.; Chung, C.; Kim, D.; Bettge, T.; Buja, L.; Kiehl, J.T.; Washington, W.M.; Fu, Q.; Sikka, D.R.; Wild, M. Atmospheric brown clouds: Impacts on South Asian climate and hydrological cycle. Proc. Natl. Acad. Sci. USA 2005, 102, 5326–5333. [Google Scholar] [CrossRef] [PubMed] [Green Version]
- Shahid, M.Z.; Chishtie, F.; Bilal, M.; Shahid, I. WRF-Chem Simulation for Modeling Seasonal Variations and Distributions of Aerosol Pollutants over the Middle East. Remote Sens. 2021, 13, 2112. [Google Scholar] [CrossRef]
- Rehman, A.U.; Chishtie, F.; Qazi, W.A.; Ghuffar, S.; Shahid, I.; Fatima, K. Evaluation of Three-Hourly TMPA Rainfall Products Using Telemetric Rain Gauge Observations at Lai Nullah Basin in Islamabad, Pakistan. Remote Sens. 2018, 10, 2040. [Google Scholar] [CrossRef] [Green Version]
- Bilal, M.; Hassan, M.; Tahir, D.B.T.; Iqbal, M.S.; Shahid, I. Understanding the role of atmospheric circulations and dispersion of air pollution associated with extreme smog events over South Asian megacity. Environ. Monit. Assess. 2022, 194, 1–17. [Google Scholar] [CrossRef]
- Bilal, M.; Mhawish, A.; Nichol, J.E.; Qiu, Z.; Nazeer, M.; Ali, M.A.; de Leeuw, G.; Levy, R.C.; Wang, Y.; Chen, Y.; et al. Air pollution scenario over Pakistan: Characterization and ranking of extremely polluted cities using long-term concentrations of aerosols and trace gases. Remote Sens. Environ. 2021, 264, 112617. [Google Scholar] [CrossRef]
- Zaman, S.U.; Pavel, M.R.S.; Joy, K.S.; Jeba, F.; Islam, M.S.; Paul, S.; Bari, M.A.; Salam, A. Spatial and temporal variation of aerosol optical depths over six major cities in Bangladesh. Atmos. Res. 2021, 262, 105803. [Google Scholar] [CrossRef]
- Wagh, S.; Singh, P.; Ghude, S.D.; Safai, P.; Prabhakaran, T.; Kumar, P.P. Study of ice nucleating particles in fog-haze weather at New Delhi, India: A case of polluted environment. Atmos. Res. 2021, 259, 105693. [Google Scholar] [CrossRef]
- Shahid, I.; Kistler, M.; Shahid, M.Z.; Puxbaum, H. Aerosol Chemical Characterization and Contribution of Biomass Burning to Particulate Matter at a Residential Site in Islamabad, Pakistan. Aerosol Air Qual. Res. 2019, 19, 148–162. [Google Scholar] [CrossRef] [Green Version]
- Liu, Y.; Zhou, Y.; Lu, J. Exploring the relationship between air pollution and meteorological conditions in China under environmental governance. Sci. Rep. 2020, 10, 14518. [Google Scholar] [CrossRef] [PubMed]
- Eum, Y.; Song, I.; Kim, H.-C.; Leem, J.-H.; Kim, S.-Y. Computation of geographic variables for air pollution prediction models in South Korea. Environ. Health Toxicol. 2015, 30, e2015010. [Google Scholar] [CrossRef] [PubMed] [Green Version]
- Rahman, M.S.; Azad, M.A.K.; Hasanuzzaman, M.; Salam, R.; Islam, A.R.M.T.; Rahman, M.M.; Hoque, M.M.M. How air quality and COVID-19 transmission change under different lockdown scenarios? A case from Dhaka city, Bangladesh. Sci. Total Environ. 2021, 762, 143161. [Google Scholar] [CrossRef] [PubMed]
- Gurjar, B.R.; Ohara, T.; Khare, M.; Kulshrestha, P.; Tyagi, V.; Nagpure, A.S. South Asian Perspective: A Case of Urban Air Pollution and Potential for Climate Co-benefits in India. In Mainstreaming Climate Co-Benefits in Indian Cities; Exploring Urban Change in South Asia; Springer: Singapore, 2018. [Google Scholar] [CrossRef]
- Shi, S.; Cheng, T.; Gu, X.; Guo, H.; Wu, Y.; Wang, Y.; Bao, F.; Zuo, X. Probing the dynamic characteristics of aerosol originated from South Asia biomass burning using POLDER/GRASP satellite data with relevant accessory technique design. Environ. Int. 2020, 145, 106097. [Google Scholar] [CrossRef] [PubMed]
- Ramachandran, S.; Rupakheti, M.; Lawrence, M.G. Aerosol-induced atmospheric heating rate decreases over South and East Asia as a result of changing content and composition. Sci. Rep. 2020, 10, 20091. [Google Scholar] [CrossRef]
- Yadav, A.; Behera, S.N.; Nagar, P.K.; Sharma, M. Spatio-seasonal Concentrations, Source Apportionment and Assessment of Associated Human Health Risks of PM2.5-bound Polycyclic Aromatic Hydrocarbons in Delhi, India. Aerosol Air Qual. Res. 2020, 20, 2805–2825. [Google Scholar] [CrossRef]
- Begum, B.A.; Hopke, P.K. Ambient Air Quality in Dhaka Bangladesh over Two Decades: Impacts of Policy on Air Quality. Aerosol Air Qual. Res. 2018, 18, 1910–1920. [Google Scholar] [CrossRef] [Green Version]
- Alam, K.; Rahman, N.; Khan, H.U.; Haq, B.S.; Rahman, S. Particulate Matter and Its Source Apportionment in Peshawar, Northern Pakistan. Aerosol Air Qual. Res. 2015, 15, 634–647. [Google Scholar] [CrossRef] [Green Version]
- Biswas, K.F.; Ghauri, B.M.; Husain, L. Gaseous and aerosol pollutants during fog and clear episodes in South Asian urban atmosphere. Atmos. Environ. 2008, 42, 7775–7785. [Google Scholar] [CrossRef]
- Alam, K.; Blaschke, T.; Madl, P.; Mukhtar, A.; Hussain, M.; Trautmann, T.; Rahman, S. Aerosol size distribution and mass concentration measurements in various cities of Pakistan. J. Environ. Monit. 2011, 13, 1944–1952. [Google Scholar] [CrossRef] [PubMed]
- Waheed, S.; Jaafar, M.Z.; Siddique, N.; Markwitz, A.; Brereton, R.G. PIXE analysis of PM2.5 and PM2.5–10 for air quality assessment of Islamabad, Pakistan: Application of chemometrics for source identification. J. Environ. Sci. Health Part A Toxic/Hazard. Subst. Environ. Eng. 2012, 47, 2016–2027. [Google Scholar] [CrossRef]
- Stone, E.; Schauer, J.; Quraishi, T.A.; Mahmood, A. Chemical characterization and source apportionment of fine and coarse particulate matter in Lahore, Pakistan. Atmos. Environ. 2010, 44, 1062–1070. [Google Scholar] [CrossRef]
- Lodhi, A.; Ghauri, B.; Khan, M.R.; Rahman, S.; Shafique, S. Particulate matter (PM2.5) concentration and source apportionment in lahore. J. Braz. Chem. Soc. 2009, 20, 1811–1820. [Google Scholar] [CrossRef]
- Zhang, R.; Khalizov, A.F.; Pagels, J.; Zhang, D.; Xue, H.; McMurry, P.H. Variability in morphology, hygroscopicity, and optical properties of soot aerosols during atmospheric processing. Proc. Natl. Acad. Sci. USA 2008, 105, 10291–10296. [Google Scholar] [CrossRef] [PubMed] [Green Version]
- Irfan, M.; Riaz, M.; Arif, M.S.; Shahzad, S.M.; Hussain, S.; Akhtar, M.J.; van den Berg, L.V.; Abbas, F. Spatial distribution of pollutant emissions from crop residue burning in the Punjab and Sindh provinces of Pakistan: Uncertainties and challenges. Environ. Sci. Pollut. Res. 2015, 22, 16475–16491. [Google Scholar] [CrossRef]
- Alvi, M.U.; Mahmud, T.; Kistler, M.; Kasper-Giebl, A.; Shahid, I.; Alam, K.; Chishtie, F.; Mitu, L. Elemental Composition of Particulate Matter in South-Asian Megacity (Faisalabad-Pakistan): Seasonal Behaviors, Source Apportionment and Health Risk Assessment. Rev. Chim. 2020, 71, 288–301. [Google Scholar] [CrossRef]
- Badarinath, K.V.S.; Kharol, S.K.; Sharma, A.R.; Roy, P.S. Fog Over Indo-Gangetic Plains—A Study Using Multisatellite Data and Ground Observations. IEEE J. Sel. Top. Appl. Earth Obs. Remote Sens. 2009, 2, 185–195. [Google Scholar] [CrossRef]
- Cherian, R.; Venkataraman, C.; Ramachandran, S.; Quaas, J.; Kedia, S. Examination of aerosol distributions and radiative effects over the Bay of Bengal and the Arabian Sea region during ICARB using satellite data and a general circulation model. Atmos. Chem. Phys. 2012, 12, 1287–1305. [Google Scholar] [CrossRef] [Green Version]
- Khan, R.; Kumar, K.R.; Zhao, T.; Ullah, W.; de Leeuw, G. Interdecadal Changes in Aerosol Optical Depth over Pakistan Based on the MERRA-2 Reanalysis Data during 1980–2018. Remote Sens. 2021, 13, 822. [Google Scholar] [CrossRef]
- Alam, K.; Mukhtar, A.; Shahid, I.; Blaschke, T.; Majid, H.; Rahman, S.; Khan, R.; Rahman, N. Source Apportionment and Characterization of Particulate Matter (PM10) in Urban Environment of Lahore. Aerosol Air Qual. Res. 2014, 14, 1851–1861. [Google Scholar] [CrossRef]
- Bulbul, G.; Shahid, I.; Chishtie, F.; Shahid, M.Z.; Hundal, R.A.; Zahra, F.; Shahzad, M.I. PM10 Sampling and AOD Trends during 2016 Winter Fog Season in the Islamabad Region. Aerosol Air Qual. Res. 2018, 18, 188–199. [Google Scholar] [CrossRef] [Green Version]
- Ramachandran, S.; Kedia, S. Aerosol Optical Properties over South Asia from Ground-Based Observations and Remote Sensing: A Review. Climate 2013, 1, 84–119. [Google Scholar] [CrossRef]
- Adam, M.G.; Tran, P.T.M.; Bolan, N.; Balasubramanian, R. Biomass burning-derived airborne particulate matter in Southeast Asia: A critical review. J. Hazard. Mater. 2021, 407, 124760. [Google Scholar] [CrossRef] [PubMed]
- Faisal, A.-A.; Rahman, M.M.; Haque, S. Retrieving spatial variation of aerosol level over urban mixed land surfaces using Landsat imageries: Degree of air pollution in Dhaka Metropolitan Area. Phys. Chem. Earth 2022, 126, 103074. [Google Scholar] [CrossRef]
- Hsu, N.C.; Tsay, S.-C.; King, M.D.; Herman, J.R. Aerosol Properties Over Bright-Reflecting Source Regions. IEEE Trans. Geosci. Remote Sens. 2004, 42, 557–569. [Google Scholar] [CrossRef]
- Bibi, H.; Alam, K.; Chishtie, F.; Bibi, S.; Shahid, I.; Blaschke, T. Intercomparison of MODIS, MISR, OMI, and CALIPSO aerosol optical depth retrievals for four locations on the Indo-Gangetic plains and validation against AERONET data. Atmos. Environ. 2015, 111, 113–126. [Google Scholar] [CrossRef]
- Alam, K.; Trautmann, T.; Blaschke, T.; Majid, H. Aerosol optical and radiative properties during summer and winter seasons over Lahore and Karachi. Atmos. Environ. 2012, 50, 234–245. [Google Scholar] [CrossRef]
- Kaskaoutis, D.G.; Kharol, S.K.; Sinha, P.R.; Singh, R.P.; Badarinath, K.V.S.; Mehdi, W.; Sharma, M. Contrasting aerosol trends over South Asia during the last decade based on MODIS observations. Atmos. Meas. Tech. Discuss. 2011, 4, 5275–5323. [Google Scholar] [CrossRef]
- Cheng, T.; Chen, H.; Gu, X.; Yu, T.; Guo, J.; Guo, H. The inter-comparison of MODIS, MISR and GOCART aerosol products against AERONET data over China. J. Quant. Spectrosc. Radiat. Transf. 2012, 113, 2135–2145. [Google Scholar] [CrossRef]
- Ng, D.H.L.; Li, R.; Raghavan, S.V.; Liong, S.-Y. Investigating the relationship between Aerosol Optical Depth and Precipitation over Southeast Asia with Relative Humidity as an influencing factor. Sci. Rep. 2017, 7, 13395. [Google Scholar] [CrossRef] [PubMed] [Green Version]
- Tyagi, S.; Tiwari, S.; Mishra, A.; Singh, S.; Hopke, P.K.; Singh, S.; Attri, S.D. Characteristics of absorbing aerosols during winter foggy period over the National Capital Region of Delhi: Impact of planetary boundary layer dynamics and solar radiation flux. Atmos. Res. 2017, 188, 1–10. [Google Scholar] [CrossRef]
- Eck, T.F.; Holben, B.N.; Giles, D.M.; Slutsker, I.; Sinyuk, A.; Schafer, J.S.; Smirnov, A.; Sorokin, M.; Reid, J.S.; Sayer, A.M.; et al. AERONET Remotely Sensed Measurements and Retrievals of Biomass Burning Aerosol Optical Properties during the 2015 Indonesian Burning Season. J. Geophys. Res. Atmos. 2019, 124, 4722–4740. [Google Scholar] [CrossRef]
- Mohan, M.; Payra, S. Influence of aerosol spectrum and air pollutants on fog formation in urban environment of megacity Delhi, India. Environ. Monit. Assess. 2009, 151, 265–277. [Google Scholar] [CrossRef]
- Shaikh, K.; Imran, U.; Khan, A.; Khokhar, W.A.; Bakhsh, H. Health risk assessment of emissions from brick kilns in Tando Hyder, Sindh, Pakistan using the AERMOD dispersion model. SN Appl. Sci. 2020, 2, 1290. [Google Scholar] [CrossRef]
- Pham, M.; Boucher, O.; Hauglustaine, D. Changes in atmospheric sulfur burdens and concentrations and resulting radiative forcings under IPCC SRES emission scenarios for 1990–2100. J. Geophys. Res. Atmos. 2005, 110. [Google Scholar] [CrossRef] [Green Version]
- Burgos, M.A.; Mateos, D.; Cachorro, V.E.; Toledano, C.; De Frutos, A.M.; Calle, A.; Herguedas, A.; Marcos-Robles, J.-L. An analysis of high fine aerosol loading episodes in north-central Spain in the summer 2013-Impact of Canadian biomass burning episode and local emissions. Atmos. Environ. 2018, 184, 191–202. [Google Scholar] [CrossRef]
- Tiwari, S.; Payra, S.; Mohan, M.; Verma, S.; Bisht, D.S. Visibility degradation during foggy period due to anthropogenic urban aerosol at Delhi, India. Atmos. Pollut. Res. 2011, 2, 116–120. [Google Scholar] [CrossRef]
- Aldabash, M.; Balcik, F.B.; Glantz, P. Validation of MODIS C6.1 and MERRA-2 AOD Using AERONET Observations: A Comparative Study over Turkey. Atmosphere 2020, 11, 905. [Google Scholar] [CrossRef]
- Shi, H.; Xiao, Z.; Zhan, X.; Ma, H.; Tian, X. Evaluation of MODIS and two reanalysis aerosol optical depth products over AERONET sites. Atmos. Res. 2019, 220, 75–80. [Google Scholar] [CrossRef]
- Lin, M.; Begho, T. Crop residue burning in South Asia: A review of the scale, effect, and solutions with a focus on reducing reactive nitrogen losses. J. Environ. Manag. 2022, 314, 115104. [Google Scholar] [CrossRef] [PubMed]
- Khokhar, M.F.; Yasmin, N.; Chishtie, F.; Shahid, I. Temporal Variability and Characterization of Aerosols across the Pakistan Region during the Winter Fog Periods. Atmosphere 2016, 7, 67. [Google Scholar] [CrossRef] [Green Version]
- Kumar, M.; Parmar, K.S.; Kumar, D.B.; Mhawish, A.; Broday, D.M.; Mall, R.K.; Banerjee, T. Long-term aerosol climatology over Indo-Gangetic Plain: Trend, prediction and potential source fields. Atmos. Environ. 2018, 180, 37–50. [Google Scholar] [CrossRef]
- Norazman, N.H.; Khan, M.F.; Ramanathan, S.; Mustapa Kama Shah, S.; Jani, S.J.; Joy, K.S.; Islam, K.N.; Jeba, F.; Salam, A.; Yoshida, O.; et al. Influence of Monsoonal Driving Factors on the Secondary Inorganic Aerosol over Ambient Air in Dhaka. ACS Earth Space Chem. 2021, 5, 2517–2533. [Google Scholar] [CrossRef]
- Streets, D.G.; Canty, T.; Carmichael, G.R.; De Foy, B.; Dickerson, R.R.; Duncan, B.N.; Edwards, D.P.; Haynes, J.A.; Henze, D.K.; Houyoux, M.R.; et al. Emissions estimation from satellite retrievals: A review of current capability. Atmos. Environ. 2013, 77, 1011–1042. [Google Scholar] [CrossRef] [Green Version]
- Streets, D.G.; Tsai, N.Y.; Akimoto, H.; Oka, K. Sulfur dioxide emissions in Asia in the period 1985–1997. Atmos. Environ. 2000, 34, 4413–4424. [Google Scholar] [CrossRef]
- Colbeck, I.; Nasir, Z.A.; Ali, Z. The state of ambient air quality in Pakistan—A review. Environ. Sci. Pollut. Res. 2010, 17, 49–63. [Google Scholar] [CrossRef] [Green Version]
- Singh, P.; Sarawade, P.; Adhikary, B. Transport of black carbon from planetary boundary layer to free troposphere during the summer monsoon over South Asia. Atmos. Res. 2020, 235, 104761. [Google Scholar] [CrossRef]
- Singh, P.; Sarawade, P.; Adhikary, B. Carbonaceous Aerosol from Open Burning and its Impact on Regional Weather in South Asia. Aerosol Air Qual. Res. 2020, 20, 419–431. [Google Scholar] [CrossRef] [Green Version]
- Qiu, Z.; Ali, M.A.; Nichol, J.E.; Bilal, M.; Tiwari, P.; Habtemicheal, B.A.; Almazroui, M.; Mondal, S.K.; Mazhar, U.; Wang, Y.; et al. Spatiotemporal Investigations of Multi-Sensor Air Pollution Data over Bangladesh during COVID-19 Lockdown. Remote Sens. 2021, 13, 877. [Google Scholar] [CrossRef]
- Asif, Z.; Chen, Z.; Guo, J. A study of meteorological effects on PM2.5 concentration in mining area. Atmos. Pollut. Res. 2018, 9, 688–696. [Google Scholar] [CrossRef]
- Ouyang, H.; Tang, X.; Kumar, R.; Zhang, R.; Brasseur, G.; Churchill, B.; Alam, M.; Kan, H.; Liao, H.; Zhu, T.; et al. Towards Better and Healthier Air Quality: Implementation of WHO 2021 Global Air Quality Guidelines in Asia. Bull. Am. Meteorol. Soc. 2022, 103, E1696–E1703. [Google Scholar] [CrossRef]
Publisher’s Note: MDPI stays neutral with regard to jurisdictional claims in published maps and institutional affiliations. |
© 2022 by the authors. Licensee MDPI, Basel, Switzerland. This article is an open access article distributed under the terms and conditions of the Creative Commons Attribution (CC BY) license (https://creativecommons.org/licenses/by/4.0/).