Article

Variations in Summer Precipitation According to Different Grades and Their Effects on Summer Drought/Flooding in Haihe River Basin

1
Tianjin Climate Center, Tianjin 300074, China
2
College of Air Traffic Management, Civil Aviation University of China, Tianjin 300399, China
*
Authors to whom correspondence should be addressed.
Atmosphere 2022, 13(8), 1246; https://doi.org/10.3390/atmos13081246
Submission received: 6 July 2022 / Revised: 2 August 2022 / Accepted: 4 August 2022 / Published: 5 August 2022
(This article belongs to the Special Issue The Water Cycle and Climate Change)

Abstract

:
The variations in summer precipitation according to different grades and their effects on summer drought/flooding in the Haihe River basin were analyzed using the daily precipitation data from 161 meteorological stations from 1972 to 2021. The results showed that the number of rainy days (NRD) in summer in the Haihe River basin significantly declined in the past 50 years, mainly due to the reduction in the number of light-rain days. The precipitation amount (PA) exhibited prominent interdecadal characteristics, showing an upward tendency in the past 20 years accompanied by a remarkable increase in the proportion of torrential rain. The NRD in the northern part of the basin significantly decreased, while the PA in the southeast showed an increasing trend. Summer drought/flooding was strongly linked to the changes in the NRD and was predominantly affected by intense precipitation, with contribution rates of 5.5%, 16.8%, 31.2%, and 46.5% from light, moderate, heavy, and torrential rain, respectively. The effects of torrential rain increased in recent decades, particularly in the flooding scenarios. In addition, July was the critical period for summer drought/flooding, with the major influence of heavy and torrential rain. The most intense summer rainfall event in the Haihe River basin could contribute from 15% to 29% of total precipitation, resulting in changes in the severity and state of summer drought/flooding, which indicated that the precipitation process had a decisive impact on seasonal drought/flooding. Therefore, when predicting summer precipitation in the Haihe River basin, it is necessary to pay attention to the intense rainfall events during critical periods.

1. Introduction

The Haihe River basin is in central North China and is a major water source for North China and an essential agricultural base in China. However, its per capita water resources are far below the national average, with a fragile ecological environment that is particularly sensitive to climate change. According to previous research studies, the Haihe River basin has been one of the most significant areas of warming and drying in China in recent decades [1,2]. Most areas have experienced severe droughts and prolonged dry periods since the late 1990s [3,4], which will likely continue due to global warming [5]. To mitigate the effects of meteorological droughts on crops, groundwater extraction for irrigation has become the primary measure. This measure has led to a rapid drop in the groundwater table, thus triggering severe hydrological droughts [6]. Meanwhile, extreme precipitation events have frequently occurred in recent years. For instance, parts of North China were affected by extreme precipitation events in August 2010 [7], and a disastrous torrential rain hit Beijing, with maximum daily precipitation reaching 460 mm on 21–22 July 2012 [8,9]. As a result of the significant climate changes and human activities, the ecological environment is deteriorating, and the supply of and demand for water are becoming increasingly severe in this region, which is an important factor limiting socio-economic development. Therefore, researching the characteristics and mechanisms of drought and flooding in this basin is a crucial issue regarding regional disaster prevention and mitigation and the management of water resources and agricultural production.
Summer is the main rainy season in monsoon climate zones, because the majority of the rainfall amount is obtained during this period [10,11]. Affected by the East Asian summer monsoon, more than 65% of the Haihe River basin’s annual precipitation occurs in summer. In addition, summer is the season of the high incidence of catastrophic weather, such as hail and short-duration heavy precipitation, and secondary disasters, such as landslides and mudslides. Along with the considerable interannual fluctuation in precipitation, floods and droughts are prevalent in summer, wreaking havoc on industrial and agricultural production and people’s lives in the region [12]. Therefore, studying summer precipitation in the Haihe River basin, particularly extreme heavy rainfall, is of great significance for understanding and preventing drought and flooding. It has traditionally been one of the hot topics in climate change. As early as the 1980s, studies have focused on summer drought and flooding in the Haihe River basin [13].
In more recent years, a great deal of research has been conducted on the features of summer precipitation and its influencing mechanisms in this basin and North China. It has been found that with the weaknesses of the East Asian summer monsoon since the late 1970s, water-vapor transport from Bay of Bengal, South China Sea, and Indian Ocean have lessened, resulting in a persistent decrease in summer precipitation in North China [14,15,16], thus causing a reduction in annual precipitation and severe drought [17]. In addition, extreme rainfall events that primarily occurred in July and August have significantly reduced [18]. The linear trend of summer precipitation in the Haihe River basin is negligible [19], but the interannual and interdecadal fluctuations are apparent [20]. Extreme heavy precipitation, precipitation intensity, and frequency all tend to decrease in this area [21,22], with a more significant reduction in the northern basin [14] and the rainfall center moving from the northeast to the south [23,24]. The change in extreme heavy precipitation is the main reason for the decrease in summer precipitation [24]. Research based on hourly data has revealed that the intensity of short-term precipitation and its contribution to total rainfall in the Haihe River basin tend to rise, owing to the increased thermal differences between the upper and lower troposphere [25].
However, most previous studies have focused on the interannual and interdecadal variations in the precipitation amount (PA) and the number of rainy days (NRD) in the Haihe River basin without considering their association with summer drought/flooding. In fact, the causal relationships between precipitation events and the climatic characteristics of summer precipitation are direct and closely related. Zhou et al. [26] found that the dominant precipitation grades are essentially different in drought and flood years in the east of Northwest China. In the Haihe River basin, what differences in precipitation grades exist in drought and flood years in summer? What are the effects of different precipitation grades on summer drought/flooding? There is still a lack of systematic research on the issues mentioned above. Therefore, this study quantitatively investigates the contribution of different precipitation grades to summer drought/flooding and explores the interaction between precipitation events and total summer precipitation. This not only enhances the understanding of the mechanisms of drought and flooding but also provides a scientific basis for improving climate prediction and climate service for summer precipitation in the Haihe River basin.
The remainder of this paper is organized in the following manner: The study area, data, and methods are described in Section 2. Section 3 presents the results of our analysis. A discussion is shown in Section 4, and conclusions are provided in Section 5.

2. Materials and Methods
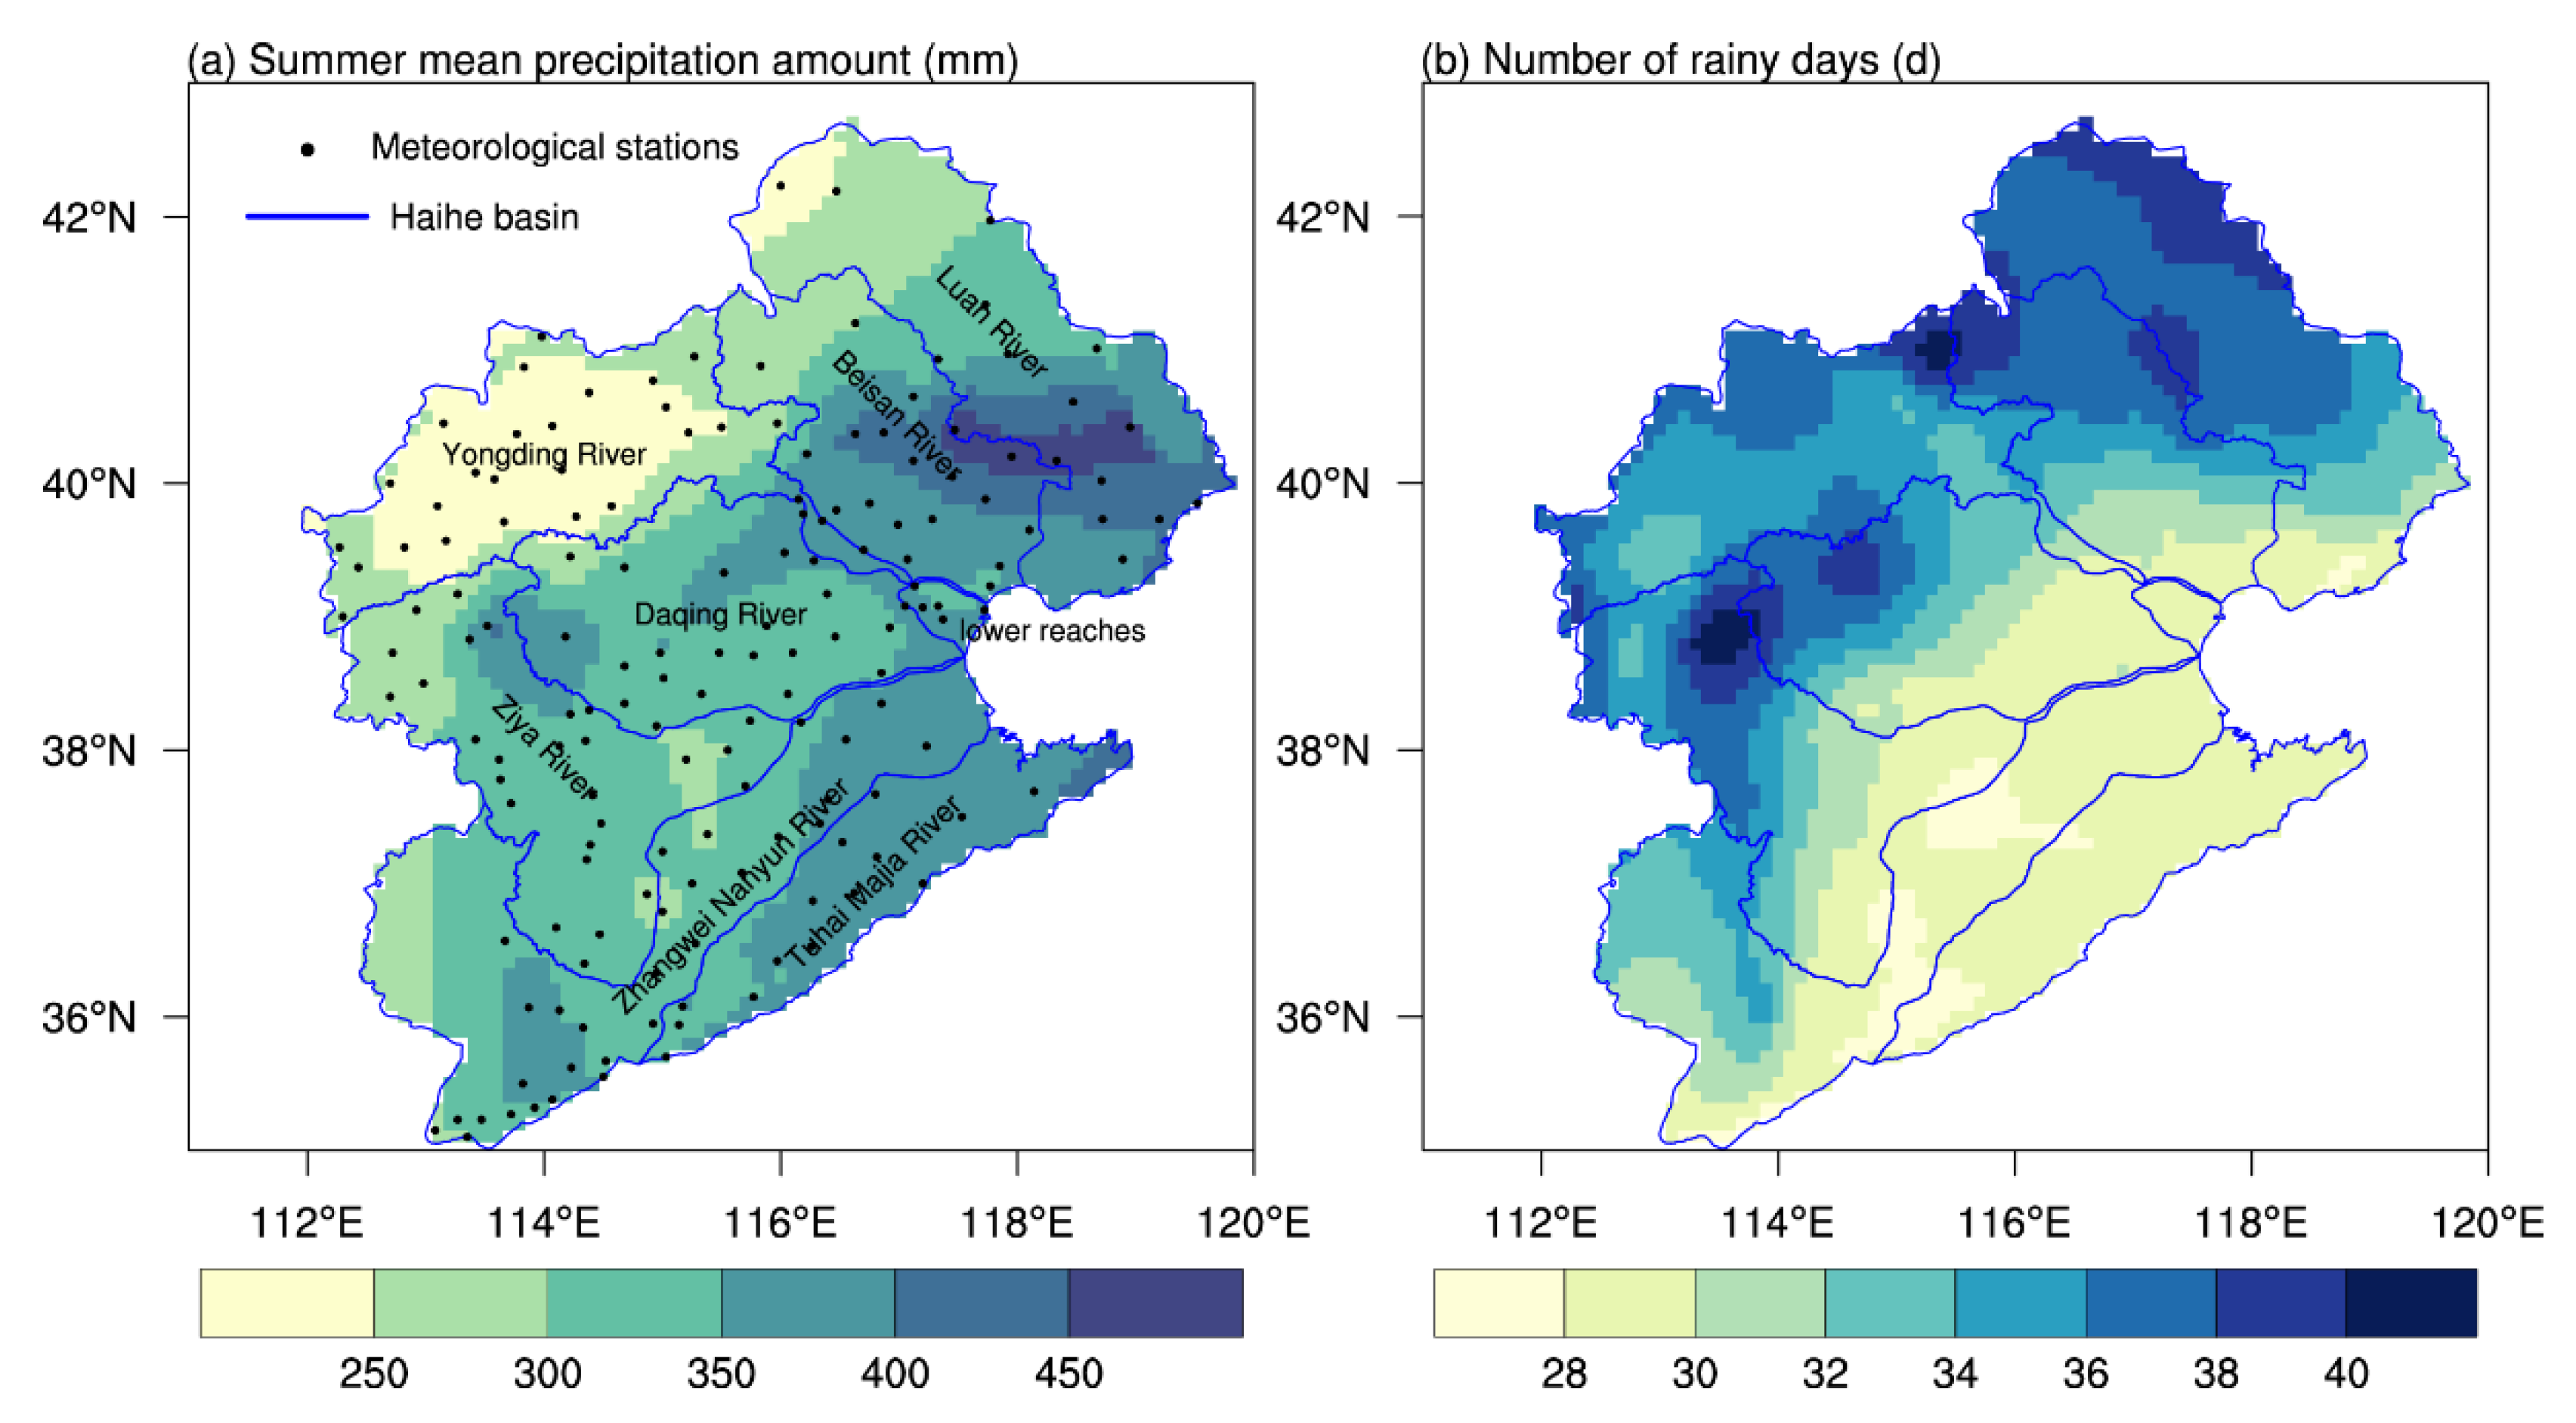
2.1. Study Area

The Haihe River basin ranges 112°–120° E, 35°–43° N; borders with Bohai Sea in the east, Taihang Mountains in the west, Yellow River in the south, and Mongolian Plateau in the north; and encompasses all of Beijing, Tianjin, and Hebei and parts of Inner Mongolia, Shanxi, Henan, Shandong, and Liaoning. It has a total size of less than 300,000 km2, yet the population is densely concentrated, hosting approximately 10% of China’s population. In addition, it consists of 25 large- and medium-sized cities and serves as China’s political, economic, and cultural center, as well as the location of national strategic projects such as “Coordinated Development of the Beijing-Tianjin-Hebei Region” and “Xiongan New Area Construction” [27]. The Haihe River basin comprises 8 sub-valleys, including Luan River, Beisan River, Yongding River, Daqing River, Ziya River, Zhangwei Nanyun River, Tuhai Majia River, and the lower reaches of Haihe River. The basin’s elevation decreases from the northwest to the southeast, with mountains and plateaus covering about 60%.
The Haihe River basin is in the transition zone between the humid and arid zones of eastern China. Annual mean precipitation ranges from 200 to 600 mm, mainly in summer. As shown in Figure 1a, the summer mean PA is 331.2 mm, decreasing from the east to the west, with the maximum value occurring at Xinglong Station in Hebei Province (487.8 mm) and the minimum value at Yingxian Station in Shanxi Province (213.0 mm). Light rain makes up 18.1% of the total summer PA, whereas the other three types of precipitation have a similar proportion (roughly 27%). The summer mean NRD in the Haihe River basin is 32.2 days, with high values in the northwest and low values in the southeast. Around 70.5% of rainy days present light rain, followed by moderate and heavy rain, which account for 17.4% and 8.4%, respectively. Torrential-rain days are only 1.2 days on average in the basin. Generally, the northwest basin is dominated by light and moderate rain. In contrast, the southeastern part, especially in the Bohai Rim region, is dominated by torrential rain, with the PA and NRD exceeding two times the regional average (Figure S1).

2.2. Data and Methods

The daily precipitation data here adopted were provided by China Meteorological Administration (http://data.cma.cn, accessed on 6 July 2022). These original data were quality-controlled by National Meteorological Information Center of China [28,29] and are widely used in terms of data assimilation, weather- and climate-model initialization, and climate-change assessments [30,31,32]. A large number of missing values exist for the original data before 1972. The daily precipitation data in summers (June–August) 1972–2021 from 161 meteorological stations in the Haihe River basin were chosen. The distribution of the meteorological stations is given in Figure 1a. Among the 161 stations, 95% of stations had no missing data of the 50 years. Missing values were interpolated with the regional average of the corresponding day. Based on the daily data, precipitation was categorized into four grades, light rain (0.1–10 mm), moderate rain (10–25 mm), heavy rain (25–50 mm), and torrential rain and above (≥50 mm; hereinafter referred to as torrential rain), according to the national standard of GB/T 28592-2012 [33].
The unstructured station data were interpolated to a 0.1° latitude × 0.1° longitude grid using natural-neighbor interpolation. The 30-year average was utilized to represent the climate state, which was recommended by the fifth assessment report of Intergovernmental Panel on Climate Change [34]. This study used the last 3 decades (1991–2020). To highlight the link between the changes in different precipitation grades and summer drought/flooding, nine levels of drought and flooding were defined according to the requirements of China Meteorological Administration for climate prediction. It was considered that there were no obvious precipitation variations when the change was less than 10%, which was defined as a normal scenario, while summer drought/flooding appeared otherwise. The names and thresholds of the nine levels, including 3 drought scenarios, 2 normal scenarios, and 4 flooding scenarios, are given in Table 1. The changes in four precipitation grades and their contribution to summer drought/flooding were then calculated. The contribution rate was defined as the ratio of the precipitation anomalies according to the different grades to the summer-precipitation anomalies. A probability density function was adopted to describe the distribution of the different precipitation grades. It is a function that specifies the likelihood of a random variable falling within a particular range of values in the sample space [35]. In addition, regression analyses and correlation analyses were used in this study to calculate linear trends and linear correlation coefficients. The statistical significance of the trends and correlation coefficients were determined according to the two-tailed probability of the Student’s t-test.

3. Results

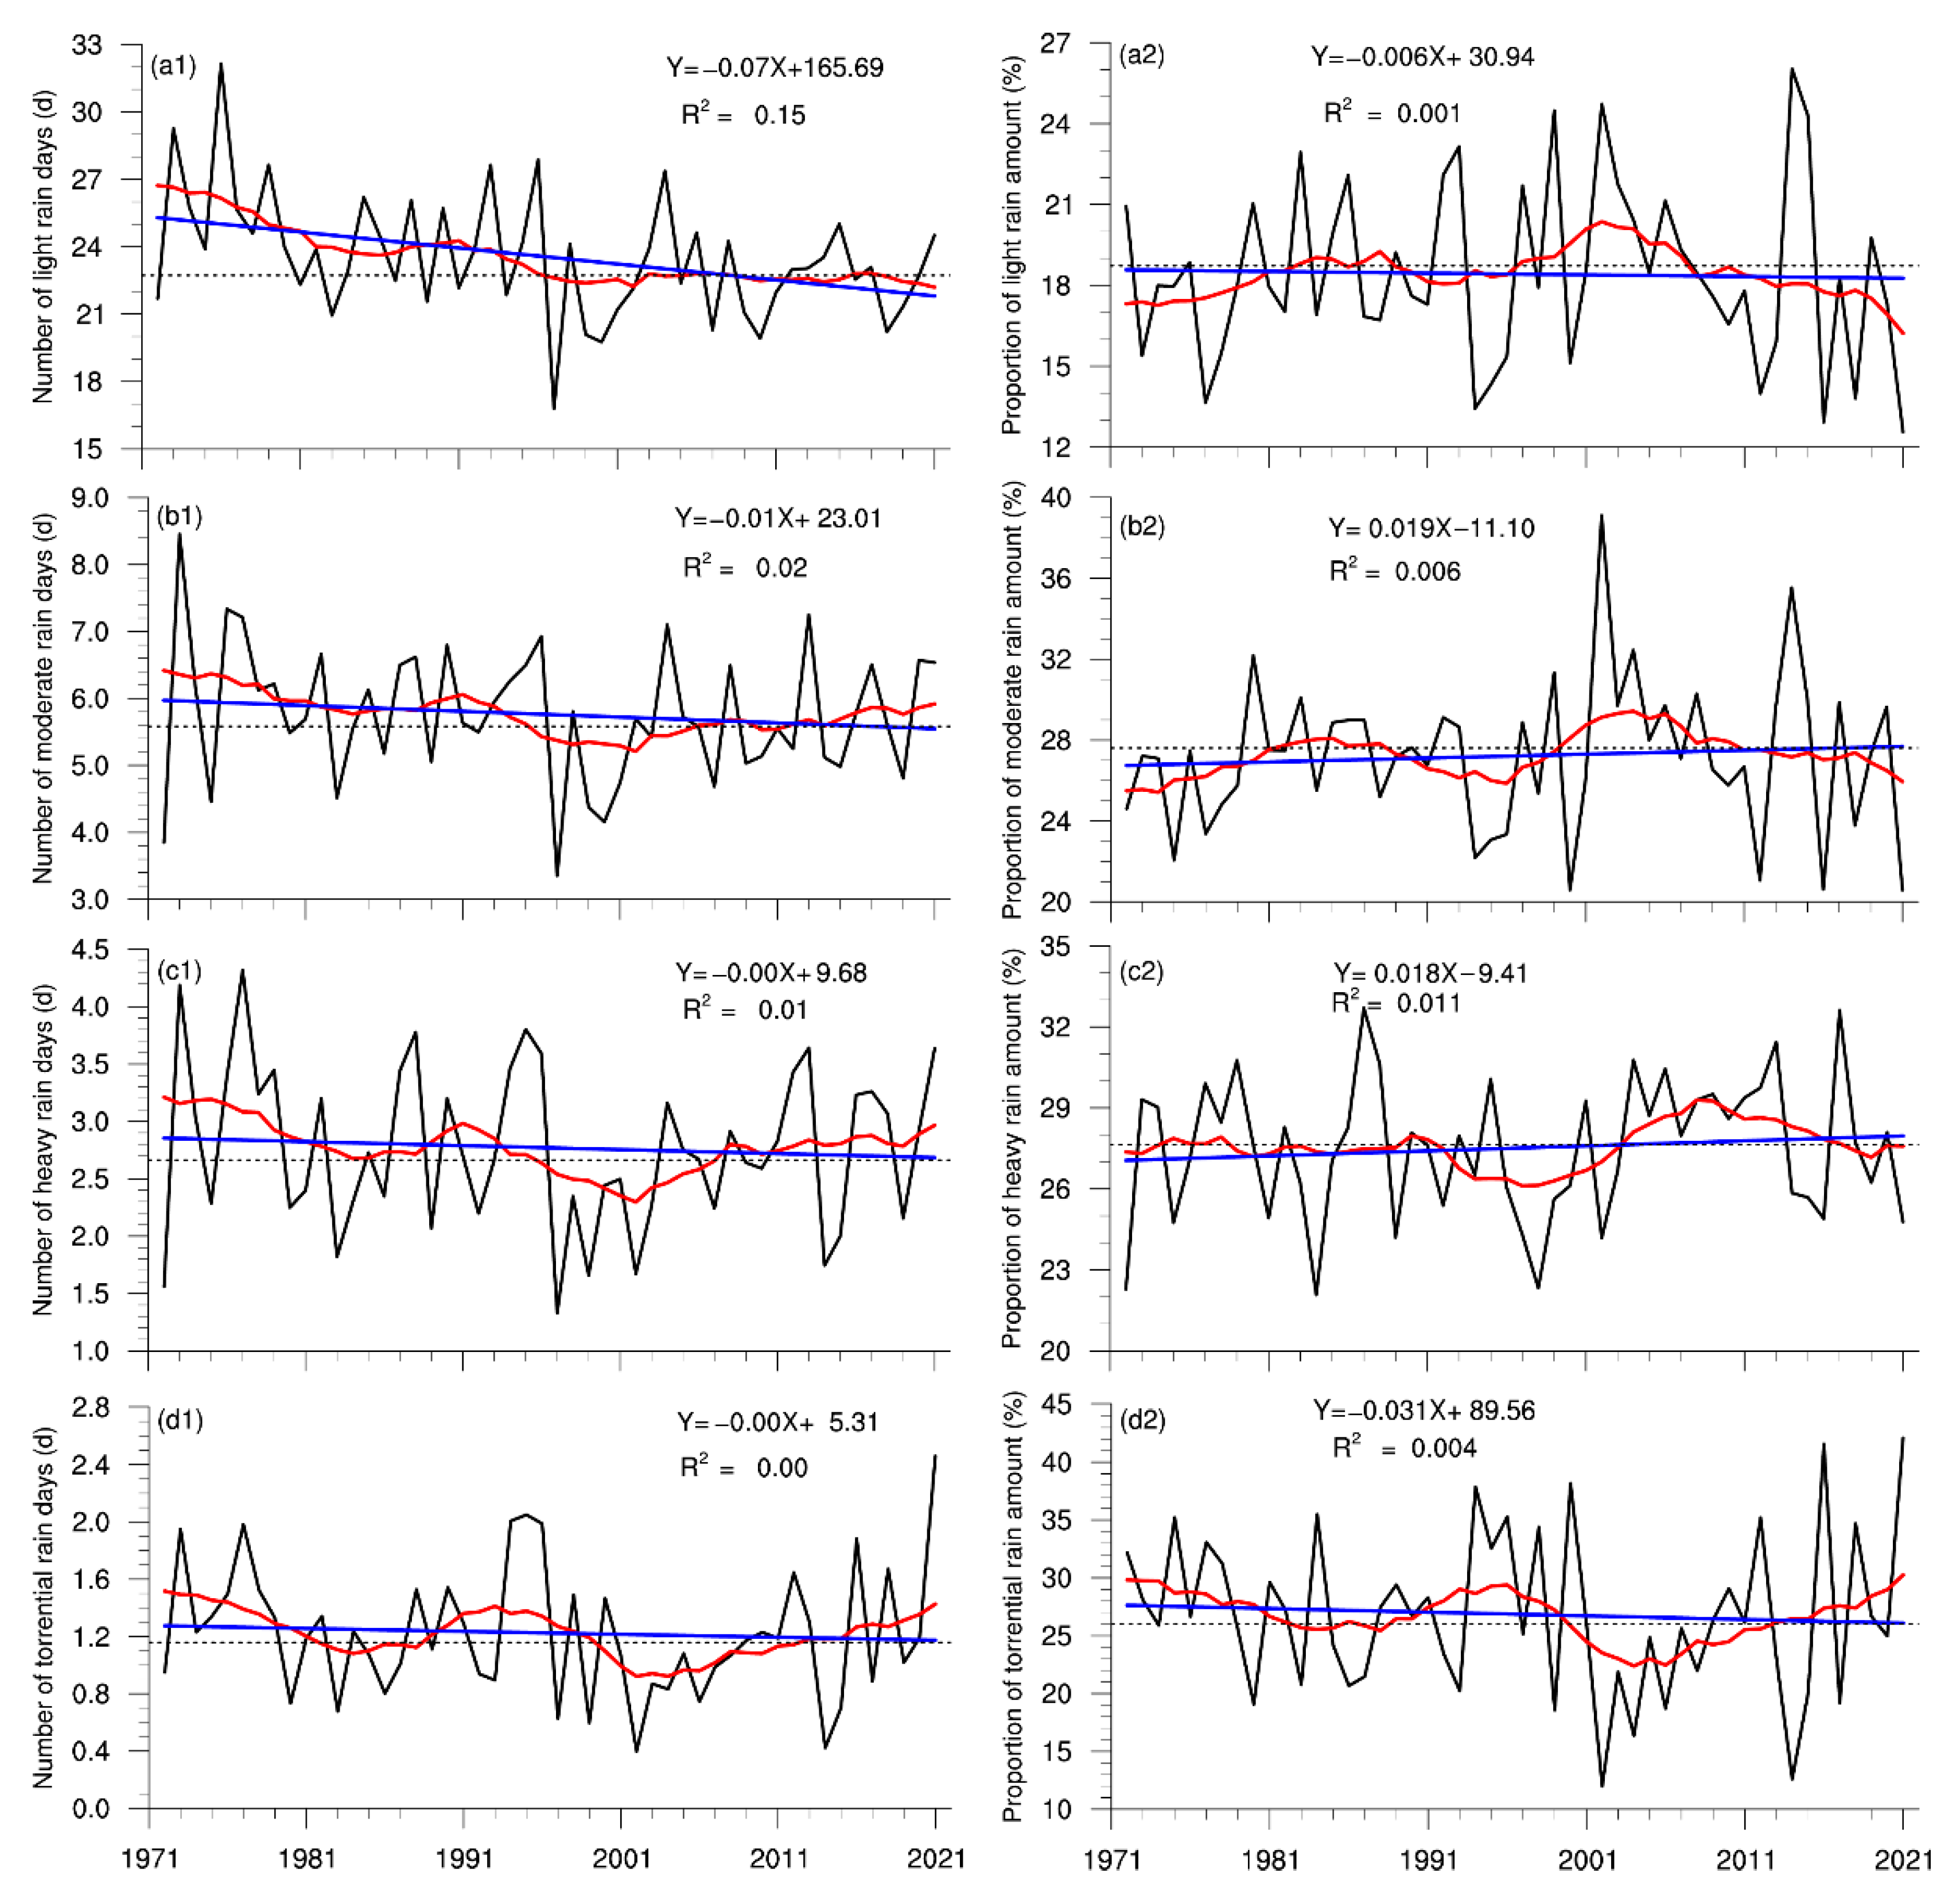
3.1. Variation in Summer Precipitation According to Different Grades

The time series of the summer PA and NRD in the Haihe River basin from 1972 to 2021 are plotted in Figure 2. Over the last 50 years, a significant decrease in the NRD occurred at a rate of −0.85 d/10 year. Two distinct periods existed: a reduced period from 1972 to 2000 at a rate of −2.1 d/10 year and a subsequent steady period, with the NRD remaining around 32 days. As shown in Figure 3, the number of light-rain days significantly decreased over the whole period at a rate of 0.71 d/10 year, while the long-term trends for moderate, heavy, and torrential rain were not remarkable. It was noted that the NRDs according to the four grades all decreased before 2000, and the change in light rain was the most substantial. Since then, the number of light-rain days continued to decrease, but the NRDs according to the other three precipitation grades presented increasing trends. The upward trend of heavy and torrential rain was the most significant, which coincides with the results of Zhao et al. [36]. Therefore, the reduction in light-rain days was the main reason for the Haihe River basin’s decline in the NRD.
The long-term variability in the PA was insignificant compared to that in the NRD, despite a decreasing trend over the whole period. Still, it was highly connected with the NRD on the interannual scale, with a correlation coefficient of 0.78. Among them, the largest precipitation occurred in 2021, reaching 511.7 mm, and the smallest was in 1997, with a PA of 188.8 mm. Unlike the NRD, the summer PA continued to increase at a rate of 51 mm/10 year after 2000. As a result, summer precipitation intensity in the Haihe River basin was dominated by interannual fluctuations before 2000 and then exhibited an increasing trend (Figure S2). There were no obvious long-term trends in the PAs according to the different grades. They were consistent with the variation in the NRDs on the interannual and interdecadal scales, with correlation coefficients exceeding 0.95 (Figure S3). This suggests that the variation in the summer PA in the Haihe River basin is closely related to the NRD. Figure 3 illustrates that the proportions of the four precipitation grades had no significant linear trends during the entire period but were characterized by obvious interannual and interdecadal variability. The changes in the proportions of light and moderate rain exhibited good consistency, with a quasi-20-year cycle before 2000 and a significant decrease in the past 20 years. The proportion of torrential rain was opposite to those of light and moderate rain, being higher in the 1990s and gradually decreasing as the NRD decreased, reaching a minimum around 2000; then, it increased and remained at a high level, followed by an increase in the NRD. Although the PA and NRD of heavy rain changed in the last 50 years, its proportion mostly remained constant.
The above analyses showed obvious precipitation changes in the Haihe River basin, but the variability was spatially heterogeneous (Figure 4). In most areas of the Haihe River basin from 1972 to 2021, the summer NRD decreased by 2–10 days, with the most pronounced changes occurring in the northern part with a reduction rate of more than 1.5 d/10 yr. Since light rain accounted for more than 70% of the summer NRD, its trend was almost the same as that of the total rainy days, but the change was significant, with more than 40.9% of the area passing the 95% significance test. In fact, the decisive effect of light-rain days on the total rainy days could be seen throughout the year [37]. A downward trend also dominated the change in the number of moderate rain days, and 73.2% of the basin exhibited this tendency, with large-value regions exceeding 0.4 d/10 year in the basin’s northwest and northeast. In general, there were no apparent trends in the number of heavy-rain days, and only 5.4% of the basin saw substantial changes; specifically, the northern border area increased, while the areas close to Beijing and Tianjin decreased. The number of torrential-rain days in the central part of the basin showed a decreasing trend, with a rate of more than 0.2 d/10 year in the southern part of Daqing River, whereas those in Tuhai Majia River, the southwest of Ziya River and parts of Zhangwei Nanyun River presented an increasing trend.
The summer NRDs according to the different precipitation grades in the Haihe River basin were dominated by a decline, with a more noticeable drop in the northern part. At the same time, the number of torrential-rain days in the southeast exhibited a rising tendency. The spatial distribution of the PA trends was fairly consistent with those of the NRDs (Figure S4), with the spatial correlation coefficients of 0.88, 0.97, 0.98, and 0.94 for the four precipitation grades. Additionally, the trends of the total PA and torrential-rain amount showed consistent spatial distribution, indicating that the summer precipitation changes in the Haihe River basin were primarily caused by changes in torrential rain.

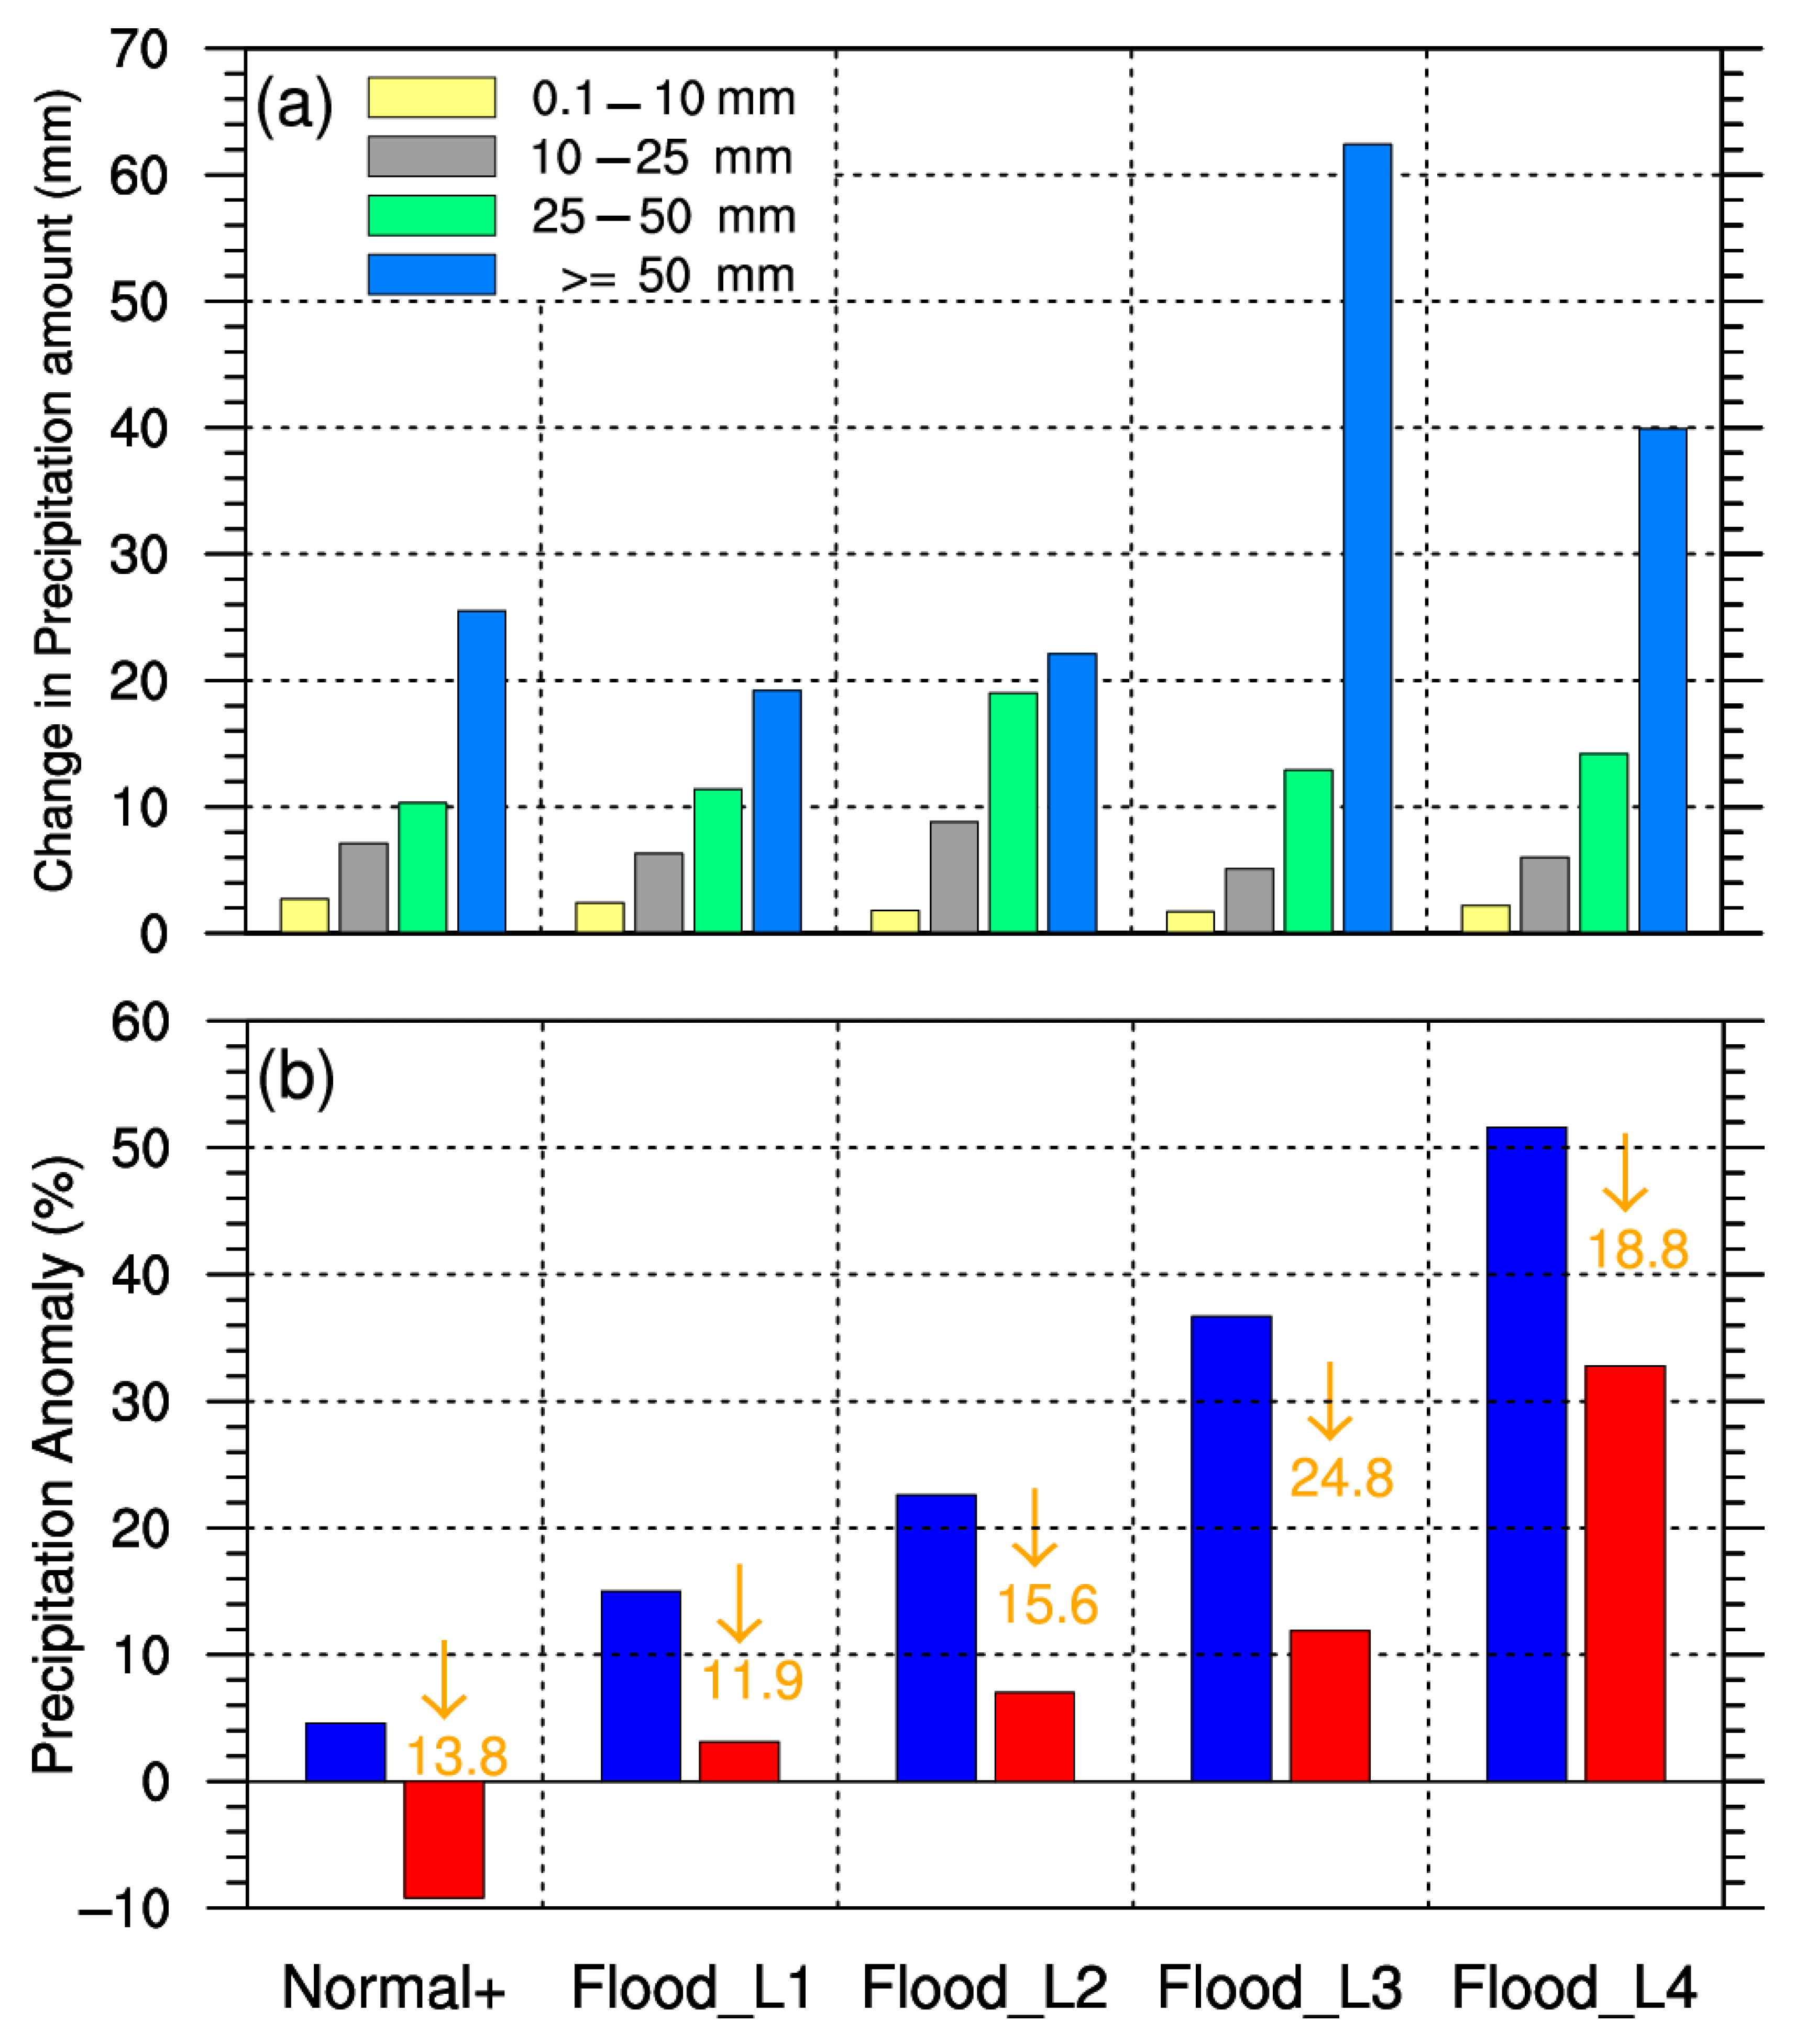
3.2. Effects of Different Precipitation Grades on Summer Drought/Flooding

As seen in Figure 2, the similar fluctuations and trends in the summer PA and NRD from 1972 to 2021 indicated a significant correlation between the two variables. To verify this conclusion, scatter plots of the NRDs according to the different grades and the summer precipitation anomaly percentages (PAPs) are separately given in Figure 5. Their relationships were investigated using correlation analyses, which showed significantly positive correlations. The correlation coefficients for light and moderate rain were 0.54 and 0.78, and for heavy and torrential rain, they were 0.93 and 0.92, respectively. This indicated that summer drought/flooding in the Haihe River basin had a stronger response to heavy and torrential rain than to light and moderate rain. Therefore, the changes in the NRD with precipitation over 25 mm could roughly represent the changes in summer precipitation in the Haihe River basin. In addition, there was a significantly positive correlation between the summer PAs and the NRDs at each station in the basin. The relationship generally got stronger with the increase in the precipitation grade (Figure S5).
Figure 6 and Table 2 present the variations in the four precipitation grades and their contribution to summer drought/flooding for various levels of drought and flooding in summer. Due to the large differences in the NRDs according to the different precipitation grades, the anomaly percentage was used to quantitatively describe the relative contribution of different precipitation grades. The anomalies in the PAs were only about 10 mm in the two normal scenarios. Thus, only the contribution rates for three drought and two flooding scenarios were calculated to highlight the effects of the different precipitation grades on summer drought/flooding. The results demonstrated that the PAs and the NRDs according to the different grades were larger (smaller) than the climatic average in the drought (flooding) scenarios. The changes significantly increased as summer drought/flooding severity and precipitation intensity increased. The contribution of heavy rain to total summer precipitation was equivalent to that of torrential rain in the Flood_L2 scenario, while the increases (decreases) in the torrential-rain amount and the number of torrential-rain days were the largest for the other drought/flooding levels. The contribution rates were larger than 40%, indicating that torrential rain was the primary factor affecting summer drought/flooding in the Haihe River basin. The effect of heavy rain on summer drought/flooding was also important, with contribution rates ranging from 24.6% to 39.8% for different levels of drought and flooding. On the contrary, light rain contributed little, with a contribution rate of 2.7–7.1%, and the difference in the variation in the light-rain amount between the Flood_L4 and Drought_L3 scenarios was just 18 mm. On average, the relative contribution rates of light, moderate, heavy, and torrential rain to summer drought/flooding in the Haihe River basin were 5.5%, 16.8%, 31.2%, and 46.5%, respectively. This indicated that summer drought/flooding in the Haihe River basin was mostly driven by variations in torrential rain.
As the proportion of torrential rain exhibited a remarkable increase in the past 20 years, the contribution rates in two periods (1972–1996 and 1997–2021) were calculated to reveal the effects of torrential rain in different periods (Table 3). The results illustrated that there were no significant differences between the two periods in the drought scenarios, but the contribution of torrential rain was considerably larger in the most recent 25 years (69.1%) than in 1972–1996 (36.0%) in the flooding scenarios. Overall, the effects of torrential rain on summer drought/flooding tended to increase with the proportion of the torrential-rain amount. In addition, the ratios of the NRDs and PAs according to the different precipitation grades to the climatic average were comparable for all levels of drought and flooding, indicating that the change in the NRD was significantly correlated with the severity of summer drought/flooding. The intensities of light, moderate, and heavy rain were essentially the same under all circumstances and were 2.6 mm/d, 16.0 mm/d, and 34.5 mm/d, respectively. Minor variations in the intensity of torrential rain existed, with the lowest and maximum values of 71.2 mm/d and 83.9 mm/d. Additionally, there were no discernible differences in the probability-density-function distributions of the PAs according to the four precipitation grades for the various levels of drought and flooding (Figure S6). This meant that the change in the NRD could essentially represent the severity of seasonal drought and flooding, which is consistent with research conclusions in North China [38,39]. As a result, when predicting the summer precipitation in the Haihe River basin, a prediction model can be established for the NRD, particularly that relative to the torrential rain. This concept is widely used in extended-period precipitation prediction [40].
Daily precipitation anomalies in summer relative to the period of 1991–2020 for different levels of drought and flooding are shown in Figure 7a, which illustrates that July was the critical period affecting summer drought/flooding in the Haihe River basin. This was because summer precipitation in the Haihe River basin was mainly concentrated in July, contributing 44.3% of total summer precipitation (Figure 7b). The changes in precipitation in July significantly impacted summer drought/flooding. In the four flooding scenarios, the center of the maximum precipitation anomaly appeared in middle and late July. The daily precipitation anomaly on the 5th Hou (5-day average) of July exceeded 5 mm in the Flood_L1 scenario, which was the critical period triggering excess precipitation. As the flooding severity increased, the key period extended toward early August and late June. As a result, the Haihe River basin experienced greater precipitation from late June to early August in the Flood_L4 scenario. For the three drought scenarios, the precipitation anomalies were negative throughout most of summer, with three obvious key periods occurring in the 2nd Hou of July, the 5th Hou of July, and the 2nd Hou of August. The three critical periods were also periods of high precipitation in the Haihe River basin (Figure 7b). Among them, the negative center of the 2nd Hou of July was present in all the drought scenarios, while the other two only existed in the Drought_L2 and Drought_L3 scenarios. The above results indicated that summer drought in the Haihe River basin was caused by a consistent deficiency in water vapor throughout the season, but drought severity was determined by the changes in precipitation during crucial periods. Further investigation revealed that the changes in heavy and torrential rain during the critical periods were obvious and consistent with total precipitation, while the precipitation anomalies in light and moderate rain were relatively uniform throughout the whole summer with no clear key periods (Figure S7).
The above analysis revealed the decisive role of torrential rain on summer drought/flooding in the Haihe River basin from the perspective of climate average. The following is an evaluation of the impact of intense rainfall events on summer precipitation. Taking the cumulative precipitation for two consecutive days as the standard, the most intense summer precipitation process in the Haihe River basin was selected to study the differences in the different precipitation grades and the summer PAPs before and after the removal of the precipitation process. As shown in Figure 8, the strongest precipitation process mainly affected the changes in torrential rain, and the reduction was larger than that of the other three types of precipitation in any scenario. The variation in the torrential-rain amount varied obviously with the change in summer flooding severity, while there were no significant differences in the amounts of light, moderate, nor heavy rain. The changes in the PAPs indicated that intense rainfall events substantially impacted summer drought/flooding in the Haihe River basin. In different drought and flooding scenarios, the strongest precipitation process could contribute from 15% to 29% of total summer precipitation. The strongest precipitation process had a decisive effect on summer drought/flooding in the normal+, Flood_L1, Flood_L2, and Flood_L3 scenarios. After removal, the summer flooding situation essentially turned normal, with a PAP of less than 10%. Especially in the normal+ scenario, the state of summer drought and flooding changed with a negative PAP. In fact, predicting the climate of years with weak anomalous signals is one of the difficulties of climate prediction. In the Flood_L4 scenario, the strongest precipitation process that contributed 22.5% of total summer precipitation was insufficient to alter the severity of summer flooding for the whole season, indicating that extreme flooding in the Haihe River basin was the result of a series of intense rainfall events. The influence of intense rainfall events should be considered when predicting summer precipitation.

4. Discussion

Although the above analyses demonstrate the dominant effect of torrential rain on summer drought/flooding in the Haihe River basin, this does not mean that light rain is not important for drought and flooding. In fact, the decrease in the NRD in eastern China is mostly caused by the considerable reduction in the frequency of light- and trace-rain days [41,42,43], which is an important indicator of the aridification of northern China [44,45]. Therefore, variations in the NRDs, especially with respect to light-rain days, play an essential role in climate change. Some previous studies have also found that in North China, variations in precipitation frequency contribute much more to precipitation trends than variations in intensity and that frequency trends are primarily responsible for precipitation changes [39,46]. This finding is in accordance with our results illustrated in Figure 6. In addition, in this study, summer drought/flooding refers to the deficit or excess of seasonal precipitation compared with the climatic average, which mainly focuses on meteorological drought on a seasonal scale. However, drought is a comprehensive process related to various meteorological variables, such as precipitation, temperature, wind speed, etc. [47]. It can be classified into meteorological, agricultural, and hydrological droughts and can be detected using various indices [48]. The decrease in the number of light-rain days is not favorable for the growth of vegetation [49]. Hence, agricultural droughts may occur with excess precipitation due to the increase in the proportions of heavy and torrential rain.
In addition, the distributions of and changes in the summer PAs according to the different grades were spatially heterogeneous in the drought and flooding scenarios. As shown in Figure 9, different precipitation grades increased to different degrees as the total PA increased. The change in the torrential-rain amount was the most obvious, with a difference of 67.2 mm between the flooding and drought scenarios, accounting for 43.4% of the difference in the total PA. Moderate rain predominated in the drought scenarios, while heavy and torrential rain contributed more in the flooding scenarios, making up around 60% of the total summer PA. Spatially, the southeast of the basin was dominated by heavy and torrential rain, with the contribution of torrential rain exceeding 30%. In contrast, the northwest was dominated by light rain, with the light-rain amount exceeding 95 mm and the heavy-rain amount being less than 30 mm. This was mostly related to the topography of the mountains in this region. Due to the high altitude, it is difficult for the southeast water vapor to cross Yanshan and Taihang Mountains, resulting in the lack of water-vapor conditions for the formation of torrential rain in this region. In the southeast of this region, the low-level warm and humid airflow is blocked by the mountains, causing uplifting movements on the windward slope. The airflow then combines with the center of the mid–high-level upward movements brought on by the uplift of the weather system, increasing the precipitation intensity. This is one of the reasons for the high amounts of heavy and torrential rain in the central and eastern parts of the basin [50]. Additionally, the spatial distributions of the NRDs according to the different grades were largely identical to those of the PAs (Figure S8), and the total PA and NRD in summer were compatible with the results of torrential rain and light rain, respectively.
Changes in the summer PAs according to the different grades relative to the climatic average in the drought and flooding scenarios are shown in Figure 9(a2–e2). The results exhibited that the anomalies in the PAs according to the different grades in the flooding scenarios were all positive, with the northern region of Tianjin experiencing the greatest increase in total precipitation. The change in light rain was generally less than 15 mm and decreased from the west to the east, with the high-value areas being located to the south of Yongding River and Ziya River. Except for some small values in the south, there were few variations in the moderate-rain anomaly, ranging from 15 to 25 mm. Daqing River and Ziya River had large values of heavy-rain anomaly, whereas the northwest and southern areas exhibited small values. Similar to total precipitation, torrential rain was distributed with larger values in the southeast and smaller values in the northwest. In the drought scenarios, the summer precipitation anomalies typically decreased from the southeast to the northwest to varying degrees for the four grades. The central and southern parts of the basin, such as parts of Ziya River and Daqing River, were where light rain decreased the most. The anomalies in moderate and heavy rain presented indistinct spatial characteristics, while the regional distribution of torrential rain changes was mostly consistent with the results of total precipitation.

5. Conclusions

In this paper, the variations in summer precipitation according to the different grades in the Haihe River basin and their effects on summer drought/flooding were investigated using 50-year (1972–2021) observational data. The results exhibited an observable downward trend for the summer NRDs over the past several decades, mostly attributable to a decrease in light-rain days. The PAs according to the different grades had no obvious long-term trends but were strongly correlated with the NRDs on the interannual scale. In addition, the PAs exhibited clear interdecadal characteristics, showing an upward trend over the past 20 years, along with a remarkable increase in the proportion of torrential rain. Spatially, the northwest of the basin was dominated by light rain, while the southeast experienced more heavy and torrential rain. The NRDs were characterized by reductions according to the different precipitation grades, which was more apparent in the northern part of the basin. The PA in the southeast showed an increasing trend, and its spatial distribution was mainly caused by torrential rain.
From the perspective of summer drought/flooding, the PAs and the NRDs according to the different grades were larger (smaller) than the climatic average for the flooding (drought) scenarios in summer, and the changes became substantially more pronounced as drought/flooding severity and precipitation intensity increased. Summer drought/flooding in the Haihe River basin was mostly impacted by torrential rain, according to the average contribution rates of light, moderate, heavy, and torrential rain to the variations in total summer precipitation, which were 5.5%, 16.8%, 31.2%, and 46.5%, respectively. The effects of torrential rain increased in recent decades, particularly in the flooding scenarios. In addition, the variation in the NRDs could basically represent the severity of summer drought/flooding. Moderate rain dominated the basin in the drought scenarios, whereas heavy and torrential rain made up around 60% of total summer precipitation in the flooding scenarios. July was the critical period for summer drought/flooding, with the major influence of heavy and torrential rain. The largest precipitation anomalies in the flooding scenarios appeared in middle and late July. The critical period extended to early August and late June with the increase in flooding severity. The drying in summer was caused by the shortage of water vapor that persisted throughout the season, but precipitation in the three key periods of the 2nd Hou in July, the 5th Hou in July, and the 2nd Hou in August determined the severity of the summer drought. Summer drought/flooding in the Haihe River basin was significantly influenced by the precipitation events. The strongest summer precipitation process could provide from 15% to 29% of total summer precipitation, changing the severity and state of seasonal drought and flooding.
In summary, summer drought/flooding in the Haihe River basin was mainly affected by the changes in the number of torrential-rain days. Therefore, when predicting the summer precipitation in the Haihe River basin, it is necessary to pay attention to the intense rainfall events, especially during the critical precipitation period in July. Establishing prediction models for the frequency of torrential rain may be simple and effective for improving the prediction skills. It should be noted that this study merely examined the characteristics of different precipitation grades for various levels of drought and flooding in summer. What differences exist in the major climatic systems that affect the climate of the Haihe River basin in drought and flood years? To what degree do they influence the different precipitation grades? What are the sources of water vapor for intense rainfall? More investigation is needed to fully comprehend these mechanisms.

Supplementary Materials

The following supporting information can be downloaded at: https://www.mdpi.com/article/10.3390/atmos13081246/s1, Figure S1: Spatial distributions of the summer PA according to the different grades in the Haihe River basin for the period of 1991–2020 (a, light rain; b, moderate rain; c, heavy rain; d, torrential rain), Figure S2: Time series of summer precipitation intensity in the Haihe River basin for the period of 1972–2021 (the red line is the 11-year moving average, and the blue lines are the trend lines for the periods of 1972–2000 and 2001–2021), Figure S3: Time series of the summer PA according to the different grades in the Haihe River basin for the period of 1972–2021 (the blue lines are the trend lines, and the red lines are the 11-year moving average), Figure S4: Spatial distributions of trends in the summer PA according to the different grades for the period of 1972–2021 (a, light rain; b, moderate rain; c, heavy rain; d, torrential rain). The dotted areas denote significant trends at the 95% confidence level, Figure S5: Spatial distributions of correlation coefficients between the summer PA and NRD according to the different grades for the period of 1972–2021 (a, light rain; b, moderate rain; c, heavy rain; d, torrential rain), Figure S6: Probability density function distributions of the PA according to the different grades for different levels of drought and flooding (a, light rain; b, moderate rain; c, heavy rain; d, torrential rain), Figure S7: Daily precipitation anomalies in summer according to the different grades relative to the period of 1991–2020 for different levels of drought and flooding (a, light rain; b, moderate rain; c, heavy rain; d, torrential rain). Jun.1 means the first ten days of June, etc., Figure S8: Spatial distributions of the summer NRD according to the different precipitation grades in the drought and flooding scenarios (a, total precipitation; b, light rain; c, moderate rain; d, heavy rain; e, torrential rain).

Author Contributions

Conceptualization, S.C. and J.G.; methodology, S.C. and N.M.; validation, N.M., S.L. and N.F.; formal analysis, S.C. and J.X.; writing—original draft preparation, S.C. and J.X.; writing—review and editing, J.G. and N.F. All authors have read and agreed to the published version of the manuscript.

Funding

This research study was funded by National Key R&D Program of China (grant No. 2020YFB1600103), National Natural Science Foundation of China (grant No. 41805058) and Doctoral Fund of Tianjin Meteorological Bureau (grant No. 201917bsjj03).

Institutional Review Board Statement

Not applicable.

Informed Consent Statement

Not applicable.

Data Availability Statement

The datasets generated and analyzed during the current study are not publicly available but are available from the corresponding author upon reasonable request.

Acknowledgments

The precipitation data were provided by National Meteorological Information Center of China.

Conflicts of Interest

The authors declare no conflict of interest.

References

  1. Cheng, S.; Guan, X.; Huang, J.; Ji, F.; Guo, R. Long-term trend and variability of soil moisture over East Asia. J. Geophys. Res. Atmos. 2015, 120, 8658–8670. [Google Scholar] [CrossRef] [Green Version]
  2. Cheng, S.; Huang, J. Enhanced soil moisture drying in transitional regions under a warming climate. J. Geophys. Res. Atmos. 2016, 121, 2542–2555. [Google Scholar] [CrossRef]
  3. Zheng, J.; Yu, Y.; Zhang, X.; Hao, Z. Variation of extreme drought and flood in North China revealed by document-based seasonal precipitation reconstruction for the past 300 years. Clim. Past 2018, 14, 1135–1145. [Google Scholar] [CrossRef] [Green Version]
  4. Zou, X.; Zhai, P.; Zhang, Q. Variations in droughts over China: 1951–2003. Geophys. Res. Lett. 2005, 32, L04707. [Google Scholar] [CrossRef]
  5. Li, W.; Pan, R.; Jiang, Z.; Chen, Y.; Li, L.; Luo, J.-J.; Zhai, P.; Shen, Y.; Yu, J. Future changes in the frequency of extreme droughts over China based on two large ensemble simulations. J. Clim. 2021, 34, 6023–6035. [Google Scholar] [CrossRef]
  6. Feng, W.; Zhong, M.; Lemoine, J.M.; Biancale, R.; Hsu, H.T.; Xia, J. Evaluation of groundwater depletion in North China using the Gravity Recovery and Climate Experiment (GRACE) data and ground-based measurements. Water Resour. Res. 2013, 49, 2110–2118. [Google Scholar] [CrossRef]
  7. Orsolini, Y.J.; Zhang, L.; Peters, D.H.; Fraedrich, K.; Zhu, X.; Schneidereit, A.; van den Hurk, B. Extreme precipitation events over north China in August 2010 and their link to eastward-propagating wave-trains across Eurasia: Observations and monthly forecasting. Q. J. R. Meteorol. Soc. 2015, 141, 3097–3105. [Google Scholar] [CrossRef]
  8. Jiang, X.; Yuan, H.; Xue, M.; Chen, X.; Tan, X. Analysis of a heavy rainfall event over Beijing during 21–22 July 2012 based on high resolution model analyses and forecasts. J. Meteorol. Res. 2014, 28, 199–212. [Google Scholar] [CrossRef] [Green Version]
  9. Zhang, D.L.; Lin, Y.; Zhao, P.; Yu, X.; Wang, S.; Kang, H.; Ding, Y. The Beijing extreme rainfall of 21 July 2012:“Right results” but for wrong reasons. Geophys. Res. Lett. 2013, 40, 1426–1431. [Google Scholar] [CrossRef]
  10. Saini, A.; Sahu, N.; Kumar, P.; Nayak, S.; Duan, W.; Avtar, R.; Behera, S. Advanced rainfall trend analysis of 117 years over West Coast Plain and Hill Agro-climatic region of India. Atmosphere 2020, 11, 1225. [Google Scholar] [CrossRef]
  11. Saini, A.; Sahu, N.; Duan, W.; Kumar, M.; Avtar, R.; Mishra, M.; Kumar, P.; Pandey, R.; Behera, S. Unraveling Intricacies of Monsoon Attributes in Homogenous Monsoon Regions of India. Front. Earth Sci. 2022, 10, 794634. [Google Scholar] [CrossRef]
  12. Huang, R.; Chen, J.; Zhou, L.; Zhang, Q. Studies on the Relationship between the Severe Climatic Disasters in China and the East Asia Climate System. Chin. J. Atmos. Sci. 2003, 27, 770–787, (Chinese with English Abstract). [Google Scholar]
  13. Zhou, M. The Analysis of Long-Range Weather Process of Summer Drought and Flood in the Hai River Basin. Acta Meteorol. Sinica 1981, 39, 321–331, (Chinese with English Abstract). [Google Scholar]
  14. Guo, Z.; Chen, X.; Jiang, Y.; Dong, L. Interdecadal variation characteristics of water vapor transfer over eastern China in summer. Trans. Atmos. Sci. 2014, 37, 568–574, (Chinese with English Abstract). [Google Scholar]
  15. Hao, L.; Ding, Y.; Min, J. Relationship between Summer Monsoon Changes in East Asia and Abnormal Summer Rainfall in North China. Plateau Meteorol. 2016, 35, 1280–1289, (Chinese with English Abstract). [Google Scholar]
  16. Jiang, Z.; Jiang, S.; Shi, Y.; Liu, Z.; Li, W.; Li, L. Impact of moisture source variation on decadal-scale changes of precipitation in North China from 1951 to 2010. J. Geophys. Res. Atmos. 2017, 122, 600–613. [Google Scholar] [CrossRef]
  17. Yang, R.; Xing, P.; Du, W.; Dang, B.; Xuan, C.; Xiong, F. Climatic characteristics of precipitation in North China from 1961 to 2017. Sci. Geogr. Sin. 2020, 40, 1573–1583, (Chinese with English Abstract). [Google Scholar]
  18. He, L.; Hao, X.; Li, H.; Han, T. How Do Extreme Summer Precipitation Events Over Eastern China Subregions Change? Geophys. Res. Lett. 2021, 48, E2020GL091849. [Google Scholar] [CrossRef]
  19. Han, Y.; Liu, B.; Xu, D.; Yuan, C.; Xu, Y.; Sha, J.; Li, S.; Chang, Y.; Sun, B.; Xu, Z. Temporal and Spatial Variation Characteristics of Precipitation in the Haihe River Basin under the Influence of Climate Change. Water 2021, 13, 1664. [Google Scholar] [CrossRef]
  20. Zhang, Q.; Xu, C.; Zhang, Z.; Chen, Y.; Liu, C. Spatial and temporal variability of precipitation over China, 1951–2005. Theor. Appl. Climatol. 2009, 95, 53–68. [Google Scholar] [CrossRef]
  21. Liu, G.; Ren, G.; Fang, Z.; Zhang, C.; Yang, X. Trends of precipitation extremes in the Haihe River Basin during 1961–2007. J. Arid Land Resour. Environ. 2010, 24, 85–90, (Chinese with English Abstract). [Google Scholar]
  22. Du, H.; Xia, J.; Zeng, S.; She, D.; Liu, J. Variations and statistical probability characteristic analysis of extreme precipitation events under climate change in Haihe River Basin, China. Hydrol. Process 2014, 28, 913–925. [Google Scholar] [CrossRef]
  23. Wang, Z.; Luo, Y.; Liu, C.; Xia, J.; Zhang, M. Spatial and temporal variations of precipitation in Haihe River Basin, China: Six decades of measurements. Hydrol. Process 2011, 25, 2916–2923. [Google Scholar] [CrossRef]
  24. Sang, Y.; Wang, Z.; Liu, C. Spatial and temporal variability of precipitation extrema in the Haihe River Basin, China. Hydrol. Process 2014, 28, 926–932. [Google Scholar] [CrossRef]
  25. Yin, S.; Gao, G.; Li, W.; Chen, D.; Hao, L. Long-term precipitation change by hourly data in Haihe River Basin during 1961–2004. Sci. China Earth Sci. 2011, 54, 1576–1585. [Google Scholar] [CrossRef]
  26. Zhou, S.; Song, Y.; Li, Y.; Wang, C.; Yang, Y.; Huang, Y. Spatial distribution of summer graded precipitation and its difference in drought and flood years over the east of northwest China. Arid Land Geogr. 2016, 39, 1162–1171, (Chinese with English Abstract). [Google Scholar]
  27. Hao, L.; He, L.; Cheng, S.; Liang, S. Climatic characteristics and monitoring analysis of rainy season in the Haihe River Basin. Pro. Geogr. 2021, 40, 1181–1194, (Chinese with English Abstract). [Google Scholar] [CrossRef]
  28. Li, Q.; Liu, X.; Zhang, H.; Peterson, T.C.; Easterling, D.R. Detecting and Adjusting Temporal Inhomogeneity in Chinese Mean Surface Air Temperature Data. Adv. Atmos. Sci. 2004, 21, 260–268. [Google Scholar] [CrossRef]
  29. Li, Q.; Dong, W. Detection and adjustment of undocumented discontinuities in Chinese temperature series using a composite approach. Adv. Atmos. Sci. 2009, 26, 143–153. [Google Scholar] [CrossRef]
  30. Xu, Y.; Gao, X.; Shen, Y.; Xu, C.; Shi, Y.; Giorgi, F. A daily temperature dataset over China and its application in validating a RCM simulation. Adv. Atmos. Sci. 2009, 26, 763–772. [Google Scholar] [CrossRef]
  31. Huang, R.; Liu, Y.; Du, Z.; Chen, J.; Huangfu, J. Differences and links between the East Asian and South Asian summer monsoon systems: Characteristics and variability. Adv. Atmos. Sci. 2017, 34, 1204–1218. [Google Scholar] [CrossRef]
  32. Zhi, R.; Chen, L.; Zhu, X. Analysis of Characteristics and Causes of Precipitation Anomalies over Northern China in Autumn 2017. Meteorol. Mon. 2018, 44, 572–581, (Chinese with English Abstract). [Google Scholar]
  33. GB/T 28592-2012; Grade of Precipitation. Standards Press of China: Beijing, China, 2012; (Chinese with English Abstract).
  34. IPCC. The Physical Science Basis. In Contribution of Working Group I to the Fifth Assessment Report of the Intergovernmental Panel on Climate Change; IPCC: Geneva, Switzerland, 2013. [Google Scholar]
  35. Kumaraswamy, P. A generalized probability density function for double-bounded random processes. J. Hydrol. 1980, 46, 79–88. [Google Scholar] [CrossRef]
  36. Zhao, Y.; Xu, X.; Li, J.; Zhang, R.; Kang, Y.; Huang, W.; Xia, Y.; Liu, D.; Sun, X. The Large-Scale Circulation Patterns Responsible for Extreme Precipitation over the North China Plain in Midsummer. J. Geophys. Res. Atmos. 2019, 124, 12794–12809. [Google Scholar] [CrossRef] [Green Version]
  37. Liu, J.; Han, J.; Xiang, L.; Fan, Y. Temporal-spatial characteristics of precipitation day in different levels in Beijing-Tianjin-Hebei from 1961 to 2012. J. Meteorol. Environ. 2015, 31, 43–50, (Chinese with English Abstract). [Google Scholar]
  38. Ai, H.; Zhang, Y.; Lu, W. Characteristics of the interannual variations of summer precipitation days with different class intervals over Eastern China. Sci. Meteorol. Sin. 2009, 29, 299–306, (Chinese with English Abstract). [Google Scholar]
  39. Wang, X.; Zhai, P. Changes in China’s Precipitation in Various Categories during 1957–2004. J. Trop. Meteorol. 2008, 2008, 459–466, (Chinese with English Abstract). [Google Scholar]
  40. Ma, N.; Xie, J.; Gan, W.; Yang, D. An Extended Range Forecast Method for the Precipitation over the Lower Reaches of Haihe River Using Atmospheric Intraseasonal Oscillation. Plateau Mt. Meteorol. Res. 2016, 36, 27–31+52, (Chinese with English Abstract). [Google Scholar]
  41. Liu, B.; Xu, M.; Henderson, M. Where have all the showers gone? Regional declines in light precipitation events in China, 1960–2000. Int. J. Climatol. 2011, 31, 1177–1191. [Google Scholar] [CrossRef]
  42. Qian, W.; Fu, J.; Yan, Z. Decrease of light rain events in summer associated with a warming environment in China during 1961–2005. Geophys. Res. Lett. 2007, 34, L11705. [Google Scholar] [CrossRef]
  43. Ren, G.; Feng, G.; Yan, Z. Progresses in Observation Studies of Climate Extremes and Changes in Mainland China. Clim. Environ. Res. 2010, 15, 337–353, (Chinese with English Abstract). [Google Scholar]
  44. Yan, Z.; Yang, C. Geographic Patterns of Extreme Climate Changes in China during 1951–1997. Clim. Environ. Res. 2000, 5, 267–272, (Chinese with English Abstract). [Google Scholar]
  45. Zhai, P.; Wang, C.; Li, W. A Review on Study of Change in Precipitation Extremes. Adv. Clim. Chang. Res. 2007, 3, 144–148, (Chinese with English Abstract). [Google Scholar]
  46. Wang, Z.; Shen, S.; Liu, R. Impact Analysis of Precipitation in Different Classes on Annual Precipitation Change in Recent 40 Years in China. Meteorol. Environ. Sci. 2011, 34, 7–13, (Chinese with English Abstract). [Google Scholar]
  47. Huang, J.; Ji, M.; Xie, Y.; Wang, S.; He, Y.; Ran, J. Global semi-arid climate change over last 60 years. Clim. Dyn. 2016, 46, 1131–1150. [Google Scholar] [CrossRef] [Green Version]
  48. Dai, A. Drought under global warming: A review. WIRES. Clim. Chang. 2011, 2, 45–65. [Google Scholar] [CrossRef] [Green Version]
  49. Sahu, N.; Saini, A.; Behera, S.; Sayama, T.; Nayak, S.; Sahu, L.; Duan, W.; Avtar, R.; Yamada, M.; Singh, R.B. Impact of indo-pacific climate variability on rice productivity in Bihar, India. Sustainability 2020, 12, 7023. [Google Scholar] [CrossRef]
  50. Wei, Y.; Chen, H.; Liu, Y.; Dong, G. Cause Analysis of Heavy Rainfall over Northern Haihe River Basin Under Terrain Influence. Meteorol. Environ. Sci. 2018, 41, 81–88, (Chinese with English Abstract). [Google Scholar]
Figure 1. Spatial distributions of summer mean precipitation amount (PA (a)) and the number of rainy days (NRD (b)) in the Haihe River basin for the period of 1991–2020. The black dots in (a) denote the meteorological stations.
Atmosphere 13 01246 g001
Figure 2. Time series of the summer PA (curve filled with colors) and NRD (black line) in the Haihe River basin for the period of 1972–2021 (the dashed line is the 11-year moving average of the PA).
Atmosphere 13 01246 g002
Figure 3. Time series of the summer NRDs (a1d1) and proportions of precipitation (a2d2) according to the different grades in the Haihe River basin for the period of 1972–2021 (the blue lines are the trend lines, and the red lines are the 11-year moving average).
Atmosphere 13 01246 g003
Figure 4. Spatial distributions of trends in summer PAs (a) (units: mm/year) and NRDs according to the different grades (bf) (units: days/year) for the period of 1972–2021 ((b) total precipitation; (c) light rain; (d) moderate rain; (e) heavy rain; (f) torrential rain). The dotted areas denote significant trends at the 95% confidence level.
Atmosphere 13 01246 g004
Figure 5. Relationships between the summer precipitation anomaly percentages (PAPs) and the NRDs according to the different grades ((a) light rain; (b) moderate rain; (c) heavy rain; (d) torrential rain. rc is the slope of the fitted line, and ccr is the correlation coefficient).
Atmosphere 13 01246 g005
Figure 6. Changes in the summer PAs (a) and NRDs (b) according to the four grades relative to the period of 1991–2020 for different levels of drought and flooding (the numbers in the figures are the climatic averages of the corresponding PA and NRD).
Atmosphere 13 01246 g006
Figure 7. (a) Daily precipitation anomalies in summer relative to the period of 1991–2020 for different levels of drought and flooding. (b) Intraseasonal variation in summer precipitation for the period of 1991–2020 (the dashed line is the daily precipitation amount, and the solid line is the 5-day moving average). Jun.1, Jun.2, and Jun.3 mean the first, second, and third ten days of June, and the same applies to July and August.
Atmosphere 13 01246 g007
Figure 8. Change in the PAs according to the different grades after removing the strongest precipitation process in summer (a) and the summer PAPs before (blue histograms) and after (red histograms) the removal (b).
Atmosphere 13 01246 g008
Figure 9. Spatial distributions of the summer PAs (a1e1) and changes in the summer PAs (a2e2) according to the different grades in the drought and flooding scenarios ((a) total precipitation; (b) light rain; (c) moderate rain; (d) heavy rain; (e) torrential rain).
Atmosphere 13 01246 g009
Table 1. Names and thresholds of the nine levels of drought and flooding (PAP, precipitation anomaly percentage).
NamesDrought_L3Drought_L2Drought_L1Normal−Normal+Flood_L1Flood_L2Flood_L3Flood_L4
PAP (%)[−50,−30)[−30,−20)[−20,−10)[−10,0)[0,10)[10,20)[20,30)[30,50)≥50
Table 2. Contribution rates of precipitation change according to the four grades to summer drought/flooding for different levels of drought and flooding (units: %).
Levels of Drought and FloodingLight RainModerate RainHeavy RainTorrential Rain
Drought_L37.117.932.242.9
Drought_L23.616.236.743.5
Drought_L12.717.833.146.4
Flood_L17.316.928.047.8
Flood_L27.020.739.832.6
Flood_L36.413.224.655.9
Flood_L45.617.228.448.8
Average5.516.831.246.5
Table 3. Contribution rates of precipitation change according to the four grades to summer drought/flooding in two periods (units: %).
1972–19961997–2021
DroughtFloodAverageDroughtFloodAverage
Light Rain0.710.47.14.80.43.1
Moderate Rain17.220.619.517.610.014.6
Heavy Rain38.833.034.931.520.627.2
Torrential Rain43.336.038.546.069.155.2
Publisher’s Note: MDPI stays neutral with regard to jurisdictional claims in published maps and institutional affiliations.

