
Temporal and Spatial Variation of Wetland CH4 Emissions from the Qinghai–Tibet Plateau under Future Climate Change Scenarios


Abstract
:1. Introduction
2. Materials and Methods
2.1. Study Area
2.2. Model Description
2.3. RCPs and Model Input Data
3. Results
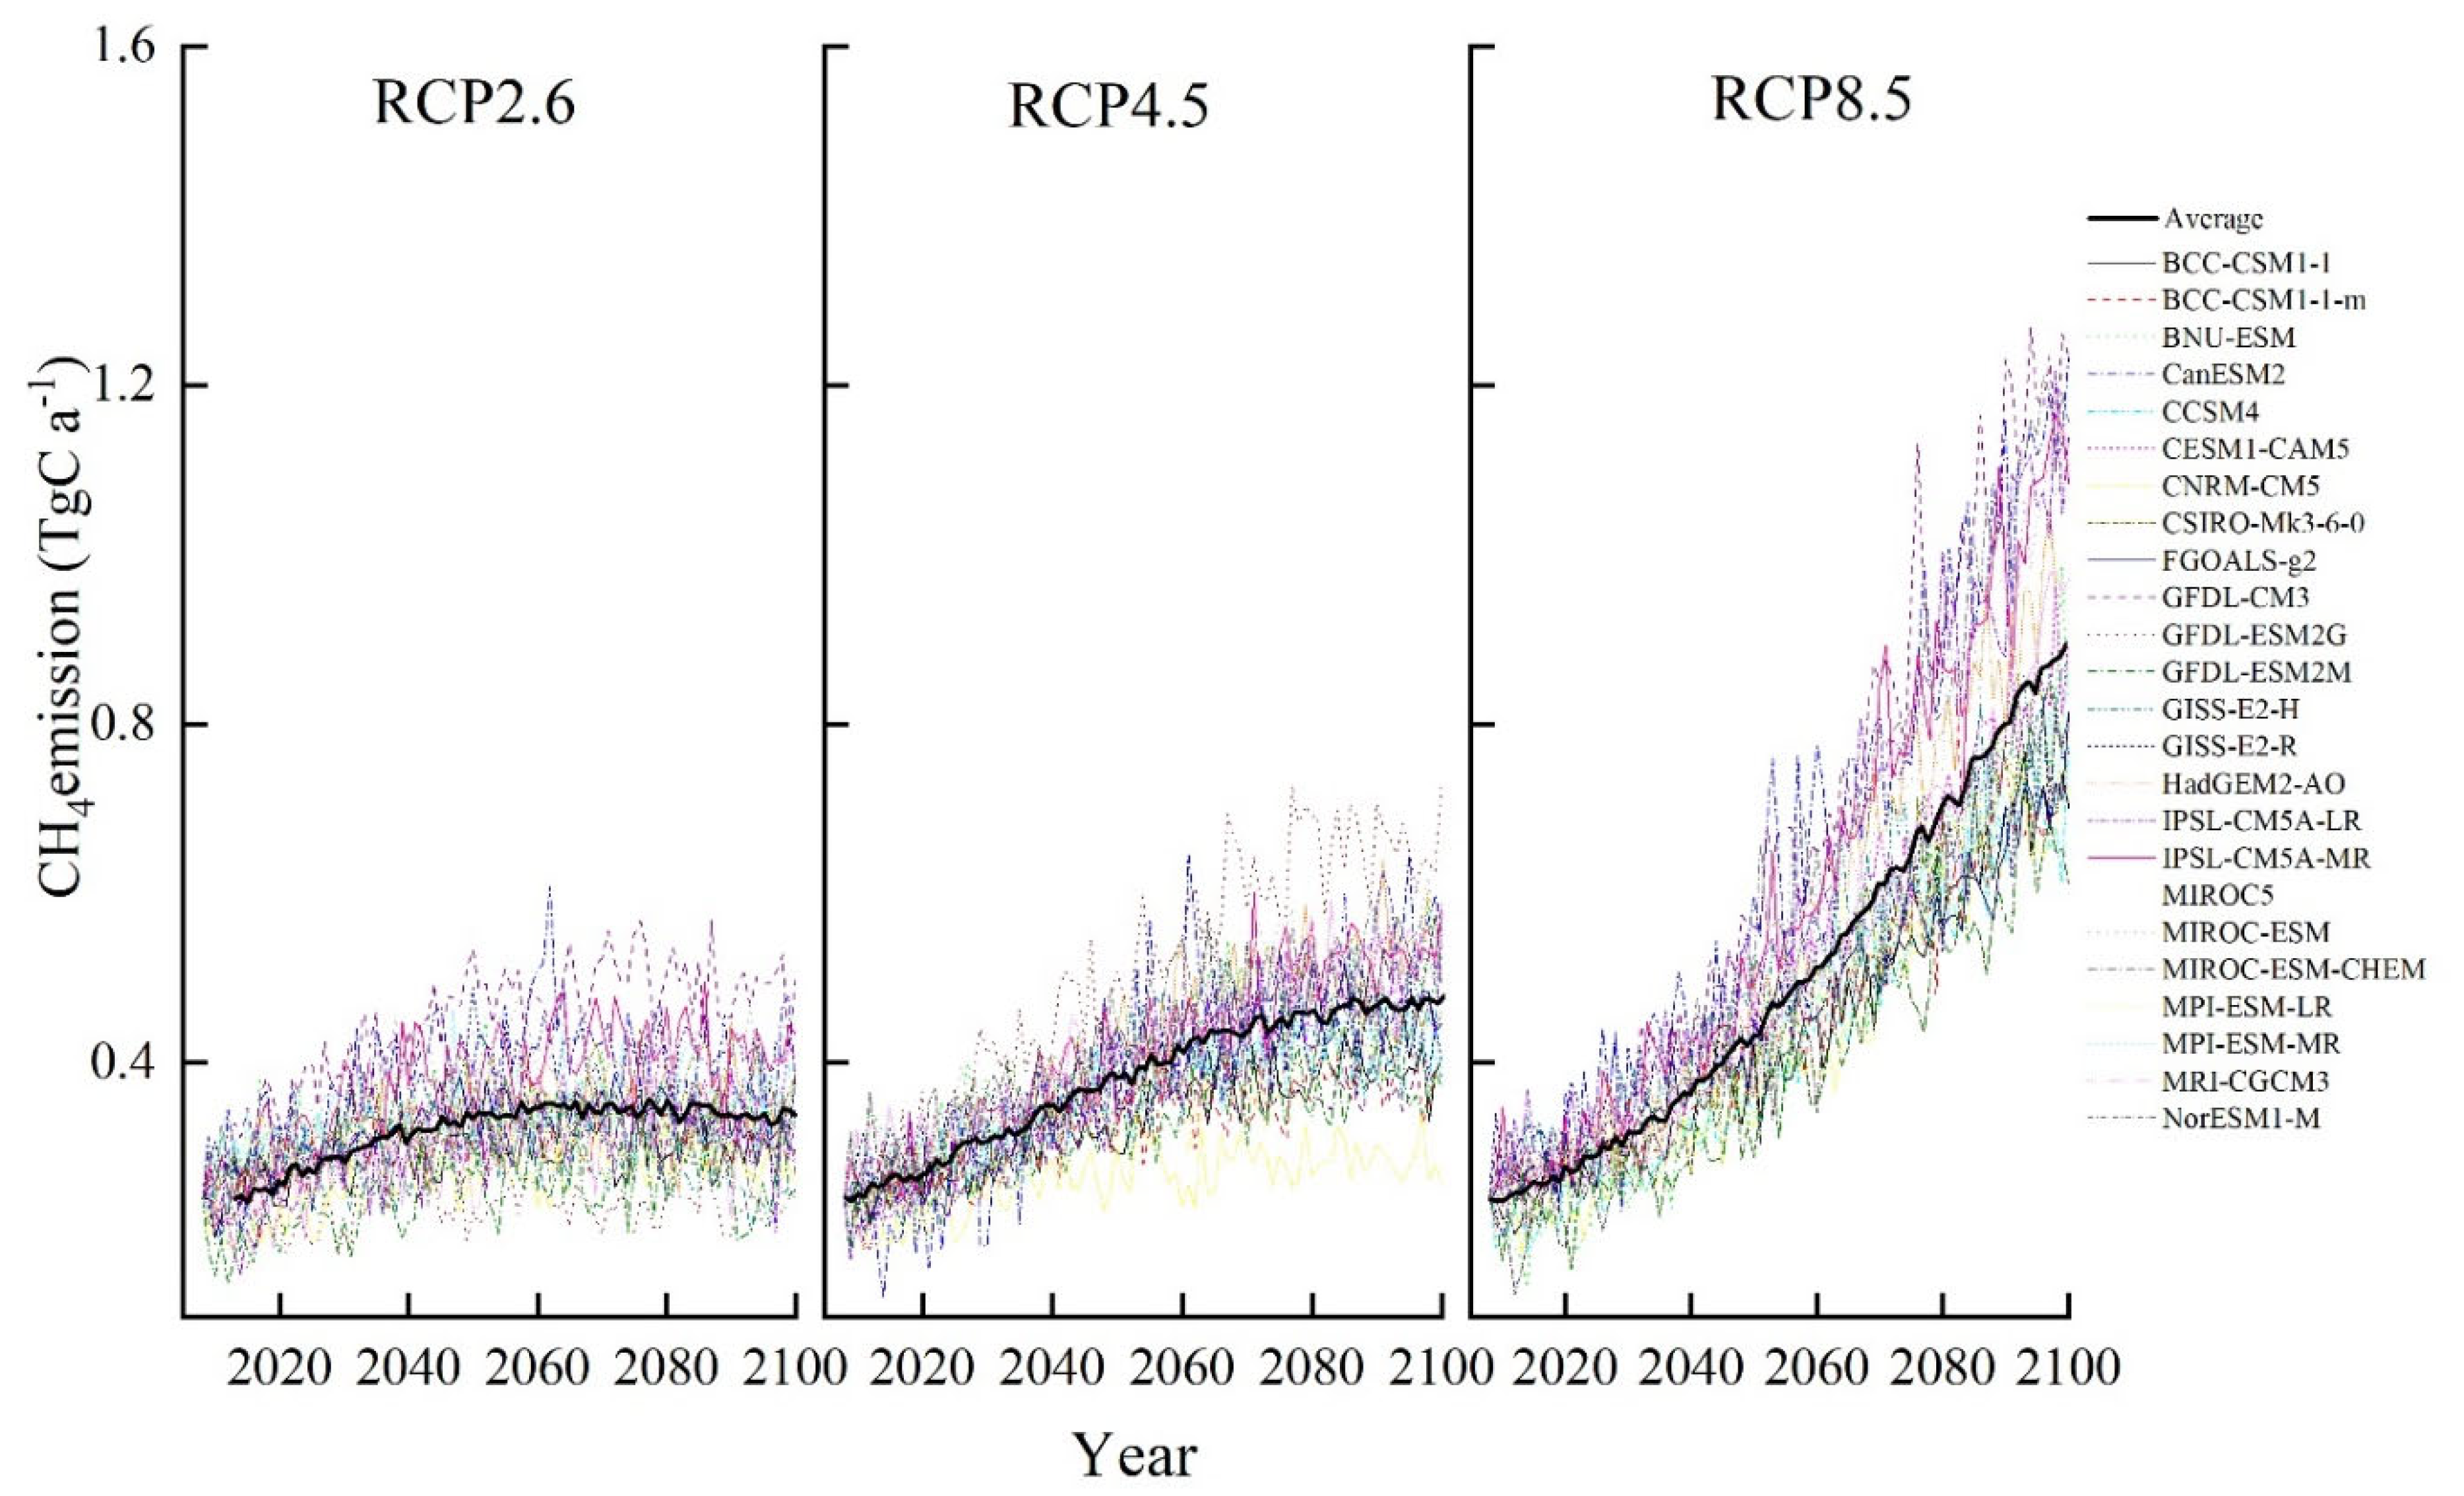
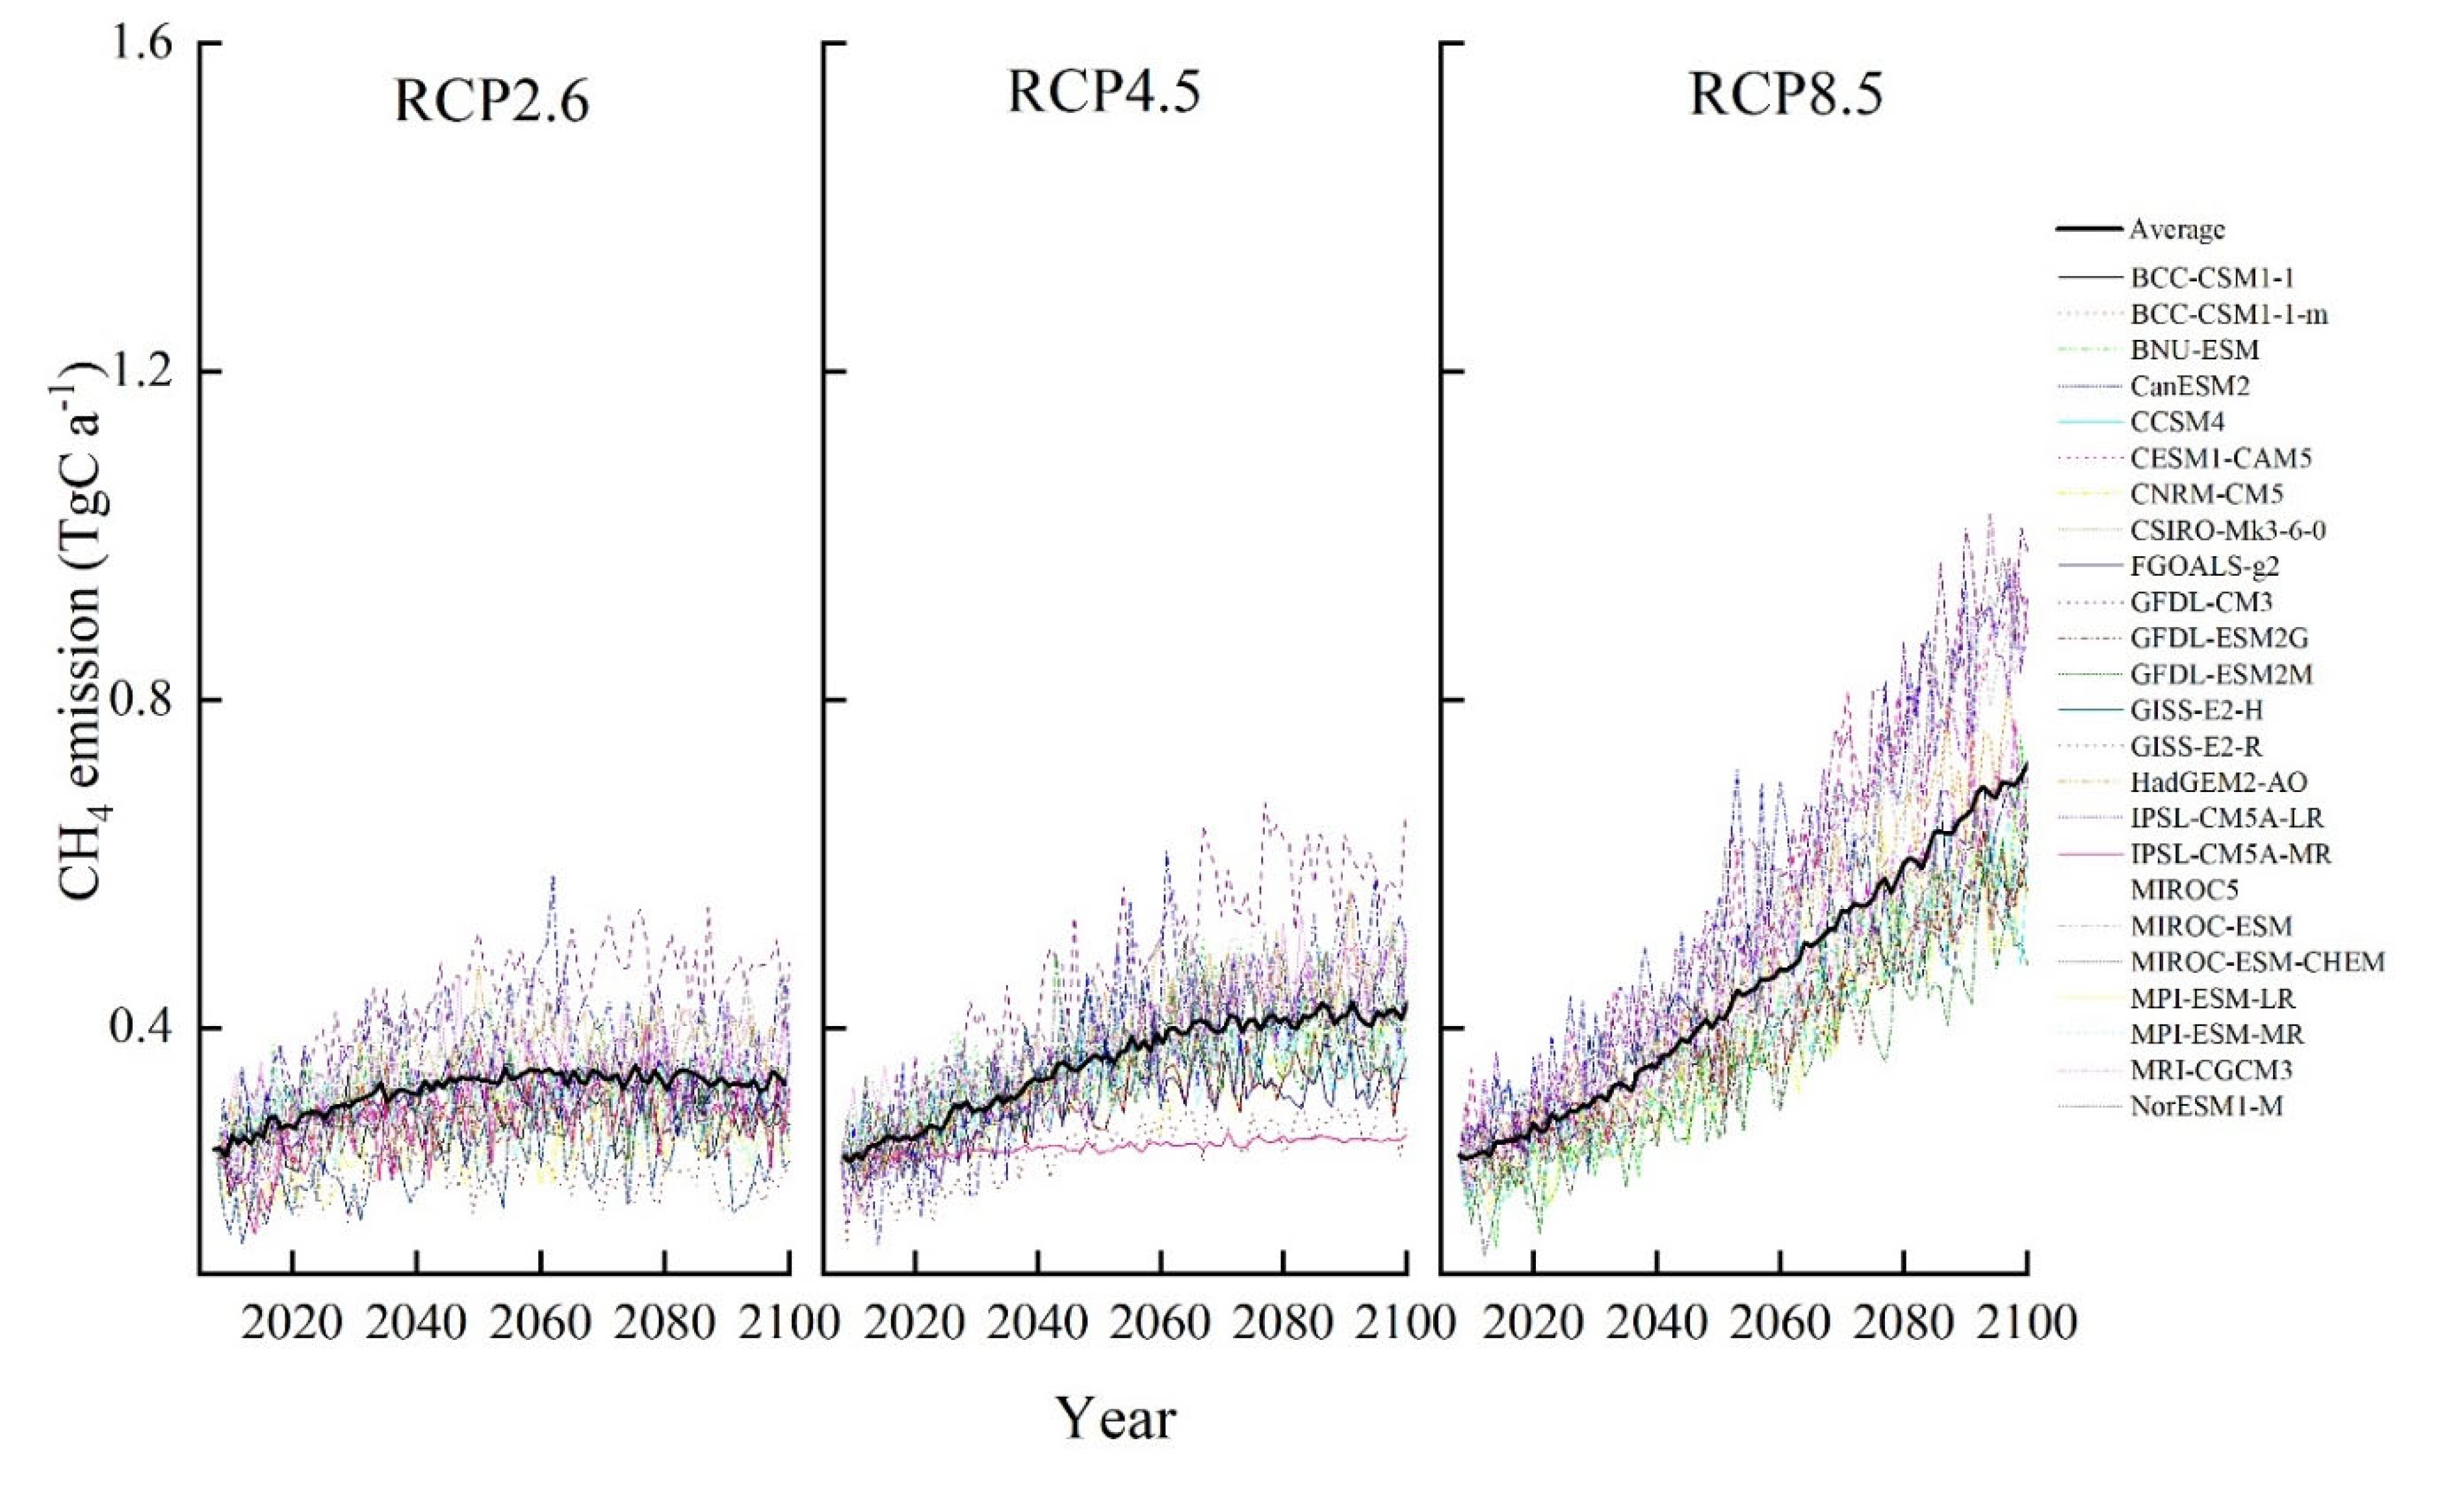
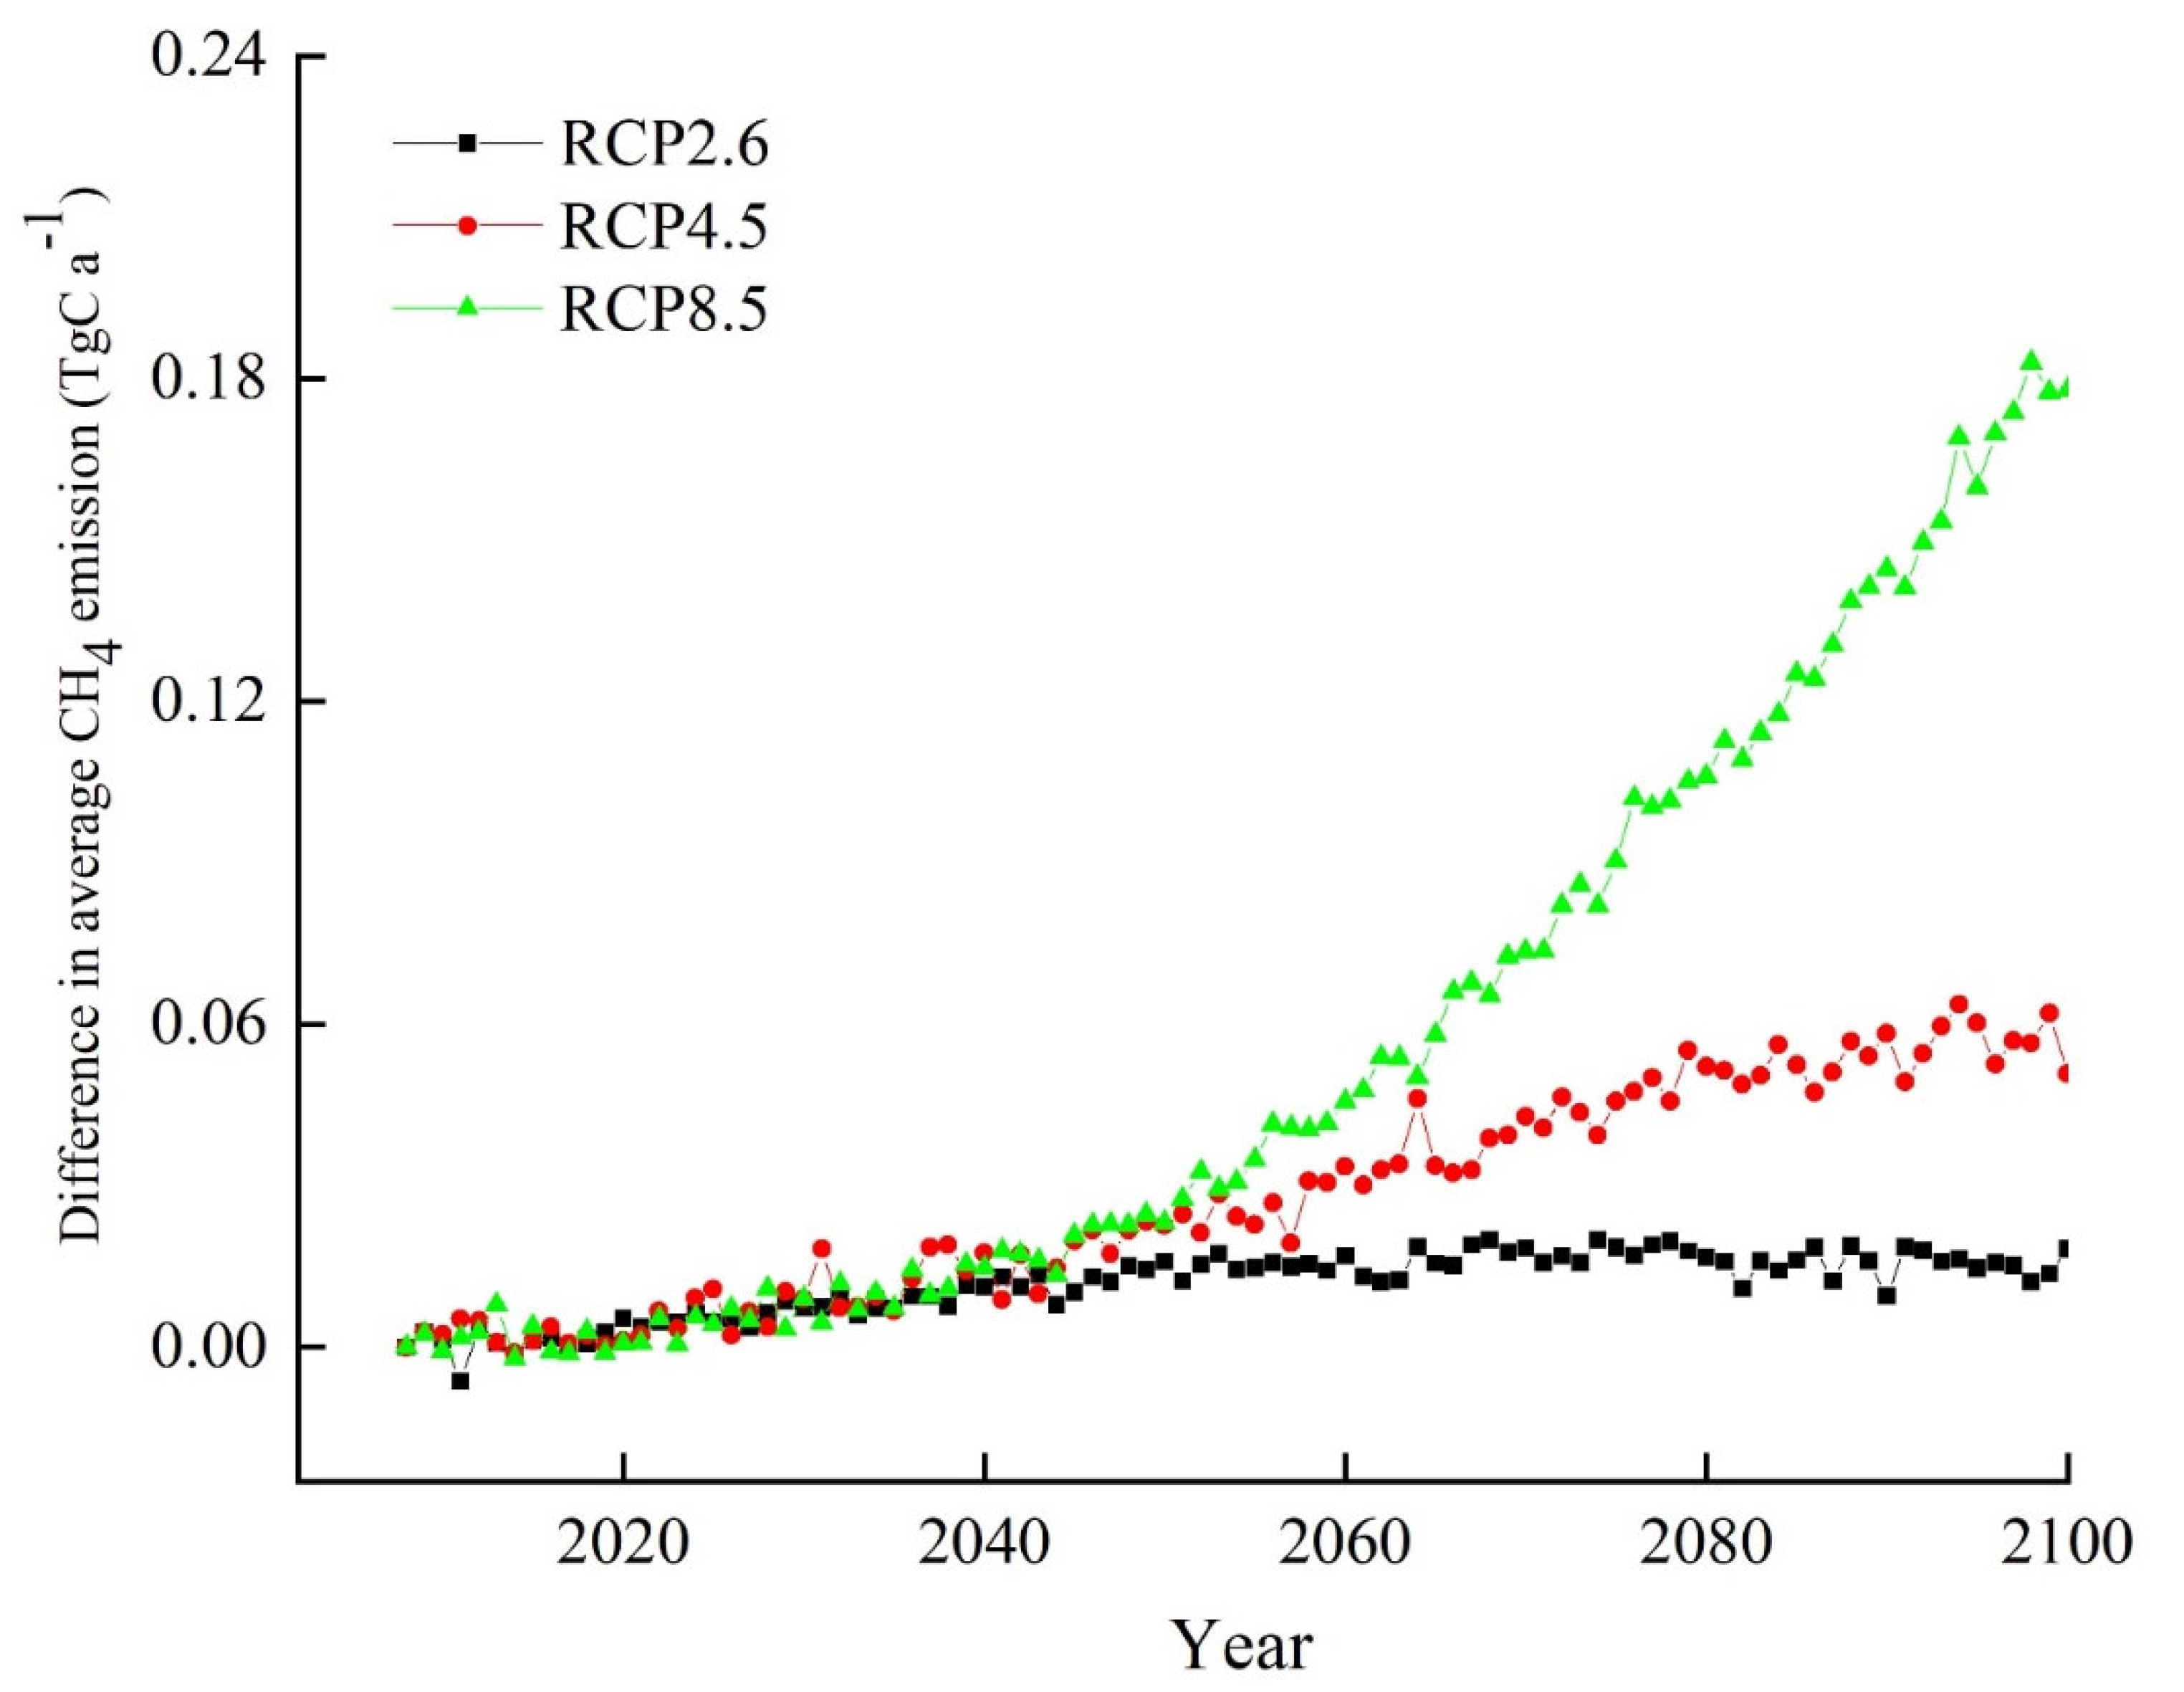
3.1. Future Annual Variation in CH4 Emissions from Wetlands on the Qinghai-Tibet Plateau
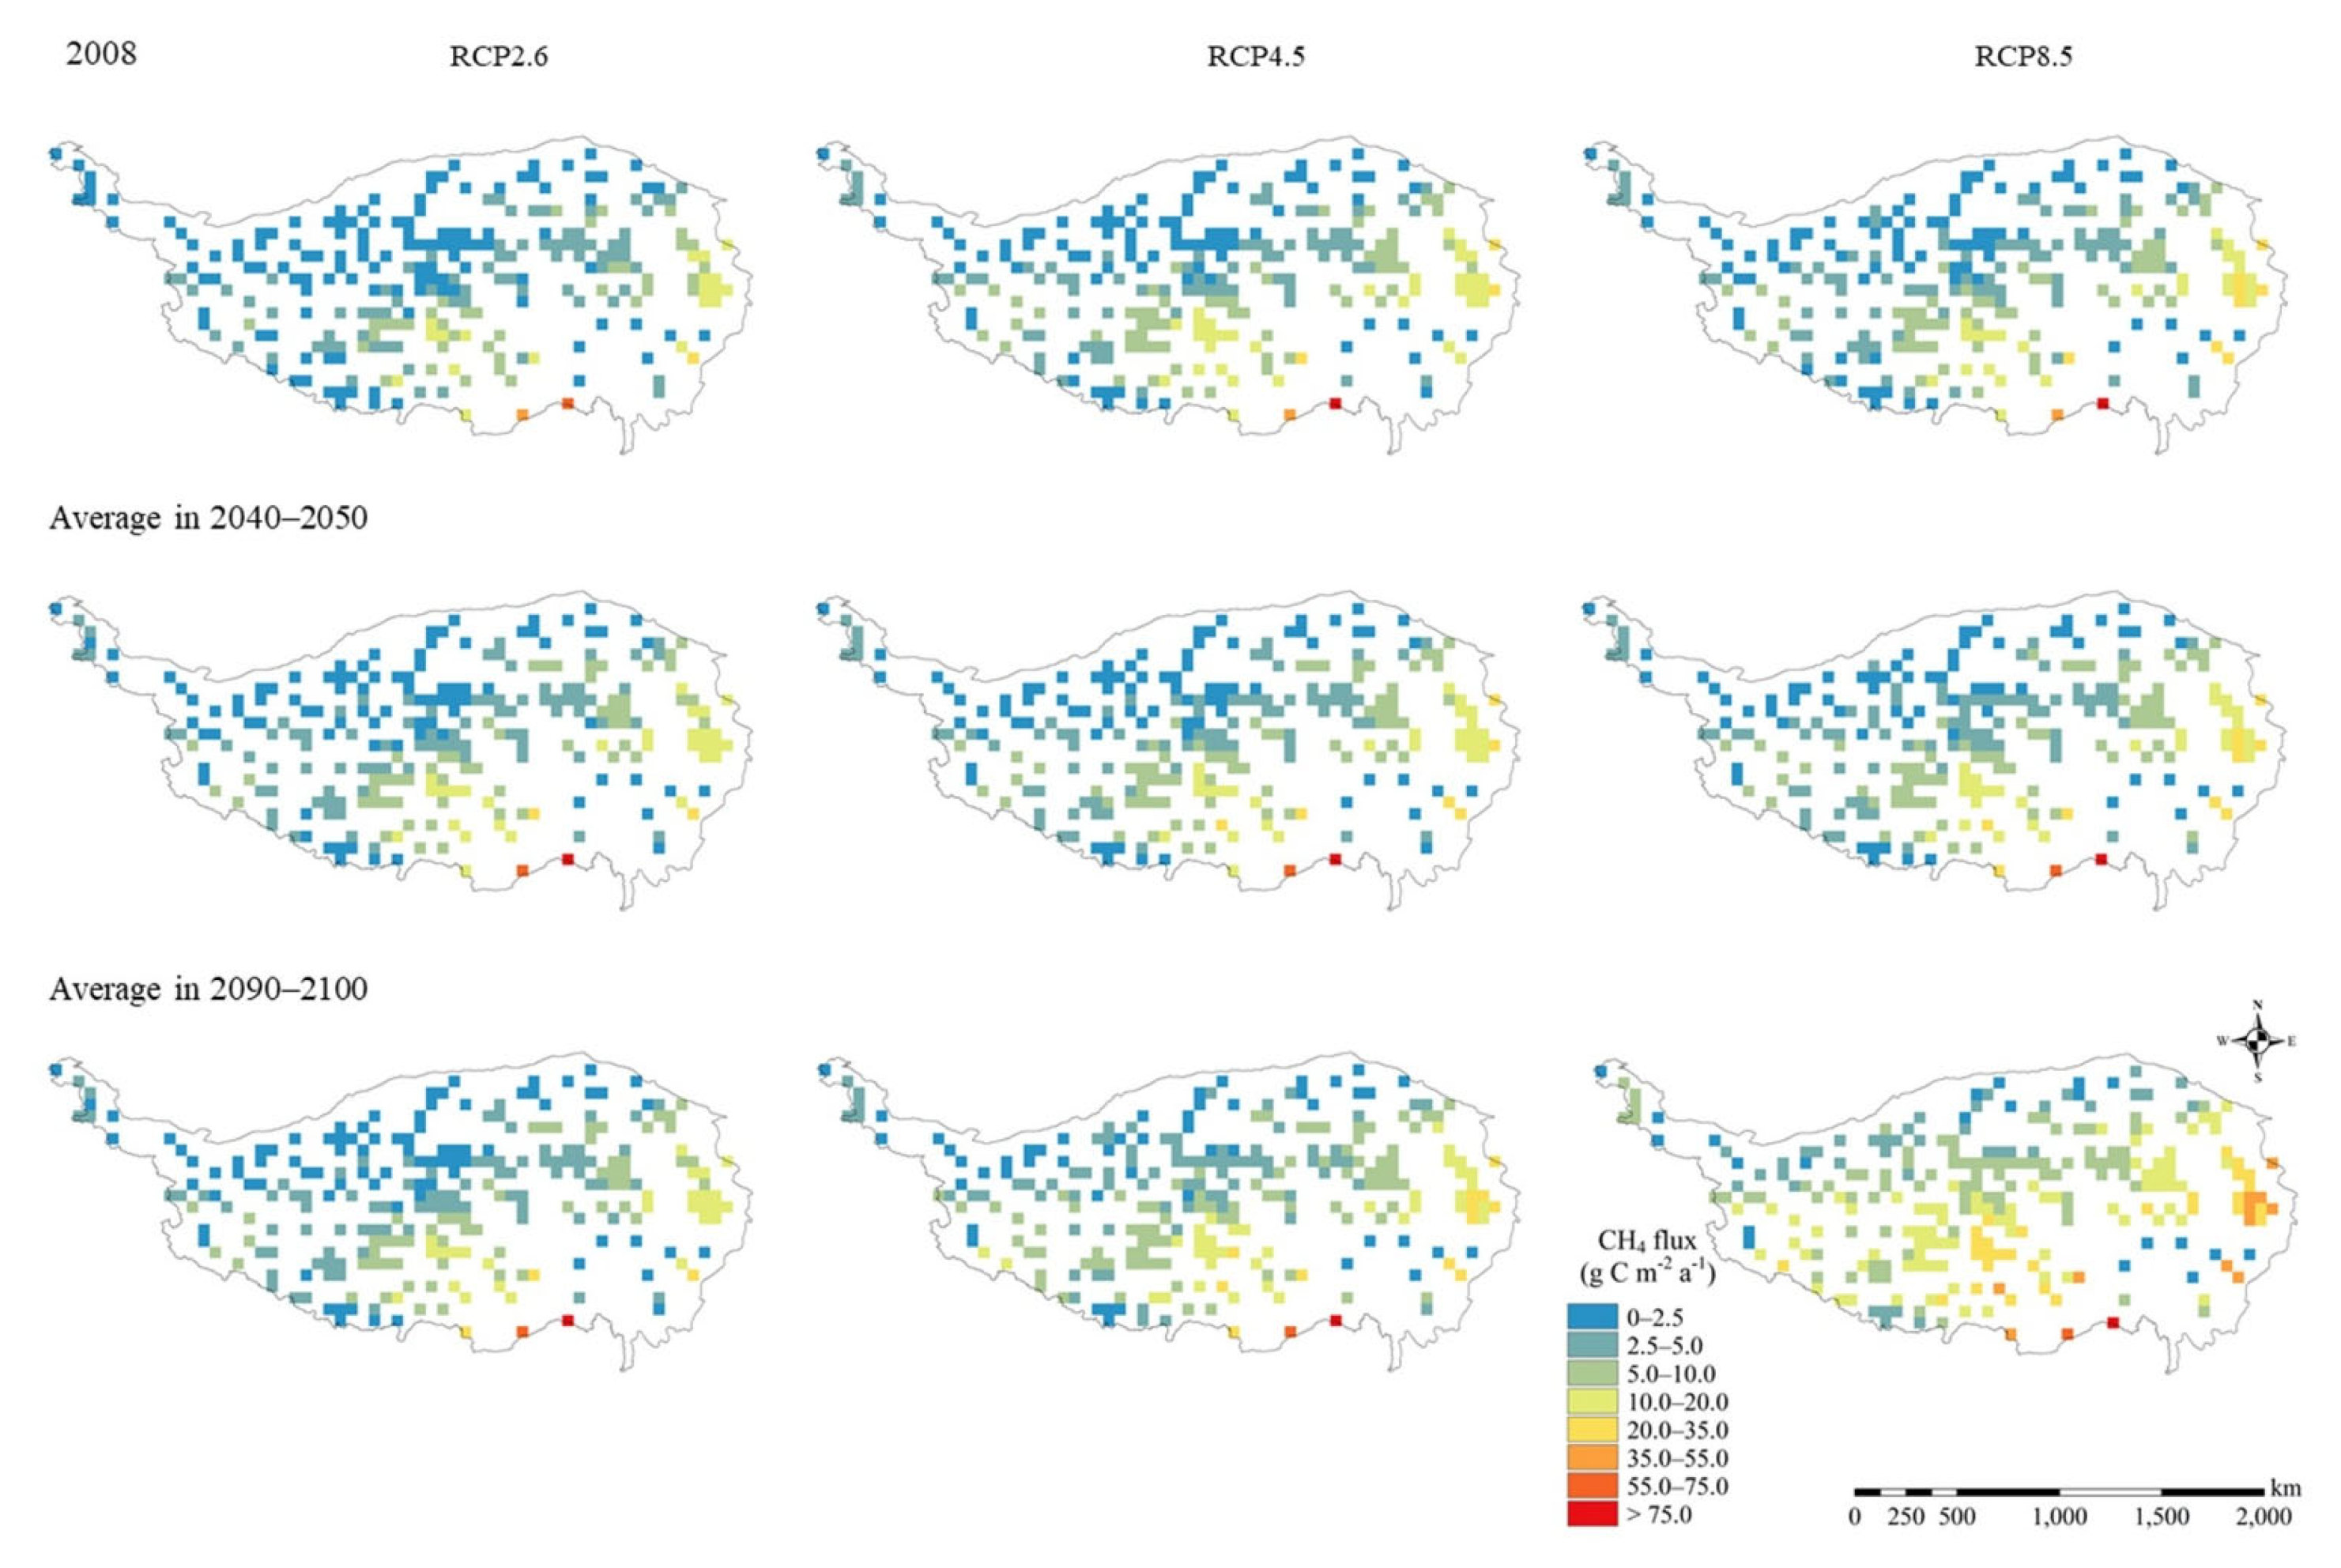
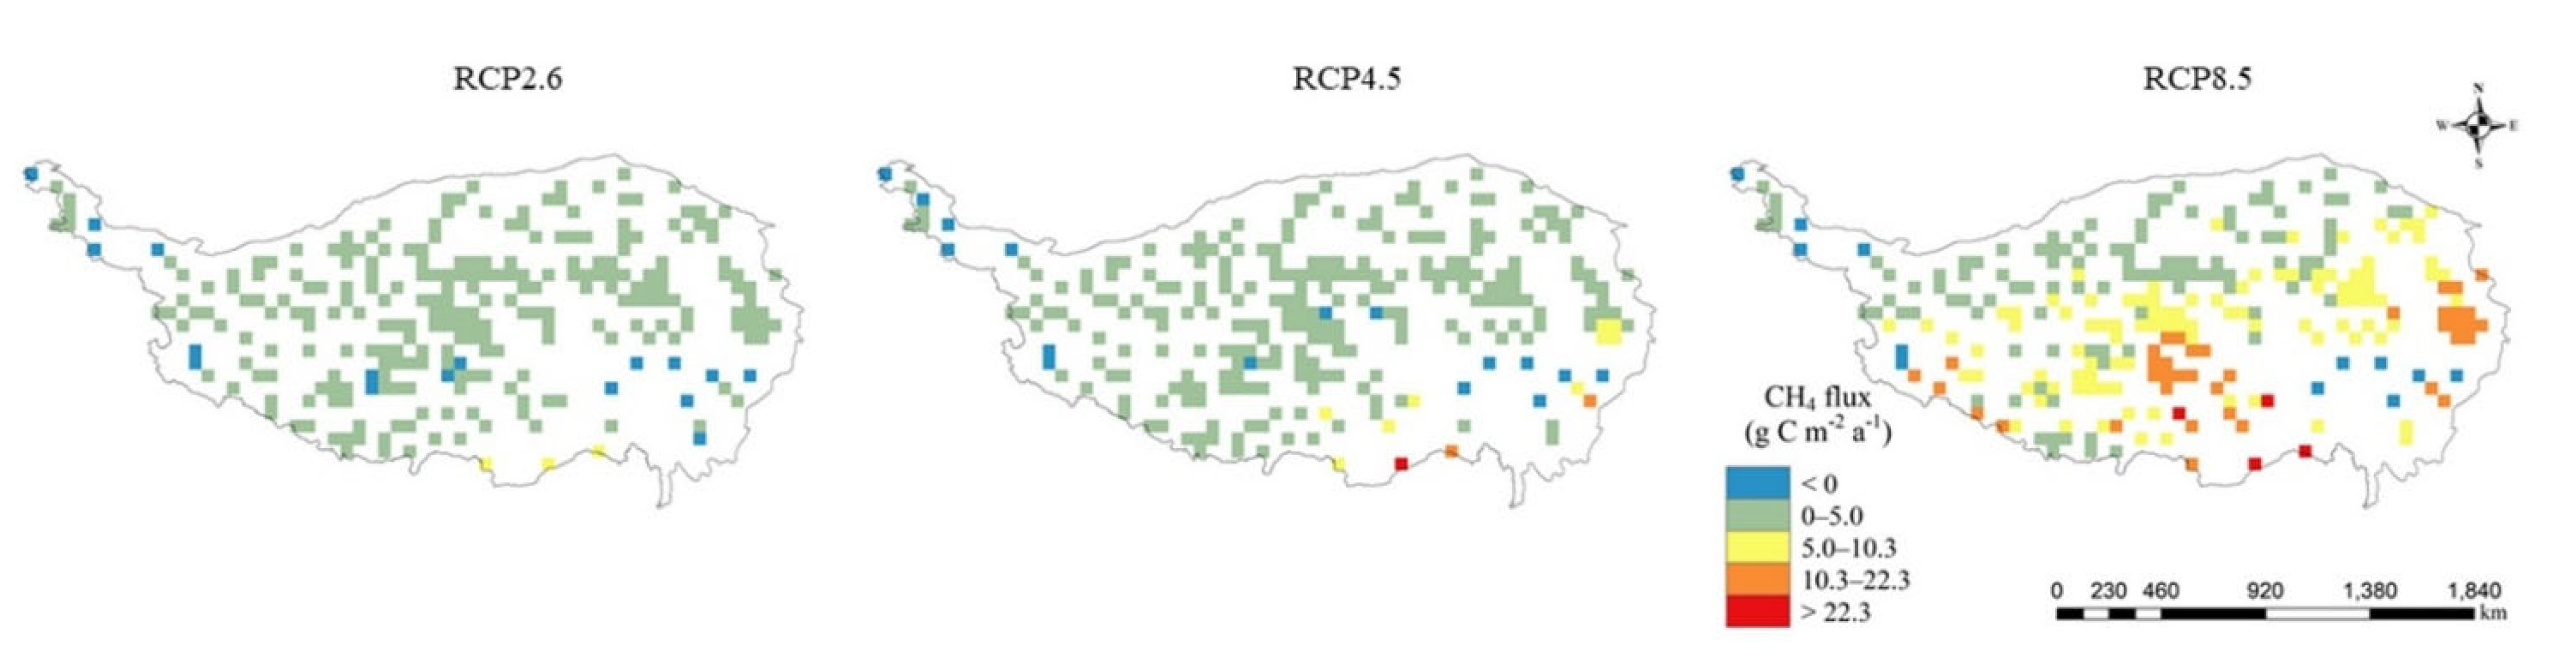
3.2. Spatial Distribution of Future CH4 Emissions from Wetlands on the Qinghai–Tibet Plateau
3.3. Dynamics in the Spatial Distribution of Future CH4 Emissions from Wetlands on the Qinghai–Tibet Plateau
4. Discussion
5. Conclusions
Author Contributions
Funding
Institutional Review Board Statement
Informed Consent Statement
Data Availability Statement
Conflicts of Interest
References
- IPCC. Climate Change 2013: The Physical Science Basis. In Contribution of Working Group I to the Fifth Assessment Report of the Intergovernmental Panel on Climate Change; Cambridge University Press: Cambridge, UK, 2013. [Google Scholar]
- Kirschke, S.; Bousquet, P.; Ciais, P.; Saunois, M.; Canadell, J.G.; Dlugokencky, E.J.; Bergamaschi, P.; Bergmann, D.; Blake, D.R.; Bruhwiler, L.; et al. Three decades of global methane sources and sinks. Nat. Geosci. 2013, 6, 813–823. [Google Scholar] [CrossRef]
- Yao, S.P.; Luo, P.; Wang, Y.F.; Wu, N. Advances in the research on methane emissions from wetlands. World Sci.-Technol. Res. Dev. 2007, 29, 58–63. [Google Scholar]
- Nisbet, E.G.; Dlugokencky, E.J.; Bousquet, P. Methane on the rise-again. Science 2014, 476, 493–495. [Google Scholar] [CrossRef] [Green Version]
- Nisbet, E.G.; Dlugokencky, E.J.; Manning, M.R.; Lowry, D.; Fisher, R.E.; France, J.L.; Michel, S.E.; Miller, J.B.; White, J.W.C.; Vaughn, B.; et al. Rising atmospheric methane: 2007–2014 growth and isotopic shift. Global Biogeochem. Cy. 2016, 30, 1356–1370. [Google Scholar] [CrossRef] [Green Version]
- Nisbet, E.G.; Manning, M.R.; Dlugokencky, E.J.; Fisher, R.E.; Lowry, D.; Michel, S.E.; Myhre, C.L.; Platt, S.M.; Allen, G.; Bousquet, P.; et al. Very Strong Atmospheric Methane Growth in the 4 Years 2014–2017: Implications for the Paris Agreement. Glob. Biogeochem. Cycles 2019, 33, 318–342. [Google Scholar] [CrossRef]
- Fletcher, S.E.M.; Schaefer, H. Rising methane: A new climate challenge. Science 2019, 364, 932–933. [Google Scholar] [CrossRef]
- Schaefer, H.; Fletcher, S.E.M.; Veidt, C.; Lassey, K.R.; Brailsford, G.W.; Bromley, T.M.; Dlugokencky, E.J.; Michel, S.E.; Miller, J.B.; Levin, I.; et al. A 21st-century shift from fossil-fuel to biogenic methane emissions indicated by 13CH4. Science 2016, 352, 80–84. [Google Scholar] [CrossRef]
- Saunois, M.; Bousquet, P.; Poulter, B.; Peregon, A.; Ciais, P.; Canadell, J.G.; Dlugokencky, E.J.; Etiope, G.; Bastviken, D.; Houweling, S.; et al. Variability and quasi-decadal changes in the methane budget over the period 2000–2012. Atmos. Chem. Phys. 2017, 17, 11135–11161. [Google Scholar] [CrossRef] [Green Version]
- Thompson, R.L.; Nisbet, E.G.; Pisso, I.; Stohl, A.; Blake, D.; Dlugokencky, E.J.; Helmig, D.; White, J.W.C. Variability in Atmospheric Methane from Fossil Fuel and Microbial Sources Over the Last Three Decades. Geophys. Res. Lett. 2018, 45, 11499–11508. [Google Scholar] [CrossRef] [Green Version]
- Chen, H.; Gao, Y.H.; Yao, S.P.; Wu, N.; Wang, Y.F.; Luo, P.; Tian, J.Q. Spatio temporal variation of methane emissions from alpine wetlands in Zoige Plateau. Acta Ecol. Sin. 2008, 28, 3425–3437. [Google Scholar]
- Chen, H.; Zhu, Q.A.; Peng, C.H.; Wu, N.; Wang, Y.F.; Fang, X.Q.; Jiang, H.; Xiang, W.H.; Chang, J.; Deng, X.W.; et al. Methane emissions from rice paddies natural wetlands, lakes in China: Synthesis new estimate. Global Chang. Biol. 2013, 19, 19–32. [Google Scholar] [CrossRef] [PubMed]
- Wei, D.; Xu-Ri; Tarchen, T.; Dai, D.X.; Wang, Y.S.; Wang, Y.H. Revisiting the role of CH4 emissions from alpine wetlands on the Tibetan Plateau: Evidence from two in situ measurements at 4758 and 4320 m above sea level. J. Geophys. Res.-Biogeosci. 2015, 120, 1741–1750. [Google Scholar] [CrossRef]
- Kato, T.; Yamada, K.; Tang, Y.H.; Yoshida, N.; Wada, E. Stable carbon isotopic evidence of methane consumption and production in three alpine ecosystems on the Qinghai-Tibetan Plateau. Atmos Environ. 2013, 77, 338–347. [Google Scholar] [CrossRef]
- O’Connor, F.M.; Boucher, O.; Gedney, N.; Jones, C.D.; Folberth, G.A.; Coppell, R.; Friedlingstein, P.; Collons, W.J.; Chappellaz, J.; Ridley, J.; et al. Possible role of wetlands, permafrost, and methane hydrates in the methane cycle under future climate change: A review. Rev. Geophy. 2010, 48, RG4005. [Google Scholar] [CrossRef]
- Xu, X.F.; Tian, H.Q. Methane exchange between marshland and the atmosphere over China during 1949–2008. Glob. Biogeochem. Cycles 2012, 26, GB2006. [Google Scholar] [CrossRef]
- Zhu, X.D.; Zhuang, Q.L.; Chen, M.; Sirin, A.; Melillo, J.; Kicklighter, D.; Sokolov, A.; Song, L.L. Rising methane emissions in response to climate change in Northern Eurasia during the 21st century. Environ. Res. Lett. 2011, 6, 045211. [Google Scholar] [CrossRef]
- Bloom, A.A.; Palmer, P.I.; Fraser, A.; Reay, D.S.; Frankenberg, C. Large-scale controls of methanogenesis inferred from methane and gravity spaceborne data. Science 2010, 327, 322–325. [Google Scholar] [CrossRef] [Green Version]
- van Groenigen, K.J.; Osenberg, C.W.; Hungate, B.A. Increased soil emissions of potent greenhouse gases under increased atmospheric CO2. Nature 2011, 475, 214–216. [Google Scholar] [CrossRef]
- Arneth, A.; Sitch, S.; Bondeau, A.; Butterbach-Bahl, K.; Foster, P.; Gedney, N.; de Noblet-Ducoudré, N.; Prentice, I.C.; Sanderson, M.; Thonicke, K. From biota to chemistry and climate: Towards a comprehensive description of trace gas exchange between the biosphere and atmosphere. Biogeosciences 2010, 7, 121–149. [Google Scholar] [CrossRef] [Green Version]
- Chen, Y.H.; Prinn, R.G. Atmospheric modeling of high-and low-frequency methane observations: Importance of interannually varying transport. J. Geophys. Res.-Atmos. 2005, 110, D10303. [Google Scholar] [CrossRef] [Green Version]
- Cao, M.K.; Marshall, S.; Gregson, K. Global carbon exchange and methane emissions from natural wetlands: Application of a process-based model. J. Geophys. Res.-Atmos. 1996, 101, 14399–14414. [Google Scholar] [CrossRef] [Green Version]
- Zhu, Q.; Liu, J.; Peng, C.; Chen, H.; Fang, X.; Jiang, H.; Yang, G.; Zhu, D.; Wang, W.; Zhou, X. Modelling methane emissions from natural wetlands by development and application of the TRIPLEX-GHG model. Geosci. Model. Dev. 2014, 7, 981–999. [Google Scholar] [CrossRef] [Green Version]
- Zhang, Y.; Li, C.S.; Trettin, C.C.; Li, H.; Sun, G. An integrated model of soil, hydrology, and vegetation for carbon dynamics in wetland ecosystems. Glob. Biogeochem. Cycles 2002, 16, 1–17. [Google Scholar] [CrossRef] [Green Version]
- Zhuang, Q.; Melillo, J.M.; Kicklighter, D.W.; Prinn, R.G.; Mc Guire, A.D.; Steudler, P.A.; Felzer, B.S.; Hu, S. Methane fluxes between terrestrial ecosystems and the atmosphere at northern high latitudes during the past century: A retrospective analysis with a process-based biogeochemistry model. Glob. Biogeochem. Cycles 2004, 18, GB3010. [Google Scholar] [CrossRef]
- Riley, W.J.; Subin, Z.M.; Lawrence, D.M.; Swenson, S.C.; Torn, M.S.; Meng, L.; Mahowald, N.M.; Hess, P. Barriers to predicting changes in global terrestrial methane fluxes: Analyses using CLM4Me, a methane biogeochemistry model integrated in CESM. Biogeosciences 2011, 8, 1925–1953. [Google Scholar] [CrossRef] [Green Version]
- Xu, K.; Kong, C.F.; Liu, J.Q.; Wu, Y. Using Methane Dynamic Model to Estimate Methane Emission from Natural Wetlands in China. In Proceedings of the 2010 18th International Conference on Geoinformatics, Beijing, China, 18–20 June 2010. [Google Scholar]
- Wei, D.; Wang, X.D. Recent climatic changes and wetland expansion turned Tibet into a net CH4 source. Clim. Chang. 2017, 144, 657–670. [Google Scholar] [CrossRef]
- Li, T.T.; Zhang, Q.; Cheng, Z.G.; Ma, Z.F.; Liu, J.; Luo, Y.; Xu, J.J.; Wang, G.C.; Zhang, W. Modeling CH4 emissions from natural wetlands on the Tibetan Plateau over the past 60 years: Influence of climate change and wetland loss. Atmosphere 2016, 7, 90. [Google Scholar] [CrossRef] [Green Version]
- Foley, J.A.; Prentice, I.C.; Ramankutty, N.; Levis, S.; Pollard, D.; Sitch, S.; Haxeltine, A. An integrated biosphere model of land surface processes, terrestrial carbon balance, and vegetation dynamics. Global Biogeochem. Cy. 1996, 10, 603–628. [Google Scholar] [CrossRef]
- Kucharik, C.J.; Foley, J.A.; Delire, C.; Fisher, V.A.; Coe, M.T.; Lenters, J.D.; Young-Molling, C.; Ramankutty, N.; Norman, J.M.; Gower, S.T. Testing the performance of a dynamic global ecosystem model: Water balance, carbon balance, and vegetation structure. Glob. Biogeochem. Cycles 2000, 14, 795–825. [Google Scholar] [CrossRef]
- Zhu, Q.A.; Peng, C.H.; Chen, H.; Fang, X.Q.; Liu, J.X.; Jiang, H.; Yang, Y.Z.; Yang, G. Estimating global natural wetland methane emissions using process modelling: Spatio-temporal patterns and contributions to atmospheric methane fluctuations. Global Ecol. Biogeogr. 2015, 24, 959–972. [Google Scholar] [CrossRef]
- Zhang, X.; Zhu, Q.A.; Yang, B.; Wang, J.Y.; Chen, H.; Peng, C.H. Evaluating patterns of wetland methane emissions in Qinghai-Tibet plateau based on process model. Acta Ecol. Sin. 2020, 40, 3060–3071. [Google Scholar]
- Zhu, Q.A.; Peng, C.; Liu, J.; Jiang, H.; Fang, X.; Chen, H.; Niu, Z.; Gong, P.; Lin, G.; Wang, M.; et al. Climate-driven increase of natural wetland methane emissions offset by human-induced wetland reduction in China over the past three decades. Sci. Rep. 2016, 6, 38020. [Google Scholar] [CrossRef] [PubMed]
- Taylor, K.E.; Stouffer, R.J.; Meehl, G.A. An overview of CMIP5 and the experiment design. Bull. Am. Meteorol. Soc. 2011, 93, 485–498. [Google Scholar] [CrossRef] [Green Version]
- Niu, Z.G.; Zhang, H.Y.; Wang, X.W.; Yao, W.B.; Zhou, D.M.; Zhao, K.Y.; Zhao, H.; Li, N.N.; Huangm, H.B.; Li, C.C.; et al. Mapping wetland changes in China between 1978 and 2008. Chin. Sci. Bull. 2012, 57, 2813–2823. [Google Scholar] [CrossRef] [Green Version]
- Hutchinson, M.F.; Gessler, P.E. Splines: More than just a smooth interpolator. Geoderma 1994, 62, 45–67. [Google Scholar] [CrossRef]
- Sun, G.Y. Development and prospect of wetland science in China. Adv. Earth Sci. 2000, 15, 666–672. [Google Scholar]
- Sun, Z.G.; Liu, J.S.; Li, B. The actuality, problems and sustainable utilization countermeasures of wetland resources in China. J. Arid. Land Resour. Environ. 2006, 20, 83–88. [Google Scholar]
- Lemly, A.D.; Kingsford, R.T.; Thompson, J.R. Irrigated agriculture and wildlife conservation: Conflict on a global scale. Environ. Manag. 2000, 25, 485–512. [Google Scholar] [CrossRef]
- Zhao, K.Y. Wetlands of China; Science Press: Beijing, China, 1999. [Google Scholar]
- Xu, Y.; Ding, Y.H.; Li, D.L. Climatic Change over Qinghai and Xizang in 21st Century. Plateau Meteorol. 2003, 22, 451–457. [Google Scholar]
- Liu, J.G.; Zhu, Q.A.; Shen, Y.; Yang, Y.Z.; Luo, Y.P.; Peng, C.H. Spatiotemporal variations of natural wetland CH4 emissions over China under future climate change. Chin. J. Appl. Ecol. 2015, 26, 3467–3474. [Google Scholar]
- Gedney, N.; Cox, P.M.; Huntingford, C. Climate feedback from wetland methane emissions. Environ. Res. Lett. 2004, 31, L20503. [Google Scholar] [CrossRef] [Green Version]
- Koffi, E.N.; Bergamaschi, P.; Alkama, R.; Cescatti, A. An observation-constrained assessment of the climate sensitivity and future trajectories of wetland methane emissions. Sci. Adv. 2020, 6, eaay4444. [Google Scholar] [CrossRef] [PubMed] [Green Version]
- Bhattacharyya, P.; Roy, K.S.; Neogi, S.; Dash, P.K.; Nayak, A.K.; Mohanth, S.; Baig, M.J.; Sarkar, R.K.; Rao, K.S. Impact of elevated CO2 and temperature on soil C and N dynamics in relation to CH4 and N2O emissions from tropical flooded rice. Sci. Total Enciron. 2013, 461, 601–611. [Google Scholar] [CrossRef] [PubMed]
- Meng, W.Q.; Wu, Z.L.; Wang, Z.L. Control factors and critical condition between carbon sinking and sourcing of wetland ecosystem. Ecol. Environ. Sci. 2011, 20, 1359–1366. [Google Scholar]
- van Huissteden, J.; Maximov, T.C.; Dolman, A.J. High methane flux from an arctic floodplain (Indigirka lowlands, eastern Siberia). J. Geophys. Res.-Biogeosci. 2009, 144, G02018. [Google Scholar] [CrossRef] [Green Version]
- Dijkstra, F.A.; Morgan, J.A.; Follett, R.F.; Lecain, D.R. Climate change reduces the net sink of CH4 and N2O in a semiarid grassland. Global Chang. Biol. 2013, 19, 1816–1826. [Google Scholar] [CrossRef] [Green Version]
- Guo, J.; Zhang, M.; Zhang, L.; Deng, A.; Bian, X.; Zhu, J.; Zhang, W. Responses of dissolved organic carbon and dissolved nitrogen in surface water and soil to CO2 enrichment in paddy field. Agric. Ecosyst. Environ. 2011, 140, 273–279. [Google Scholar] [CrossRef]
- Melton, J.R.; Wania, R.; Hodson, E.L.; Hodson, E.L.; Poulter, B.; Ringeval, B.; Spahni, R.; Bohn, T.; Avis, C.A.; Beerling, D.J.; et al. Present state of global wetland extent and wentland methane modeling: Conclusions from a model inter-comparison project (WETCHIMP). Biogeosciences 2013, 10, 753–788. [Google Scholar] [CrossRef] [Green Version]
- Shindell, D.T.; Walter, B.P.; Faluvegi, G. Impacts of climate change on methane emissions from wetlands. Environ. Res. Lett. 2004, 31, L21202. [Google Scholar] [CrossRef]
- Wolf, A.A.; Drake, B.G.; Erickson, J.E.; Megonigal, J.P. An oxygen-mediated positive feedbake between elevated carbon dioxide and soil organic matter decomposition in a simulated anaerobic wetland. Global Chang. Biol. 2007, 13, 2036–2044. [Google Scholar] [CrossRef]
- Fenner, N.; Freeman, C.; Lock, M.A.; Harmens, H.; Reynolds, B.; Sparks, T. Interactions between elevated CO2 and warming could amplify DOC exports from peatland catchments. Environ. Sci. Technol. 2007, 41, 3146–3152. [Google Scholar] [CrossRef] [PubMed]
- Valk, A.G.V.D. Water-level fluctuations in North American prairie wetlands. Hydrobiologia 2005, 539, 171–188. [Google Scholar] [CrossRef]
- Wang, J.; Zhu, Q.; Yang, Y.; Zhang, X.; Zhang, J.; Yuan, M.; Chen, H.; Peng, C. High uncertainties detected in the wetlands distribution of the Qinghai–Tibet Plateau based on multisource data. Landsc. Ecol. Eng. 2020, 16, 47–61. [Google Scholar] [CrossRef]
- Eliseev, A.V.; Mokhov, I.I.; Arzhanov, M.M.; Demchenko, P.F.; Denisov, S.N. Interaction of the methane cycle and processes in wetland ecosystems in a climate model of intermediate complexity. Izv. Atmos. Ocean. Phys. 2008, 44, 139–152. [Google Scholar] [CrossRef]
- Volodin, E.M. Methane cycle in the INM RAS climate model. Izv. Atmos. Ocean. Phys. 2008, 44, 153–159. [Google Scholar] [CrossRef]


| Name | Radiative Forcing | CO2 Concentration * | Pathway Trend | Development Team | Projected Temperature Increase by 2100 (°C) |
|---|---|---|---|---|---|
| RCP2.6 | Peaks at 2.6 W·m−2 before 2100, then declines | Peaks at 442 ppm, then declines before 2100 | It peaks and then declines | IMAGE (NMP) | 2.4 |
| RCP4.5 | Stabilizes at 4.5 W·m−2 after 2100 | Reaches 538 ppm after 2100 | No more than the target level to achieve stability | MiniCAM (PNNL) | 3.6 |
| RCP8.5 | Exceeds 8.5 W·m−2 by 2100 | Reaches 936 ppm in 2100 | Rises | MESSAGE (IIASA) | 6.9 |
| Climate Model | Model | Original Resolution (Raster Data) | Institution and Country |
|---|---|---|---|
| 1 | BCC-CSM1-1 | 64 × 128 | China Climate Center, China |
| 2 | BCC-CSM1-1-m | 64 × 128 | China Climate Center, China |
| 3 | BNU-ESM | 64 × 128 | Beijing Normal University, China |
| 4 | CanESM2 | 64 × 128 | Canadian Centre for Climate Models and Analysis, China |
| 5 | CCSM4 | 192 × 288 | National Center for Atmospheric Research (NCAR), USA |
| 6 | CESM1-CAM5 | 192 × 288 | National Center for Atmospheric Research (NCAR), USA |
| 7 | CNRM-CM5 | 128 × 256 | Centre National de Researches Meteorologiques, France |
| 8 | CSIRO-Mk3-6-0 | 96 × 192 | CSIRO-Marine and Atmospheric Research, Australia |
| 9 | FGOALS-g2 | 64 × 128 | State Key Laboratory for Numerical Simulation of Atmospheric Science and Hydrodynamics, Institute of Atmospheric Physics, Chinese Academy of Sciences, China |
| 10 | GFDL-CM3 | 90 × 144 | Geophysical Fluid Dynamics Laboratory, USA |
| 11 | GFDL-ESM2G | 90 × 144 | Geophysical Fluid Dynamics Laboratory, USA |
| 12 | GFDL-ESM2M | 90 × 144 | Geophysical Fluid Dynamics Laboratory, USA |
| 13 | GISS-E2-H | 90 × 144 | Goddard Institude for Space Studies (NASA), USA |
| 14 | GISS-E2-R | 90 × 144 | Goddard Institude for Space Studies (NASA), USA |
| 15 | HadGEM2-AO | 144 × 192 | NIMR-KMA, South Korea |
| 16 | IPSL-CM5A-LR | 96 × 96 | Institut Pierre-Simon Laplace, France |
| 17 | IPSL-CM5A-MR | 96 × 96 | Institut Pierre-Simon Laplace, France |
| 18 | MIROC5 | 128 × 256 | Atmosphere and Ocean Research Institude (University of Tokyo), Japan |
| 19 | MIROC-ESM | 64 × 128 | Japan Agency for Marine-Earth Science and Technology, Atmosphere and Ocean Research Institude (University of Tokyo), Japan |
| 20 | MIROC-ESM-CHEM | 64 × 128 | Japan Agency for Marine-Earth Science and Technology, Atmosphere and Ocean Research Institude (University of Tokyo), Japan |
| 21 | MPI-ESM-LR | 96 × 194 | Max-Planck Institute of Meteorology, Germany |
| 22 | MPI-ESM-MR | 96 × 194 | Max-Planck Institute of Meteorology, Germany |
| 23 | MRI-CGCM3 | 160 × 320 | Meteorological Research Institute, Japan |
| 24 | NorESM1-M | 96 × 144 | Norwegian Climate Center, Norway |
Publisher’s Note: MDPI stays neutral with regard to jurisdictional claims in published maps and institutional affiliations. |
© 2022 by the authors. Licensee MDPI, Basel, Switzerland. This article is an open access article distributed under the terms and conditions of the Creative Commons Attribution (CC BY) license (https://creativecommons.org/licenses/by/4.0/).
Share and Cite
Zhang, X.; Wang, J.; Zhang, J.; Chen, H.; Peng, C.; Zhu, Q. Temporal and Spatial Variation of Wetland CH4 Emissions from the Qinghai–Tibet Plateau under Future Climate Change Scenarios. Atmosphere 2022, 13, 854. https://doi.org/10.3390/atmos13060854
Zhang X, Wang J, Zhang J, Chen H, Peng C, Zhu Q. Temporal and Spatial Variation of Wetland CH4 Emissions from the Qinghai–Tibet Plateau under Future Climate Change Scenarios. Atmosphere. 2022; 13(6):854. https://doi.org/10.3390/atmos13060854
Chicago/Turabian StyleZhang, Xian, Jieyi Wang, Jiang Zhang, Huai Chen, Changhui Peng, and Qiuan Zhu. 2022. "Temporal and Spatial Variation of Wetland CH4 Emissions from the Qinghai–Tibet Plateau under Future Climate Change Scenarios" Atmosphere 13, no. 6: 854. https://doi.org/10.3390/atmos13060854
APA StyleZhang, X., Wang, J., Zhang, J., Chen, H., Peng, C., & Zhu, Q. (2022). Temporal and Spatial Variation of Wetland CH4 Emissions from the Qinghai–Tibet Plateau under Future Climate Change Scenarios. Atmosphere, 13(6), 854. https://doi.org/10.3390/atmos13060854