Abstract
Heatwaves can produce catastrophic effects on public health and natural systems, especially under global warming. There are two methods to measure heatwaves, computed by relative and absolute thresholds, namely relative and absolute heatwaves (RHWs and AHWs). Generally, AHWs mostly occur in hot areas because of fixed thresholds, while RHWs represent anomalous events for the local climate, making them possible everywhere in the warm season. Based on observations and CMIP6 outputs, this study compared AHWs and RHWs in Eastern China (EC) with five sub-regions [Northeast China (NEC), North China (NC), Lower Yangtze River (LYR), Middle Yangtze River (MYR) and South China (SC)]. Similarities among RHWs and AHWs were found in present-day trends (1995–2014) and spatial distributions. The heatwave intensity/days for RHWs and AHWs both displayed highest future increases in northern/southern EC, and the increases for 2081–2100 would be 1.5 times as high as 2041–2060. All these similarities illustrate that applying either relative or absolute thresholds in EC, historical temporal variations, changing future spatial patterns, and increasing ratio from 2081–2100 to 2041–2060, would show reliable results. As far as differences are concerned, RHWs were observed across the entire EC, while AHWs did not show up in parts of NC and NEC. Considering model performance, RHWs would perform better than AHWs in most areas of EC. The annual heatwave intensity/days were higher for RHWs than for AHWs during present-day and future periods, which might overestimate heat-related risks. Overall, this study recommended RHWs for heatwave analyses, particularly for future projections, but for risk assessment, the choice of thresholds is crucial. The results reinforced the necessity to further improve model performance to address various needs.
1. Introduction
Heatwave events have become one of the most prevalent and immediate global dangers due to climate warming [1,2], which poses a serious threat to human health, energy infrastructure and outdoor activities [3,4]. For instance, the 1995 heatwave in Chicago killed 739 people [5]. The 2003 and 2010 extreme heatwaves in Europe both caused thousands of deaths and damaged the economy severely [6]. Since the world has not achieved convincing and sustained emissions reduction, CO2 releases are still growing, which has already led to a rise in global warming of 1.2 °C, making 2015–2019 the hottest five years on record [7]. The record-breaking North American heatwave in 2021 led to nearly 1000 deaths and widespread wildfires [8]. Global warming has also increased heatwaves in China, posing significant negative impacts [9]. In 2020, approximately 14,500 deaths and 31.5 billion work hours were lost due to heatwaves in China (1.3% of the national total), resulting in an economic loss of ~1.4% of the national annual GDP [10]. IPCC AR6 indicates that under anthropogenic forcing, the risk from heat waves would increase as future global warming intensifies [11].
Eastern China (EC), located on the eastern edge of the East Asian continent and the western coast of the Pacific Ocean, is the most economically developed, highly educated, densely populated and important industrial-agricultural production area in China. The rapid development of EC has a mission to lead and experiment for China, therefore this region is ahead of development and restructuring so as to play an important and pioneering role in comprehensive and deepening reform. In recent years, heatwave events in EC have occurred frequently, having serious impacts on public health and the economy. For example, the 2013 heatwave in the Yangtze River Delta region caused about 160 deaths in Pudong Shanghai, and several provinces experienced unprecedented heat events that inflicted approximately 59 billion CNY in damages [12]. The 2018 heatwave in Northeast China and North China caused drought over at least 65 million acres of cropland, leaving more than 4.6 million people short of drinking water, and increased water temperatures resulted in massive fish deaths from oxygen deprivation [11]. The number of deaths from heatwaves in each province of Eastern China for 2020 was above 500, and in five provinces exceeded 1000 (Guangdong Province exceeded 2000) [10].
However, since there is no standard definition for heatwaves [13], studies on the historical analysis [14,15] and future prediction [16,17] of EC heat waves remain uncertain. According to the high-temperature criterion, heatwaves can be absolute or relative [18]. Absolute heatwaves identify high-temperature by using a fixed threshold. Based on the climate and environment in China, the China Meteorological Administration defines a heatwave event as three consecutive days of daily maximum temperatures above 35 °C. This methodology (absolute threshold) can capture the actual relationship between heatwaves and public health risks in most cities of China, and therefore is valuable in weather prediction and early warning of disaster. Whereas, given the simulation biases of climate models for temperature, research in climate projections mostly define heatwaves by means of relative thresholds, i.e., thresholds calculated from climatological temperatures. When heatwaves are defined, relevant characteristics such as frequency, intensity, and duration can be computed, and historical and future changes investigated. Therefore, it is important to figure out how to define heatwaves.
It has been pointed out that appropriate heatwave measurements for different regions need to be further discussed. Robinson [13] investigated how to select appropriate thresholds to identify heatwaves in different parts of the United States. Meehl and Tebaldi [19] used two approaches to project future heatwaves in Europe and North America. Wang et al. [18] analyzed the spatial types of heatwaves in China by using observational data for absolute and relative definitions, but did not focus on model simulations and future projections. Absolute and relative measurements both have the potential to lead to overestimation or underestimation of heatwave events in some areas. Adequate measurement of heatwaves could help to improve the understanding of heat events in different regions and provide useful information for strategic planning. For EC, in which areas would the two methods of measuring heatwaves produce large/small differences? How will the two measurements perform in future projections? This study aims to provide an in-depth analysis in terms of observations, model historical simulations and future predictions.
2. Data and Methods
2.1. Observational Data
The observed daily maximum air temperature data (CN05.1) [20] for China, from 1961 to 2019, with 0.25° horizontal resolution, is used to calculate the heatwave indices in eastern China. It is also used to examine the performance of CMIP6 model simulations regarding current heatwaves.
2.2. CMIP6 Climate Projections
The Intergovernmental Panel on Climate Change (IPCC), has considered comprehensive factors, including population, economy, technological progress and resource utilization, as well as the newly proposed Shared Socioeconomic Pathway (SSP), in its latest assessment to quantify the relationship between climate change and socio-economic development [21]. This framework combined the SSP with previously assessed future climate representative concentration pathways (RCPs) to generate new emission scenarios [22,23,24]. Under these new SSPs, the Coupled Model Intercomparison Project phase 6 (CMIP6) has provided the latest climate projections, which are expected to be more reliable, as they are generated using a greater number of improved climate models than in previous phases [25,26,27].
Based on the availability of daily maximum surface air temperatures, this study used 27 climate models in the CMIP6 archives [25]. Supplementary Table S1 lists the basic information of these models, details of which can be found at https://esgf-node.llnl.gov/projects/cmip6 (accessed on 3 March 2022). Historical simulations (1850–2014) and future projections (2015–2100) under three emission scenarios were analyzed. These scenarios, SSP1-2.6, SSP2-4.5 and SSP5-8.5, represent the global forcing pathways of RCP2.6, RCP4.5 and RCP8.5, respectively, under the socioeconomic conditions of SSP1, SSP2 and SSP5.
The selected three future scenarios are in Tier-1 and are required for all climate models participating in the Scenario Model Intercomparison Project for CMIP6. SSP1-2.6, SSP2-4.5 and SSP5-8.5 represent low-emission, middle-emission and high-emission pathways, respectively. SSP1-2.6 combines low vulnerability with low challenges for mitigation (SSP1) as well as a low forcing of 2.6 Wm−2. SSP2-4.5 combines intermediate societal vulnerability (SSP2) with an intermediate forcing of 4.5 Wm−2. SSP5-8.5 consists of the only SSP scenario with high enough emission (SSP5) to generate a radiative forcing of 8.5 Wm−2 in 2100. All models used in this study produced multiple realizations with varying initial conditions. Here, only the first realization of each model was selected for the analysis.
In this study, the present-day period (1995–2014) is selected as the baseline, and the future projection period focuses on 2041–2060 and 2081–2100 of the 21st century. It is generally consistent with studies using CMIP6 [16,27].
2.3. Heatwave Definitions
A heatwave is generally considered to be a high-temperature event for several consecutive days. This study aims to compare the differences between the heatwaves defined by relative and absolute thresholds. Absolute threshold-defined heatwaves (AHWs) are commonly used in meteorological observations. The fixed value of 35 °C is set as the threshold, and at least three consecutive days of the daily maximum temperature (Tmax) exceeding this threshold is considered an AHW event [28]. For relative threshold-defined heatwaves (RHWs), the 90th percentile of Tmax (Tx90) of the baseline period (1995–2014 in this study) is generally used as the threshold, and at least four consecutive days with Tmax above this threshold are considered a heatwave [29]. The parameters used to define RHW and AHW are listed in Table 1 [29,30,31]. These two measurements are representative and widely accepted by most studies [18,32], and they differ not only in the threshold but also in the minimum consecutive days (Table 1). Previous studies [32,33] and our further investigations (in the Section 4) suggest that the minimum number of consecutive days is currently applicable for both RHW and AHW, and the slight changes (e.g., 3 to 4 for AHW) would not affect the results too much.

Table 1.
Details for the RHW and AHW.
On this basis, we defined the annual heatwave days (HWAD) and the annual heatwave intensity (HWAI) as specific descriptions for the duration and intensity of heatwave events. HWAD is the overall heatwave days in a year, and HWAI is defined as the average of the difference between Tmax and Tx90 for all days during the heatwave period in a year. Their calculations are described as follows:
where D is the overall days of the heatwave events in a year, and Tmaxi is the Tmax of the day i during the heatwave.
In this study, the sub-regions within EC are shown in Figure 1 and detailed in Table S2, which are Northeast China (NEC), North China (NC), Lower Yangtze River (LYR), Middle Yangtze River (MYR) and South China (SC). These regions contain the cultural center, economic centers and demographic areas of China (Figure 1b), as well as important industrial, agricultural and forestry production areas in China. This study used the period 1995–2014 as the baseline and selected two future 20-year windows to capture the major population (2041–2060) and climate changes (2081–2100) in China [29].
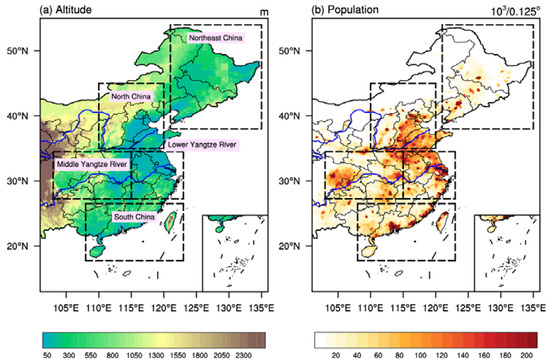
Figure 1.
Maps of (a) terrain height (m) and (b) population density (1000 per grid with 0.125° resolution). The black dashed frames indicate the scope of each sub-region.
3. Results
3.1. Observations and Model Historical Simulations
The threshold is a key factor in measuring heatwaves. AHWs may not be observed in some areas due to fixed temperature threshold limits, while for RHWs this would not happen, as the threshold is dynamically based on the local climate. We analyzed the differences between the two thresholds (the relative minus the absolute) for the observed results, multi-model ensemble means (MMEs), and each CMIP6 model simulation were analyzed. For the observations (Figure 2a), the relative thresholds in most areas of EC are lower than 35 °C. Results for NEC and the northwest part of NC range from −10 °C to −5 °C, indicating a potentially large difference in RHWs and AHWs. For model simulations, the MMEs showed patterns consistent with the observed results, except in some areas (mostly in NC) where the relative thresholds exceed 35 °C (Figure 2b). Among CMIP6 multiple simulations (Figure S1), most have similar patterns to the observed results and MME patterns, although some simulated large areas with relative thresholds above 35 °C (e.g., BCC-CSM2-MR and FOGALS-g3) and some simulated thresholds much lower than 35 °C (e.g., CESM2 and NESM). Overall, both observations and model simulations (i.e., MMEs) exhibited the fact that relative thresholds in most areas of EC were lower than the absolute threshold (35 °C), with great magnitudes in NEC and parts of NC.
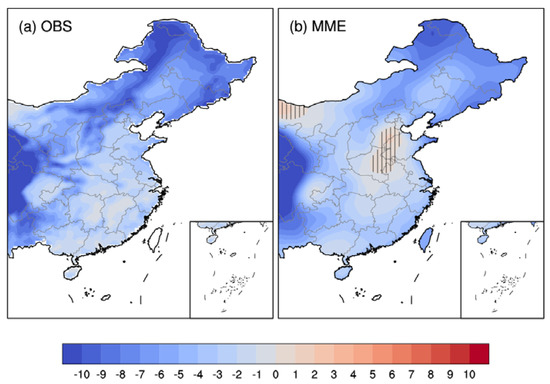
Figure 2.
Differences between the relative threshold and the absolute threshold (35 °C): (a) Observations and (b) MME. The vertical-line areas indicate values greater than zero.
The HWAI and HWAD of RHW are abbreviated as R-HWAI and R-HWAD, and the HWAI and HWAD of AHW are abbreviated as A-HWAI and A-HWAD. To investigate the similarities and differences between RHW and AHW, we first compared the heatwave features in the observations. As shown in Figure 3, A-HWAI and A-HWAD were not observed in some areas of EC (Figure 3b,e), while R-HWAI and R-HWAD were observed everywhere (Figure 3a,c). The missing A-HWAI and A-HWAD were mostly in the NEC and northwest part of NC, which was consistent with the area of large differences in Figure 2. The differences between RHW and AHW (RHW minus AHW) demonstrated that the R-HWAI and R-HWAD were respectively higher than the A-HWAI and A-HWAD in most areas of EC (Figure 3c,f). Besides, the regional averages for most sub-regions showed great differences between R-HWAD and A-HWAD, and small differences between R-HWAI and A-HWAI (Figure 4). Take the observations as an example (white bars in Figure 4), the R-HWAI was no more than 1 °C higher than A-HWAI in each region, with the greatest differences in NEC (~1 °C). While for the comparisons of R-HWAD and A-HWAD (Figure 4b), there were ~20 more heatwave days per year for RHW than AHW, with the largest difference also in NEC (~21 days). For MME simulations (colored bars in Figure 4), R-HWAI was about ~0.5 °C higher than A-HWAI in each sub-region, while R-HWAD was 4–8 days higher than A-HWAD, still with the largest differences in NEC. Consequently, for both the observed results and CMIP6 simulations, RHW and AHW differ more in duration (R-HWAD versus A-HWAD) than in intensity (R-HWAI versus A-HWAI), and NEC showed the largest difference among the five sub-regions.
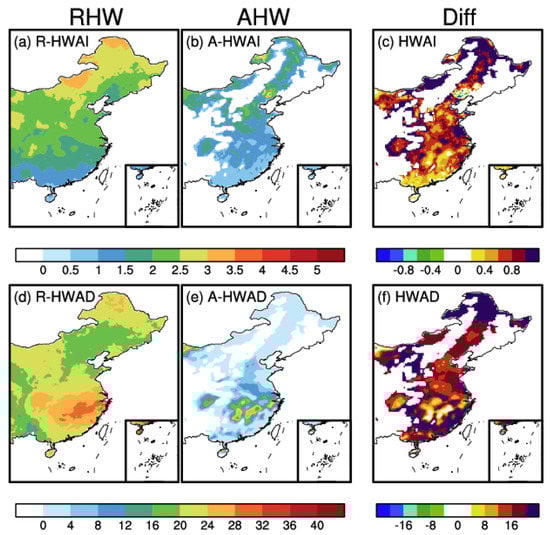
Figure 3.
Observed heatwave indicators averaged for present-day (1995–2014). RHW (a,b) and AHW (d,e) represent the results calculated by the relative and the absolute thresholds. Diff (c,f) is the result of RHW minus AHW. The units for HWAI and HWAD are °C and days, respectively. The HWAI and HWAD of RHW are represented by R-HWAI and R-HWAD, and the HWAI and HWAD of AHW are represented by A-HWAI and A-HWAD.
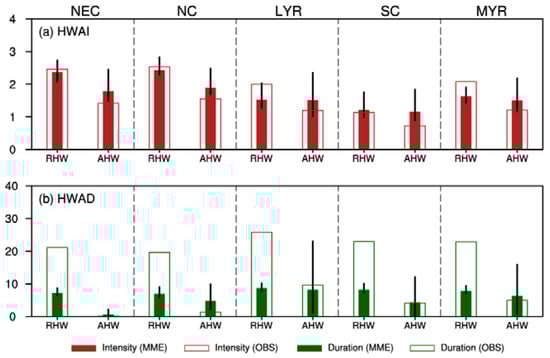
Figure 4.
Regional mean heatwave indicators of each sub-region for the present-day: (a) HWAI (°C) and (b) HWAD (days). RHW and AHW represent the results calculated by the relative and absolute thresholds, respectively. Colored and white bars represent the MMEs and observations. The perpendicular black lines at the top of the bars represent the variation between the 10th and 90th percentiles of the multi-model ensemble. NEC, NC, LYR, SC and MYR denote Northeast China, North China, Lower Yangtze River, South China and Middle Yangtze River, respectively.
Despite those differences, RHW and AHW showed similarities in spatial distributions. Both R-HWAI and A-HWAI showed a south-to-north increasing pattern in the EC (Figure 3a,b), with values above 1.5–2 °C in most areas of NEC and NC, whereas in SC were lower than 1 °C. Furthermore, the high-value areas for R-HWAD and A-HWAD were both located in MYR and LYR, where the heatwave days could reach 20–30 per year for the present-day period. This is consistent with previous relevant studies, which concluded that the frequency of heatwaves would be highest in parts of LYR, MYR and SC [34,35]. For the model simulations, the MME results were similar to the observed spatial distributions, although a few discrepancies existed, possibly due to climate model bias (Figure S2). The MME also simulated the south-to-north increasing pattern for the R-HWAI and A-HWAI (Figure S2a,b), and the high-value areas of R-HWAD and R-HWAD were also centered in MYR and LYR (Figure S2c). In addition to the spatial distribution, the heatwave indicators of the RHW also demonstrated good relationships with those of AHW on temporal scales. For each sub-region, both observed and MME simulated results showed significant positive correlations between their RHW and AHW in terms of intensity and duration (Table S3). Therefore, both in observations and model simulations, the heatwave characteristics for RHW and AHW in EC showed similar spatial patterns and temporal variations.
Focusing on the model performance, the MME simulated R-HWAD and A-HWAD both showed significant positive coefficients for spatial distributions with the observations in NEC, NC and MYR (Figure 5). Whereas the simulated regional mean A-HWAD was relatively closer to the observations than the R-HWAD (Figure 4b). Climate models generally struggle to perform well in simulations on temporal variation scales. The time series of the MME simulated R-HWAD and A-HWAD seemed slightly similar to the observations on trends but differ in the peaks and valleys (Figure 6), especially for induvial model simulations (Figure S3). The MME simulated R-HWAD showed significant positive correlation coefficients in MYR and LYR, while the A-HWAD only emerged in MYR (Figure 5). Overall, for the modeling performance on heatwave durations, both the A-HWAD and R-HWAD simulated well spatially in most regions, and the A-HWAD was closer to the observed in the regional mean; while for temporal variations, the R-HWAD was better. Regarding heatwave intensity, the regional averaged R-HWAI and A-HWAI archived from model simulations were both similar to the observations, with R-HWAI being relatively closer (Figure 4a). Meanwhile, significant positive spatial correlations between simulated and observed were found in most sub-regions for R-HWAI, while only in MYR for A-HWAI. The MME simulated R-HWAI and A-HWAI also demonstrated similar trends to observations on the time scale, but no significant relationship (Figure 5). Therefore, the models gave a better performance in simulating R-HWAI than A-HWAI.
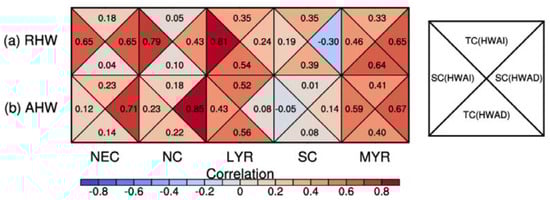
Figure 5.
Temporal (TC) and spatial correlations (SC) between the observations and MME simulations for the present-day. (a) represents the results for R-HWAI and R-HWAD, while (b) represents the results for A-HWAI and A-HWAD. The triangles in each grid cell represent the TC (HWAI), TC (HWAD), SC (HWAI) and SC (HWAD), respectively. A value greater than 0.42 implies statistical significance at the 0.05 level.
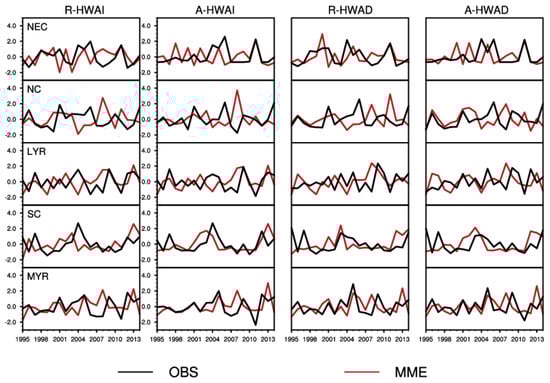
Figure 6.
Standardized time series of R-HWAI, A-HWAI, R-HWAD, and A-HWAD from 1995 to 2014 for five sub-regions in EC. Black and red solid lines indicate the observations and MME.
In conclusion, though the measurements differ, similarities remain together with differences. Comparing RHWs and AHWs, they existed with similar spatial patterns and temporal variations, while differing in the occurrence areas in EC. Model simulations also showed good relationships with observations in terms of spatial patterns, temporal trends, and regional mean heatwave indicators (R-HWAI, A-HWAI and A-HWAD), but demonstrated differences in temporal variations and regional mean HWAD. Overall, RHWs seemed to have better applicability than AHWs in most sub-regions of EC, and for LYR, the AHW was also achievable.
3.2. CMIP6 Future Projections
Due to its critical importance for strategic planning, future heatwave projections have received tremendous attention. Therefore, it is necessary to compare future projections in RHWs and AHWs. Focusing on two popular study periods (2041–2060 and 2081–2100, we analyzed the heatwave features of RHWs and AHWs in EC under three scenarios (SSP1-2.6, SSP2-4.5 and SSP5-8.5).
As shown in future changes relative to the present-day (Figure 7), the heatwave indicators of RHWs and AHWs displayed similar patterns for both 2041–2060 and 2081–2100. The R-HWAI and A-HWAI were projected to increase more in the northern part of EC (e.g., NEC and NC) than in the southern part (e.g., SC; Figure 7a,b). Conversely, the R-HWAD and A-HWAD would increase more in SC than in other sub-regions (Figure 7c,d). These findings are consistent with previous studies that used relative thresholds to compute extreme heat events [17,31], which concluded that the intensity of extreme heat (like R-HWAI and A-HWAI) would grow significantly in northern China, while the frequency (like R-HWAD and A-HWAD) would increase greatly in southern China. Furthermore, the magnitudes of high-value in AHWs were close to RHWs. For example, the maximum increased R-HWAI and A-HWAI over EC were both projected to be 3–4 °C for 2081–2100 under SSP5-8.5 (Figure 7b). Similarly, the highest increases for 208102100 under SSP5-8.5 would be nearly 80 days in both R-HWAI and A-HWAI (Figure 7d). Therefore, whether measured by relative or absolute thresholds, the spatial distributions of future changes relative to the present-day in the heatwaves of EC were robust.
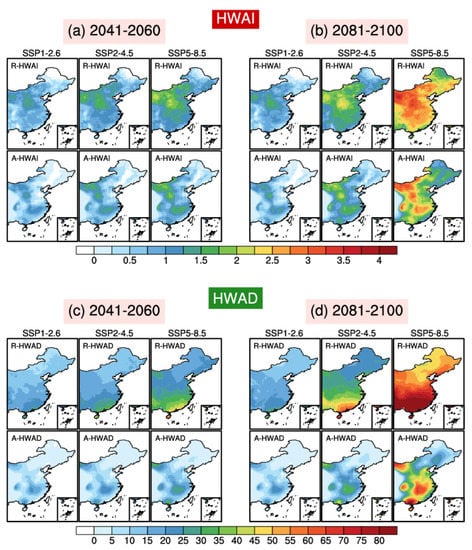
Figure 7.
Spatial patterns of future changes for 2041–2060 (a,c) and 2081–2100 (b,d) relative to present-day. R-HWAI (°C) and R-HWAD (days) are for RHW, while A-HWAI (°C) and A-HWAD (days) are for AHW.
However, differences were also projected between future changes in RHWs and AHWs. For spatial distributions, future increases in AHWs would be concentrated, while those in RHWs would distribute evenly (Figure 7), which could create differences in the regional mean of the five sub-regions. Under three scenarios, the regional mean increases in RHWs were projected to be higher than those for AHWs for both future periods (Figure 8 and Figure 9). For example, the increases in R-HWAI for 2041–2060 and 2081–2100 would reach 0.6–1.2 °C and 0.6–2.5 °C for the five sub-regions (Figure 8), about 0.3–0.8 °C and 0.3–1.2 °C higher than those in A-HWAI (0.1–0.8 °C and 0.2–2.1 °C), respectively. Furthermore, there would be about 3–22 and 4–77 more days per year for R-HWAD (8–29 and 10–102 days annually) than for A-HWAD (1–12 and 1–49 days) during 2041–2060 and 2081–2100 (Figure 9). Moreover, among the five sub-regions, the largest differences between R-HWAI and A-HWAI (R-HWAD and A-HWAD) were projected in NEC (SC), while the minimum was in LYR (NC). The differences between RHW and AHW under SSP5-8.5 would be greater than those under SSP1-2.6 and SSP2-4.5.
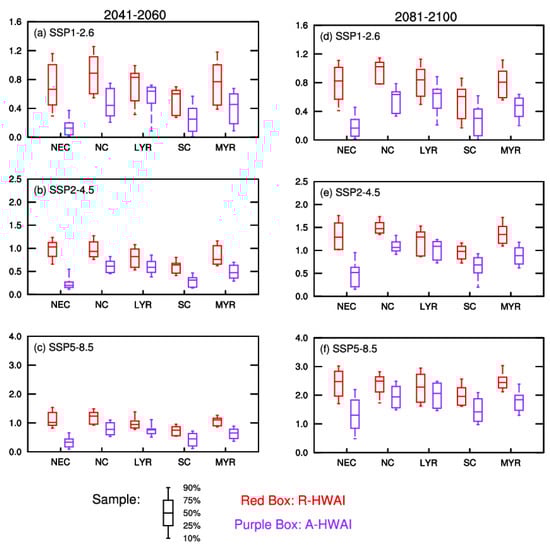
Figure 8.
Regional mean future changes in HWAI (°C) relative to present-day for 2041–2060 and 2081–2100 under SSP1-2.6 (a,d), SSP2-4.5 (b,e) and SSP5-8.5 (c,f). The red box and purple box indicate R-HWAI and A-HWAI, respectively. The box whisker plots are the 10th, 25th, 50th, 75th and 90th intervals.
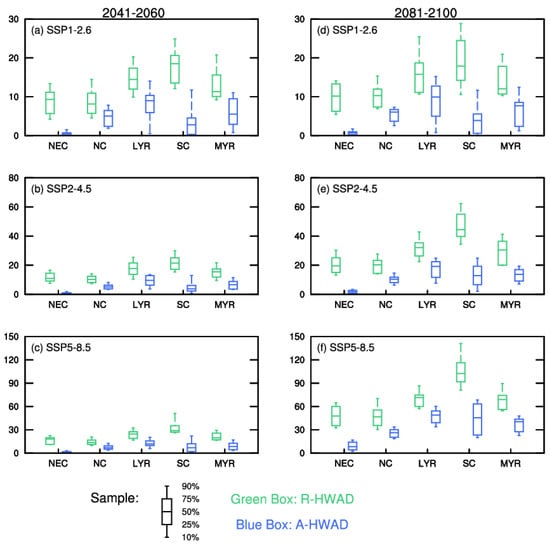
Figure 9.
Regional mean changes in HWAD (days) relative to present-day for 2041–2060 and 2081–2100 under SSP1-2.6 (a,d), SSP2-4.5 (b,e) and SSP5-8.5 (c,f). The green box and blue box indicate R-HWAD and A-HWAD, respectively. The box whisker plots are the 10th, 25th, 50th, 75th and 90th intervals.
Comparing 2081–2100 and 2041–2060 (2081–2100 minus 2041–2060), the spatial patterns for R-HWAI and A-HWAI also showed similarities to each other (Figure 10a), as well as for R-HWAD and A-HWAD (Figure 10b). For both R-HWAI and A-HWAI (Figure 10a), the large increases in 2081–2100 relative to 2041–2060 would fall in NC, MYR and LYR. While the R-HWAD and A-HWAD would increase more in SC among the five sub-regions (Figure 10b). Moreover, the increases from 2041–2060 to 2081–2100 in R-HWAI and R-HWAD would be higher than those in A-HWAI and A-HWAD, especially under SSP5-8.5. For example, the increases in R-HWAD over the whole SC would exceed 60 days, while such account for a small area in A-HWAD (Figure 10b). As a result, the regional average of the difference between the two future periods for RHW and AHW would differ greatly (Figure S4). However, when compared in terms of changing ratios, similarities between RHW and AHW emerged in most sub-regions (Figure 11). As displayed in Figure 11, under SSP1-2.6, SSP2-4.5 and SSP5-8.5, the results for 2081–2100 were projected to be about 1.0–1.2, 1.1–1.8 and 1.4–4.9 times as great as those for 2041–2060, respectively. The results for RHW and AHW would remain at a close level, and the uncertainties for NEC and SC would be wider than in other sub-regions. Especially under SSP5-8.5, the possible highest ratio would exceed 4/8 in HWAI/HWAD for NEC and SC (Figure 11c,f). This is consistent with previous studies which argued that uncertainties under a high emission pathway would be much greater than those under a low emission pathway [27,36].
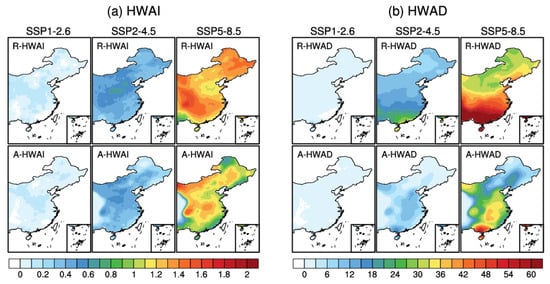
Figure 10.
Spatial patterns of the differences between 2081–2100 and 2041–2060 for (a) HWAI (°C) and (b) HWAD (days).
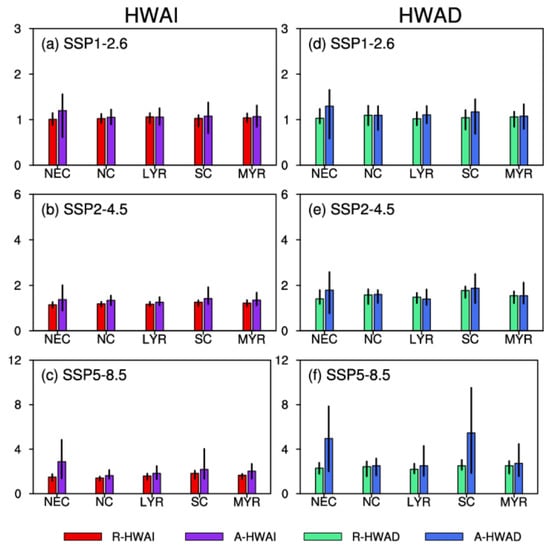
Figure 11.
Ratios of heatwave indicators for 2081–2100 to those for 2041–2060 under SSP1-2.6 (a,d), SSP2-4.5 (b,e) and SSP5-8.5 (c,f). Red, purple, green and blue bars represent R-HWAI, A-HWAI, R-HWAD and A-HWAD, respectively. The perpendicular black lines at the top of the bars represent the variation between the 10th and 90th percentiles of the multi-model ensemble.
Above all, the MME projections of future changes in RHWs and AHWs in EC showed similar spatial distributions, while their differences were found in regional average changes, especially in NEC and SC. When comparing the ratio of 2081–2100 to 2041–2060, RHW and AHW revealed robustly consistent results.
4. Discussions
This study suggested that RHWs would be more widely applicable than AHWs in EC, especially considering model performance. The results call for appropriate thresholds for measuring heatwaves, to produce robust conclusions about features, such as heatwave intensity and duration. Relative to previous relevant work [17,32,33,34,35], our study found similarities between RHWs and AHWs not only in observations, but also in simulations and projections of CMIP6. You et al. [34] mentioned that both observed RHWs and AHWs in most parts of China have had an increasing trend since 1990. Our results also found this in the observations and further suggested that the results from CMIP6 model simulations are similar, i.e., there is a consistent trend between RHWs and AHWs on the temporal scale. Furthermore, it could support previous conclusions on the temporal variability of heatwaves, such as the interdecadal changes of NEC, NC and SC heatwaves [14,15,36], which would not be compromised by the threshold selection methods. Meanwhile, future changing patterns of RHWs and AHWs both suggested similar spatial distributions, which supported previous findings [16,17,37] that the intensity (duration) of extreme heat events would increase more in northern (southern) China relative to southern (northern). The above indicates that different ways of measuring heatwaves would not change those previous conclusions.
Moreover, the two measurements selected in our study not only differ in the threshold but also in their minimum continuous days (4 for RHW and 3 for AHW). Previous studies have suggested that the current minimum consecutive days for both AHWs and RHWs were reasonable [14,18]. However, a question remains whether our findings would be very different if the minimum consecutive days were changed, for example, by setting AHWs to 4 days as well. Taking the observations as an example, the results of the 4-day-set AHW (Figure S5) displayed consistent spatial distributions with the 3-day-set AHW (Figure 3). For instance, the high values of the 4-day-set A-HWAD were also mainly located along the Yangtze River. Furthermore, the time series of 3-day-set (original) and 4-day-set AHW indicators (A-HWAD and A-HWAI, Figure S6) demonstrated consistent results for each sub-region, and the blue (3-day-set) and red (4-day-set) solid lines in Figure S6 are almost overlapping. The above indicates that changing the minimum consecutive days, e.g., making it the same level for RHWs and AHWs, would not affect our final results too much. Nevertheless, since the relative threshold is below the absolute threshold (35 °C) in most regions of China, it is reasonable that the minimum persistence of RHW is longer than that of AHW. Therefore, we suggested following the methodology of AHWs and RHWs derived from previous studies, i.e., the minimum number of consecutive days is 3 for AHWs and 4 for RHWs.
Limited by the absolute threshold, AHWs could not be observed everywhere, which caused major differences to RHWs. For example, observed AHWs were mostly located along the Yangtze River basin and its south region (Figure 3). Due to the model biases on temperature, the model would not show the close land fraction of heatwave as observed, which leads to a poor spatial simulation of AHWs (Figure S2). Whereas RHWs occur throughout EC and suffer very little from simulation bias, i.e., the model performs well in the spatial distribution of RHWs. This is why most previous studies on model simulations and projections employ relative thresholds to measure extreme heat events. However, considering AHWs are more closely associated with heat risks (e.g., heat-related health risks) compared to RHWs, it is necessary for AHWs to remain in future projections, especially in risk assessment. Sheridan et al. [38] compared the impacts of absolute and relative extreme high temperatures on human health in the US and found that the two types of extremes were similar on 0-day relative risks, but differed in cumulative 20-day relative risks. Our study found that future increases in RHWs were projected to be higher than AHWs, so risk assessments based on RHWs might be overestimated. In addition to AHWs and RHWs, compound heatwaves [35], with multiple factors (like humidity), were highly relevant to public health. Consequently, it is crucial to find appropriate methods for measuring heatwaves to establish robust linkages with heat-related risks.
Our future projections pointed out that northern China would increase more in heatwave intensity, and previous studies also suggested similar [17,27,36]. As persistent events, maintenance of heatwaves is usually supported by sustainable atmospheric systems [37,39,40]. Li et al. [41] found that 2018 European heatwaves were associated with a European blocking event, accompanied by positive North Atlantic Oscillation. Future changes in heatwaves may be related to many factors, not only anthropogenic impacts (e.g., global warming). Natural internal impacts, including soil moisture [42], Arctic amplification [43], Atlantic Multidecadal Oscillation [15], and El Niño-Southern Oscillation [14] may have some effects. For example, as global temperatures increase, Arctic Sea ice will possibly decrease sharply and its contribution to climate impacts at mid-high latitudes may increase [42,43,44]. Some research found that there existed a possible link between heat events in northern China and Barents-Kara Sea ice [45]. Meanwhile, studies also indicate a link between Arctic Sea ice and summer heatwaves of the North American continent in recent years [43,46]. Therefore, it is interesting to figure out why the northern region will have a greater future increase in heat intensity and how anthropogenic and natural factors contribute to this, which requires further in-depth study.
5. Conclusions
Based on relative and absolute thresholds, two approaches to measure heatwave events in five sub-regions of Eastern China (EC), namely Northeast China (NEC), North China (NC), Lower Yangtze River (LYR), Middle Yangtze River (MYR) and South China (SC), were investigated with a focus on observations, CMIP6 historical simulations, and future projections under three scenarios (SSP1-2.6, SSP2-4.5 and SSP5-8.5).
The relative heatwave (RHW) is defined as an event with daily maximum temperature exceeding the 90th percentile for at least four consecutive days, while the absolute heatwave (AHW) is an event with daily maximum temperature greater than 35 °C for no less than three consecutive days. RHWs and AHWs differ in their thresholds and minimum consecutive days, which leads to some differences in final results. Unlike RHWs, which occurred everywhere for the present-day period (1995–2014), observed and multi-model ensemble mean (MME) simulated AHW events did not appear in parts of NC and NEC. Besides, the annual heatwave intensity (HWAI) and heatwave days (HWAD) of the RHW (i.e., R-HWAI and R-HWAD) were higher than those of the AHW (i.e., A-HWAI and A-HWAD) for both observations and CMIP6 model simulations, and such cases were projected to continue in future periods, i.e., 2041–2060 and 2081–2100. For example, the increases from the present-day to 2081–2100 in R-HWAI (R-HWAD) would be about 0.3–1.2 °C higher than those in A-HWAI (A-HWAD), with the largest differences located in NEC (SC).
However, there remain many similarities between AHWs and RHWs. During the present-day period, both observations and MME simulations indicated that the time series of RHWs of each sub-region exhibited a significant positive correlation with the AHW. Furthermore, the spatial distributions of R-HWAI and A-HWAI (R-HWAD and A-HWAD) showed comparable patterns, with high values in the northern (southern) part of EC, which is consistent with previous relevant works [34,35]. Similarly, the MMEs also projected large future increases in R-HWAI and A-HWAI (R-HWAD and A-HWAD) for the northern (southern) part, which supported conclusions from previous studies that the intensity (duration) of extreme heat would increase more in northern (southern) China. Comparing 2081–2100 with 2041–2060, the increasing ratio for RHWs would be almost the same as that for AHWs, i.e., the heatwave indicators for 2081–2100 would be 1–5 times those for 2041–2060. All these similarities illustrate that applying either relative or absolute thresholds, the temporal variations of heatwaves in EC during the present-day period, the spatial distributions in future changes, and the increasing ratio for 2081–2100 relative to 2041–2060, show robust conclusions. Our further discussions indicated that changing the minimum consecutive days (e.g., 3 to 4 for AHW) would influence the above findings.
This study demonstrated the similarities and differences in heatwave measurements using relative and absolute thresholds for eastern China, and the results summarized the applicability of the two statistical methods for different research intentions and sub-regions. Considering the model performance on observations, RHWs would perform better than AHWs in NEC, NC and LYR and in MYR, both RHWs and AHWs could be applied, and conversely in SC, neither worked well. Whereas if only focusing on the analysis of historical temporal variations, both AHWs and RHWs are applicable but would differ in the distribution of spatial centers. Therefore, this study recommended RHWs for historical and future projections, but the choice of threshold is crucial for risk assessments.
Supplementary Materials
The following supporting information can be downloaded at: https://www.mdpi.com/article/10.3390/atmos13050649/s1, Figure S1: Differences between the relative threshold and the absolute threshold (35 °C) for each CMIP6 model. The vertical-line areas indicate values greater than zero; Figure S2: MME simulated heatwave indicators averaged for present-day (1995–2014). RHW (a & b) and AHW (d & e) represent the results calculated by the relative and the absolute thresholds. Diff (c & f) is the result of RHW minus AHW. The units of HWAI and HWAD are °C and days, respectively; Figure S3: Standardized time series of R-HWAI, A-HWAI, R-HWAD, and A-HWAD from 1995 to 2014 for five sub-regions in EC. Colored dashed lines are the result of each model; Figure S4: Regional mean changes in HWAI (°C) and HWAD (days) relative to 2041–2060 for 2081–2100 under SSP1-2.6 (a & d), SSP2-4.5 (b & e), and SSP5-8.5 (c & f). The red, purple, green, and blue box indicates R-HWAI, A-HWAI, R-HWAI, and A-HWAI, respectively. The box whisker plots are the 10th, 25th, 50th, 75th, and 90th intervals; Figure S5: Same as Figure 3, but the minimum consecutive days for AHW was changed to 4 days; Figure S6: Standardized time series of AHW indicators from 1995 to 2014 for five sub-regions in EC. Blue and red solid lines indicate the 3-day-set (original) and 4-day-set AHW; Table S1: Twenty-seven CMIP6 models basic information; Table S2: Details of subregions in Eastern China; Table S3: Temporal correlations between RHW and AHW during present-day period.
Author Contributions
Conceptualization, G.Z. and H.X.; methodology, G.Z.; software, H.X.; validation, H.X.; investigation, H.X.; resources, G.Z.; data curation, H.X.; writing, G.Z. and H.X.; supervision, G.Z. All authors have read and agreed to the published version of the manuscript.
Funding
The research was supported by the IUMKY202209 from the Institute of Urban Meteorology, Beijing, the U.S. National Science Foundation Innovations at the Nexus of Food, Energy and Water Systems under Grant EAR1903249, and the China Meteorological Administration/National Climate Center research subcontract 2211011816501.
Data Availability Statement
The CMIP6 datasets can be found at https://esgf-node.llnl.gov/projects/cmip6 (accessed on 3 March 2022).
Acknowledgments
The authors thank the three anonymous reviewers for their very helpful comments and suggestions.
Conflicts of Interest
The authors declare no conflict of interest.
Abbreviations
| MME | Multi-model ensemble mean |
| RHW | Relative heatwaves |
| AHW | Absolute heatwaves |
| HWAD | Annual heatwave days (days) |
| HWAI | Annual heatwave intensity (°C) |
| R-HWAD | Annual heatwave days of relative heatwaves (days) |
| A-HWAD | Annual heatwave days of absolute heatwaves (days) |
| R-HWAI | Annual heatwave intensity of relative heatwaves (°C) |
| A-HWAI | Annual heatwave intensity of absolute heatwaves (°C) |
References
- AghaKouchak, A.; Feldman, D.; Hoerling, M.; Huxman, T.; Lund, J. Water and climate: Recognize anthropogenic drought. Nature 2015, 524, 409–4011. [Google Scholar] [CrossRef] [PubMed]
- Coffel, E.D.; Horton, R.M.; de Sherbinin, A. Temperature and humidity based projections of a rapid rise in global heat stress exposure during the 21st century. Environ. Res. Lett. 2017, 13, 014001. [Google Scholar] [CrossRef] [PubMed]
- Mora, C.; Dousset, B.; Caldwell, I.R.; Powell, F.E.; Geronimo, R.C.; Bielecki, C.R.; Counsell, C.W.; Dietrich, B.S.; Johnston, E.T.; Louis, L.V.; et al. Global risk of deadly heat. Nat. Clim. Chang. 2017, 7, 501–506. [Google Scholar] [CrossRef]
- Schuster, C.; Honold, J.; Lauf, S.; Lakes, T. Urban heat stress: Novel survey suggests health and fitness as future avenue for research and adaptation strategies. Environ. Res. Lett. 2017, 12, 044021. [Google Scholar] [CrossRef]
- Dematte, J.E.; O’Mara, K.; Buescher, J.; Whitney, C.G.; Forsythe, S.; McNamee, T.; Adiga, R.B.; Ndukwu, I.M. Near-fatal heat stroke during the 1995 heat wave in Chicago. Ann. Intern. Med. 1998, 129, 173–181. [Google Scholar] [CrossRef] [PubMed]
- Robine, J.M.; Cheung, S.L.K.; Le, R.S.; Van, O.H.; Griffiths, C.; Michel, J.P.; Herrmann, F.R. Death toll exceeded 70,000 in Europe during the summer of 2003. Comptes. Rendus. Biol. 2008, 331, 171–178. [Google Scholar] [CrossRef]
- Watts, N.; Amann, M.; Arnell, N.; Ayeb-Karlsson, S.; Beagley, J.; Belesova, K.; Boykoff, M.; Byass, P.; Cai, W.; Campbell-Lendrum, D.; et al. The 2020 report of the Lancet Countdown on health and climate change: Responding to converging crises. Lancet 2021, 397, 129–170. [Google Scholar] [CrossRef]
- Cotlier, G.; Jimenez, J. The Extreme Heat Wave over Western North America in 2021: An Assessment by Means of Land Surface Temperature. Remote Sens. 2022, 14, 561. [Google Scholar] [CrossRef]
- Romanello, M.; McGushin, A.; Di Napoli, C.; Drummond, P.; Hughes, N.; Jamart, L.; Kennard, H.; Lampard, P.; Rodriguez, B.S.; Arnell, N.; et al. The 2021 report of the Lancet Countdown on health and climate change: Code red for a healthy future. Lancet 2021, 398, 1619–1662. [Google Scholar] [CrossRef]
- Cai, W.; Zhang, C.; Suen, H.P.; Ai, S.; Bai, Y.; Bao, J.; Chen, B.; Cheng, L.; Cui, X.; Dai, H.; et al. The 2020 China report of the Lancet Countdown on health and climate change. Lancet Public Health 2021, 6, e64–e81. [Google Scholar] [CrossRef]
- IPCC. Summary for Policymakers//Masson-Delmotte V, Zhai P, Pirani A; et al. Climate Change 2021: The Physical Science Basis. Contribution of Working Group I to the Sixth Assessment Report of the Intergovernmental Panel on Climate Change; Cambridge University Press: Cambridge, UK; New York, NY, USA, 2021. [Google Scholar]
- Sun, J. Record-breaking SST over mid-North Atlantic and extreme high temperature over the Jianghuai–Jiangnan region of China in 2013. Sci. Bull. 2014, 59, 3465–3470. [Google Scholar] [CrossRef]
- Robinson, P.J. On the definition of a heat wave. J. Appl. Meteorol. 2001, 40, 762–775. [Google Scholar] [CrossRef]
- Zhang, Z.; Sun, X.; Yang, X. Understanding the interdecadal variability of East Asian summer monsoon precipitation: Joint influence of three oceanic signals. J. Clim. 2018, 31, 5485–5560. [Google Scholar] [CrossRef]
- Zhang, G.; Zeng, G.; Li, C.; Yang, X. Impact of PDO and AMO on interdecadal variability in extreme high temperatures in North China over the most recent 40-year period. Clim. Dyn. 2020, 54, 3003–3020. [Google Scholar] [CrossRef]
- Zhang, G.; Zeng, G.; Iyakaremye, V.; You, Q. Regional changes in extreme heat events in China under stabilized 1.5 °C and 2.0 °C global warming. Adv. Clim. Chang. Res. 2020, 11, 198–209. [Google Scholar] [CrossRef]
- Zhang, G.; Zeng, G.; Yang, X.; Jiang, Z. Future Changes in Extreme High Temperature over China at 1.5 °C–5 °C Global Warming Based on CMIP6 Simulations. Adv. Atmos. Sci. 2021, 38, 253–267. [Google Scholar] [CrossRef]
- Wang, P.; Tang, J.; Wang, S.; Dong, X.; Fang, J. Regional heatwaves in china: A cluster analysis. Clim. Dyn. 2017, 50, 1901–1917. [Google Scholar] [CrossRef]
- Meehl, G.; Tebaldi, C. More intense, more frequent, and longer lasting heat waves in the 21st century. Science 2004, 305, 994–997. [Google Scholar] [CrossRef]
- Wu, J.; Gao, X. A gridded daily observation dataset over China region and comparison with the other datasets. Chin. J. Geophys. 2013, 56, 1102–1111. [Google Scholar]
- Moss, R.H.; Edmonds, J.A.; Hibbard, K.A.; Manning, M.R.; Rose, S.K.; van Vuuren, D.P.; Carter, T.R.; Emori, S.; Kainuma, M.; Kram, T.; et al. The next generation of scenarios for climate change research and assessment. Nature 2010, 463, 747–756. [Google Scholar] [CrossRef]
- Kriegler, E.; O’Neill, B.C.; Hallegatte, S.; Kram, T.; Lempert, R.J.; Moss, R.H.; Wilbalnks, T. The need for and use of socio-economic scenarios for climate change analysis: A new approach based on shared socio-economic pathways. Glob. Environ. Chang. 2012, 22, 807–822. [Google Scholar] [CrossRef]
- Van Vuuren, D.P.; Deetma, S.; van Vliet, J.; van den Berg, M.; van Ruijven, B.J.; Koelbl, B. The role of negative CO2 emissions for reaching 2 °C-insights from integrated assessment modelling. Clim. Chang. 2013, 118, 15–27. [Google Scholar] [CrossRef]
- O’Neill, B.C.; Kriegler, E.; Ebi, K.L.; Kemp-Benedict, E.; Riahi, K.; Rothman, D.S.; van Ruijven, B.J.; van Vuuren, D.P.; Birkmann, J.; Kok, K.; et al. The roads ahead: Narratives for shared socioeconomic pathways describing world futures in the 21st century. Glob. Environ. Chang. 2015, 42, 169–180. [Google Scholar] [CrossRef]
- Eyring, V.; Bony, S.; Meehl, G.A.; Senior, C.A.; Stevens, B.; Stouffer, R.J.; Taylor, K.E. Overview of the Coupled Model Intercomparison Project Phase 6 (CMIP6) experimental design and organization. Geosci. Model. Dev. 2016, 9, 1937–1958. [Google Scholar] [CrossRef]
- Jiang, J.; Zhou, T.; Chen, X.; Zhang, L. Future changes in precipitation over Central Asia based on CMIP6 projections. Environ. Res. Lett. 2020, 15, 054009. [Google Scholar] [CrossRef]
- Zhang, G.; Zeng, G.; Liang, X.Z.; Huang, C. Increasing heat risk in China’s urban agglomerations. Environ. Res. Lett. 2021, 16, 064073. [Google Scholar] [CrossRef]
- Liu, L.; Sun, L.; Liao, Y.; Zhu, Y.; Zou, X.; Wang, Y.; Yan, J. Development and application of national prediction systemfor extreme high temperature. Meteorol. Mon. 2008, 34, 102–107. [Google Scholar]
- Stéfanon, M.; Fabio, D.; Drobinski, P. Heatwave classification over Europe and the Mediterranean region. Environ. Res. Lett. 2012, 7, 14023. [Google Scholar] [CrossRef]
- Ren, F.; Cui, D.; Gong, Z.; Wang, Y.; Zou, X.; Li, Y.; Walng, S.; Wang, X. An objective identification technique for regional extreme events. J. Clim. 2012, 25, 7015–7027. [Google Scholar] [CrossRef]
- Wang, Y.; Ren, F.; Zhang, X. Spatial and temporal variations of regional high temperature events in China. Int. J. Climatol. 2014, 34, 3054–3065. [Google Scholar] [CrossRef]
- Smith, T.; Zaitchik, B.; Gohlke, J. Heat waves in the United States: Definitions, patterns and trends. Clim. Chang. 2013, 118, 811–825. [Google Scholar] [CrossRef] [PubMed]
- Wang, P.; Tang, J.; Sun, X.; Wang, S.; Wu, J.; Dong, X.; Fang, J. Heat waves in China: Definitions, leading patterns and connections to large-scale atmospheric circulation and SSTs. J. Geophys. Res. Atmos. 2017, 122, 10679–10699. [Google Scholar] [CrossRef]
- You, Q.; Jiang, Z.; Kong, L.; Wu, Z.; Bao, Y.; Kang, S.; Pepin, N. A comparison of heatwave climatologies and trends in China based on multiple definitions. Clim. Dyn. 2017, 48, 3975–3989. [Google Scholar] [CrossRef]
- Chen, Y.; Li, Y. An inter-comparison of three heatwave types in China during 1961–2010: Observed basic features and linear trends. Sci. Rep. 2017, 7, 1–10. [Google Scholar]
- Yang, X.; Zeng, G.; Zhang, G.; Li, J.; Li, Z.; Hao, Z. Interdecadal variations of different types of summer heatwaves in Northeast China and their possible relationships with AMO and PDO. J. Clim. 2021, 34, 7783–7797. [Google Scholar] [CrossRef]
- Li, D.; Zhou, T.; Zou, L.; Zhang, W.; Zhang, L. Extreme high-temperature events over East Asia in 1.5 °C and 2 °C warmer futures: Analysis of NCAR CESM low-warming experiments. Geophys. Res. Lett. 2018, 45, 1541–1550. [Google Scholar] [CrossRef]
- Sheridan, S.C.; Lee, C.C.; Allen, M.J. The mortality response to absolute and relative temperature extremes. Int. J. Environ. Res. Public Health 2019, 16, 1493. [Google Scholar] [CrossRef]
- Li, M.; Yao, Y.; Luo, D.; Zhong, L. The Linkage of the Large-Scale Circulation Pattern to a Long-Lived Heatwave over Mideastern China in 2018. Atmosphere 2019, 10, 89. [Google Scholar] [CrossRef]
- Li, M.; Luo, D.; Yao, Y.; Zhong, L. Large-scale atmospheric circulation control of summer extreme hot events over China. Int. J. Climatol. 2020, 40, 1456–1476. [Google Scholar] [CrossRef]
- Li, M.; Yao, Y.; Simmonds, I.; Luo, D.; Zhong, L.; Chen, X. Collaborative impact of the NAO and atmospheric blocking on European heatwaves, with a focus on the hot summer of 2018. Environ. Res. Lett. 2020, 15, 114003. [Google Scholar] [CrossRef]
- Xu, Z.; Chen, H.; Guo, J.; Zhang, W. Contrasting effect of soil moisture on the daytime boundary layer under different thermodynamic conditions in summer over China. Geophys. Res. Lett. 2021, 48, e2020GL090989. [Google Scholar] [CrossRef]
- Fazel-Rastgar, F. Canadian Arctic weather system configuration related to the recent sea ice decline and heatwave of summer 2019. Int. J. Glob. Warm. 2020, 22, 196–210. [Google Scholar] [CrossRef]
- Screen, J.; Williamson, D. Ice-free Arctic at 1.5 °C? Nat. Clim. Chang. 2017, 7, 230–231. [Google Scholar] [CrossRef][Green Version]
- Zhang, G.; Zeng, G.; Yang, X.; Iyakaremye, V. Two spatial types of North China heatwaves and their possible links to Barents-Kara Sea ice changes. Int. J. Climatol. 2020, 1–14. [Google Scholar] [CrossRef]
- Budikova, D.; Ford, T.W.; Ballinger, T.J. United States heat wave frequency and Arctic Ocean marginal sea ice variability. J. Geophys. Res. Atmos. 2019, 124, 6247–6264. [Google Scholar] [CrossRef]


Publisher’s Note: MDPI stays neutral with regard to jurisdictional claims in published maps and institutional affiliations. |
© 2022 by the authors. Licensee MDPI, Basel, Switzerland. This article is an open access article distributed under the terms and conditions of the Creative Commons Attribution (CC BY) license (https://creativecommons.org/licenses/by/4.0/).