Measurements of Ozone Vertical Profiles in the Upper Troposphere–Stratosphere over Western Siberia by DIAL, MLS, and IASI

 , ,
, ,
Abstract
1. Introduction
2. Measurement Systems
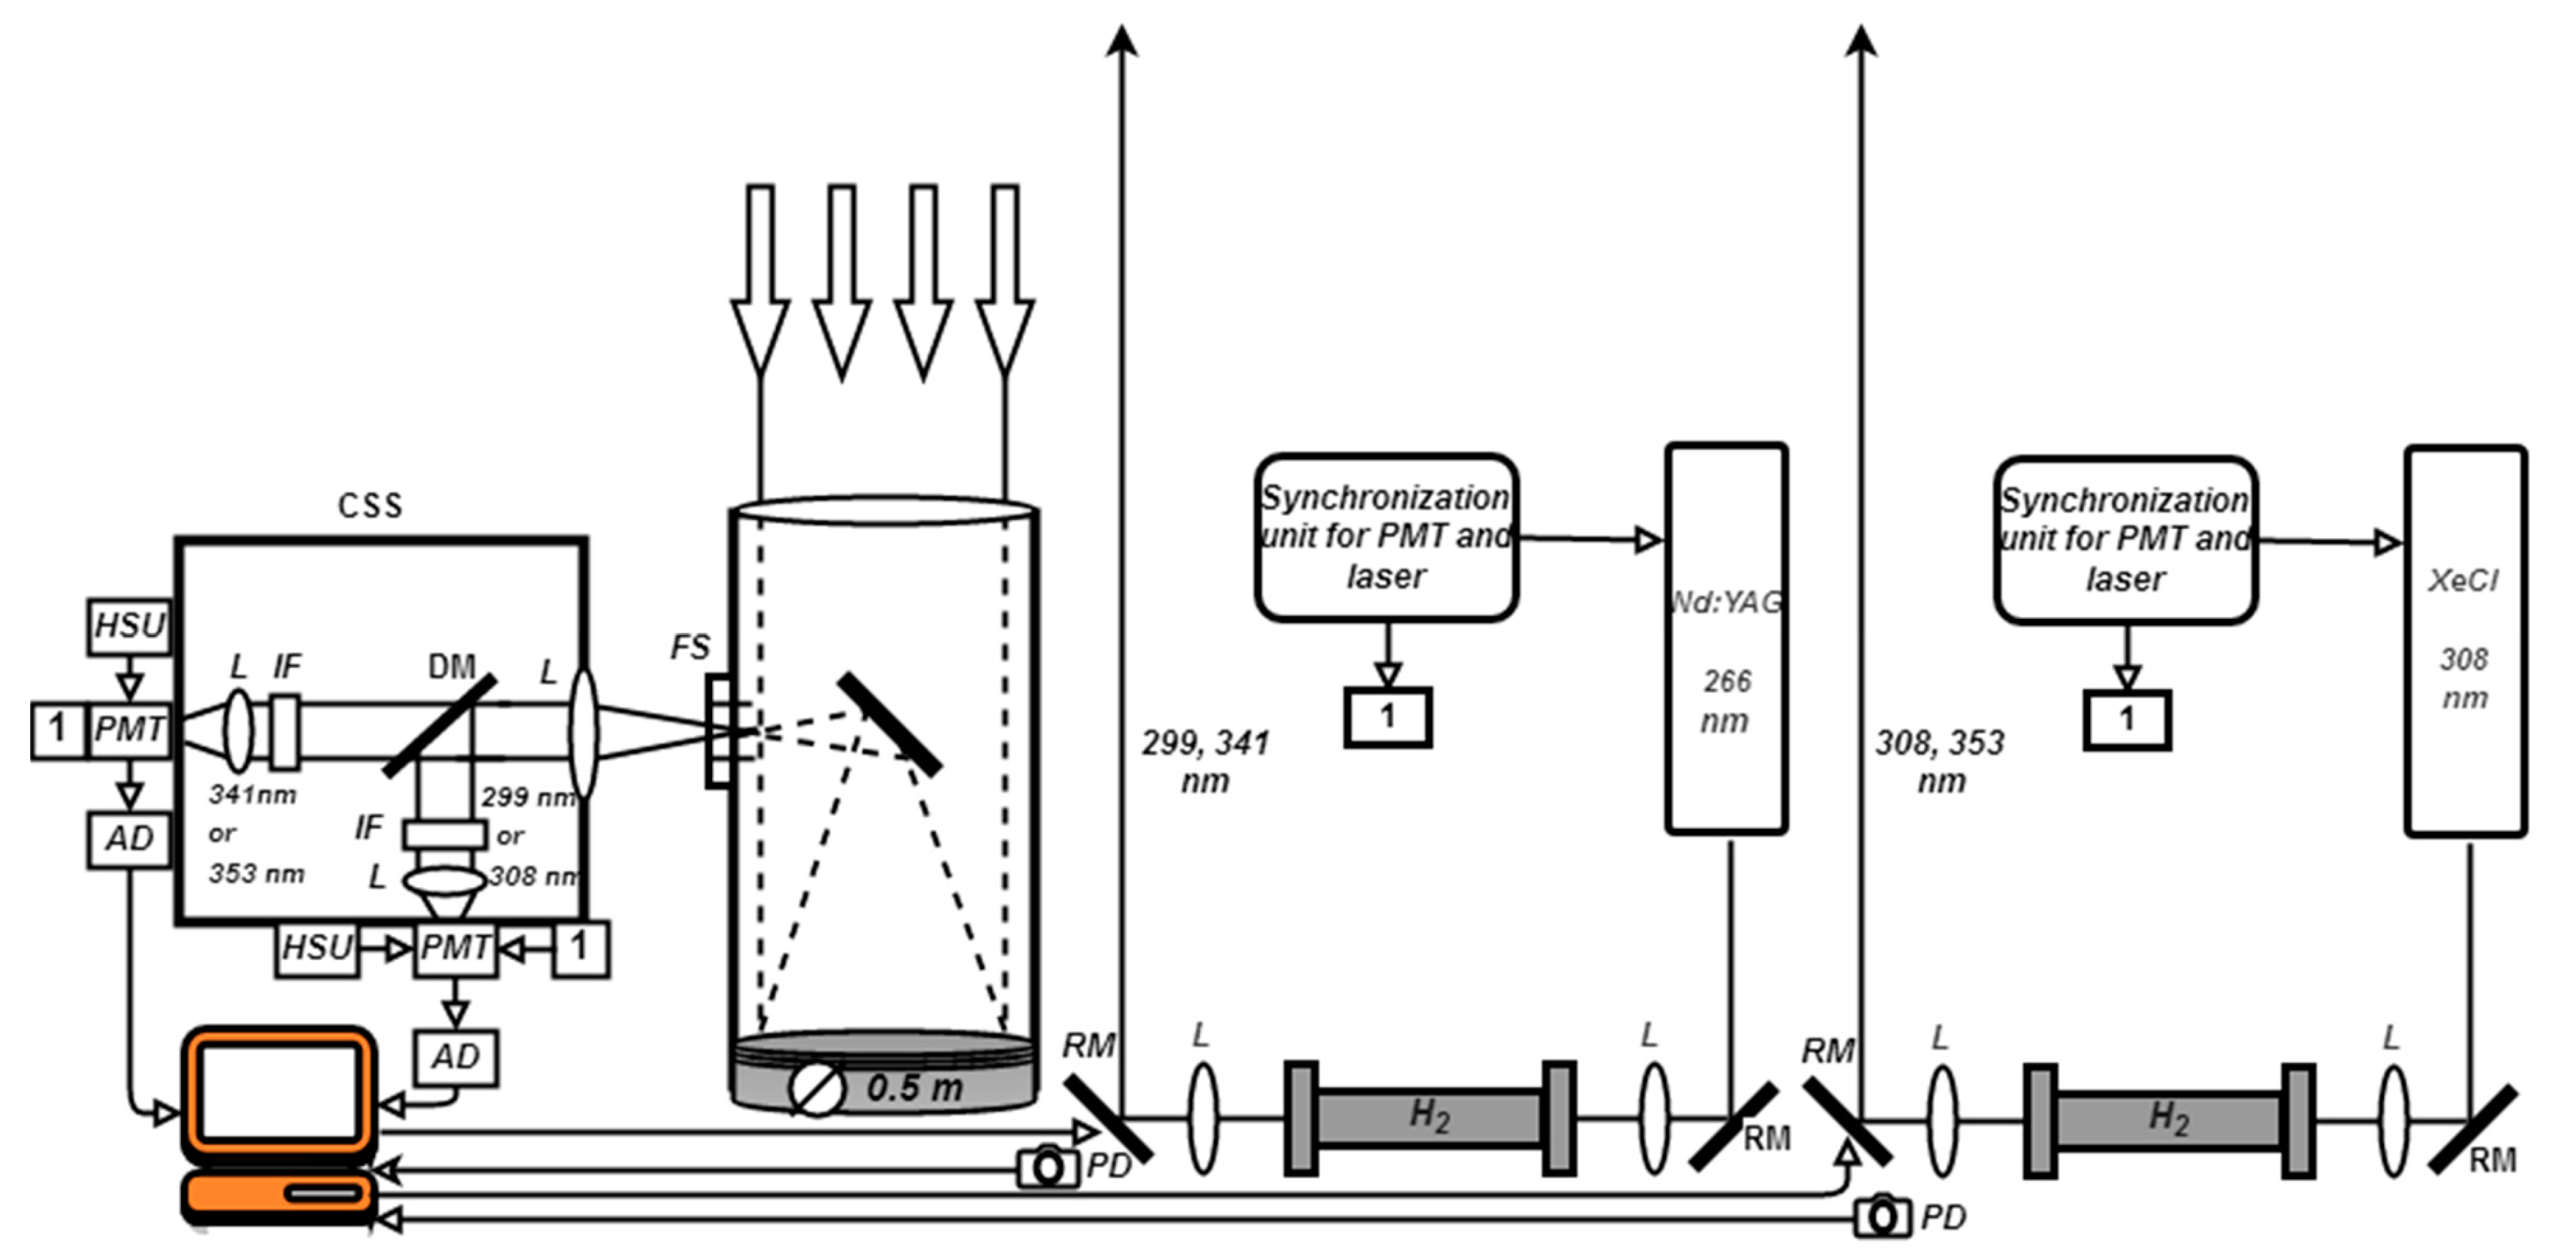
2.1. SLS Ozone Lidar Complex
| Transmitter | Nd:YAG | XeCl |
| Sounding wavelength λ, nm | 299 341 | 308 353 |
| Pulse energy, mJ (corresponding to λ) | 25 20 | 100 50 |
| Pulse frequency, Hz (corresponding to λ) | 15 | 100 |
| Beam divergence, mrad | 0.1–0.3 | 0.1–0.3 |
| Pulse duration, ns | 5–6 | 25–27 |
| Receiver | ||
| Mirror diameter, m | 0.5 | |
| Focal length, m | 1.5 | |
2.2. MLS/Aura
2.3. IASI/MetOp
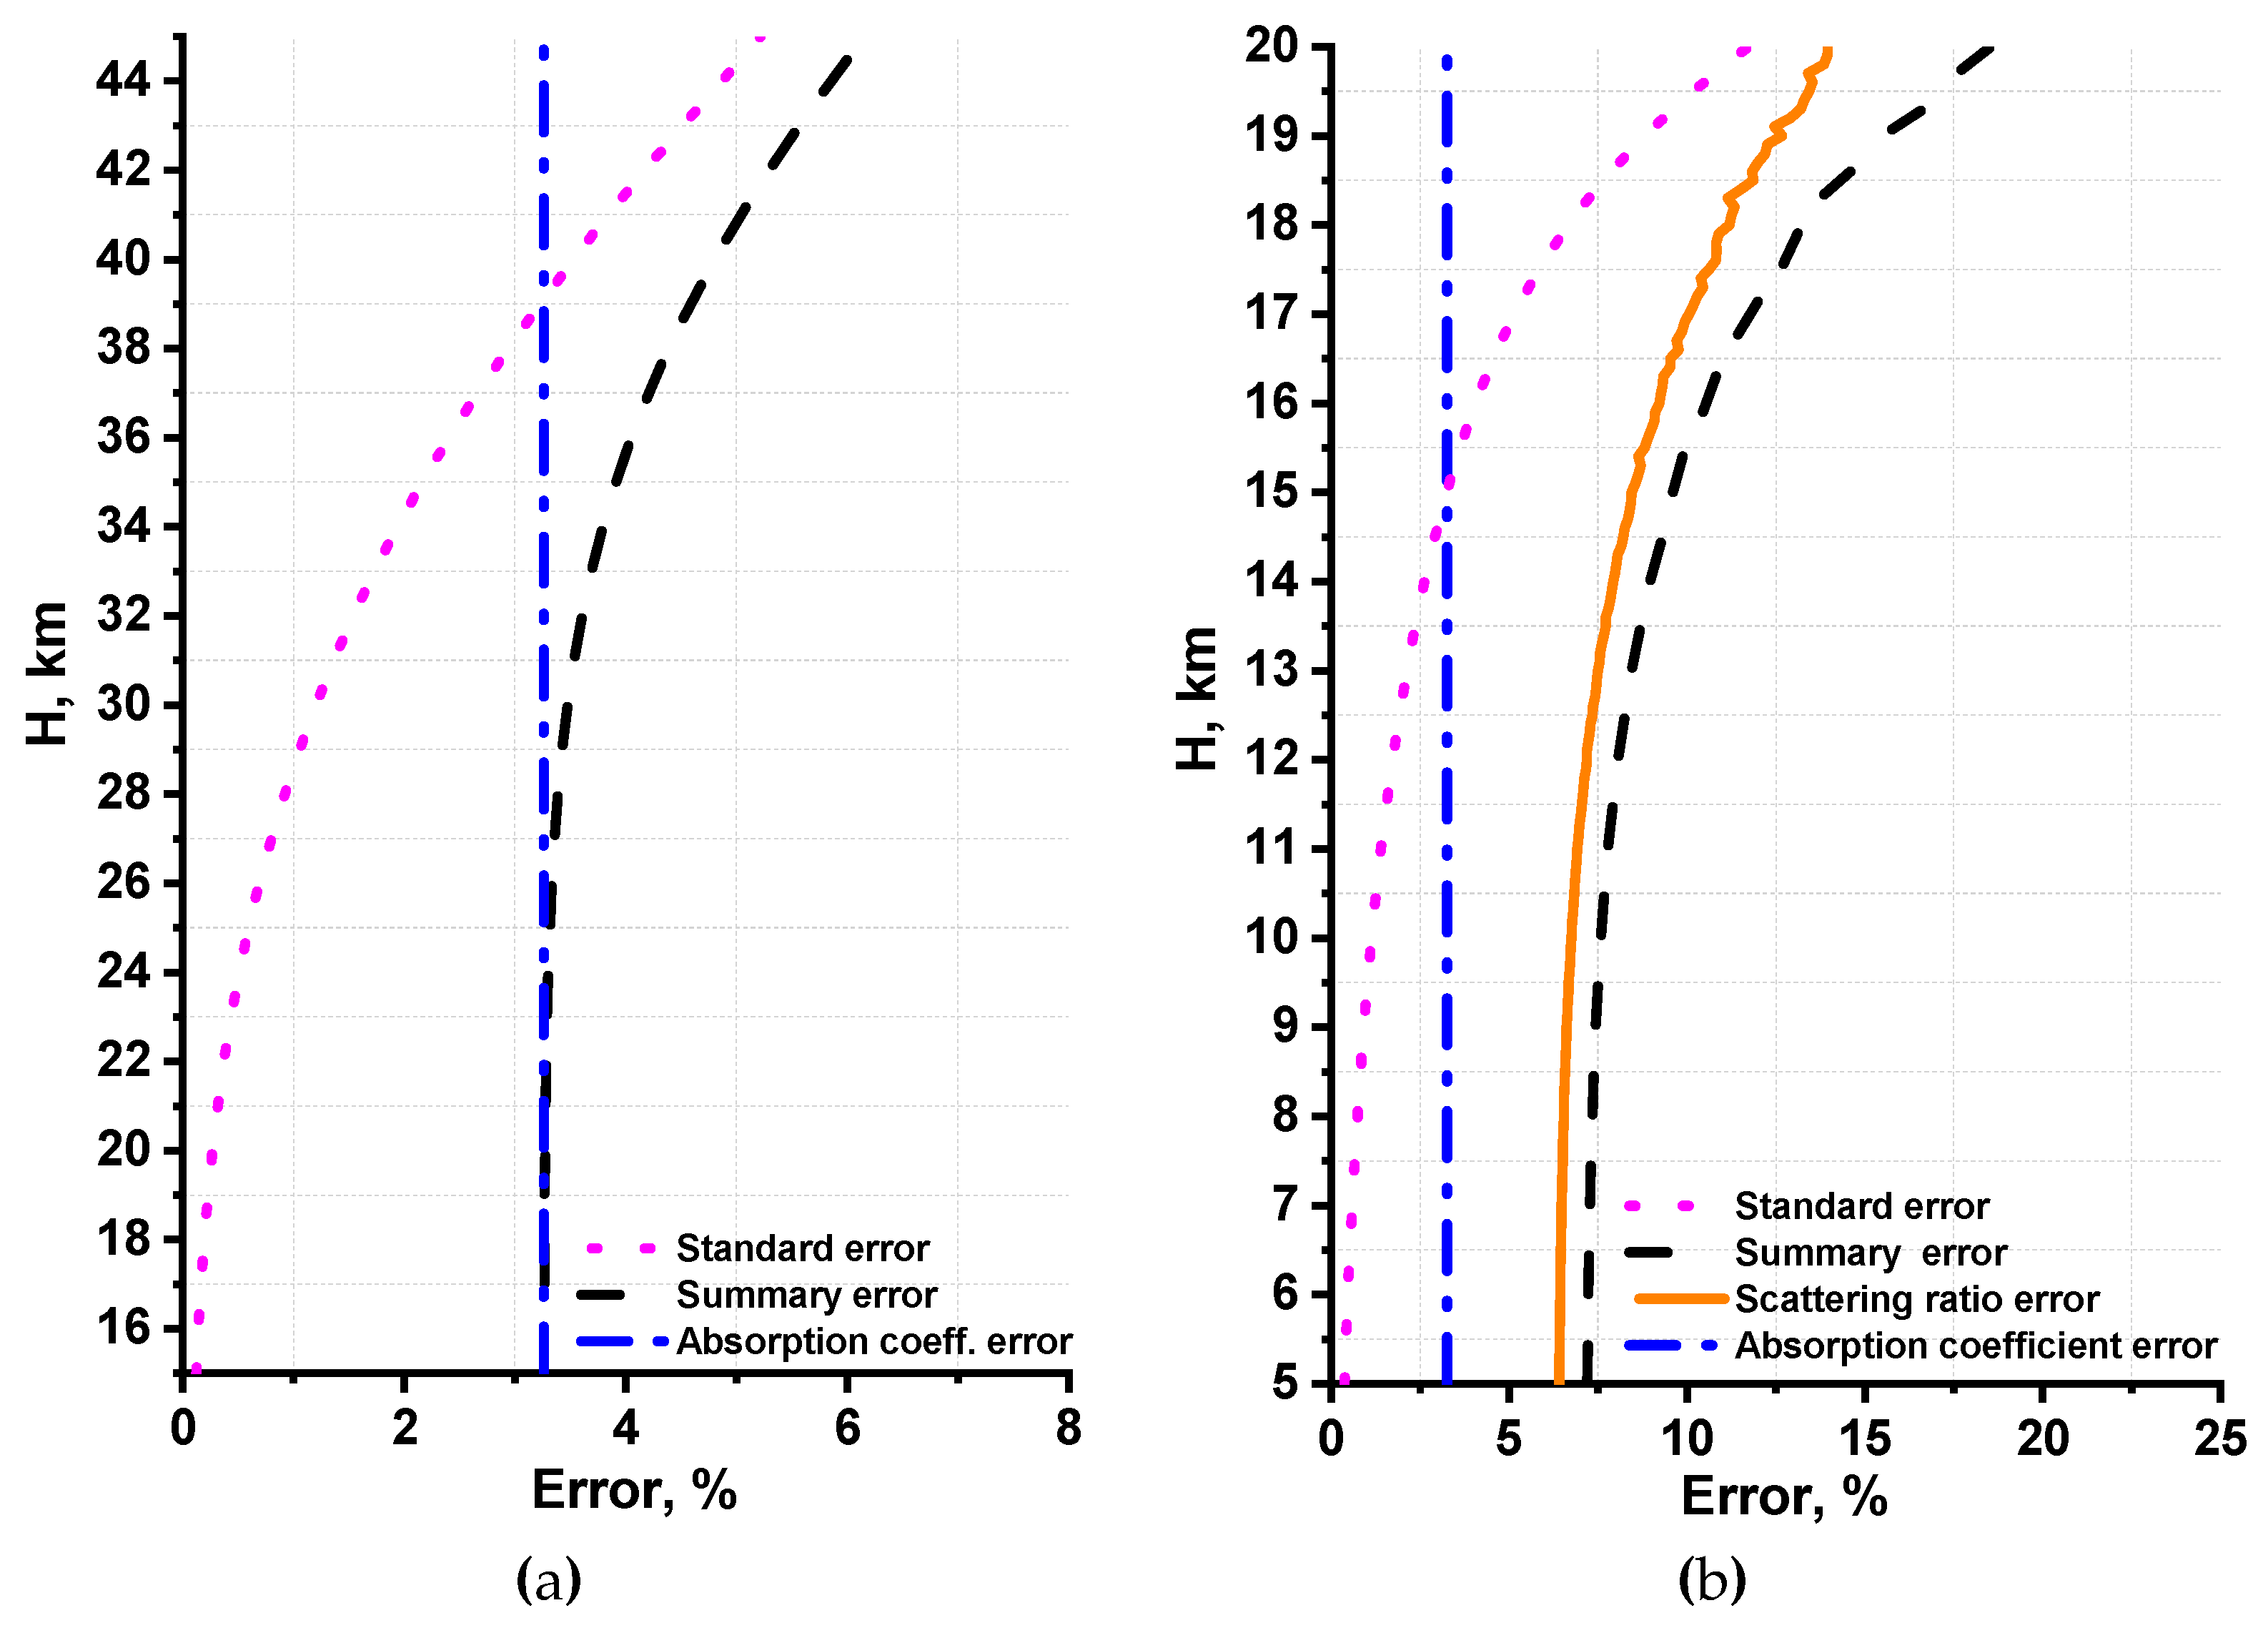
3. Measurement Technique and Analysis of Errors
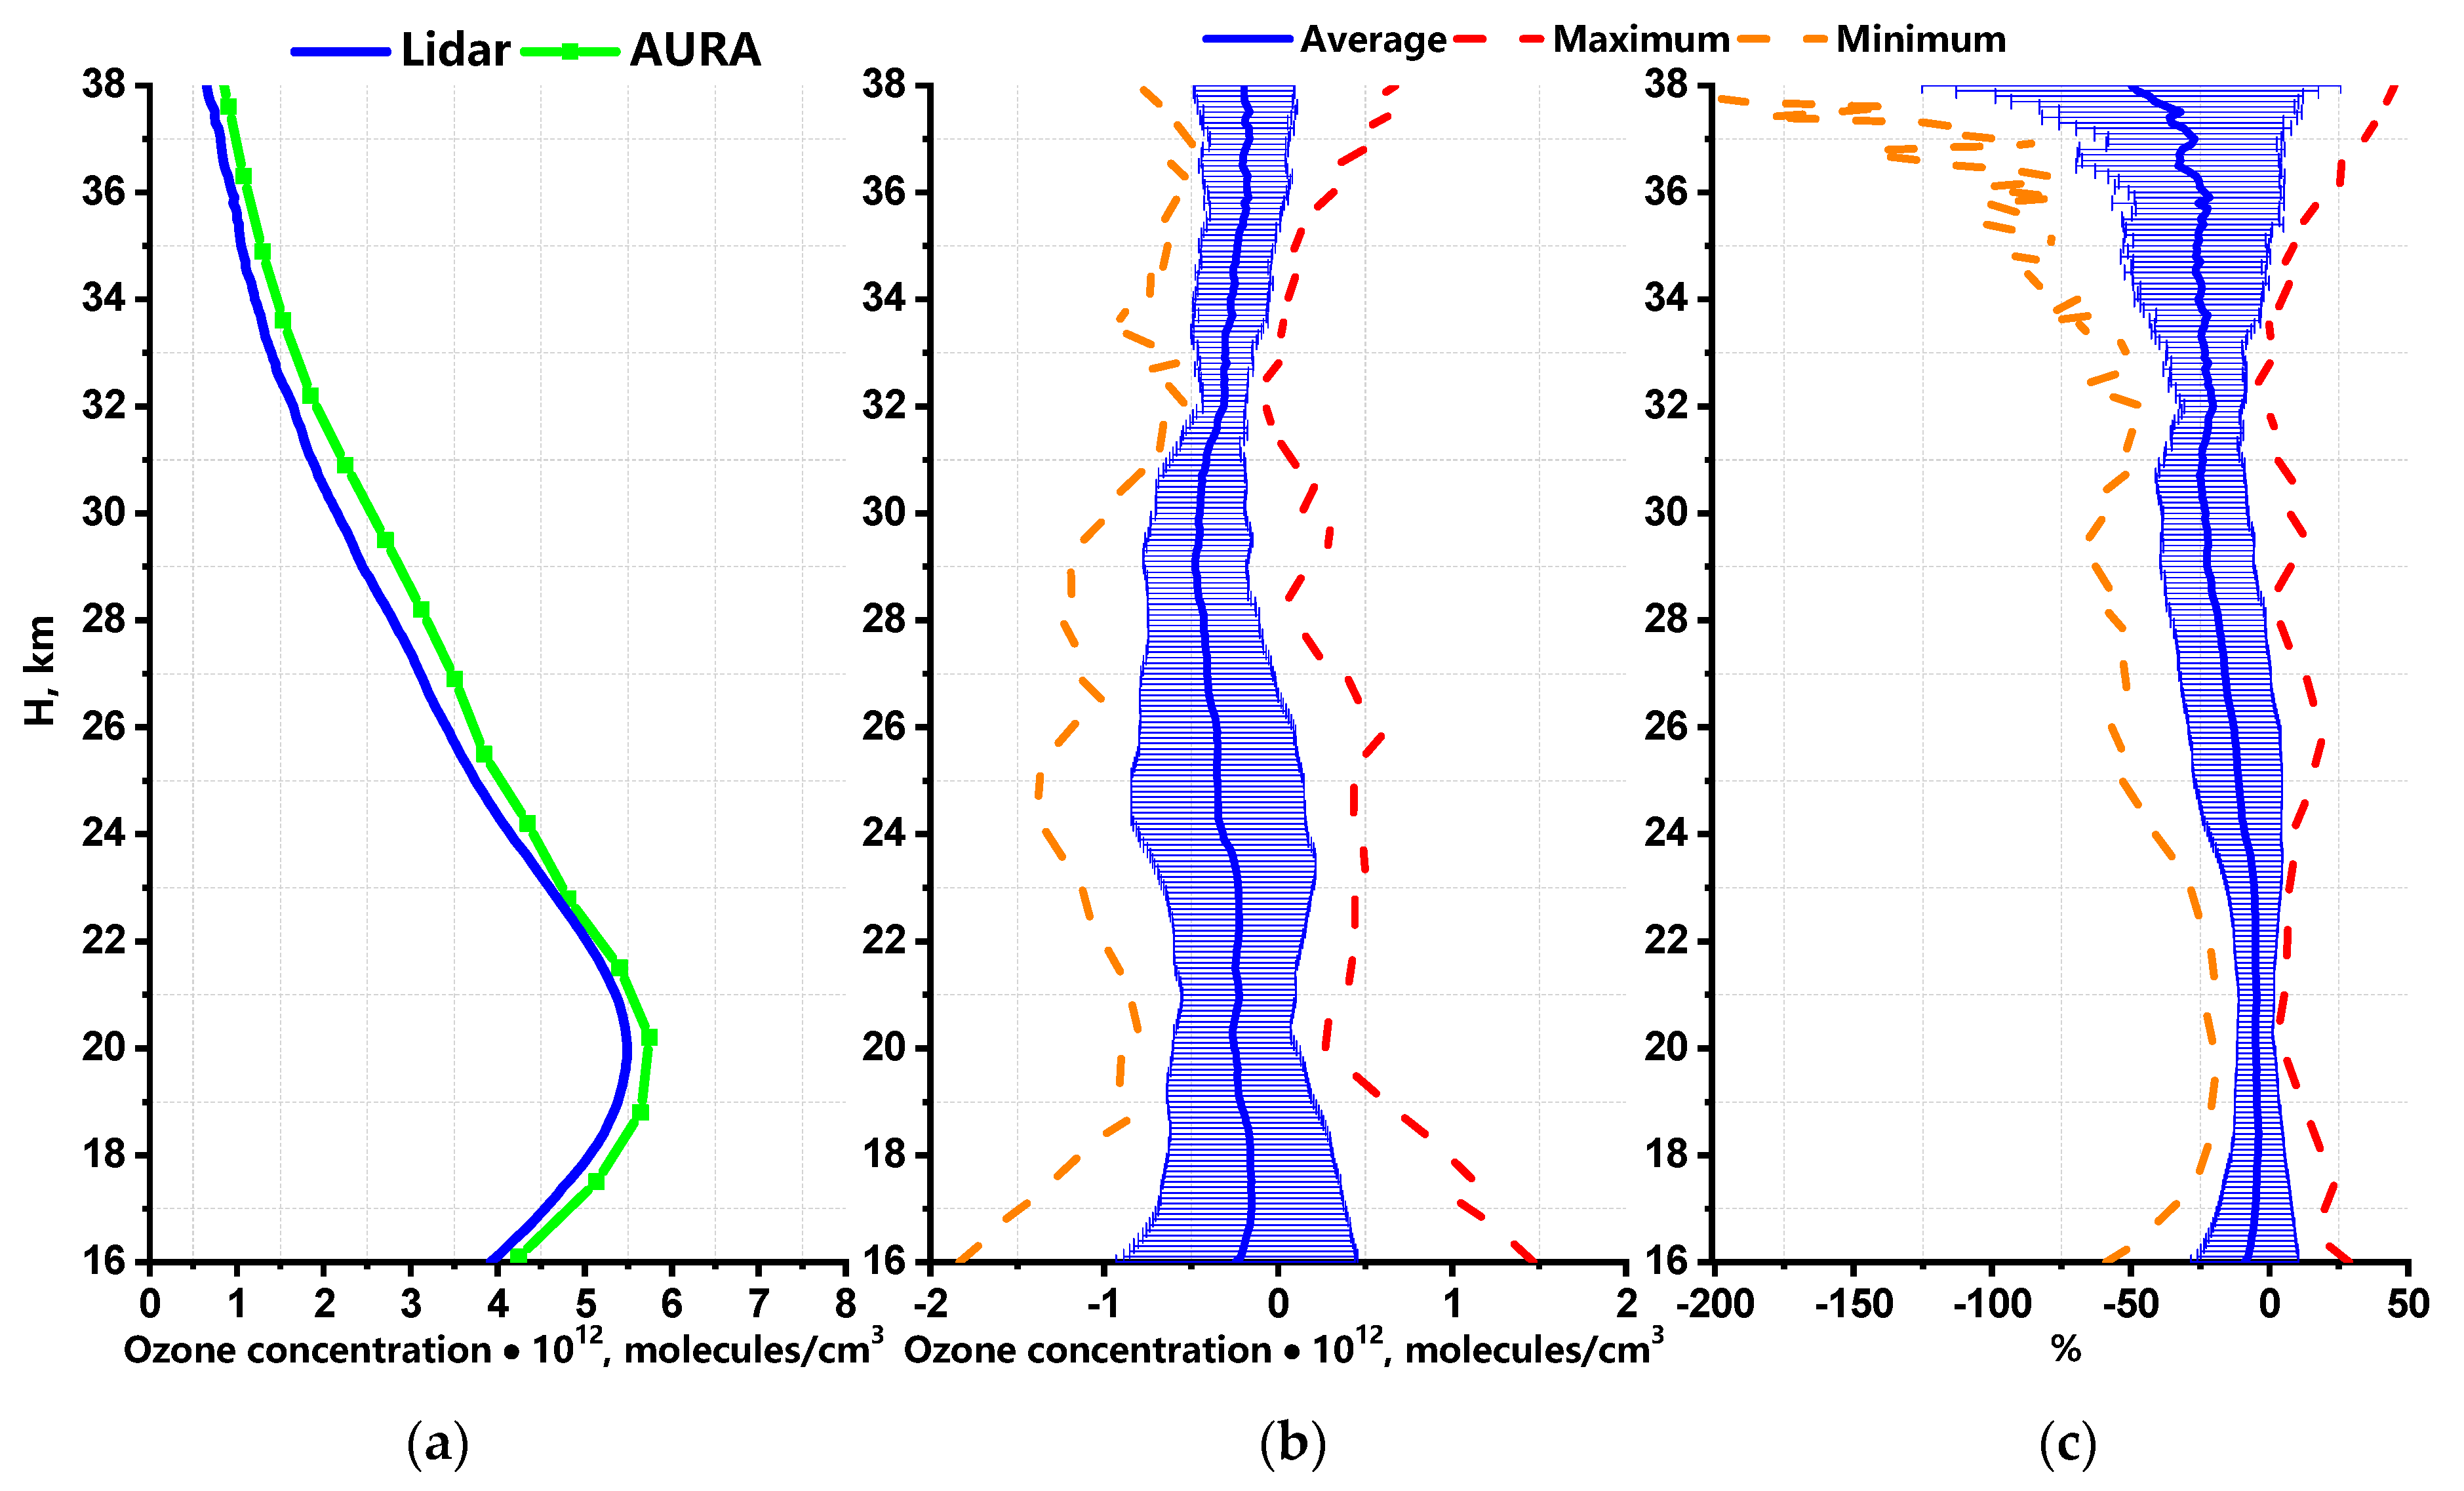
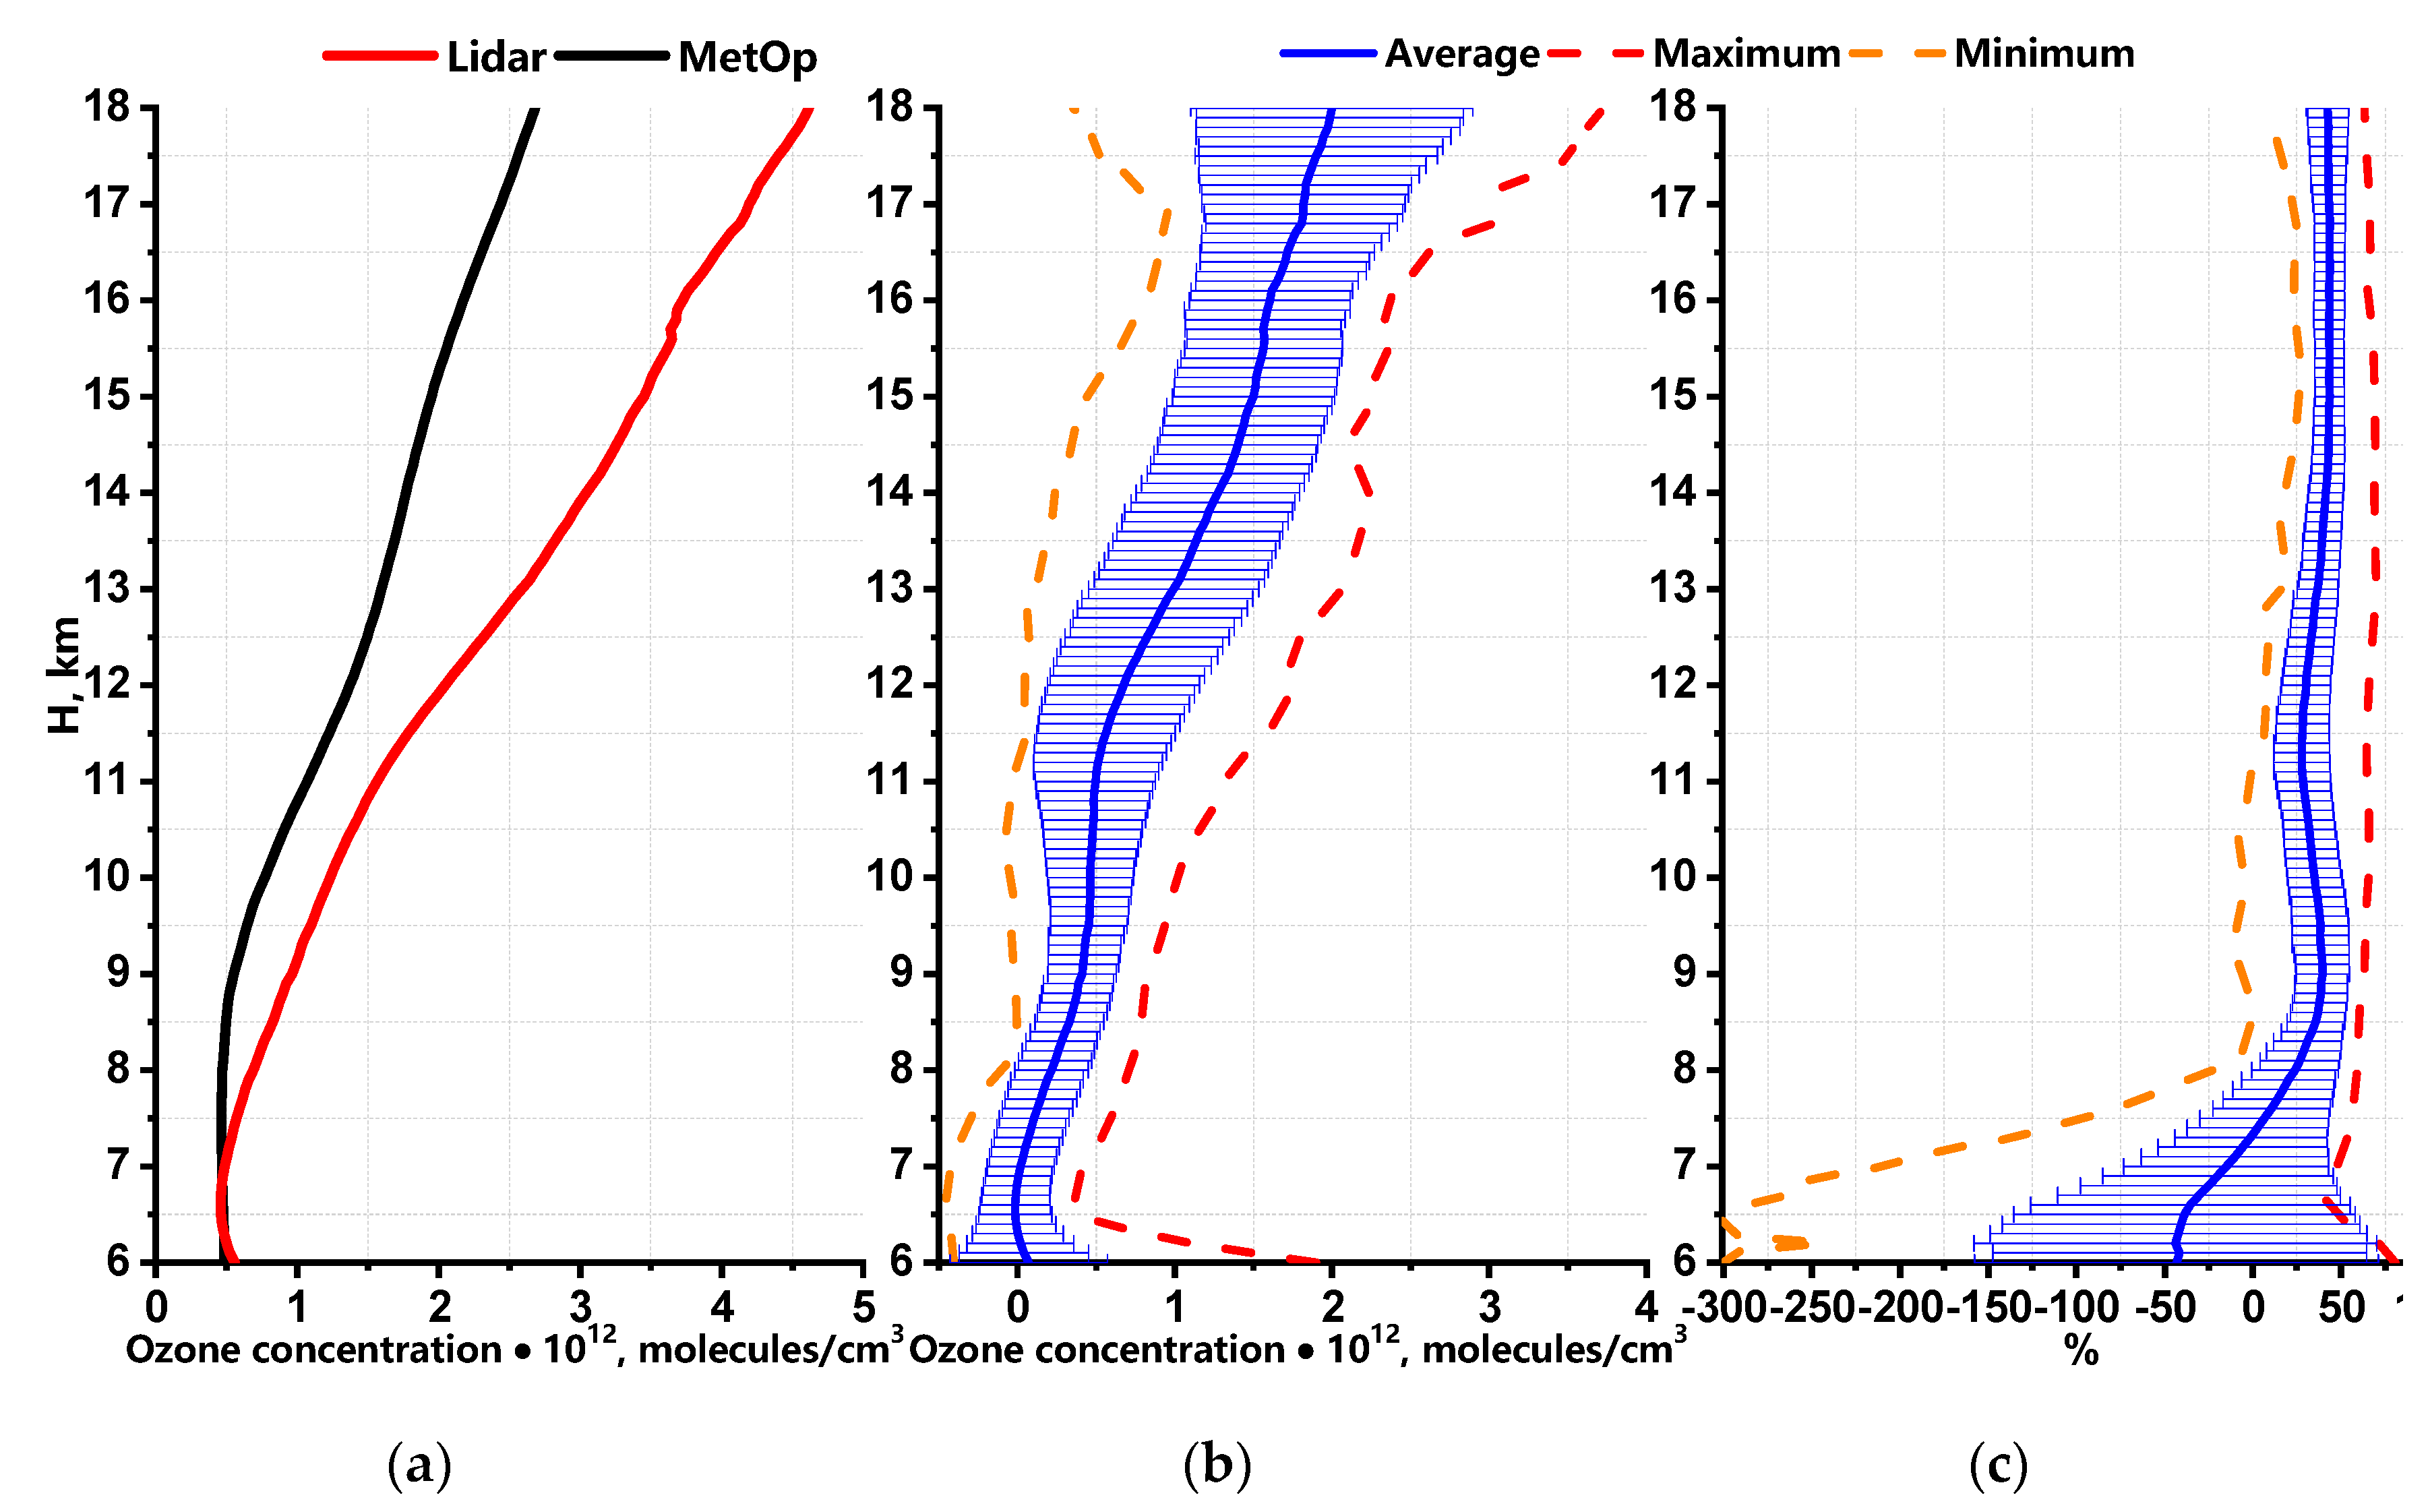
4. Measurement results and discussion
5. Conclusion
Author Contributions
Funding
Conflicts of Interest
References
- Weitkamp, C. Lidar: Range Resolved Optical Remote Sensing of the Atmosphere; Springer: Berlin/Heidelberg, Germany, 2005; pp. 1–18. [Google Scholar]
- Park, C.B.; Nakane, H.; Sugimoto, N.; Matsui, I.; Sasano, Y.; Fujinuma, Y.; Ikeuchi, I.; Kurokawa, J.-I.; Furuhashi, N. Algorithm improvement and validation of National Institute for Environmental Studies ozone differential absorption lidar at the Tsukuba Network for Detection of Stratospheric Change complementary station. Appl. Opt. 2006, 45, 3561–3576. [Google Scholar] [CrossRef] [PubMed]
- Nakazato, M.; Nagai, T.; Sakai, T.; Hirose, Y. Tropospheric ozone differential-absorption lidar using stimulated Raman scattering in carbon dioxide. Appl. Opt. 2007, 46, 2269–2279. [Google Scholar] [CrossRef] [PubMed]
- Godin, S.; Bergeret, V.; Bekki, S.; David, C.; Mégie, G. Study of the interannual ozone loss and the permeability of the Antarctic Polar Vortex from long-term aerosol and ozone lidar measurements in Dumont d’Urville (66.4°, 140° S). J. Geophys. Res. 2001, 106, 1311–1330. [Google Scholar] [CrossRef]
- Gaudel, A.; Ancellet, G.; Godin-Beekmann, S. Analysis of 20 years of tropospheric ozone vertical profiles by lidar and ECC at Observatoire de Haute Provence (OHP) at 44 N, 6.7 E. Atmos. Environ. 2015, 113, 78–89. [Google Scholar] [CrossRef]
- Hu, S.; Hu, H.; Wu, Y.; Zhou, J.; Qi, F.; Yue, G. Atmospheric ozone measured by differential absorptionlidar over Hefei. Proc. SPIE 2003, 466591. [Google Scholar] [CrossRef]
- Liu, X.; Zhang, Y.; Hu, H.; Tan, K.; Tao, Z.; Shao, S.; Cao, K.; Fang, X.; Yu, S. Mobile lidar for measurements of SO2 and O3 in the low troposphere. Proc. SPIE 2005. [Google Scholar] [CrossRef]
- McDermid, I.S.; Godin, S.M.; Lindquist, L.O. Ground-based laser DIAL system for long-term measurements of stratospheric ozone. Appl. Opt. 1990, 29, 3603–3612. [Google Scholar] [CrossRef]
- McDermid, I.S.; Beyerle, G.; Haner, D.A.; Leblanc, T. Redesign and improved performance of the tropospheric ozone lidar at the Jet Propulsion Laboratory Table Mountain Facility. Appl. Opt. 2002, 41, 7550–7555. [Google Scholar] [CrossRef]
- Steinbrecht, W.; McGee, T.J.; Twigg, L.W.; Claude, H.; Schönenborn, F.; Sumnicht, G.K.; Silbert, D. Intercomparison of stratospheric ozone and temperature profiles during the October 2005 Hohenpeißenberg Ozone Profiling Experiment (HOPE). Atmos. Meas. Tech. 2009, 2, 125–145. [Google Scholar] [CrossRef]
- Sullivan, J.T.; McGee, T.J.; Sumnicht, G.K.; Twigg, L.W.; Hoff, R.M. A mobile differential absorption lidar to measure sub-hourly fluctuation of tropospheric ozone profiles in the Baltimore–Washington, D.C. region. Atmos. Meas. Tech. 2014, 7, 3529–3548. [Google Scholar] [CrossRef]
- Pavlov, A.N.; Stolyarchuk, S.Y.; Shmirko, K.A.; Bukin, O.A. Lidar Measurements of Variability of the Vertical Ozone Distribution Caused by the Stratosphere–Troposphere Exchange in the Far East Region. Atmos. Ocean. Opt. 2013, 26, 126–134. [Google Scholar] [CrossRef]
- Burlakov, V.D.; Dolgii, S.I.; Nevzorov, A.V. Modification of the measuring complex at the Siberian Lidar Station. Atmos. Ocean. Opt. 2004, 17, 756–762. [Google Scholar]
- Dolgii, S.I.; Nevzorov, A.A.; Nevzorov, A.V.; Romanovskii, O.A.; Makeev, A.P.; Kharchenko, O.V. Lidar Complex for Measurement of Vertical Ozone Distribution in the Upper Troposphere–Stratosphere. Atmos. Ocean. Opt. 2018, 31, 1–7. [Google Scholar] [CrossRef]
- Fang, X.; Li, T.; Ban, C.; Wu, Z.; Li, J.; Li, F.; Cen, Y.; Tian, B. A mobile differential absorption lidar for simultaneous observations of tropospheric and stratospheric ozone over Tibet. Opt. Express 2019, 27, 4126–4139. [Google Scholar] [CrossRef] [PubMed]
- Network for the Detection of Atmospheric Composition Change. Information of Lidar Stations. Available online: http://www.ndaccdemo.org/ (accessed on 28 December 2019).
- Dolgii, S.I.; Nevzorov, A.A.; Nevzorov, A.V.; Romanovskii, O.A.; Kharchenko, O.V. Intercomparison of Ozone Vertical Profile Measurements by Differential Absorption Lidar and IASI/MetOp Satellite in the Upper Troposphere–Lower Stratosphere. Remote Sens. 2017, 9, 447. [Google Scholar] [CrossRef]
- Jiang, Y.B.; Froidevaux, L.; Lambert, A.; Livesey, N.J.; Read, W.G.; Waters, J.W.; Bojkov, B.; Leblanc, T.; McDermid, I.S.; Godin-Beekmann, S.; et al. Validation of Aura Microwave Limb Sounder Ozone by ozonesonde and lidar measurements. J. Geophys. Res. 2007, 112. [Google Scholar] [CrossRef]
- Kirgis, G.; Leblanc, T.; McDermid, I.S.; Walsh, T.D. Stratospheric ozone interannual variability (1995–2011) as observed by lidar and satellite at Mauna Loa Observatory, HI and Table Mountain Facility, CA. Atmos. Chem. Phys. 2013, 13, 5033–5047. [Google Scholar] [CrossRef]
- Nair, P.J.; Godin–Beekmann, S.; Froidevaux, L.; Flynn, L.E.; Zawodny, J.M.; Russell III, J.M.; Pazmiño, A.; Ancellet, G.; Steinbrecht, W.; Claude, H.; et al. Relative drifts and stability of satellite and ground-based stratospheric ozone profiles at NDACC lidar stations. Atmos. Meas. Tech. 2012, 5, 1301–1318. [Google Scholar] [CrossRef]
- Gazeaux, J.; Clerbaux, C.; George, M.; Hadji-Lazaro, J.; Kuttippurath, J.; Coheur, P.-F.; Hurtmans, D.; Deshler, T.; Kovilakam, M.; Campbell, P.; et al. Intercomparison of polar ozone profiles by IASI/MetOp sounder with 2010 Concordiasi ozonesonde observations. Atmos. Meas. Tech. 2013, 6, 613–620. [Google Scholar] [CrossRef]
- Waters, J.W.; Froidevaux, L.; Harwood, R.S.; Jarnot, R.F.; Pickett, H.M.; Read, W.G.; Siegel, P.H.; Cofield, R.E.; Filipiak, M.J.; Flower, D.A.; et al. The Earth Observing System Microwave Limb Sounder (EOS MLS) on the Aura Satellite. IEEE (TGRS) Trans. Geosci. Remote Sens. 2006, 44, 1075–1092. [Google Scholar] [CrossRef]
- Clerbaux, C.; Boynard, A.; Clarisse, L.; George, M.; Hadji-Lazaro, J.; Herbin, H.; Hurtmans, D.; Pommier, M.; Razavi, A.; Turquety, S.; et al. Monitoring of atmospheric composition using the thermal infrared IASI/MetOp sounder. Atmos. Chem. Phys. 2009, 9, 6041–6054. [Google Scholar] [CrossRef]
- NASA (National Aeronautics and Space Administration). Microwave Limb Sounder. The MLSO3 Product. Available online: https://mls.jpl.nasa.gov/products/o3_product.php (accessed on 28 October 2019).
- NASA (National Aeronautics and Space Administration). MLS Ozone Data. Available online: https://avdc.gsfc.nasa.gov/pub/data/satellite/Aura/MLS/V04/L2GPOVP/O3/ (accessed on 28 October 2019).
- August, T.; Klaes, D.; Schlüssel, P.; Hultberg, T.; Crapeau, M.; Arriaga, A.; O’Carroll, A.; Coppens, D.; Munro, R.; Calbet, X. IASI on Metop-A: Operational Level 2 retrievals after five years in orbit. J. Quant. Spectrosc. Radiat. Transf. 2012, 113, 1340–1371. [Google Scholar] [CrossRef]
- Matvienko, G.G.; Belan, B.D.; Panchenko, M.V.; Romanovskii, O.A.; Sakerin, S.M.; Kabanov, D.M.; Turchinovich, S.A.; Turchinovich, Y.S.; Eremina, T.A.; Kozlov, V.S.; et al. Complex experiment on studying the microphysical, chemical, and optical properties of aerosol particles and estimating the contribution of atmospheric aerosol-to-earth radiation budget. Atmos. Meas. Tech. 2015, 8, 4507–4520. [Google Scholar] [CrossRef]
- Measures, R.M. Laser Remote Sensing. Fundamentals and Applications; Reprint 1984 de Krieger Publishing Company: Malabar, FL, USA, 1992; pp. 237–280. [Google Scholar]
- Burlakov, V.D.; Dolgii, S.I.; Nevzorov, A.A.; Nevzorov, A.V.; Romanovskii, O.A. Algorithm for Retrieval of Vertical Distribution of Ozone from DIAL Laser Remote Measurements. Opt. Mem. Neural Netw. (Inf. Opt.) 2015, 24, 295–302. [Google Scholar] [CrossRef]
- Gorshelev, V.; Serdyuchenko, A.; Weber, M.; Chehade, W.; Burrows, J.P. High spectral resolution ozone absorption cross-sections–Part 1: Measurements, data analysis and comparison with previous measurements around 293 K. Atmos. Meas. Tech. 2014, 7, 609–624. [Google Scholar] [CrossRef]
- Serdyuchenko, A.; Gorshelev, V.; Weber, M.; Chehade, W.; Burrows, J.P. High spectral resolution ozone absorption cross-sections-Part 2: Temperature dependence. Atmos. Meas. Tech. 2014, 7, 625–636. [Google Scholar] [CrossRef]
- El’nikov, A.V.; Zuev, V.V. Bifrequency laser sounding of stratospheric ozone under conditions of high degree of aerosol loading. Atmos. Ocean. Opt. 1992, 5, 681–683. [Google Scholar]
- El’nikov, A.V.; Marichev, V.N.; Shelevoi, K.D.; Shelefontyuk, D.I. Laser radar for sensing vertical stratification of atmospheric aerosol. Atmos. Ocean. Opt. 1988, 1, 117–123. [Google Scholar]
- Krueger, A.J.; Minzner, R.A. Mid-latitude ozone model for the 1976 U.S. Standard Atmosphere. J. Geophys. Res. 1976, 81, 4477–4481. [Google Scholar] [CrossRef]


| Station | Laser | Wavelength, nm | SRS | Wavelength pair, nm | Altitude range, km | Error, % | Mirror, m |
|---|---|---|---|---|---|---|---|
| Tsukuba [2,3] | Nd:YAG XeCl Nd:YAG XeF | 266 308 355 351 | CO2 D2 | 276/287 287/299 308/355 308/351 308/339 | 0.4–3 3–10 15–45 10–45 10–45 | 3–9 5–30 | 0.25 0.6 1 1 2 |
| OHP [4,5] | Nd:YAG XeCl Nd:YAG | 266 308 355 | D2 - | 289/316 308/355 | 3–14 15–45 | 10 5–20 | 0.4 4 items 0.53 |
| Hefei [6,7] | Nd:YAG XeCl | 266 308 | H2 D2 CH4 | 308/353 299/288 289/308 | 18–40 0.5–2 4–18 | 5–30 10 25 | 0.3 0.62 |
| TMF [8,9] | Nd:YAG XeCl Nd:YAG | 266 308 355 | D2 H2 H2 | 289/299 308/353 | 3–18 15–50 | 7–14 5–30 | 0.91 0.9 |
| GSFC [10,11] | Nd:YAG XeCl Nd:YAG | 266 308 355 | D2 H2 - | 289/299 308/355 | 1.5–12 10–50 | 16–19 5–30 | 0.45 0.76 |
| Vladivostok [12] | XeCl | 308 | H2 | 308/353/331 | 5–40 | 2–30 | 0.6 |
| SLS [13,14] | Nd:YAG XeCl | 266 308 | H2 H2 | 299/341 308/353 | 5–20 15–45 | 6–18 5–35 | 0.5 |
| Yangbajing [15] | Nd:YAG XeCl | 266 308 | D2 H2 | 289/299 308/355 | 5–10 8–19 19–32 32–50 | <30 <30 <30 >30 | 4 items 1.25 2 items 0.21 1 |
| Date | SLS (56.5° N, 85.0°E) | Distance between SLS and Aura, km | MLS/Aura | |
|---|---|---|---|---|
| GMT | GMT | Coordinates (° N, ° E) | ||
| January 13 | 12:25–13:04 | 437 | 07:07 | 60.43, 84.56 |
| January 22 | 12:12–12:42 | 446 | 07:01 | 60.43, 86.10 |
| January 23 | 13:13–13:43 | 681 | 21:14 | 51.74, 78.10 |
| January 24 | 12:12–12:42 | 505 | 06:49 | 60.43, 89.20 |
| January 26 | 13:19–13:49 | 613 | 06:36 | 60.43, 92.29 |
| January 30 | 12:45–13:15 | 532 | 07:49 | 54.65, 77.13 |
| January 31 | 13:15–13:45 | 350 | 06:55 | 58.99, 88.61 |
| February 5 | 12:34–13:05 | 218 | 07:12 | 54.65, 86.41 |
| February 12 | 13:42–14:12 | 101 | 20:48 | 56.10, 86.47 |
| February 13 | 12:49–13:19 | 528 | 21:30 | 58.99, 77.38 |
| February 21 | 14:01–14:31 | 249 | 20:42 | 54.65, 87.28 |
| February 26 | 14:31–15:01 | 106 | 21:00 | 56.10, 83.40 |
| March 5 | 13:29–13:59 | 198 | 21:06 | 56.10, 81.86 |
| March 12 | 14:40–15:10 | 328 | 21:12 | 59.00, 82.01 |
| March 13 | 13:46–14:16 | 430 | 06:48 | 56.11, 91.91 |
| June 9 | 18:07–18:37 | 388 | 21:18 | 56.11, 78.74 |
| September 27 | 14:12–14:42 | 386 | 07:47 | 51.74, 77.13 |
| September 28 | 14:19–14:49 | 631 | 20:24 | 51.74, 90.50 |
| October 15 | 13:48–14:18 | 438 | 07:35 | 53.20, 81.04 |
| October 26 | 14:16–14:46 | 491 | 07:19 | 60.44, 81.58 |
| November 16 | 12:29–12:59 | 351 | 07:36 | 54.66, 80.31 |
| December 3 | 12:27–12:57 | 491 | 06:42 | 59.00, 91.78 |
| December 4 | 11:13–11:43 | 145 | 07:24 | 56.11, 82.65 |
| December 10 | 11:29–11:59 | 428 | 06:48 | 56.11, 91.92 |
| December 26 | 11:14–11:44 | 426 | 20:17 | 56.11, 91.92 |
| Date | SLS (56.5° N, 85.0°E) | IASI/MetOp | |
|---|---|---|---|
| GMT | GMT | Coordinates (° N, ° E) | |
| January 13 | 13:28 – 14:02 | 13:53 | 56.47, 85.04 |
| January 22 | 12:58 – 13:32 | 14:08 | 56.47, 85.04 |
| January 23 | 12:15 – 12:49 | 14:29 | 56.47, 85.04 |
| January 24 | 13:04 – 13:38 | 14:08 | 56.47, 85.04 |
| January 26 | 12:25 – 12:59 | 14:23 | 56.47, 85.04 |
| January 30 | 13:27 – 14:01 | 13:44 | 56.47, 85.04 |
| January 31 | 12:26 – 13:00 | 14:20 | 56.47, 85.04 |
| February 5 | 13:14 – 13:48 | 14:17 | 56.47, 85.04 |
| February 12 | 12:50 – 13:24 | 14:14 | 56.47, 85.04 |
| February 13 | 13:25 – 13:59 | 13:56 | 56.47, 85.04 |
| February 21 | 13:10 – 13:44 | 15:26 | 56.47, 85.04 |
| February 26 | 13:44 – 14:18 | 14:26 | 56.47, 85.04 |
| March 5 | 14:14 – 14:48 | 13:41 | 56.47, 85.04 |
| March 12 | 13:49 – 14:23 | 13:53 | 56.47, 85.04 |
| March 13 | 14:28 – 15:02 | 14:14 | 56.47, 85.04 |
| June 9 | 18:50 – 19:24 | 15:11 | 56.47, 85.04 |
| September 27 | 14:56 – 15:30 | 15:14 | 56.47, 85.04 |
| September 28 | 15:01 – 15:35 | 14:53 | 56.47, 85.04 |
| October 15 | 12:58 – 13:32 | 14:02 | 56.47, 85.04 |
| October 26 | 13:10 – 13:44 | 14:11 | 56.47, 85.04 |
| November 16 | 13:15 – 13:49 | 13:35 | 56.47, 85.04 |
| December 3 | 11:39 – 12:13 | 13:47 | 56.47, 85.04 |
| December 4 | 11:57 – 12:31 | 14:02 | 56.47, 85.04 |
| December 10 | 12:13 – 12:47 | 13:39 | 56.47, 85.04 |
| December 26 | 12:00 – 12:40 | 14:11 | 56.47, 85.04 |
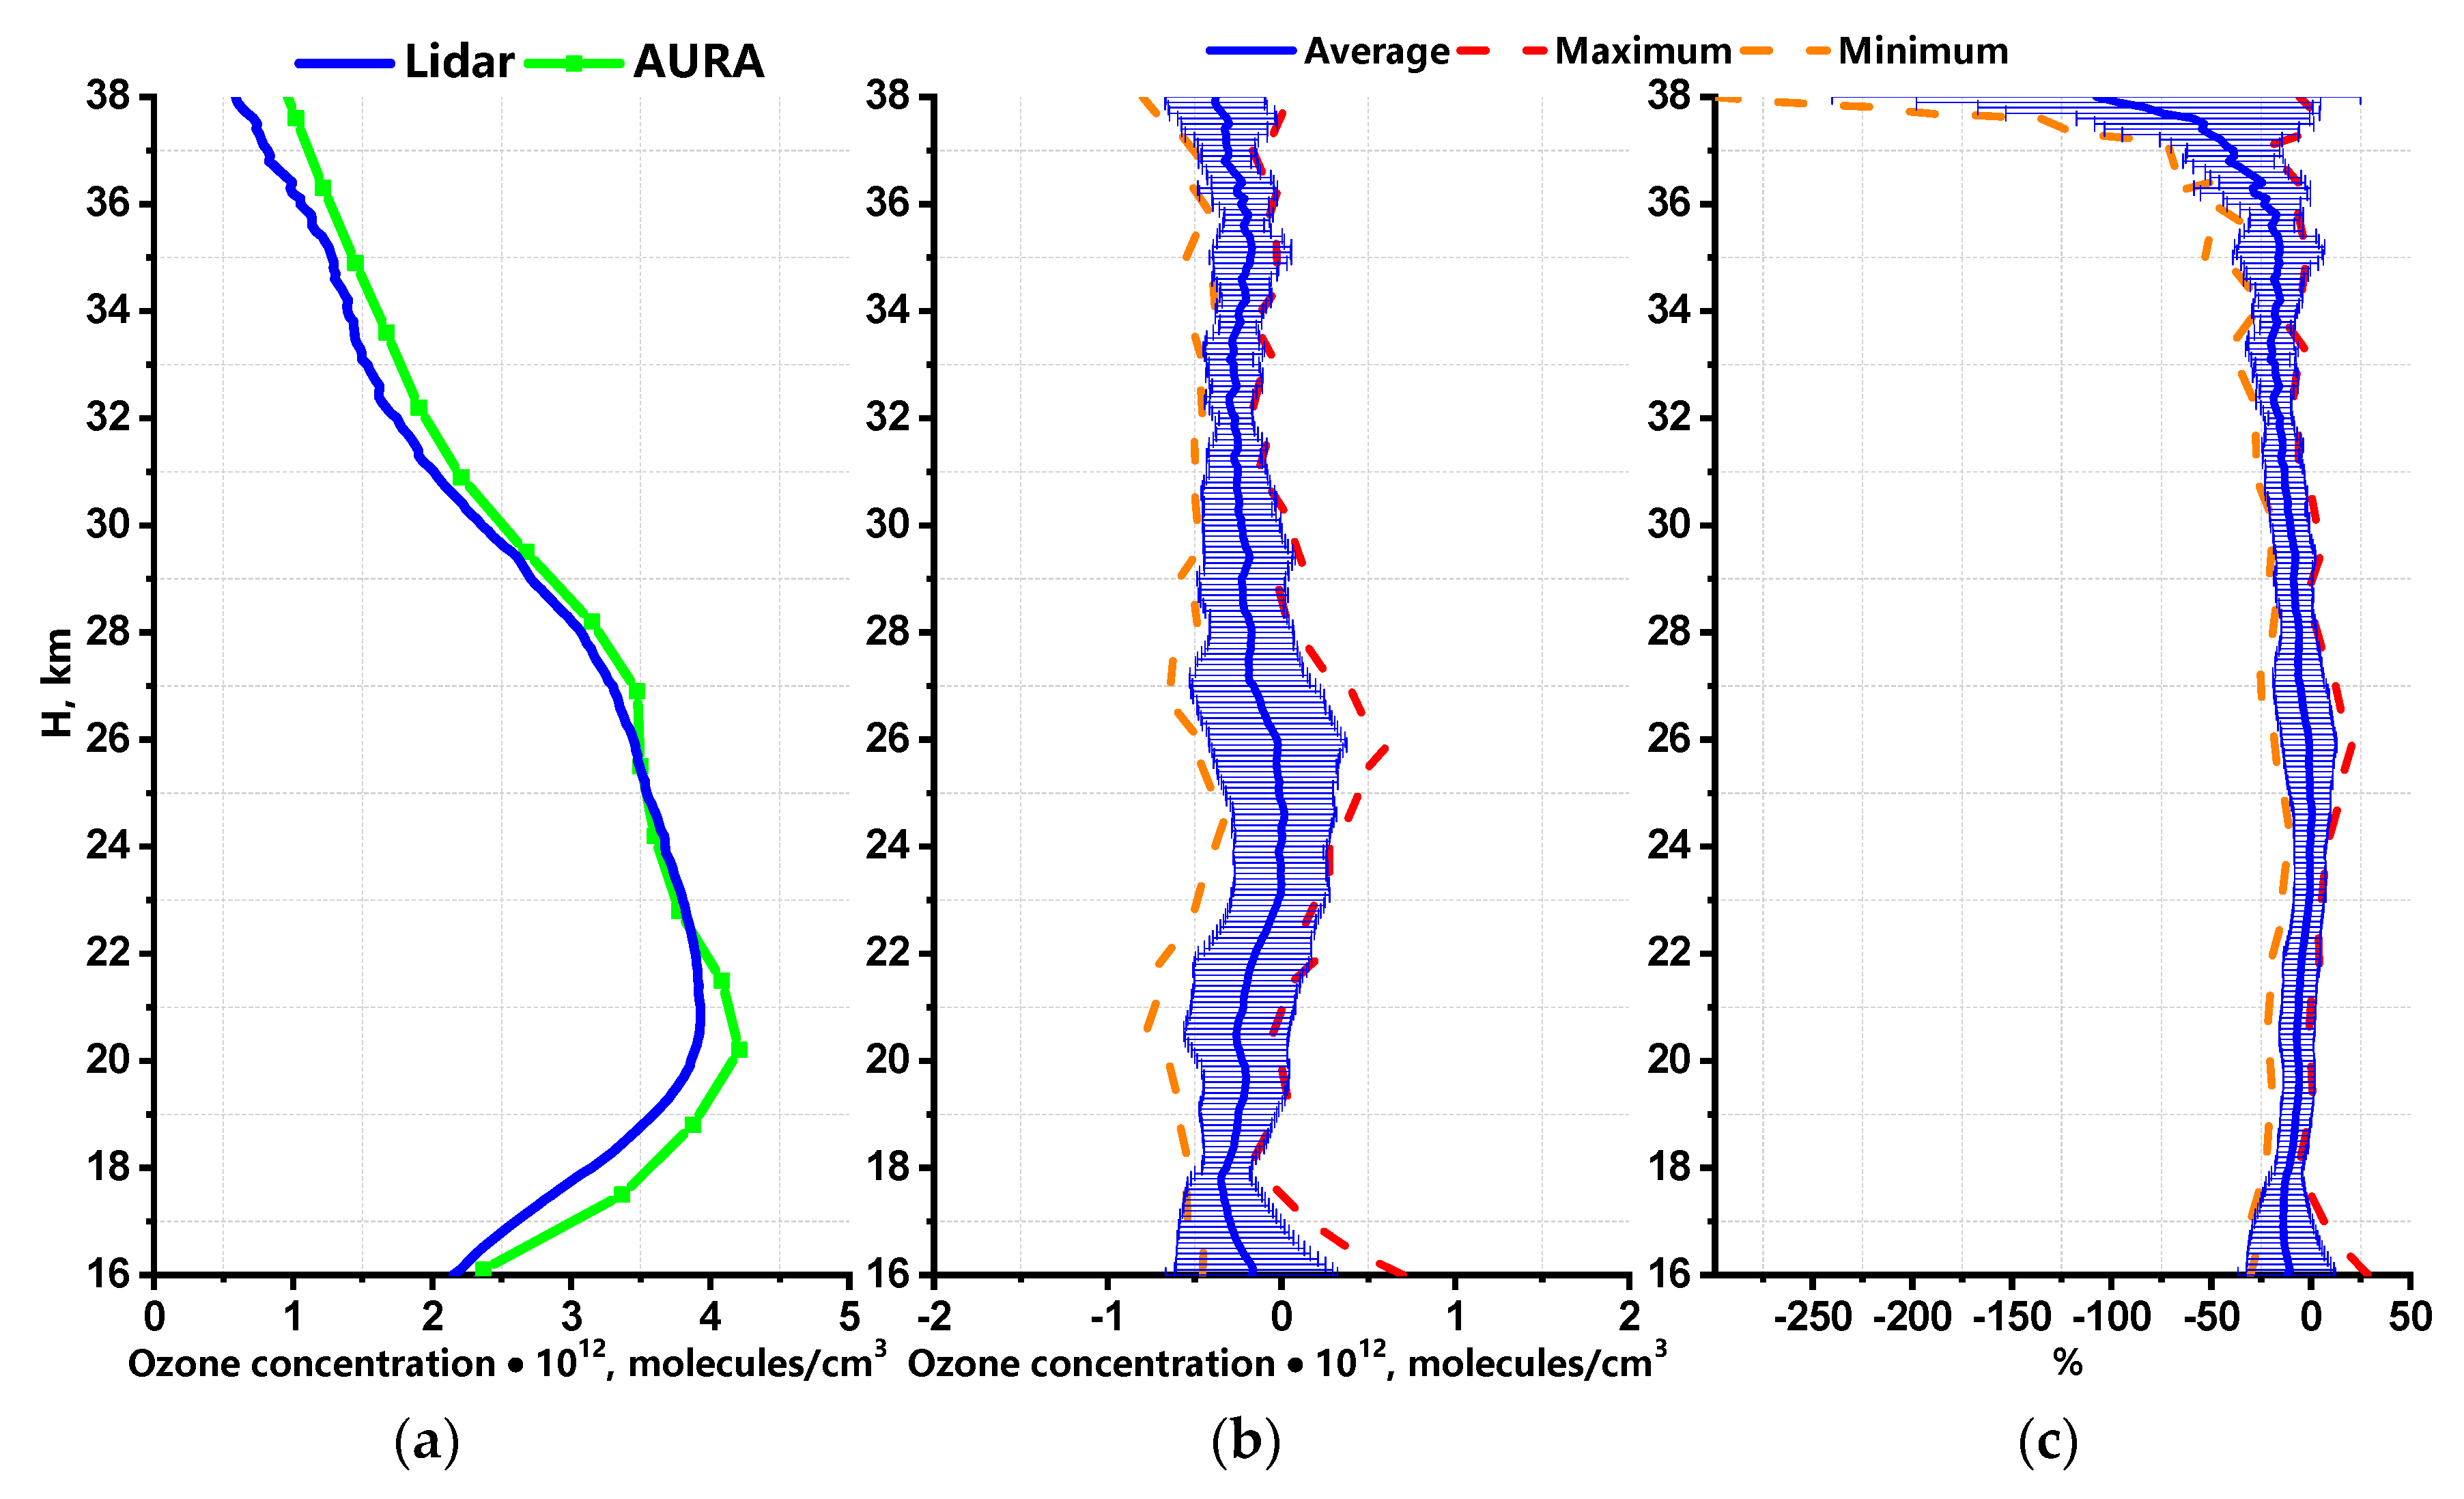
| Stratosphere Lidar and MLS (16–38 km) | ||
|---|---|---|
| Winter–Spring | ||
| Lidar − MLS × 1012 molecules/cm3 | 100 ×(Lidar − MLS)/Lidar % | |
| Minimum | from −1.83 at 16 km to −0.41 at 37.1 km | from −182.65 at 37.4 km to −14.96 at 18.7 km |
| Maximum | from −0.09 at 32.1 km to 1.46 at 16 km | from −4.26 at 32.5 km to 45.27 at 38 km |
| Average | from −0.54 at 29.1 km to −0.1 at 17.5 km | from −35.45 at 37.9 km to −2.34 at 17.9 km |
| Summer–Fall | ||
| Minimum | from −1.83 at 16 km to −0.41 at 37.1 km | from −299.87 at 38 km to −10.67 at 24.5 km |
| Maximum | from −0.18 at 37.1 km to 0.7 at 16 km | from −21.63 at 36.8 km to 28.81 at 16 km |
| Average | from −0.38 at 37.9 km to −0.01 at 24.5 km | from −107.64 at 38 km to 0.57 at 24.6 km |
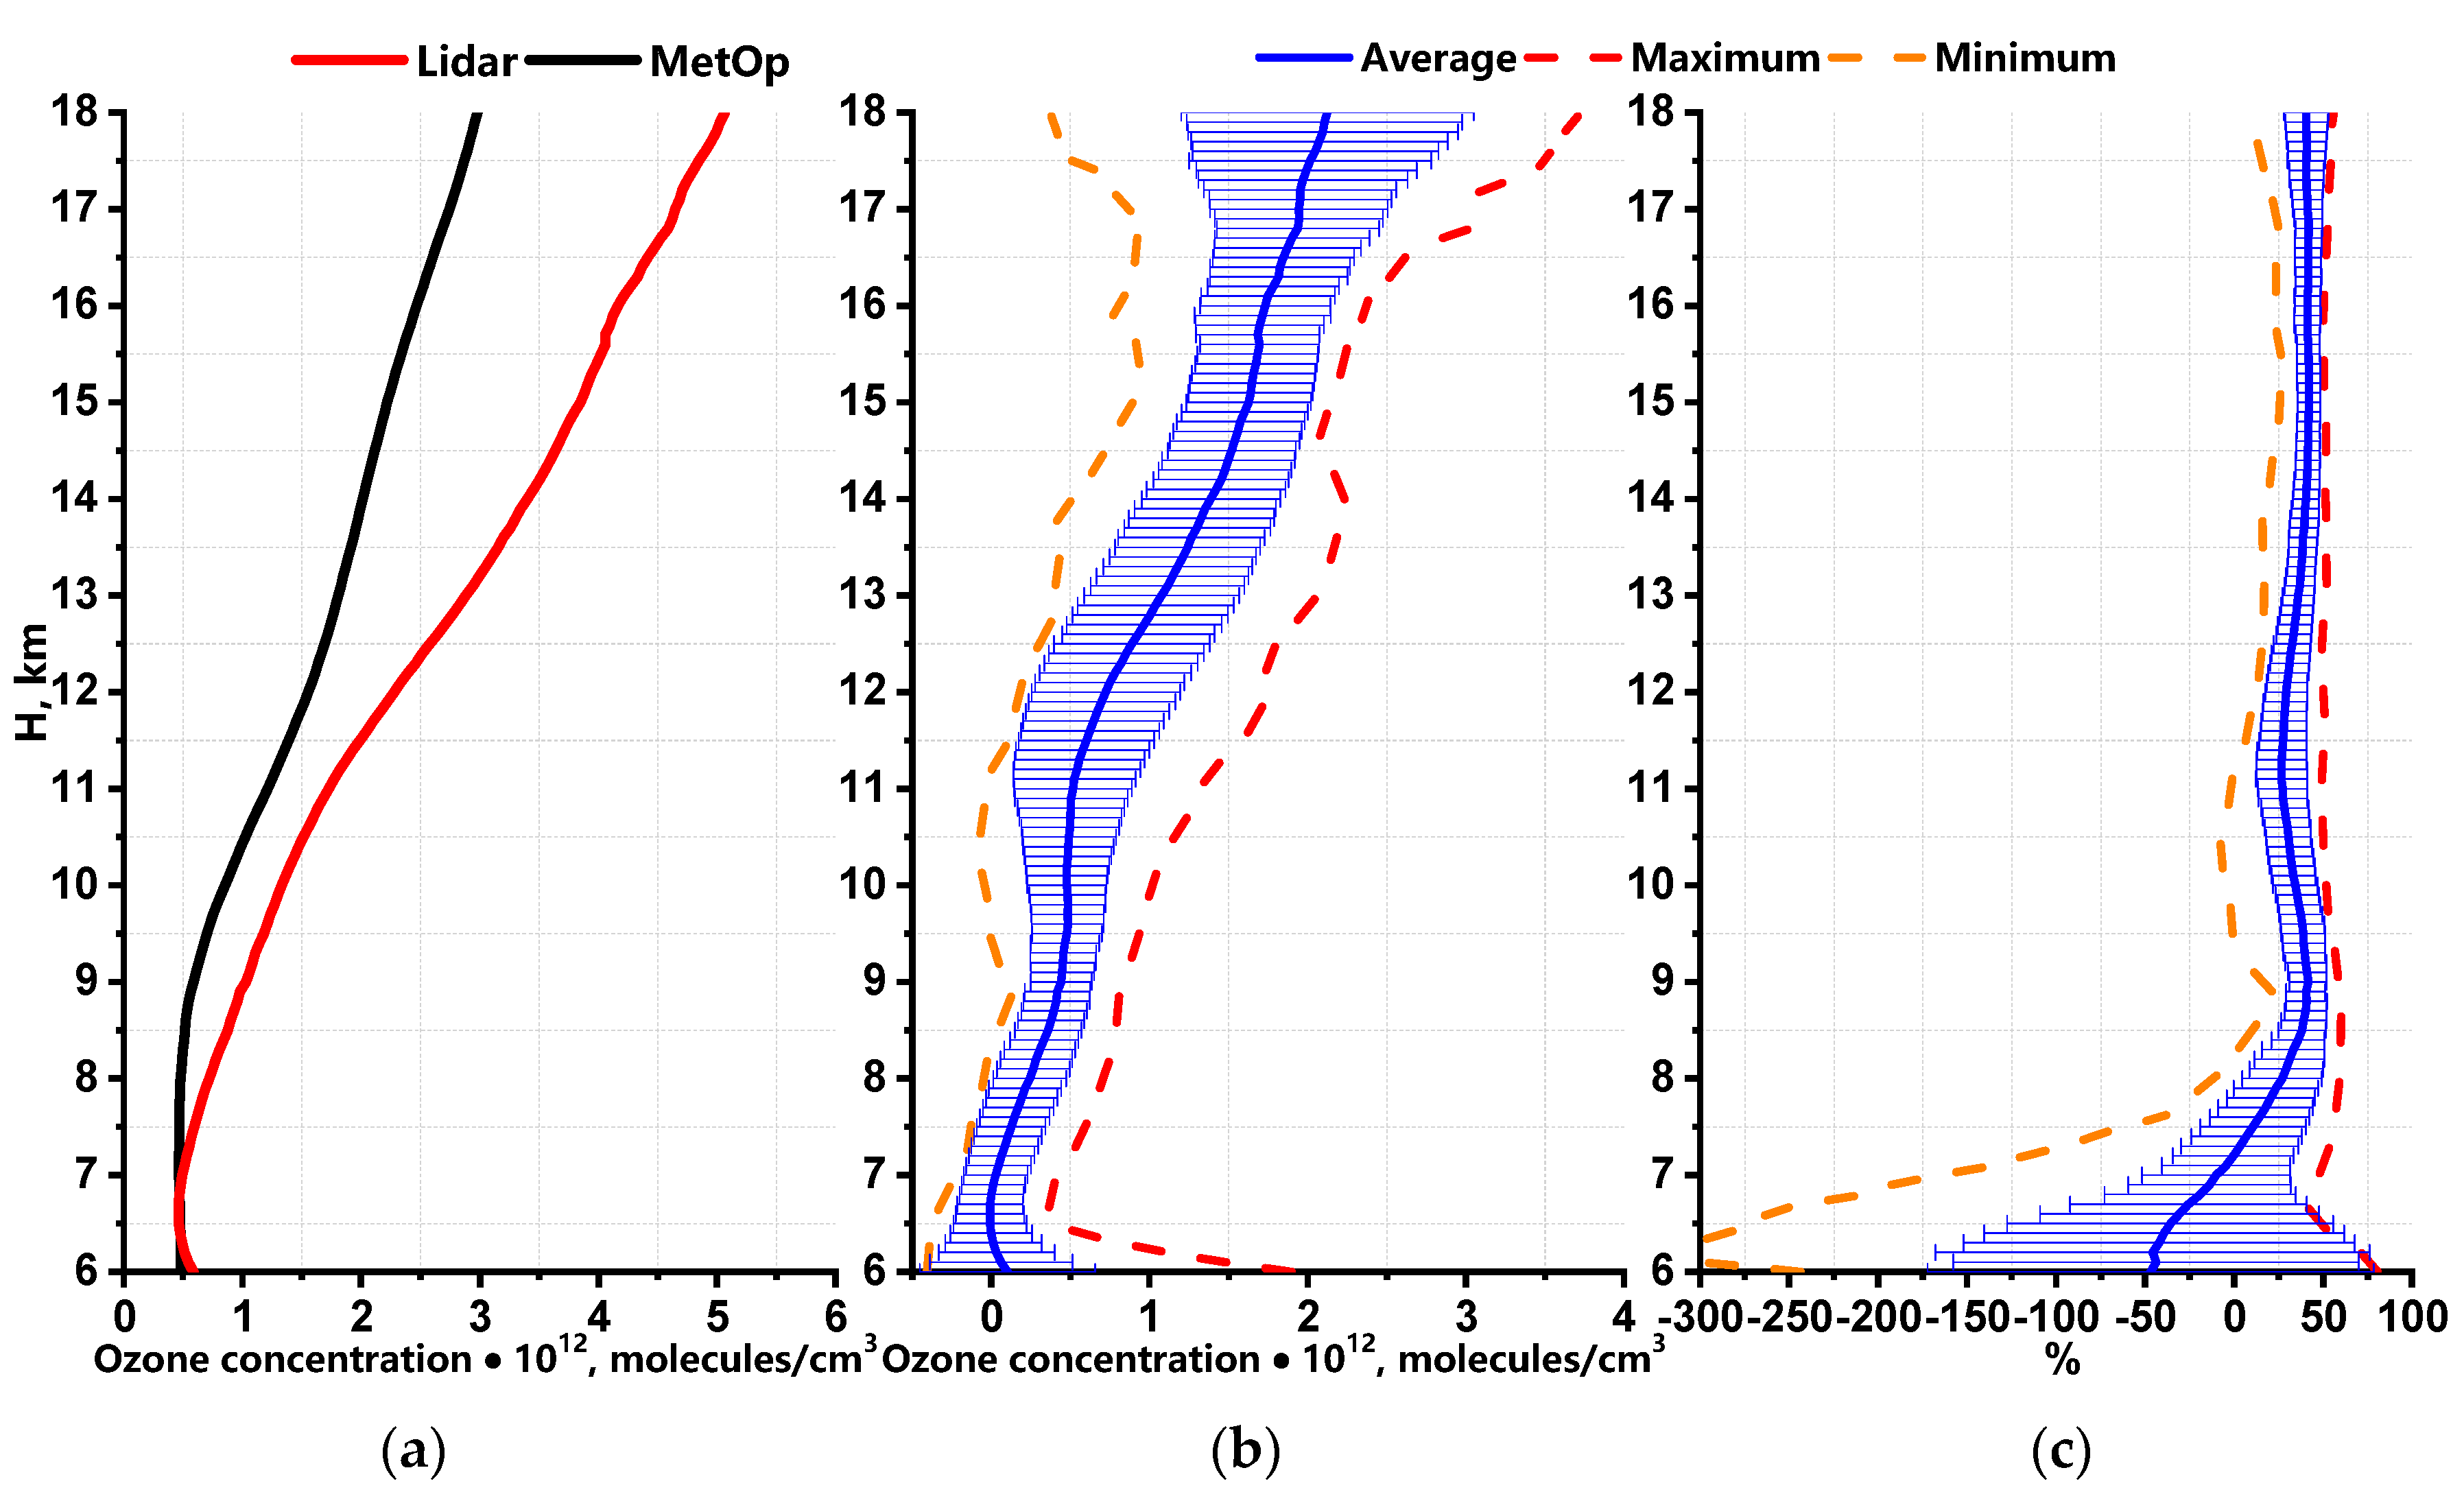
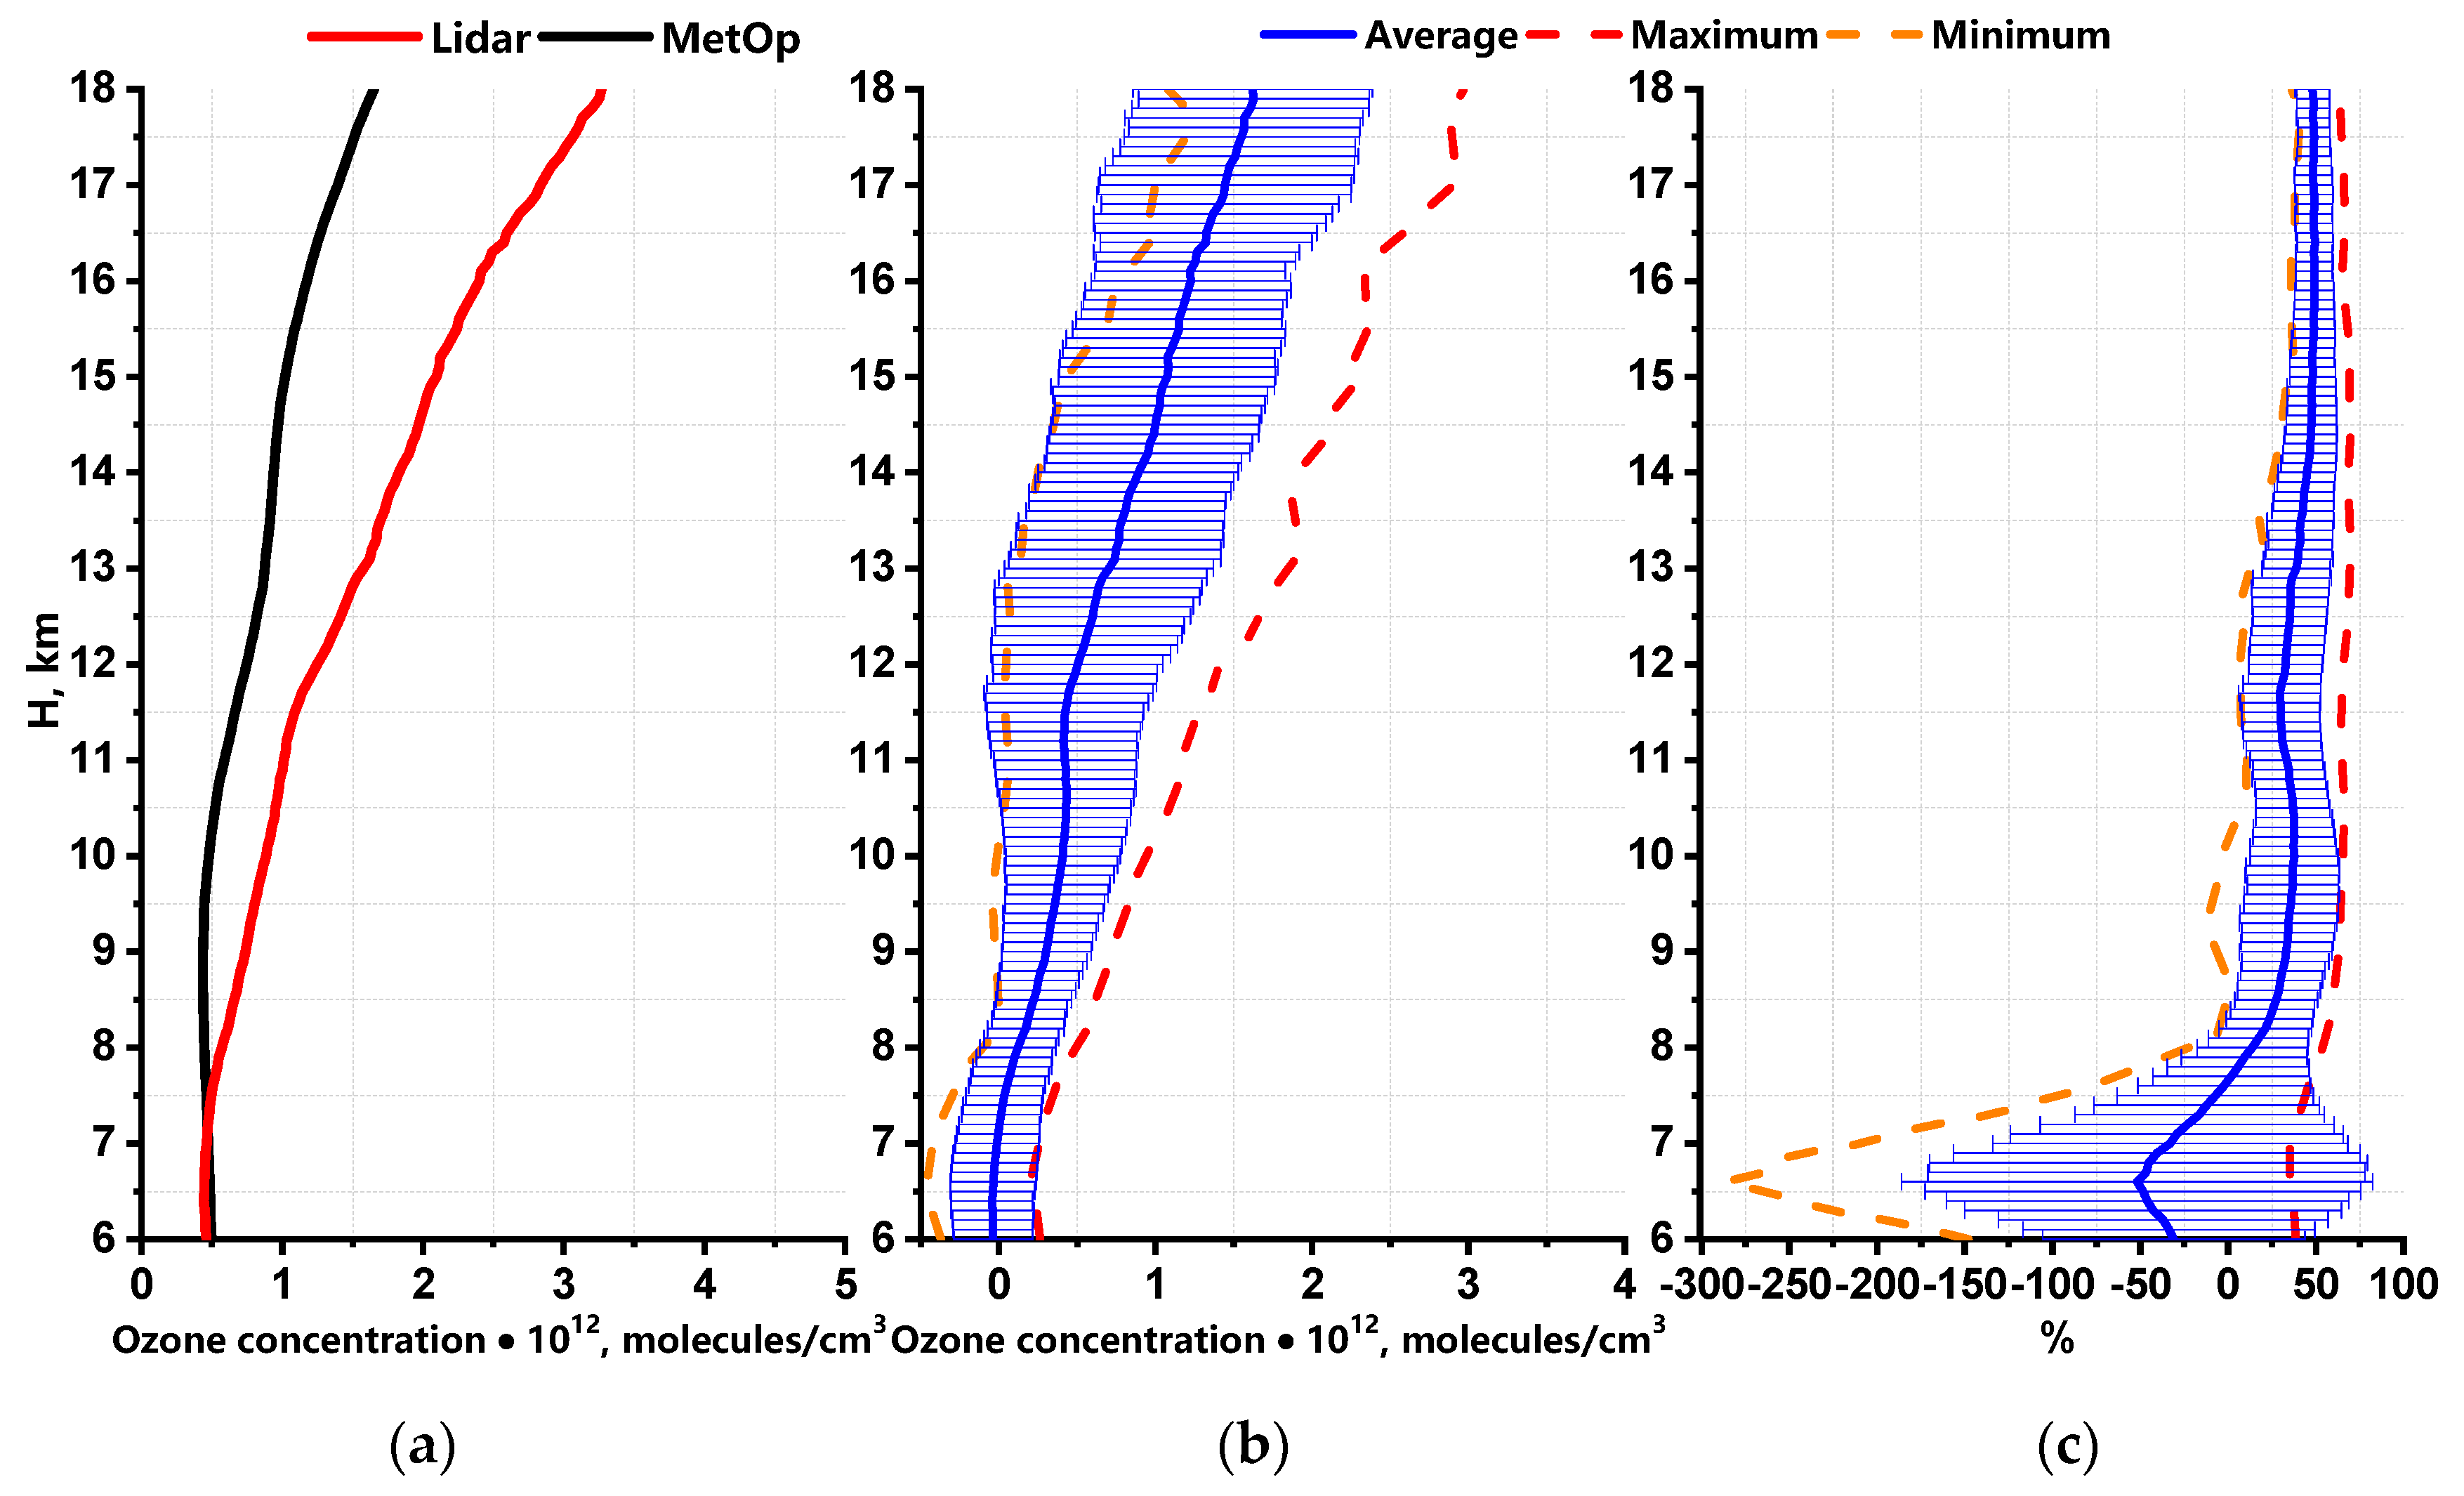
| Troposphere Lidar and IASI (6–18 km) | ||
|---|---|---|
| Winter–Spring | ||
| Lidar − IASI × 1012 molecules/cm3 | 100 ×(Lidar − IASI)/Lidar % | |
| Minimum | from −0.4 at 6 km to 0.99 at 16.8 km | from −299 at 6.1 km to 26.56 at 15.3 km |
| Maximum | from 0.35 at 6.6 km to 3.78 at 18 km | from 41.35 at 6.6 km to 80.73 at 6 km |
| Average | from −0.01 at 6.6 km to 2.12 at 18 km | from −46.92 at 6 km to 42.07 at 15 km |
| Summer–Fall | ||
| Minimum | from −0.45 at 6.6 km to 1.19 at 17.6 km | from −287.03 at 6.6 km to 40.72 at 17.5 km |
| Maximum | from 0.20 at 6.6 km to 2.97 at 18 km | from −34.55 at 6.9 km to 69.71 at 13.1 km |
| Average | from −0.04 at 6.4 km to 1.62 at 17.9 km | from −51.8 at 6.6 km to 49.6 at 16.4 km |
© 2020 by the authors. Licensee MDPI, Basel, Switzerland. This article is an open access article distributed under the terms and conditions of the Creative Commons Attribution (CC BY) license (http://creativecommons.org/licenses/by/4.0/).
Share and Cite
Dolgii, S.; Nevzorov, A.A.; Nevzorov, A.V.; Gridnev, Y.; Kharchenko, O. Measurements of Ozone Vertical Profiles in the Upper Troposphere–Stratosphere over Western Siberia by DIAL, MLS, and IASI. Atmosphere 2020, 11, 196. https://doi.org/10.3390/atmos11020196
Dolgii S, Nevzorov AA, Nevzorov AV, Gridnev Y, Kharchenko O. Measurements of Ozone Vertical Profiles in the Upper Troposphere–Stratosphere over Western Siberia by DIAL, MLS, and IASI. Atmosphere. 2020; 11(2):196. https://doi.org/10.3390/atmos11020196
Chicago/Turabian StyleDolgii, Sergey, Alexey A. Nevzorov, Alexey V. Nevzorov, Yurii Gridnev, and Olga Kharchenko. 2020. "Measurements of Ozone Vertical Profiles in the Upper Troposphere–Stratosphere over Western Siberia by DIAL, MLS, and IASI" Atmosphere 11, no. 2: 196. https://doi.org/10.3390/atmos11020196
APA StyleDolgii, S., Nevzorov, A. A., Nevzorov, A. V., Gridnev, Y., & Kharchenko, O. (2020). Measurements of Ozone Vertical Profiles in the Upper Troposphere–Stratosphere over Western Siberia by DIAL, MLS, and IASI. Atmosphere, 11(2), 196. https://doi.org/10.3390/atmos11020196