Article

Decadal-to-Multidecadal Variability of Seasonal Land Precipitation in Northern Hemisphere in Observation and CMIP6 Historical Simulations

Key Laboratory of Meteorological Disaster, Ministry of Education (KLME)/Collaborative Innovation Center on Forecast and Evaluation of Meteorological Disasters (CIC-FEMD)/Joint International Research Laboratory of Climate and Environment Change (ILCEC), Nanjing University of Information Science and Technology, Nanjing 210044, China
*
Author to whom correspondence should be addressed.
Atmosphere 2020, 11(2), 195; https://doi.org/10.3390/atmos11020195
Submission received: 16 January 2020 / Revised: 7 February 2020 / Accepted: 10 February 2020 / Published: 12 February 2020
(This article belongs to the Section Climatology)

Abstract

:
Based on the centennial-scale observations and CMIP6 historical simulations, this paper employs the ensemble empirical mode decomposition to extract the decadal-to-multidecadal variability of land precipitation (DMVLP) in the northern hemisphere. The spatial distributions of the dominant mode from the empirical orthogonal function are different in four seasons. Regions with the same sign of precipitation anomalies are likely to be teleconnected through oceanic forcing. The temporal evolutions of the leading modes are similar in winter and spring, with an amplitude increasing after the late 1970s, probably related to the overlap of oceanic multidecadal signals. In winter and spring, the Interdecadal Pacific Oscillation (IPO) and the Atlantic Multidecadal Oscillation (AMO) play a joint role. They were in phase before late 1970s and out of phase after then, weakening/strengthening the impacts of the North Pacific and North Atlantic on the DMVLP before/after late 1970s. In summer and autumn, AMO alone plays a part and the amplitude of time series does not vary as in winter and spring. The ability of the coupled models from CMIP6 historical simulations is also evaluated. The good-models average largely captures the spatial structure in four seasons and the associated oceanic signals. The poor-models average is hardly or weakly correlated with observation.

1. Introduction

In terms of the variability of land precipitation in a long time scale, many studies focused on the trend variability [1,2,3,4,5,6,7,8,9,10]. Yet it was noted that trend analysis had conceptual problems. For instance, the sign of trends and the significance were sensitive to the choice of period. Besides, trend analysis usually assumed a linear trend, unable to depict nonlinear and cyclic variability [11]. In fact, the contribution of the decadal-to-multidecadal variability (DMV) exceeds the trend variability by a large margin [12]. The DMV of land precipitation (DMVLP) is of great importance in understanding the long-term variability and forecasting at decadal time scale, which has attracted considerable attention in recent decades. In previous studies, the DMVLP has been examined mainly on a regional basis, such as North America [13,14], Africa [15], East Asia [16,17], South Asia [18], and so on. Yet, the DMVLP on a hemispheric scale and its mechanism have not been clearly identified. In particular, there were few discussions on the DMVLP in different seasons, while more on the summer monsoon rainfall [19,20,21,22]. Thus, the characteristics of DMVLP on a hemispheric scale in different seasons are an aim of the current work.
Accordant conclusions have not been reached on the mechanisms of DMVLP. Yet, it has been agreed that the oceanic multidecadal signals should play a critical role. In the Pacific, the Interdecadal Pacific Oscillation (IPO) was positively correlated with precipitation over the western and central U.S., eastern Australia and southern Africa [15,23,24]. The positive phase of the Pacific decadal oscillation (PDO)/IPO was related to more precipitation over southern North America and the middle and lower reaches of the Yangtze River, and less precipitation over northern North America, North China, and South China [13,25,26]. The interdecadal change of East Asian summer rainfall in late 1990s was found to be attributed to the interdecadal sea surface temperature (SST) anomalies of North Pacific and West Pacific [17]. In the Atlantic, the Atlantic multidecadal oscillation (AMO) played a part in the northern hemisphere summer monsoon precipitation [20]. AMO drove the variations of North American summer precipitation at decadal time scales, with warm phase corresponding to less rainfall over central U.S. [27,28,29]. AMO also modulated the multidecadal variability of Indian summer monsoon rainfall [18,30], and accounted for the multidecadal precipitation in Siberian warm season to a great extent [31].
Some studies pointed out a joint impact of oceanic multidecadal signals on the DMVLP. Ault et al. found that the relative magnitude of DMVLP over North America was not a linear response to a single decadal mechanism such as PDO/IPO or AMO [14]. Both PDO and AMO had influence on the spatial patterns of precipitation variations in the twentieth century [32]. The Indian summer rainfall was positively correlated with AMO before mid-1990s, but was after then related to Indian Ocean-western Pacific SST anomalies [33]. The role of oceanic multidecadal signals in the DMVLP on a hemispheric scale in different seasons is another aim of the current work.
The Coupled Model Intercomparison Project (CMIP) simulations have been widely used in investigating the long-term variability of precipitation. The trends of global and hemispheric precipitation were evaluated in phase 5 of CMIP (CMIP5) climate models [34,35,36]. The contribution of DMV of precipitation to the total variance was smaller in CMIP5 historical runs than in observation [37]. The ability of CMIP5 models was assessed in predicting the Sahelian monsoon precipitation at decadal time scale [38]. Compared to the observation, all CMIP5 models underestimated the summer precipitation over western Eurasia and overestimated the summer precipitation over eastern Eurasia, which was possibly caused by little cloud cover and strong local coupling of evaporation and precipitation in models [39]. Lyu et al. compared the observed AMO-related precipitation anomalies to that in CMIP5 models [40]. Joshi et al. assessed the impact of IPO on Indian summer monsoon rainfall in CMIP5 models [41]. Nevertheless, the ability of phase 6 of CMIP (CMIP6) simulations in capturing the observed DMVLP, especially on a hemispheric scale, has not been evaluated yet [42].
To sum up, the seasonal DMVLP on a hemispheric scale and the associated oceanic modes are not clear yet. The performance of state-of-the-art climate models in CMIP6 simulations in capturing the observed DMVLP is unraveled. Therefore, the rest of the paper is organized as follows: Section 2 describes data and methods used in the study. Section 3 examines the observed spatial and temporal characteristics of the dominant mode of DMVLP in northern hemisphere (NH) in four seasons. The oceanic signals related to the DMVLP are investigated in Section 4. The ability of the coupled models in CMIP6 historical runs to simulate the observed DMVLP is evaluated in Section 5. Section 6 provides summary and discussion.

2. Data and Methodology

2.1. Data

This study used the monthly Hadley Centre Sea Ice and Sea Surface Temperature dataset (HadISST) from 1870 to 2016. The spatial resolution was 1° × 1° latitude by longitude [43].
The Global Precipitation Climatology Centre (GPCC) monthly land-surface precipitation Full Data Product (V2018) from 1891 to 2016, based on quality-controlled data from global stations, was employed. The spatial resolution was 1° × 1° latitude by longitude [44]. There were some grids with missing data before 1940; however, obvious differences were not found between 1891–2016 and 1941–2016 in the spatial and temporal features from empirical orthogonal function (EOF) on the seasonal precipitation. Thus, the total length of time was used in this study.
The monthly SST and precipitation datasets of the coupled models are from CMIP6 historical simulations, with temporal coverage from 1870 to 2014. The models chosen in the current work had at least 3 members in a historical ensemble, and then differences among members in a model ensemble could be examined. The models and the number of ensemble members are listed in Table 1.
An identical period of time from 1891 to 2014 was used for all datasets. The seasonal means were calculated and then climatology was removed. As the current work focuses on the DMVLP in NH, winter/spring/summer/autumn was used instead of boreal winter/boreal spring/boreal summer/boreal autumn for brevity.

2.2. Methods

The ensemble empirical mode decomposition (EEMD) was employed to extract the DMV of precipitation and SST. EEMD decomposes a time series into some empirically determined intrinsic mode functions from high to low frequency and separates time scales without subjective criterion selection, which could overcome the confusion of modes with different time scale [45]. Then the EOF analysis was applied to obtain the primary mode of DMVLP.
The auto-correlation of DMVLP was much larger than the seasonal precipitation. Thus, the effective degree of freedom (EDOF) was reduced substantially for DMVLP, and was calculated after Bretherton et al. [46]. The t-test was used to determine the statistical significance.

3. Spatial and Temporal Features of the DMVLP in GPCC

The observed spatial and temporal characteristics of the DMVLP in four seasons were investigated in this section.

3.1. Winter

The dominant mode from EOF analysis of the wintertime DMVLP in NH explained 13% of the total variance. Figure 1a shows its spatial distribution. Significant positive anomalies were found over the central North America, northern South America, and regions to the north of Mediterranean Sea; and significant negative anomalies were over southern U.S., central and western Russia, Arabian Peninsula, and southern China.
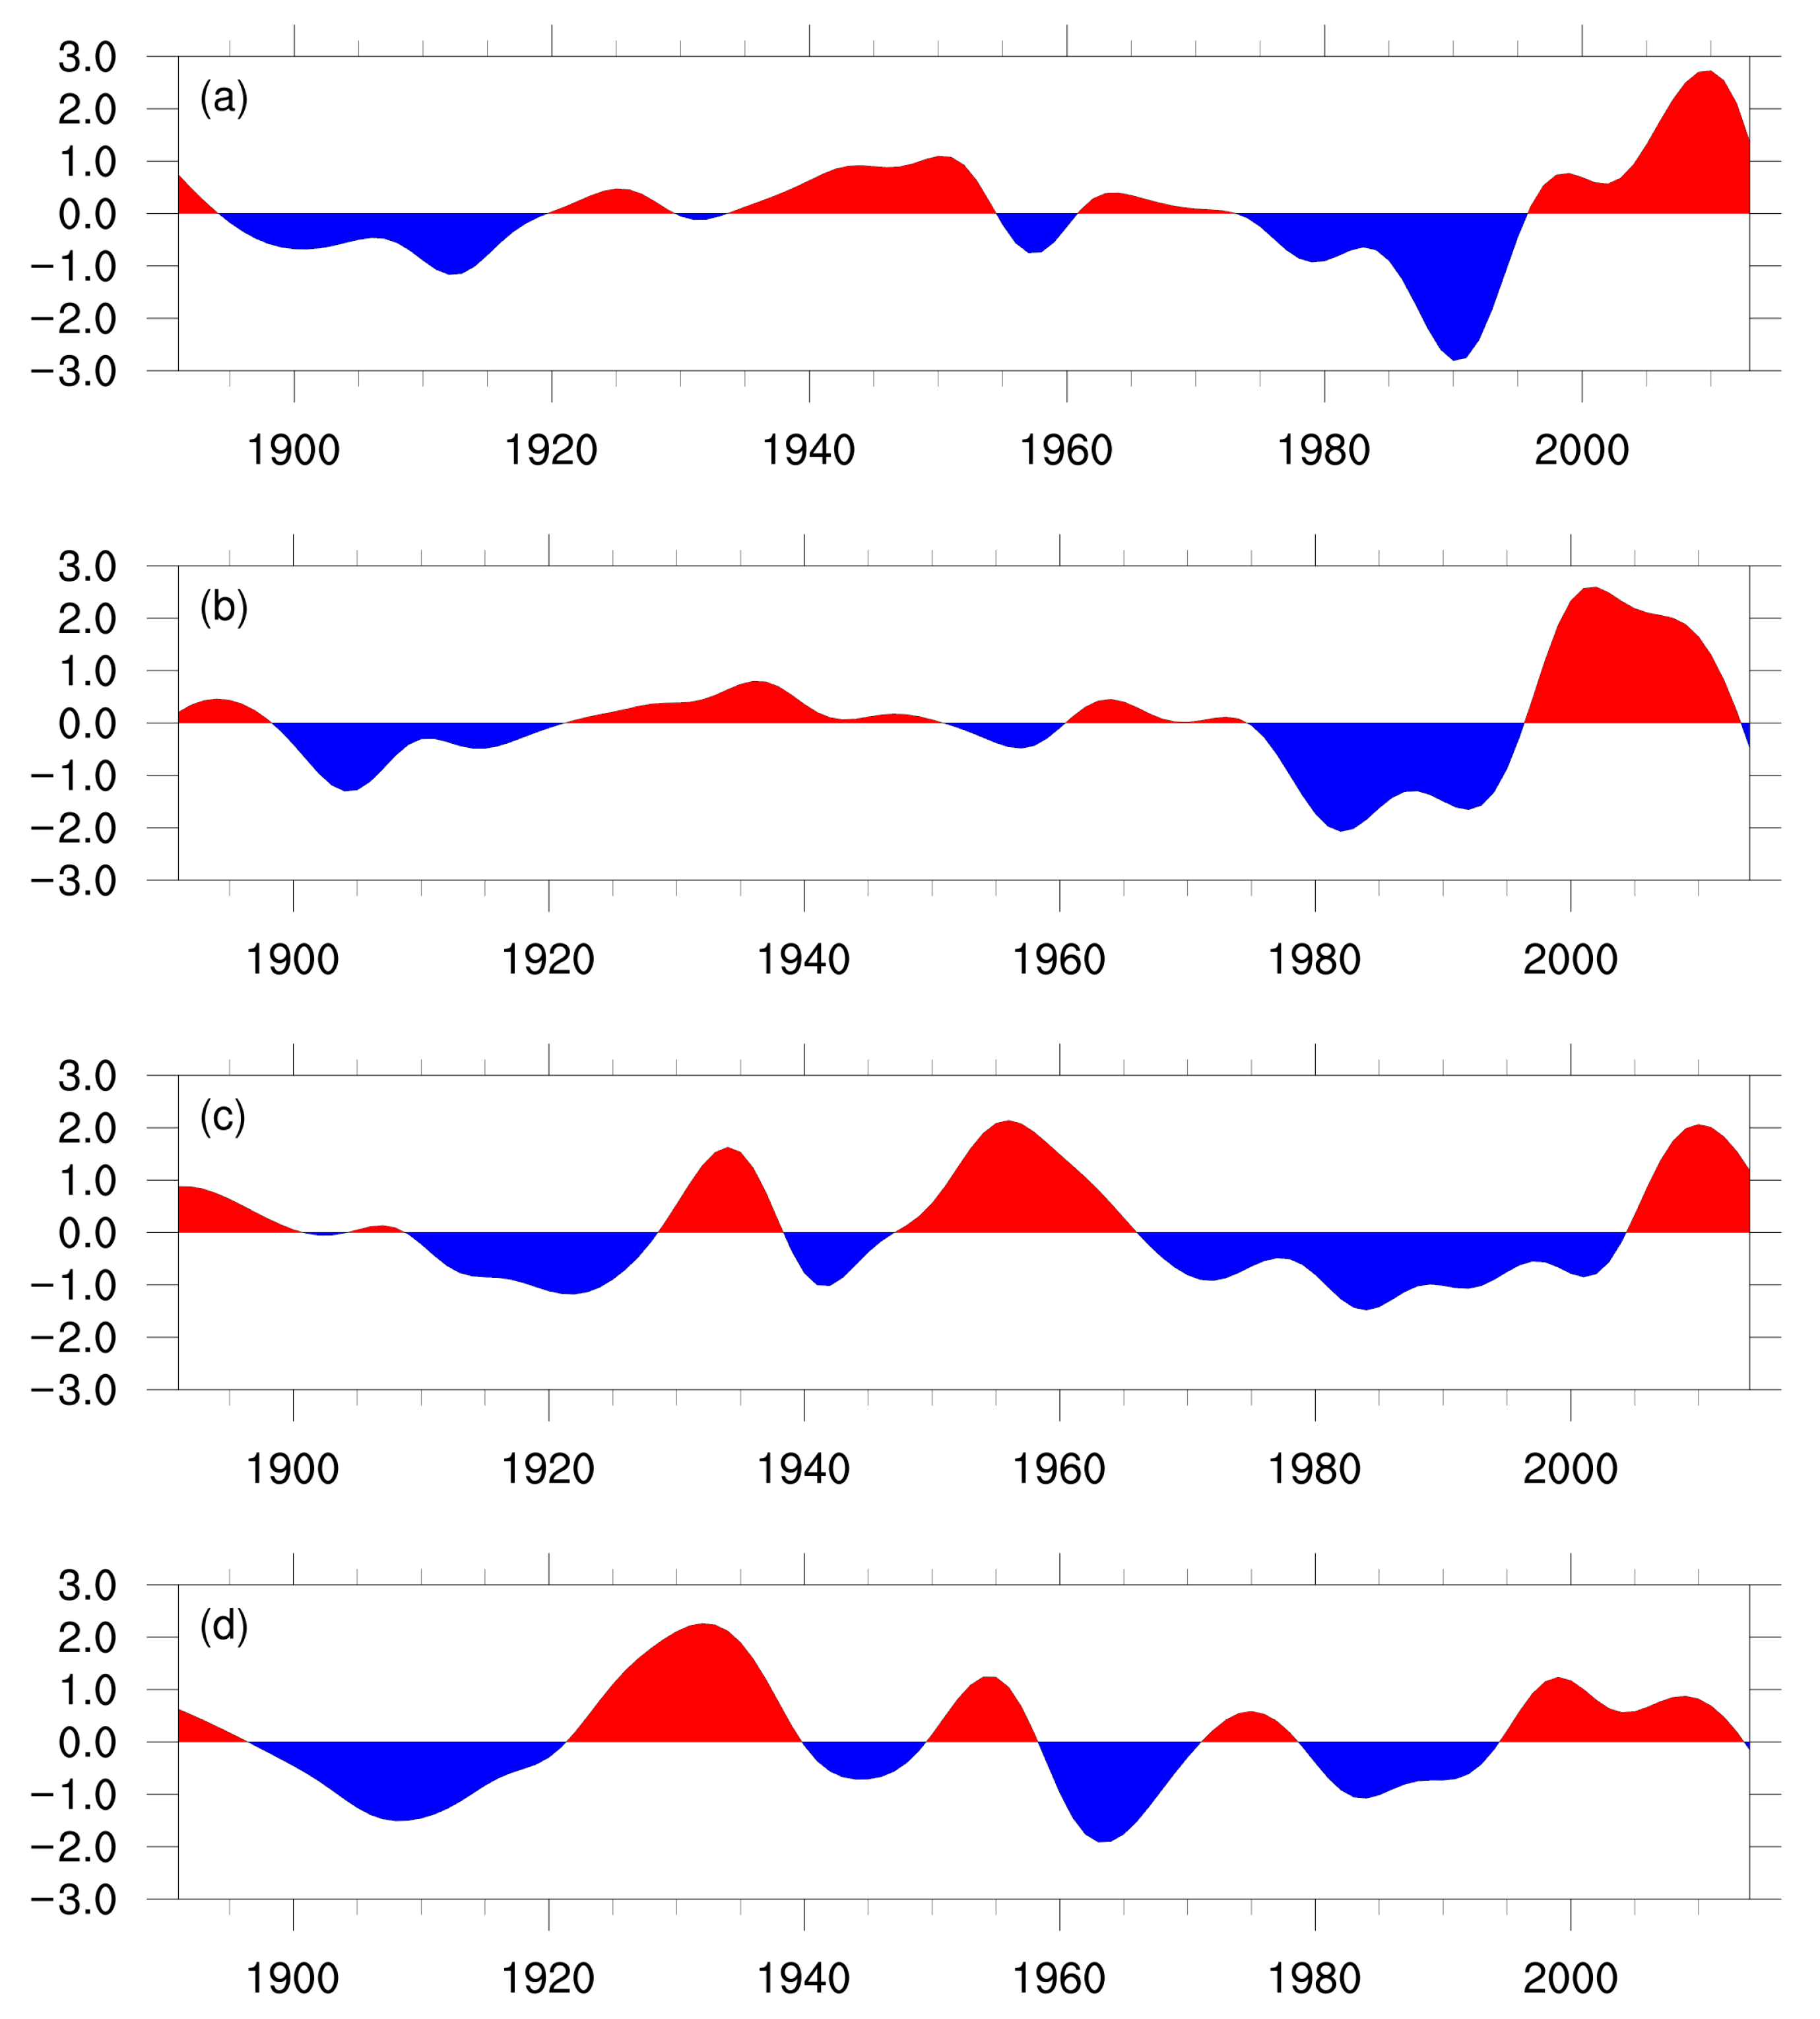
The time series displays obvious DMV (Figure 2a). It was in the positive phase during 1920–1955 and 1995–2014, and in the negative phase during 1895–1920 and 1975–1995. Based on the spectrum analysis, the 30–60-years period was the primary and the 10–15-years period had much less power (Figure 3a). It is noteworthy that the amplitude of variability appeared to increase after the late 1970s, in agreement with the time of the 1976–1977 transition [47,48]. It is probably indicative of a larger rainfall intensity in recent decades.

3.2. Spring

The leading EOF mode of the springtime DMVLP in NH explains 11% of the total variance. There were significant positive anomalies over the northern South America, western Russia, and Indo-China Peninsula, and significant negative anomalies over the southwestern North America, Arabian Peninsula, Iran Plateau, and southeastern China (Figure 1b).
Similar with winter, the time series shows DMV, with 40 years as the primary period (Figure 2b and Figure 3b). The larger amplitude after the late 1970s was also found.

3.3. Summer

The dominant EOF mode of the summertime DMVLP in NH explained 9% of the total variance. Significant positive anomalies were found over the southern North Africa, western Europe, India, eastern Russia, and northern China; and significant negative anomalies appeared in the central and southern North America and western Russia (Figure 1c).
Unlike winter and spring, the amplitude of variability in summer did not increase after the late 1970s (Figure 2c). Zhu et al. found increased amplitude of the variability of the contiguous United States summer rainfall in the early 1990s [22], which was not seen for the summertime land precipitation in NH. The positive and negative phases of the time series in summer did not agree with winter and spring. There were three significant periods, 60 years, 25–30 years, and 15–20 years, in which the 60-years period was the primary (Figure 3c).

3.4. Autumn

The primary EOF of the autumn time DMVLP in NH explained 9% of the total variance. Significant positive anomalies were found over Europe, southern North Africa, and India, and significant negative anomalies were over the western North America, southeastern Greenland, and eastern China (Figure 1d).
The time series in autumn had certain resemblance as summer, without evident change of the amplitude of variability (Figure 2d). The main period was 25 years and the secondary period was 35–40 years (Figure 3d). The 70-years period was not significantly different from red noise.

3.5. Summary

There was a seasonal distinction for the leading mode of DMVLP in NH. The temporal evolutions in winter and spring were in phase, with the amplitude of variability increasing after the late 1970s, suggesting a larger intensity of rainfall in recent decades. The temporal evolutions in summer and autumn were similar, without apparent variation of amplitude. In any season, regions with the same sign of anomalies were probably teleconnected. The oceanic signal was likely to be a dominating factor.

4. Oceanic Signals

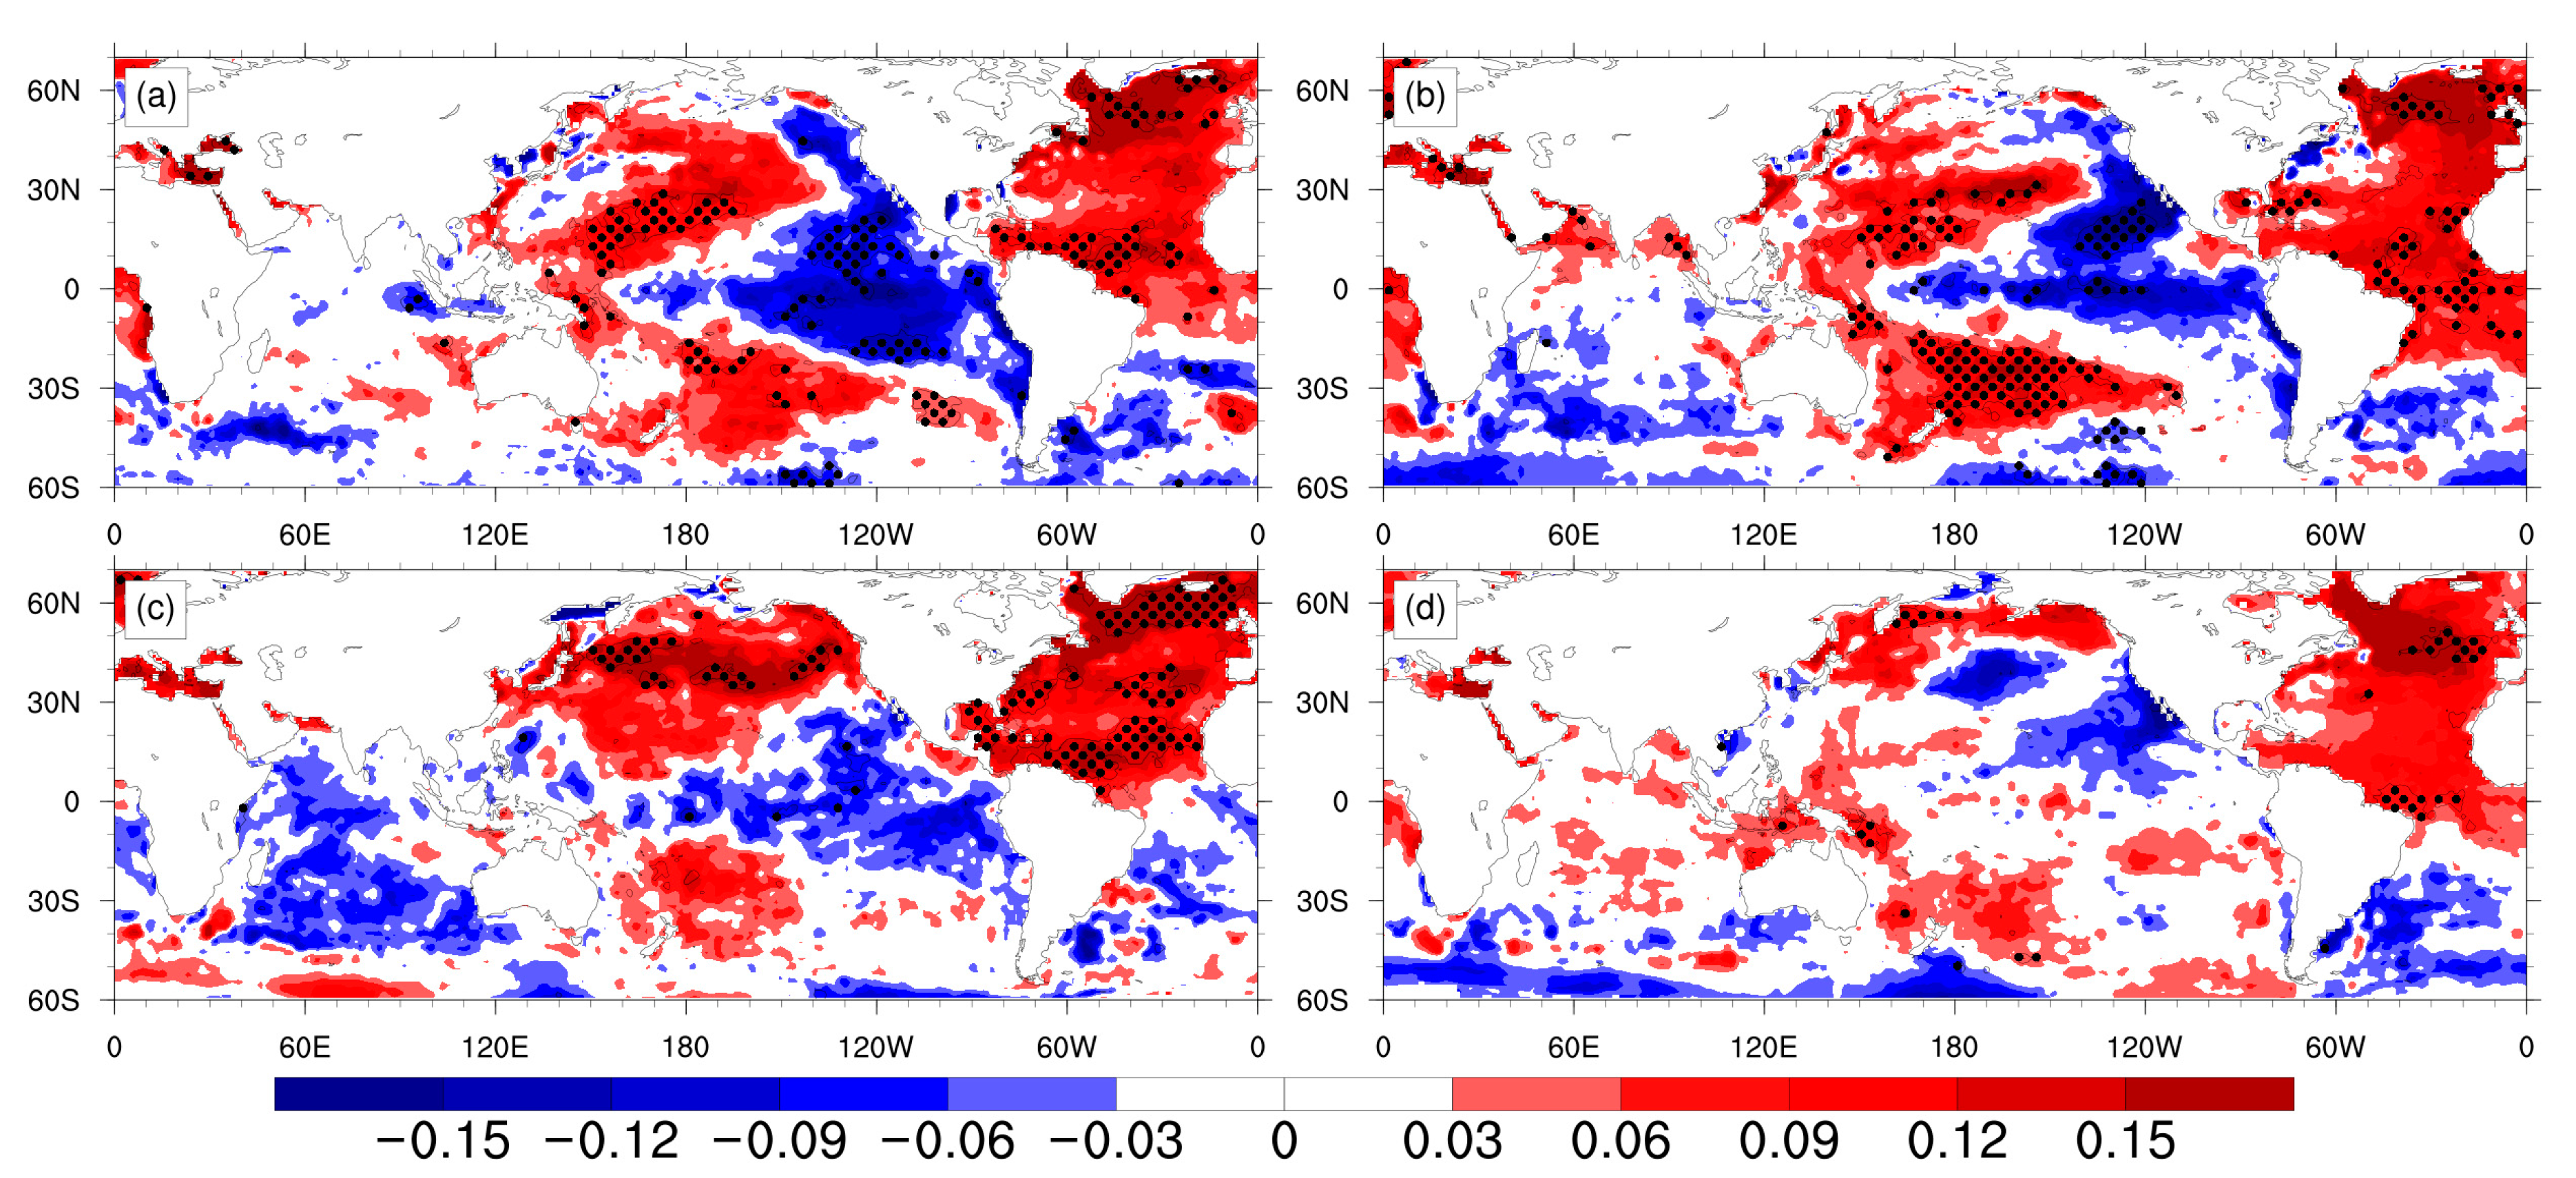
In order to identify the critical oceanic regions that influence the DMVLP in NH, regressions of SST anomaly (SSTA) onto the first principle component of DMVLP are plotted in Figure 4.
The SSTA patterns were similar in winter and spring (Figure 4a,b). In the Pacific, it was IPO in its cold phase, with a large negative anomaly in the eastern Pacific triangle and a positive anomaly in the western Pacific K-shape regions. These regions were used to define a mega-ENSO index [20]. In the Atlantic, it was AMO in its warm phase, with a large and significant positive anomaly over the high latitude North Atlantic and tropical Atlantic.
The SSTA in the Pacific changes in summer and autumn (Figure 4c,d). In summer, the positive anomaly in the northwestern Pacific moves northward, and the negative anomaly in eastern Pacific triangle became much weaker and insignificant. The signal in the Pacific disappeared in autumn. Yet, the AMO was still in its warm phase in summer and autumn. The positive SSTA over mid-latitude North Atlantic was larger in summer than in the other seasons. The signal from the Indian Ocean was statistically insignificant in all seasons.
In a word, the AMO played a role in the DMVLP in NH in all seasons. In winter and spring, there was joint influence of IPO and AMO. The configuration of the oceanic multidecadal signals was key to understanding the larger amplitude of the time series after the late 1970s in winter and spring.
The positive and negative phases of IPO and AMO overlapped. Previous work showed that different combinations of IPO and AMO phases were related to the multidecadal East Asian summer monsoon precipitation and the multidecadal drought frequency over the U.S. [21,49,50]. IPO and AMO were in phase before the late 1970s, inducing opposite signs of SSTA over the North Pacific and North Atlantic. Thus, the impact of SSTA from these two oceans might counteract in part. However, they were out of phase during the period from the late 1970s to the late 1990s, with positive IPO and negative AMO, corresponding to negative SSTA over majority of NH. They were also out of phase during the period from the late 1990s to 2010s, with negative IPO and positive AMO, corresponding to positive SSTA over majority of NH. The influence of SSTA, with consistent signs over the North Pacific and North Atlantic after late 1970s, could be reinforced, contributing to larger intensity of rainfall.
In summer and autumn, AMO was the only multidecadal oceanic signal that affected the leading DMVLP in NH. The amplitude of the time series did not display a similar variation as in winter and spring.

5. DMVLP in CMIP6 Simulations

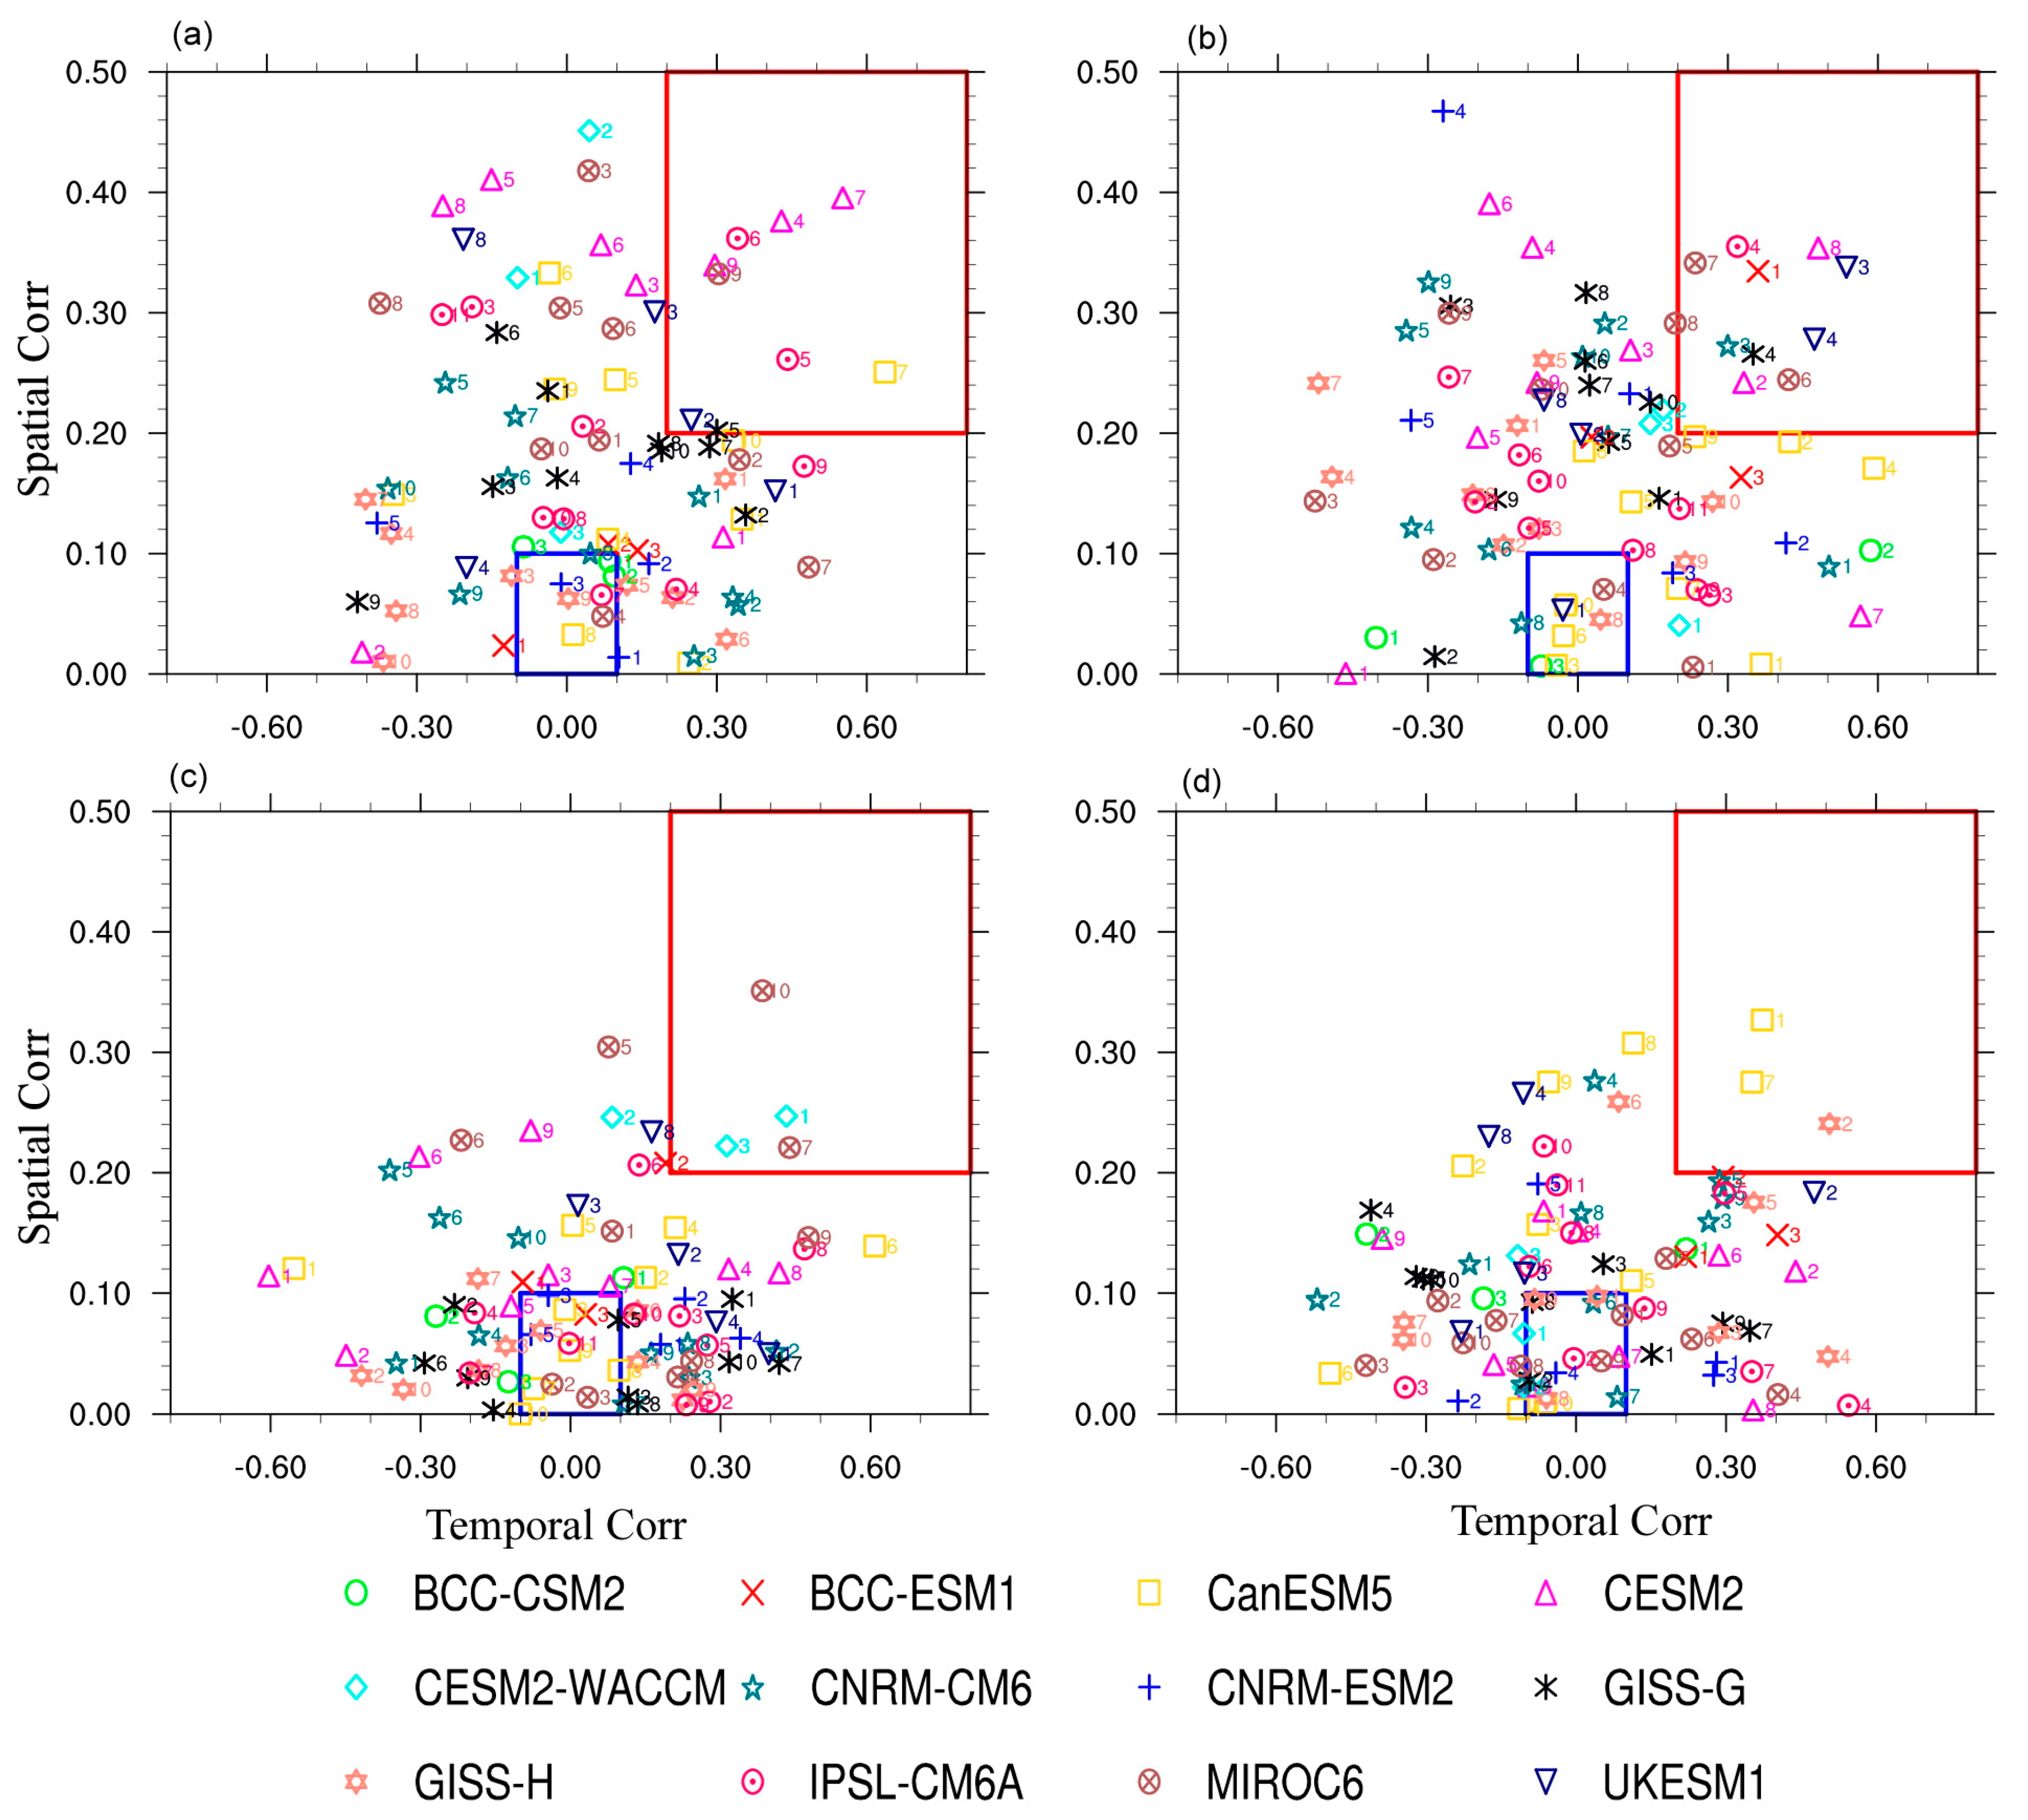
The DMVLP in NH was also investigated in different seasons in state-of-the-art coupled models from CMIP6 historical simulations. The spatial and temporal correlations between observation and each member from all models listed in Table 1 were calculated (Figure 5). Models differences were evident. The performance of a member was not consistent with other members even in the same model. It shows that the largest spatial correlation was 0.48 between observation and the fourth member of CNRM-ESM2 in spring, and the largest temporal correlation was 0.65 between observation and the seventh member of CanESM5 in winter. A model or an ensemble member from a model, which was able to capture the observed spatial pattern to a certain degree, did not necessarily well simulate the observed temporal evolution; and vice versa. Therefore, both spatial and temporal characteristics should be taken into account when evaluating the ability of a model to simulate the observed DMVLP.
In this study, good models were found as those with both spatial and temporal correlations larger than 0.2, indicated by red boxes in Figure 5; poor models were those with spatial and temporal correlations smaller than 0.1, irrespective of sign, indicated by blue boxes. Then the spatial averages of good models and poor models are displayed in Figure 6.
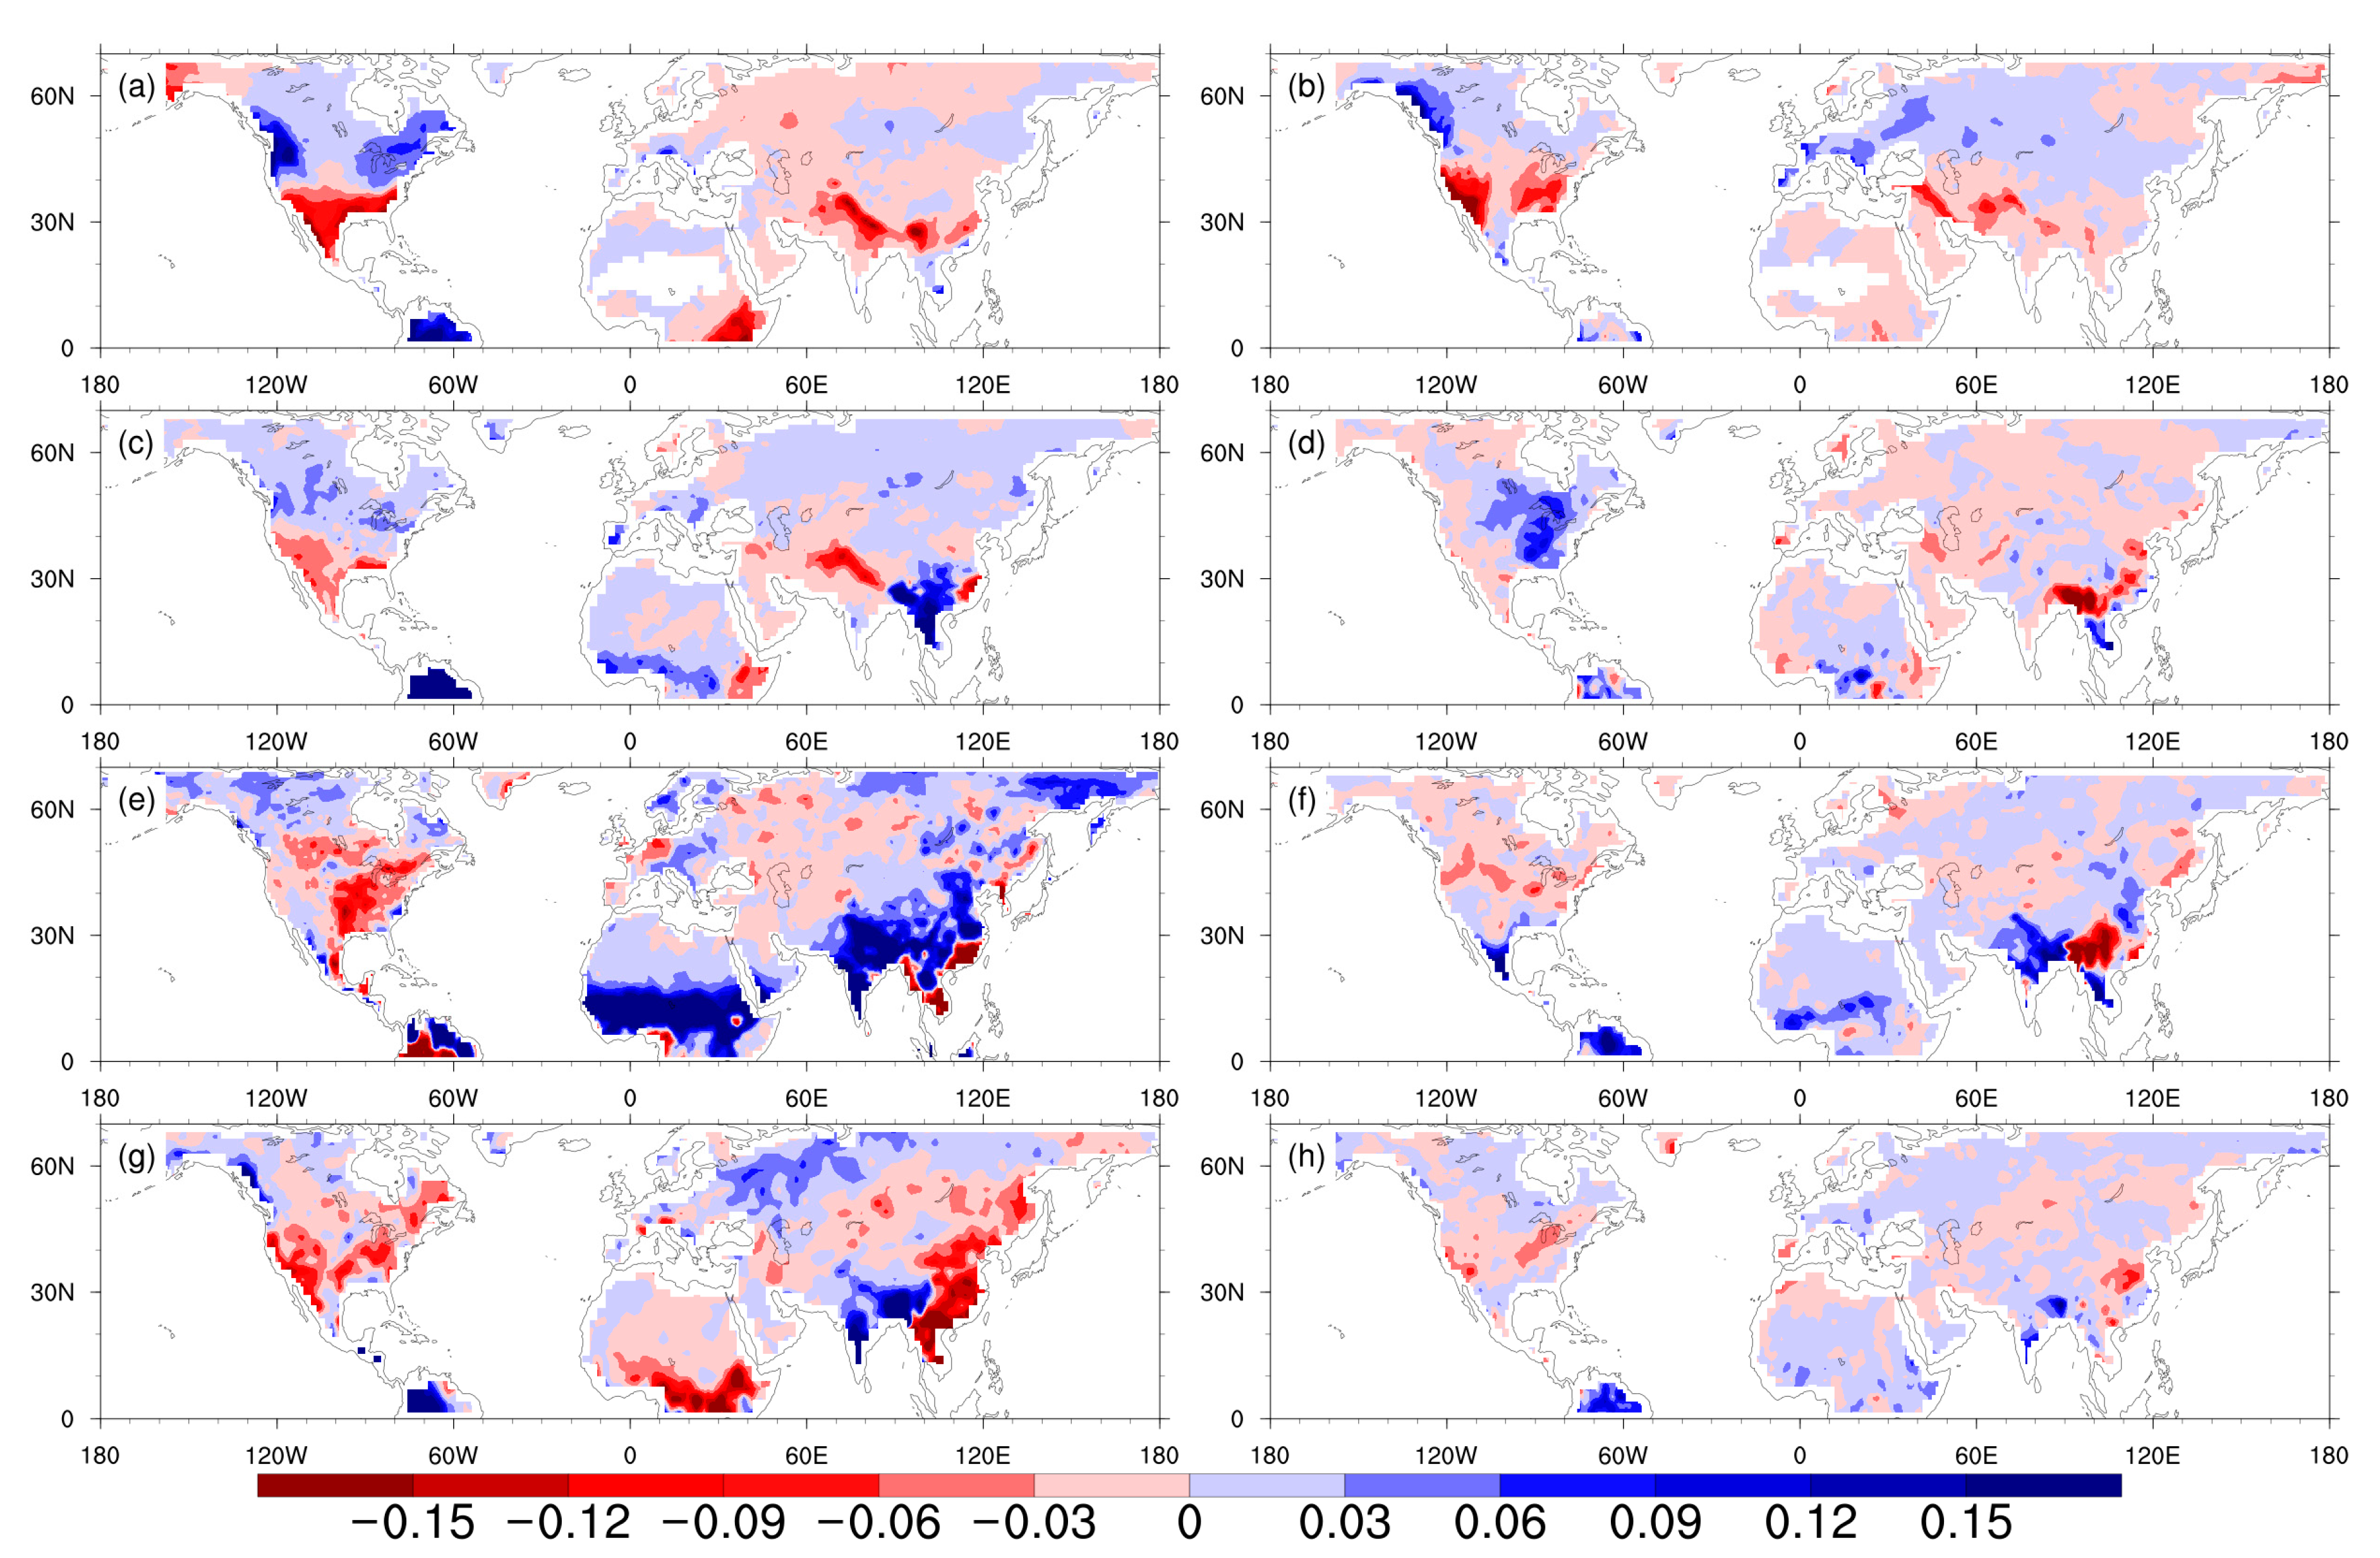
It was evident that the good models average captured the spatial structure of the observed significant precipitation anomalies to a great extent in the four seasons. In winter, the observed positive anomalies over the central North America and northern South America, as well as the negative anomalies over southern U.S., central and western Russia, and southern China, were simulated by the good models average (Figure 6a). In spring, the observed positive anomalies over the northern South America and Indo-China Peninsula, and negative anomalies over the southwestern North America, Iran Plateau, and southeastern China were simulated (Figure 6c). In summer, the observed positive anomalies over the southern North Africa, India, eastern Russia, and northern China, and negative anomalies over the central and southern North America were found (Figure 6e). In autumn, the observed positive anomalies over Europe and India, and negative anomalies over the western North America and eastern and central China were captured (Figure 6g). The observed pattern was better correlated with the good models average than any single model (CC = 0.5 in winter and spring, CC = 0.4 in summer and autumn).
The poor models average and the observed pattern were hardly correlated in NH in winter and spring (CC < 0.1, Figure 6b,d). They were weakly correlated in summer and autumn (CC = 0.2); however, the magnitudes of the precipitation anomalies in poor models averages were weaker than observations (Figure 6f,h).

Regressions of SSTA

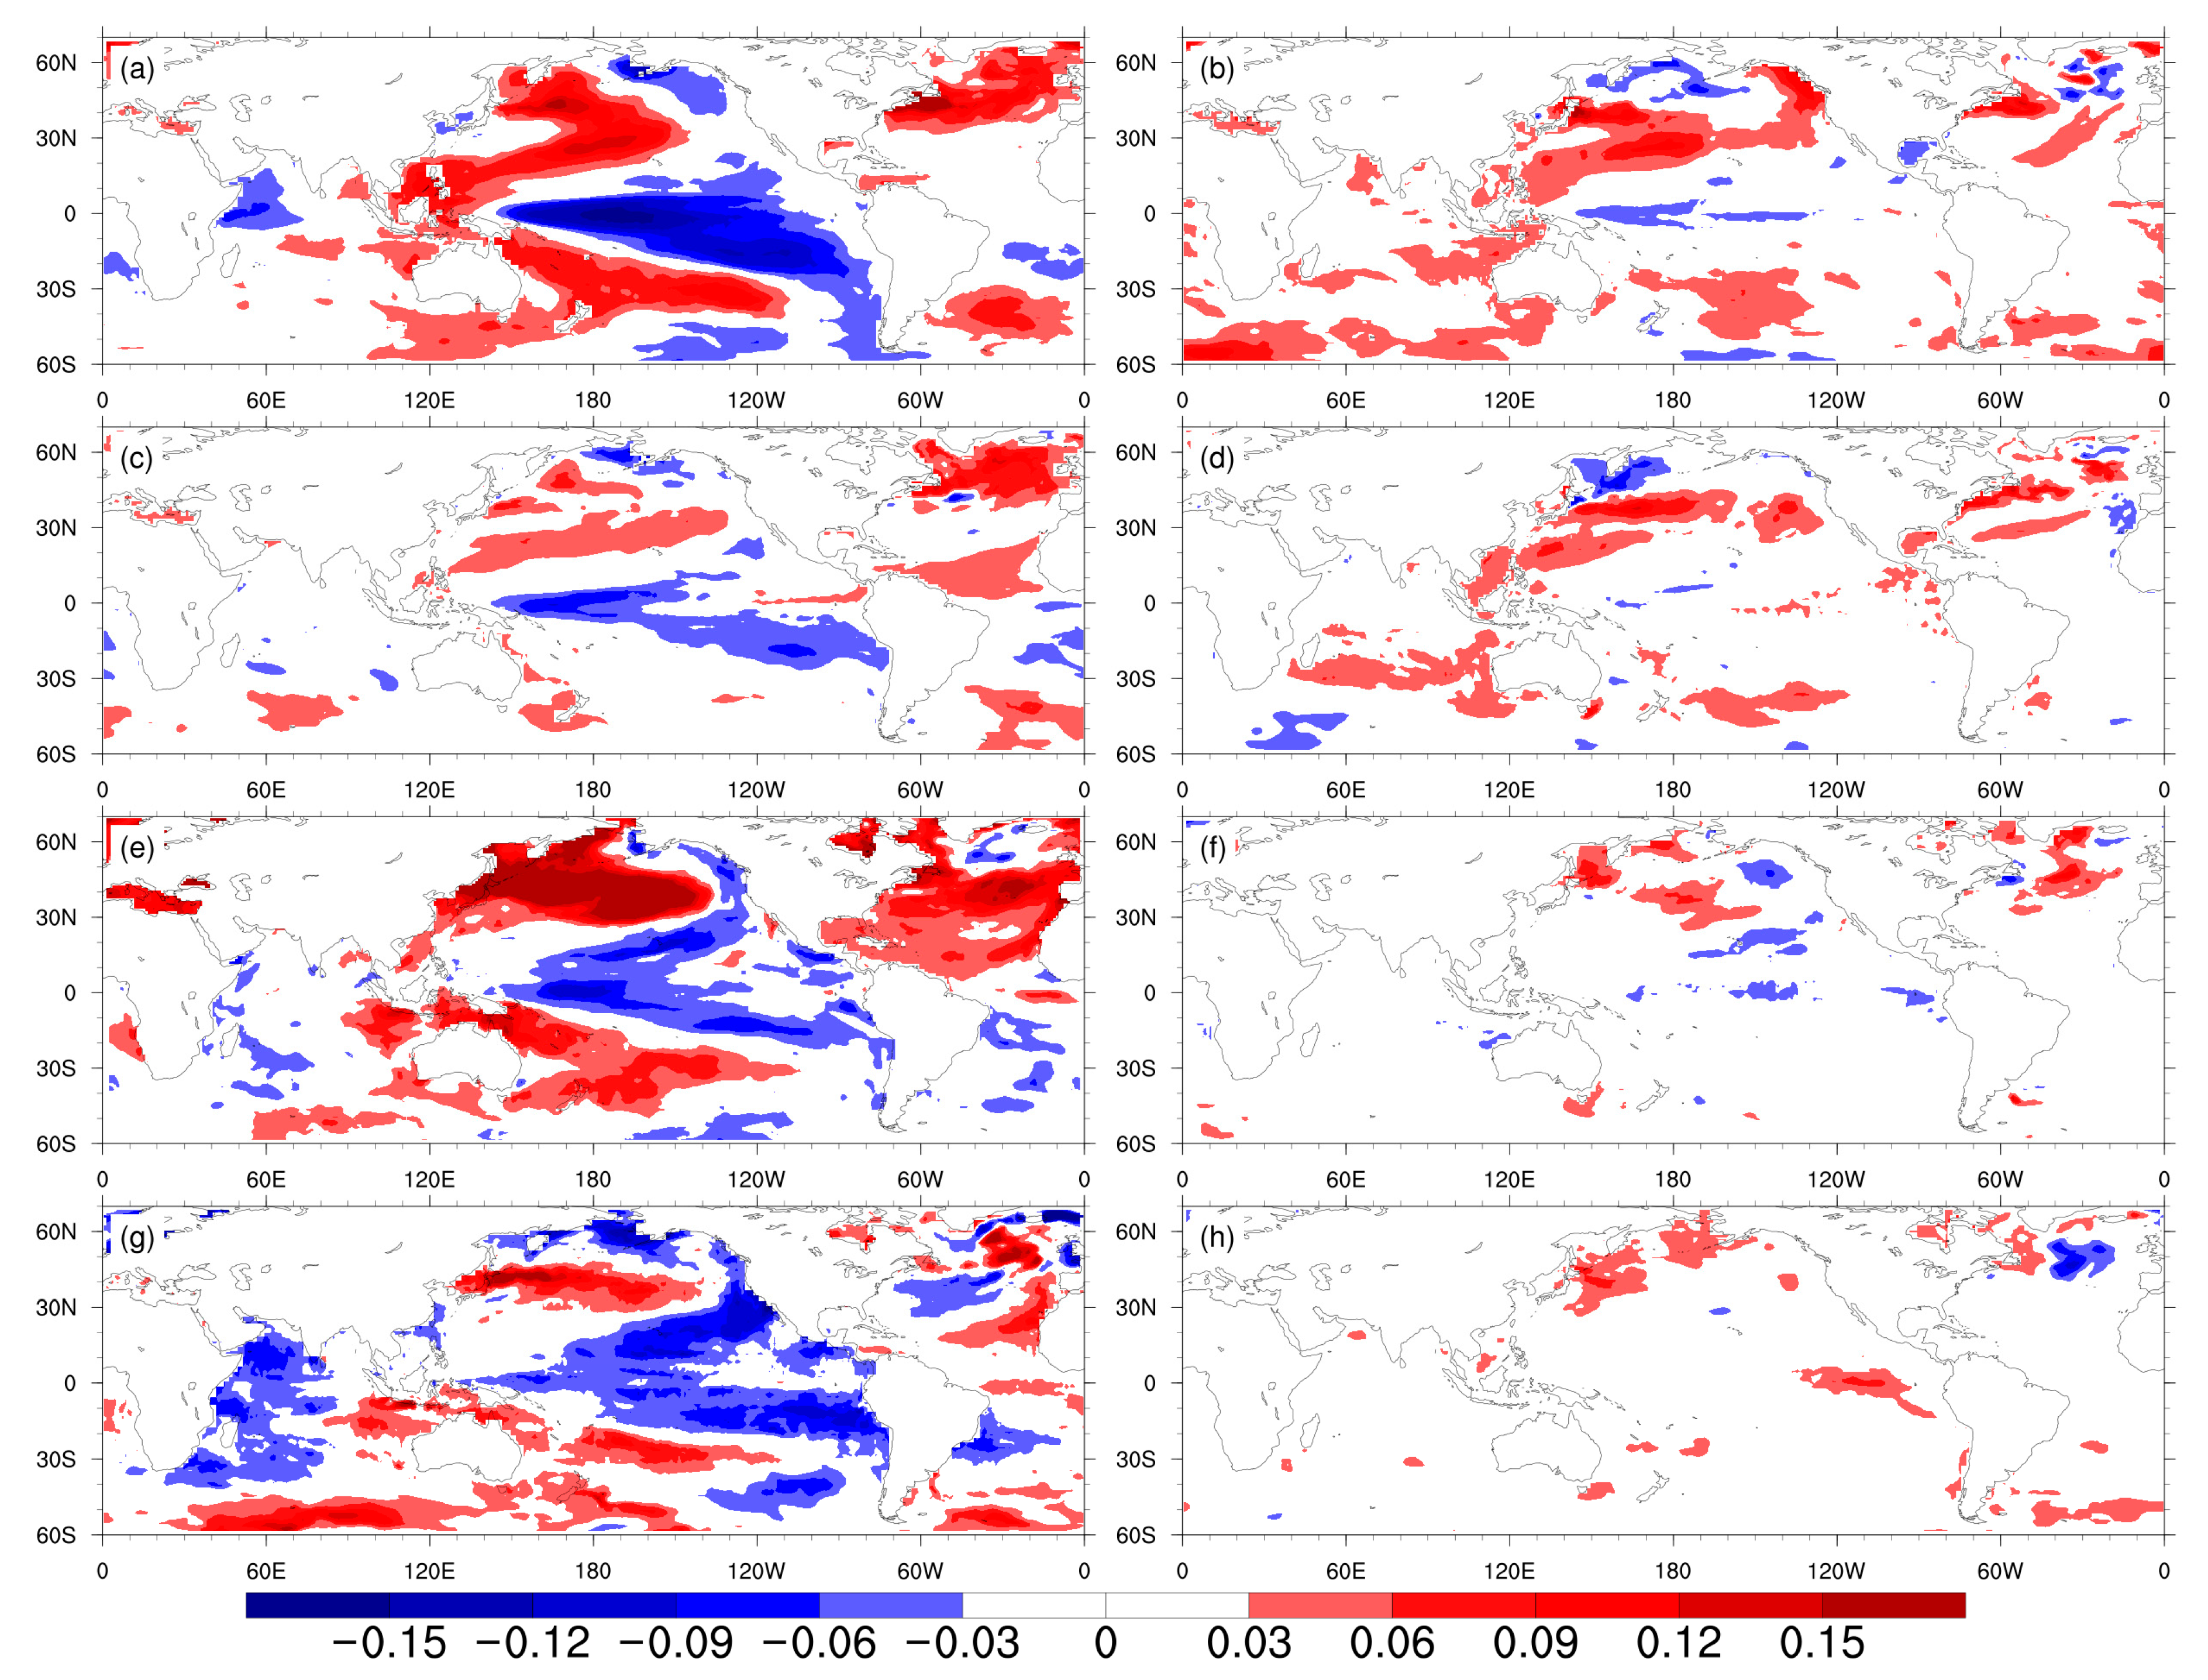
The averages of regressions of SSTA from good models and poor models were also examined (Figure 7). The good models averages captured the observed AMO pattern in winter, spring, and summer, but not in autumn (Figure 7a,c,e,g). They also captured the observed IPO pattern in winter and spring. Unlike the observation, the signal in the Pacific was still very strong in summer and autumn in good models averages, which could partially account for the smaller correlation of the leading mode of DMVLP between the good models average and observation in summer and autumn than in winter and spring. The poor models averages did not capture the oceanic multidecadal modes (Figure 7b,d,f,h), suggesting that the connection between the IPO/AMO and the DMVLP should be rather weak in the poor models.

6. Summary and Discussion

6.1. Summary

Using EEMD to extract the decadal-to-multidecadal variability of land precipitation (DMVLP) from GPCC, this study examined the spatial and temporal characteristics of the dominant mode from EOF analysis on the seasonal DMVLP in the northern hemisphere. The spatial distributions were different in the four seasons. In winter, precipitation was more than the climatology over the central North America, northern South America, and regions to the north of Mediterranean Sea, and was less over southern U.S., central and western Russia, Arabian Peninsula, and southern China. In spring, there were significant positive anomalies over the northern South America, western Russia, and Indo-China Peninsula, and significant negative anomalies over the southwestern North America, Arabian Peninsula, Iran Plateau, and southeastern China. In summer, significant positive anomalies were found over the southern North Africa, western Europe, India, eastern Russia, and northern China; and significant negative anomalies appeared in the central and southern North America and western Russia. In autumn, precipitation was larger than climatology over Europe, southern North Africa, and India, and smaller over the western North America, southeastern Greenland, and eastern China. The temporal evolutions were similar in winter and spring, with amplitude increasing after the late 1970s, which was probably related to the phase shift of IPO and AMO. In summer and autumn, IPO changed and disappeared, leaving AMO as the only signal that affected the leading DMVLP. The amplitude did not display similar variations as in winter and spring.
There were differences among the coupled models from CMIP6 historical simulations in capturing the observed DMVLP in light of both spatial and temporal correlations. The good models average largely captured the spatial structure of the leading EOF mode in the four seasons, and its correlation with the observation was larger than any single model. The associated oceanic signals, IPO and AMO, were simulated in winter and spring by the good models average. However, the IPO persisted in summer and autumn in good models averages, probably responsible for a weaker correlation between the good models average and the observation in summer and autumn. The poor models average was hardly correlated with observation in winter and spring, and weakly correlated in summer and autumn. The IPO and AMO were not connected with the leading DMVLP in poor models.

6.2. Discussion

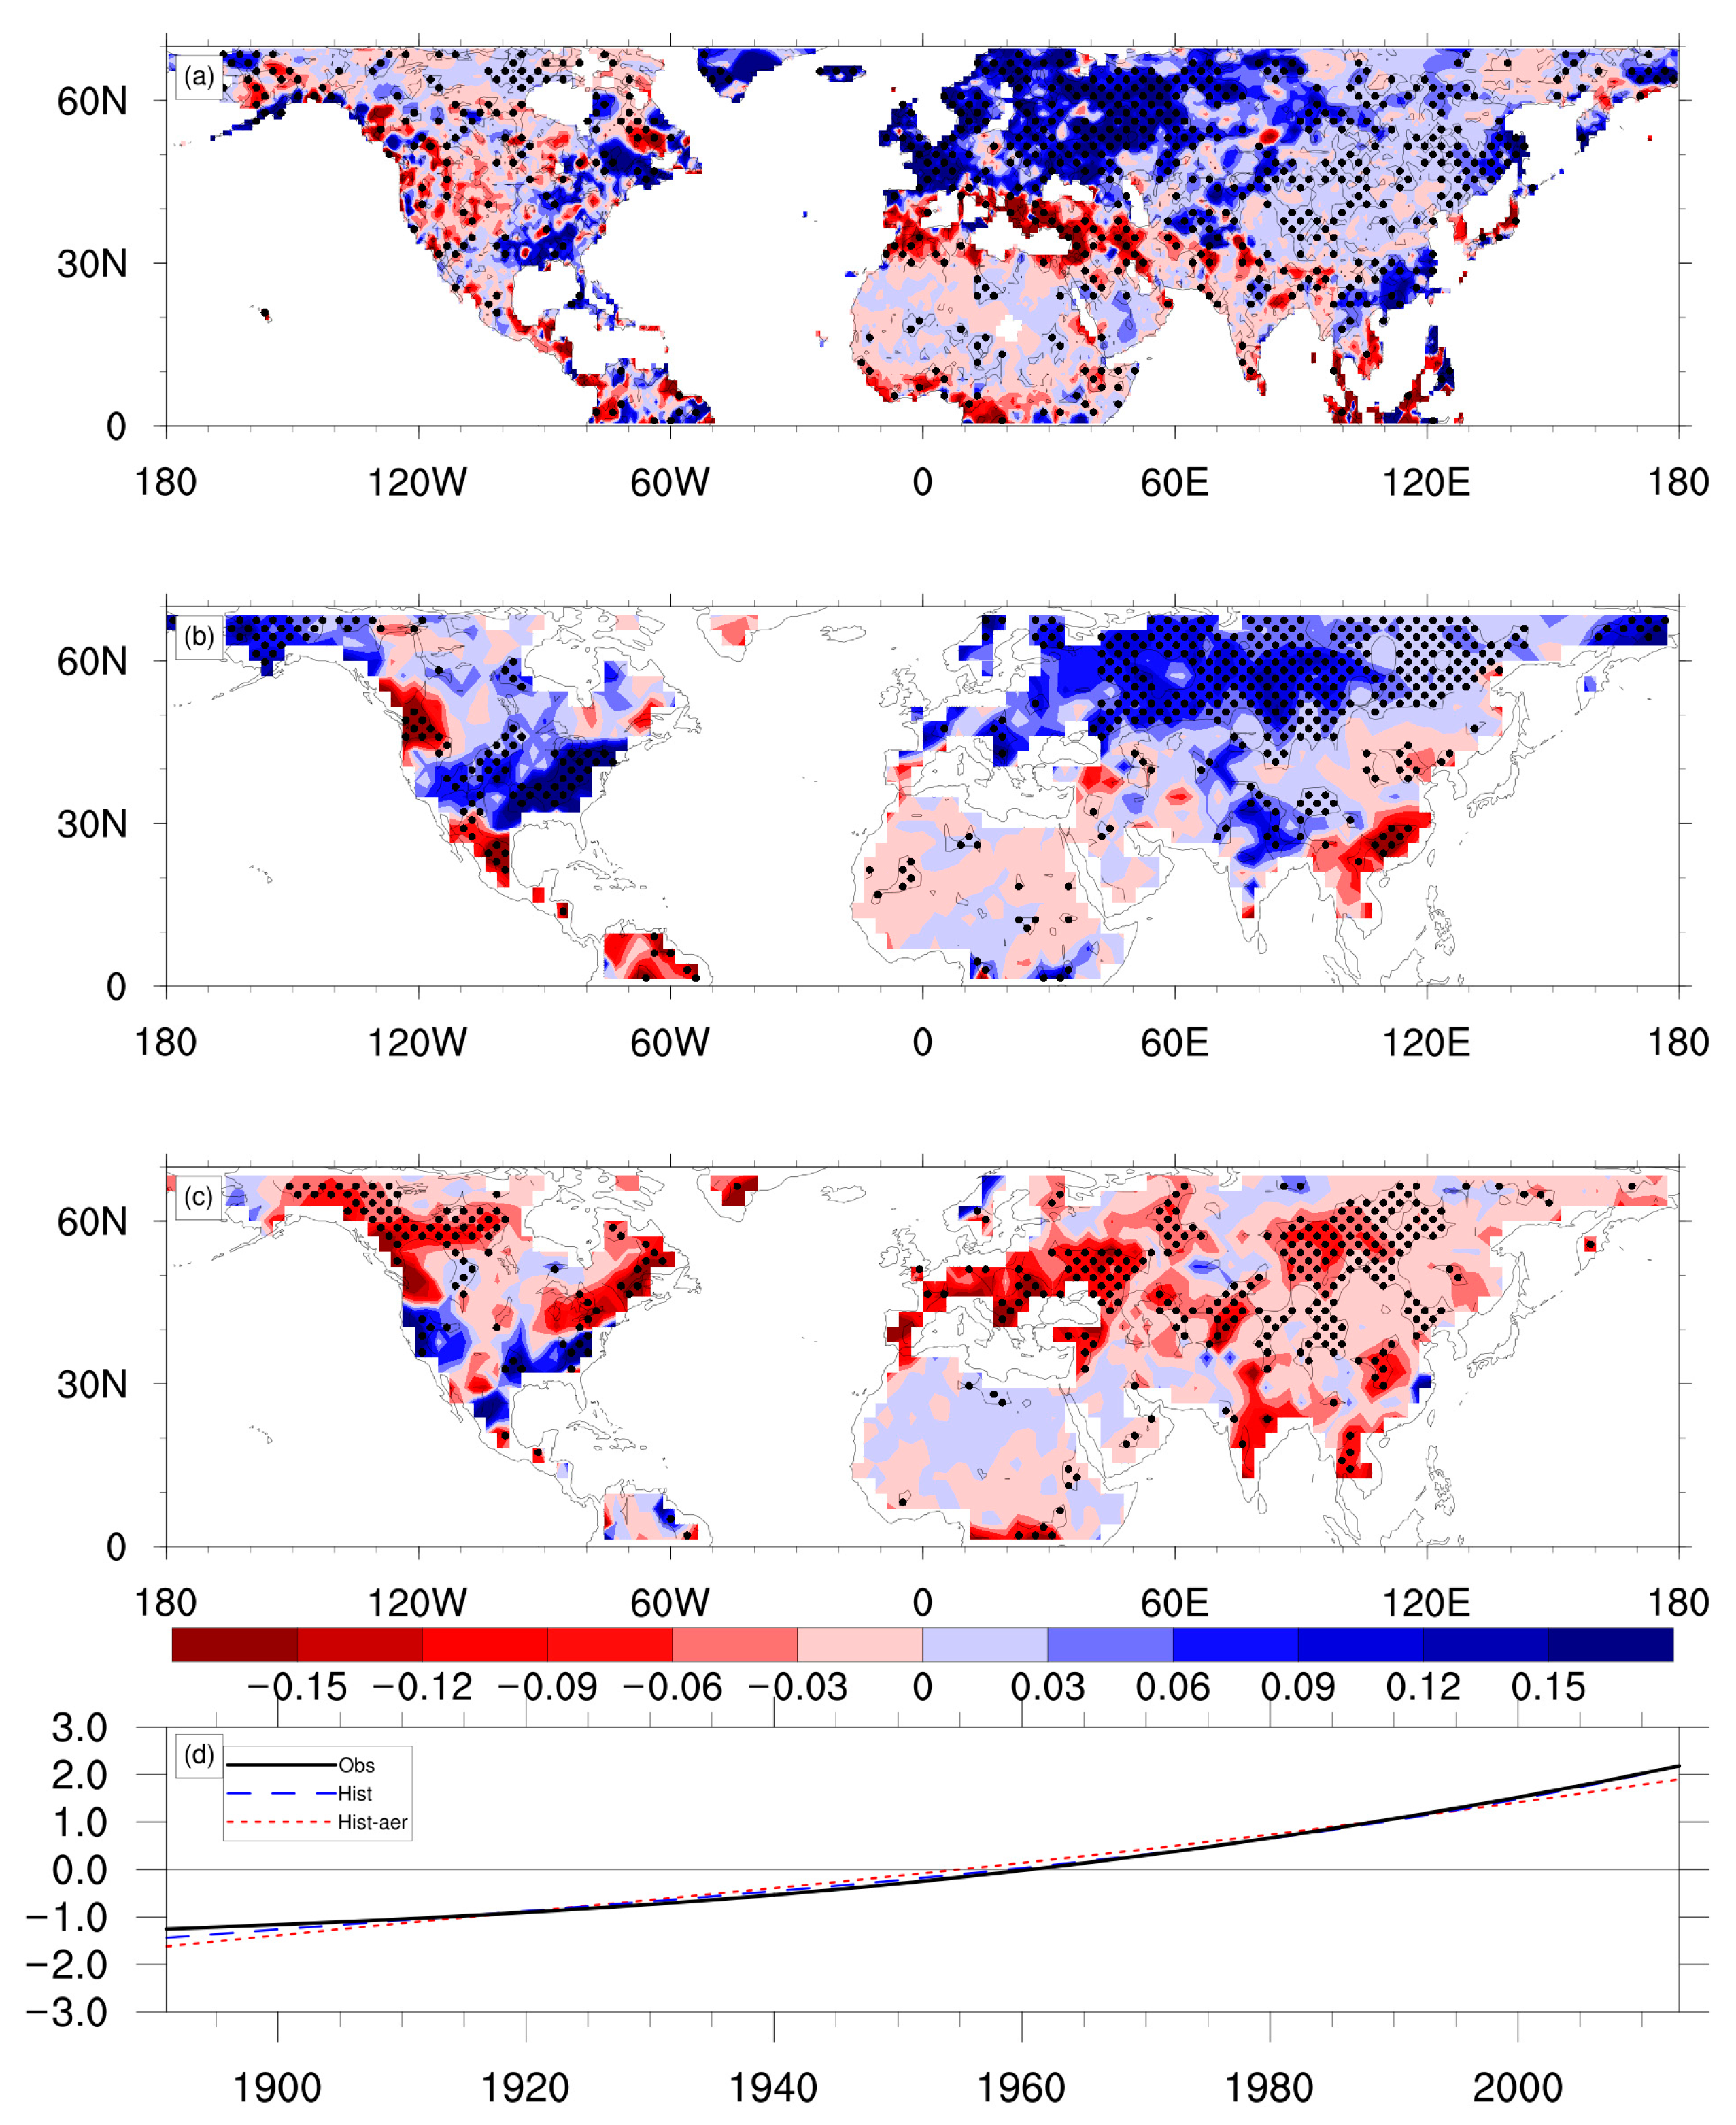
Recent studies showed that the atmosphere–ocean interactions related to multidecadal variability in an ocean basin could favor the variability in another ocean basin (called “trans-basin interactions”), in particular the Atlantic Ocean played an active role in low frequency variability in the Pacific and in the recent global warming hiatus [51,52]. AMO also accounted for the enhanced global monsoon circulation and precipitation via trans-basin interaction [53]. Smith et al. pointed out that historical anthropogenic aerosols might be the key for the negative PDO phase during global warming hiatus and resultant global-scale atmospheric circulation [54]. In the current work, besides the DMVLP that is considered as intrinsically generated variability, we also examined the externally forced variability of land precipitation in observation and CMIP6 models. In observation, the dominant mode of the externally forced land precipitation in winter shows a significant increasing trend and significant positive anomalies over the majority of Eurasian continent (Figure 8a,d). The associated oceanic signal was a global warming pattern (figure not shown).
In response to external all-forcings, the wintertime land precipitation in a CMIP6 model displays a similar increasing trend. The spatial pattern resembled the observation in many regions, especially in mid and high latitude Eurasian continent (Figure 8b,d). In response to anthropogenic aerosol forcing, the wintertime land precipitation from the same model also shows a significant increasing trend, but the spatial pattern was opposite in sign, indicating that the anthropogenic aerosol forcing mainly induces the precipitation to decrease over most of NH (Figure 8c,d).

Author Contributions

Conceptualization, Formal analysis, Funding acquisition, Methodology, Writing-original draft, H.C.; Data curation, Visualization, Z.X. All authors have read and agreed to the published version of the manuscript.

Funding

This research was funded by the National Key R&D Program of China (2016YFA0600402).

Acknowledgments

The authors are grateful to three anonymous reviewers for their constructive comments. GPCC Precipitation data are provided by the NOAA/OAR/ESRL PSD from their Web site at https://www.esrl.noaa.gov/psd/. CMIP6 model output are downloaded from the website of World Climate Research Program and we thank the climate modeling groups for providing the data.

Conflicts of Interest

The authors declare no conflict of interest.

References

  1. Nicholson, S.E.; Tucker, C.J.; Ba, M.B. Desertification, drought, and surface vegetation: An example from the West African Sahel. Bull. Am. Meteorol. Soc. 1998, 79, 815–829. [Google Scholar] [CrossRef]
  2. Dai, A.; Trenberth, K.E.; Qian, T. A global dataset of palmer drought severity index for 1870–2002: Relationship with soil moisture and effects of surface warming. J. Hydrometeorol. 2004, 5, 1117–1130. [Google Scholar] [CrossRef]
  3. Shi, N.; Chen, L.; Fen, G.; Gao, H.; Ling, Z.; Guo, L. Climate characters and change in global land precipitation field from 1920 to 2000. Plateau Meteorol. 2004, 23, 435–443. [Google Scholar]
  4. Wang, B.; Ding, Q. Changes in global monsoon precipitation over the past 56 years. Geophys. Res. Lett. 2006, 33, 272–288. [Google Scholar] [CrossRef] [Green Version]
  5. Ma, Z.; Fu, C. Global aridification in the second half of the 20th century and its relationship to large-scale climate background. Sci. China Ser. D Earth Sci. 2007, 50, 776–788. [Google Scholar] [CrossRef]
  6. Narisma, G.T.; Foley, J.A.; Licker, R.; Ramankutty, N. Abrupt changes in rainfall during the twentieth century. Geophys. Res. Lett. 2007, 34, L06710. [Google Scholar] [CrossRef]
  7. Trenberth, K.E. Changes in precipitation with climate change. Clim. Res. 2011, 47, 123–138. [Google Scholar] [CrossRef] [Green Version]
  8. Haren, R.V.; Oldenborgh, G.J.V.; Lenderink, G.; Collins, M.; Hazeleger, W. SST and circulation trend biases cause an underestimation of European precipitation trends. Clim. Dyn. 2013, 40, 1–20. [Google Scholar] [CrossRef]
  9. Wen, G.; Huang, G.; Hu, K.; Qu, X.; Tao, W.; Gong, H. Changes in the characteristics of precipitation over northern Eurasia. Theor. Appl. Clim. 2015, 119, 653–665. [Google Scholar] [CrossRef]
  10. Gu, G.; Adler, R.F.; Huffman, G.J. Long-term changes/trends in surface temperature and precipitation during the satellite era (1979–2012). Clim. Dyn. 2016, 46, 1091–1105. [Google Scholar] [CrossRef]
  11. Kunkel, K.E.; Andsager, K.; Easterling, D.R. Long-term trends in extreme precipitation events over the conterminous United States and Canada. J. Clim. 1999, 12, 2515–2527. [Google Scholar] [CrossRef] [Green Version]
  12. Xu, B.; Yang, Q.; Ma, Z. Decadal characteristics of global land annual precipitation variation on multiple spatial scales. Chin. J. Atmos. Sci. 2017, 41, 593–602. [Google Scholar]
  13. Mauget, S.A. Intra-to Multidecadal Climate Variability over the Continental United States: 1932–1999. J. Clim. 2003, 16, 2215–2231. [Google Scholar] [CrossRef]
  14. Ault, T.R.; George, S.S. The magnitude of decadal and multidecadal variability in North American precipitation. J. Clim. 2010, 23, 842–850. [Google Scholar] [CrossRef]
  15. Dieppois, B.; Pohl, B.; Rouault, M.; New, M.; Lawler, D.; Keenlyside, N. Interannual to interdecadal variability of winter and summer southern African rainfall, and their teleconnections. J. Geophys. Res. 2016, 121, 6215–6239. [Google Scholar] [CrossRef] [Green Version]
  16. Fu, C.; Jiang, Z.; Guan, Z.; He, J.; Guo, W. Regional Climate Studies of China; Springer: Berlin/Heidelberg, Germany, 2008. [Google Scholar]
  17. Hu, P.; Qiao, S.; Feng, G. Interdecadal variation of precipitation pattern and preliminary studies during the summer of late-1990s in East Asia. Acta Phys. Sin. 2014, 63, 209204. [Google Scholar]
  18. Zhang, R.; Delworth, T.L. Impact of Atlantic Multidecadal Oscillations on India/Sahel Rainfall and Atlantic Hurricanes. Geophys. Res. Lett. 2006, 33, L17712. [Google Scholar] [CrossRef] [Green Version]
  19. Wang, B.; Liu, J.; Kim, H.-J.; Webster, P.J.; Yim, S.-Y. Recent changes of the global monsoon precipitation (1979–2008). Clim. Dyn. 2012, 39, 1123–1135. [Google Scholar] [CrossRef] [Green Version]
  20. Wang, B.; Liu, J.; Kim, H.-J.; Webster, P.J.; Yim, S.-Y.; Xiang, B. Northern Hemisphere summer monsoon intensified by mega-El Niño/Southern Oscillation and Atlantic multidecadal oscillation. Proc. Natl. Acad. Sci. USA 2013, 110, 4347–5352. [Google Scholar] [CrossRef] [Green Version]
  21. Zhang, Z.; Sun, X.; Yang, X. Understanding the interdecadal variability of East Asian summer monsoon precipitation: Joint influence of three oceanic signals. J. Clim. 2018, 31, 5485–5506. [Google Scholar] [CrossRef]
  22. Zhu, Z.; Li, T. Amplified contiguous United States summer rainfall variability induced by East Asian monsoon interdecadal change. Clim. Dyn. 2018, 50, 3523–3536. [Google Scholar] [CrossRef]
  23. Dai, A. The influence of the inter-decadal Pacific oscillation on US precipitation during 1923–2010. Clim. Dyn. 2013, 41, 633–646. [Google Scholar] [CrossRef] [Green Version]
  24. Dong, B.; Dai, A. The influence of the interdecadal Pacific oscillation on temperature and precipitation over the globe. Clim. Dyn. 2015, 45, 2667–2681. [Google Scholar] [CrossRef]
  25. Qian, C.; Zhou, T. Multidecadal variability of North China aridity and its relationship to PDO during 1900–2010. J. Clim. 2013, 27, 1210–1222. [Google Scholar] [CrossRef] [Green Version]
  26. Xu, Y.; Hu, A. How would the twenty-first-century warming influence Pacific decadal variability and its connection to North American rainfall: Assessment based on a revised procedure for the IPO/PDO. J. Clim. 2018, 31, 1547–1563. [Google Scholar] [CrossRef]
  27. Enfield, D.B.; Mestas-Nunes, A.M.; Trimble, P.J. The Atlantic multidecadal oscillation and its relation to rainfall and river flows in the continental U.S. Geophys. Res. Lett. 2001, 28, 2077–2080. [Google Scholar] [CrossRef] [Green Version]
  28. Wang, H.; Fu, R.; Kumar, A.; Li, W. Intensification of summer rainfall variability in the Southeastern United States during recent decades. J. Hydrometeorol. 2010, 11, 1007–1018. [Google Scholar] [CrossRef]
  29. Hu, Q.; Feng, S.; Oglesby, R.J. Variations in North American summer precipitation driven by the Atlantic Multidecadal Oscillation. J. Clim. 2011, 24, 5555–5570. [Google Scholar] [CrossRef] [Green Version]
  30. Goswami, B.N.; Madhusoodanan, M.S.; Neema, C.P.; Sengupta, D. A Physical Mechanism for North Atlantic SST Influence on the Indian Summer Monsoon. Geophys. Res. Lett. 2006, 33, L02706. [Google Scholar] [CrossRef] [Green Version]
  31. Sun, C.; Li, J.; Zhao, S. Remote influence of Atlantic multidecadal variability on Siberian warm season precipitation. Sci. Rep. 2015, 5, 16853. [Google Scholar] [CrossRef] [Green Version]
  32. Gu, G.; Adler, R.F. Spatial patterns of global precipitation change and variability during 1901–2010. J. Clim. 2015, 28, 4431–4453. [Google Scholar] [CrossRef]
  33. Luo, F.F.; Li, S.; Furevik, T. Weaker connection between the Atlantic Multidecadal Oscillation and Indian summer rainfall since the mid-1990s. Atmos. Ocean. Sci. Lett. 2018, 11, 37–43. [Google Scholar] [CrossRef] [Green Version]
  34. Kumar, S.; Merwade, V.; Kinter, J.L.; Niyogi, D. Evaluation of temperature and precipitation trends and long-term persistence in CMIP5 twentieth-century climate simulations. J. Clim. 2013, 26, 4168–4185. [Google Scholar] [CrossRef]
  35. Purich, A.; Cowan, T.; Min, S.K.; Cai, W. Autumn Precipitation trends over southern hemisphere midlatitudes as simulated by CMIP5 models. J. Clim. 2013, 26, 8341–8356. [Google Scholar] [CrossRef]
  36. Ren, L.; Arkin, P.; Smith, T.M.; Shen, S.S.P. Global precipitation trends in 1900–2005 from a reconstruction and coupled model simulations. J. Geophys. Res. 2013, 118, 1679–1689. [Google Scholar] [CrossRef]
  37. Ault, T.R.; Cole, J.E.; George, S.S. The amplitude of decadal to multidecadal variability in precipitation simulated by state-of-the-art climate models. Geophys. Res. Lett. 2012, 39, L21705. [Google Scholar] [CrossRef]
  38. Gaetani, M.; Mohino, E. Decadal prediction of the Sahelian precipitation in CMIP5 simulations. J. Clim. 2013, 26, 7708–7719. [Google Scholar] [CrossRef]
  39. Hirota, N.; Takayabu, Y.N.; Hamada, A. Reproducibility of summer precipitation over northern Eurasia in CMIP5 multiclimate models. J. Clim. 2016, 29, 3317–3337. [Google Scholar] [CrossRef] [Green Version]
  40. Lyu, K.; Yu, J.Y. Climate impacts of the Atlantic Multidecadal Oscillation simulated in the CMIP5 models: A re-evaluation based on a revised index. Geophys. Res. Lett. 2017, 44, 3867–3876. [Google Scholar] [CrossRef]
  41. Joshi, M.K.; Kucharski, F. Impact of Interdecadal Pacific Oscillation on Indian summer monsoon rainfall: An assessment from CMIP5 climate models. Clim. Dyn. 2017, 48, 2375–2391. [Google Scholar] [CrossRef]
  42. Eyring, V.; Bony, S.; Meehl, G.A.; Senior, C.A.; Stevens, B.; Stouffer, R.J.; Taylor, K.E. Overview of the Coupled Model Intercomparison Project Phase 6 (CMIP6) experimental design and organization. Geosci. Model Dev. 2016, 9, 1937–1958. [Google Scholar] [CrossRef] [Green Version]
  43. Rayner, N.A.; Parker, D.E.; Horton, E.B.; Folland, C.K.; Alexander, L.V.; Rowell, D.P. Global analyses of sea surface temperature, sea ice, and night marine air temperature since the late nineteenth century. J. Geophys. Res. 2003, 108, 1063–1082. [Google Scholar] [CrossRef]
  44. Schneider, U.; Becker, A.; Finger, P.; Meyer-Christoffer, A.; Ziese, M. GPCC Full Data Monthly Product Version 2018 at 1.0°: Monthly Land-Surface Precipitation from Rain-Gauges Built on GTS-Based and Historic Data; Global Precipitation Climatology Centre: Berlin, Germany, 2018. [Google Scholar] [CrossRef]
  45. Wu, Z.; Huang, N.E. Ensemble empirical mode decomposition: A noise-assisted data analysis method. Adv. Adapt. Data Anal. 2009, 1, 1–41. [Google Scholar] [CrossRef]
  46. Bretherton, C.S.; Widmann, M.; Dymnikov, V.P.; Wallace, J.M.; Bladé, I. The effective number of spatial degrees of freedom of a time-varying field. J. Clim. 1999, 12, 1990–2009. [Google Scholar] [CrossRef]
  47. Trenberth, K.E. Recent observed interdecadal climate changes in the northern hemisphere. Bull. Am. Meteorol. Soc. 1990, 71, 988–993. [Google Scholar] [CrossRef] [Green Version]
  48. Huang, H.P.; Seager, R.; Kushnir, Y. The 1976/77 transition in precipitation over the Americas and the influence of tropical sea surface temperature. Clim. Dyn. 2005, 24, 721–740. [Google Scholar] [CrossRef]
  49. McCabe, G.J.; Palecki, M.A.; Betancourt, J.L. Pacific and Atlantic Ocean influences on multidecadal drought frequency in the United States. Proc. Natl. Acad. Sci. USA 2004, 101, 4136–4141. [Google Scholar] [CrossRef] [Green Version]
  50. Si, D.; Ding, Y. Oceanic forcings of the interdecadal variability in East Asian summer rainfall. J. Clim. 2016, 29, 7633–7649. [Google Scholar] [CrossRef]
  51. Chikamoto, Y.; Timmermann, A.; Luo, J.; Mochizuki, T.; Kimoto, M.; Watanabe, M.; Ishii, M.; Xie, S.-P.; Jin, F.-F. Skilful multi-year predictions of tropical trans-basin climate variability. Nat. Commun. 2015, 6, 6869. [Google Scholar] [CrossRef] [Green Version]
  52. Li, X.; Xie, S.-P.; Gille, S.T.; Yoo, C. Atlantic-induced pan-tropical climate change over the past three-decades. Nat. Clim. Chang. 2016, 6, 275–279. [Google Scholar] [CrossRef]
  53. Kamae, Y.; Li, X.; Xie, S.-P.; Ueda, H. Atlantic effects on recent decadal trends in global monsoon. Clim. Dyn. 2017, 49, 3443–3455. [Google Scholar] [CrossRef] [Green Version]
  54. Smith, D.M.; Booth, B.B.B.; Dunstone, N.J.; Eade, R.; Hermanson, L.; Jones, G.S.; Scaife, A.A.; Sheen, K.L.; Thompson, V. Role of volcanic and anthropogenic aerosols in recent global surface warming slowdown. Nat. Clim. Chang. 2016, 6, 936–940. [Google Scholar] [CrossRef]
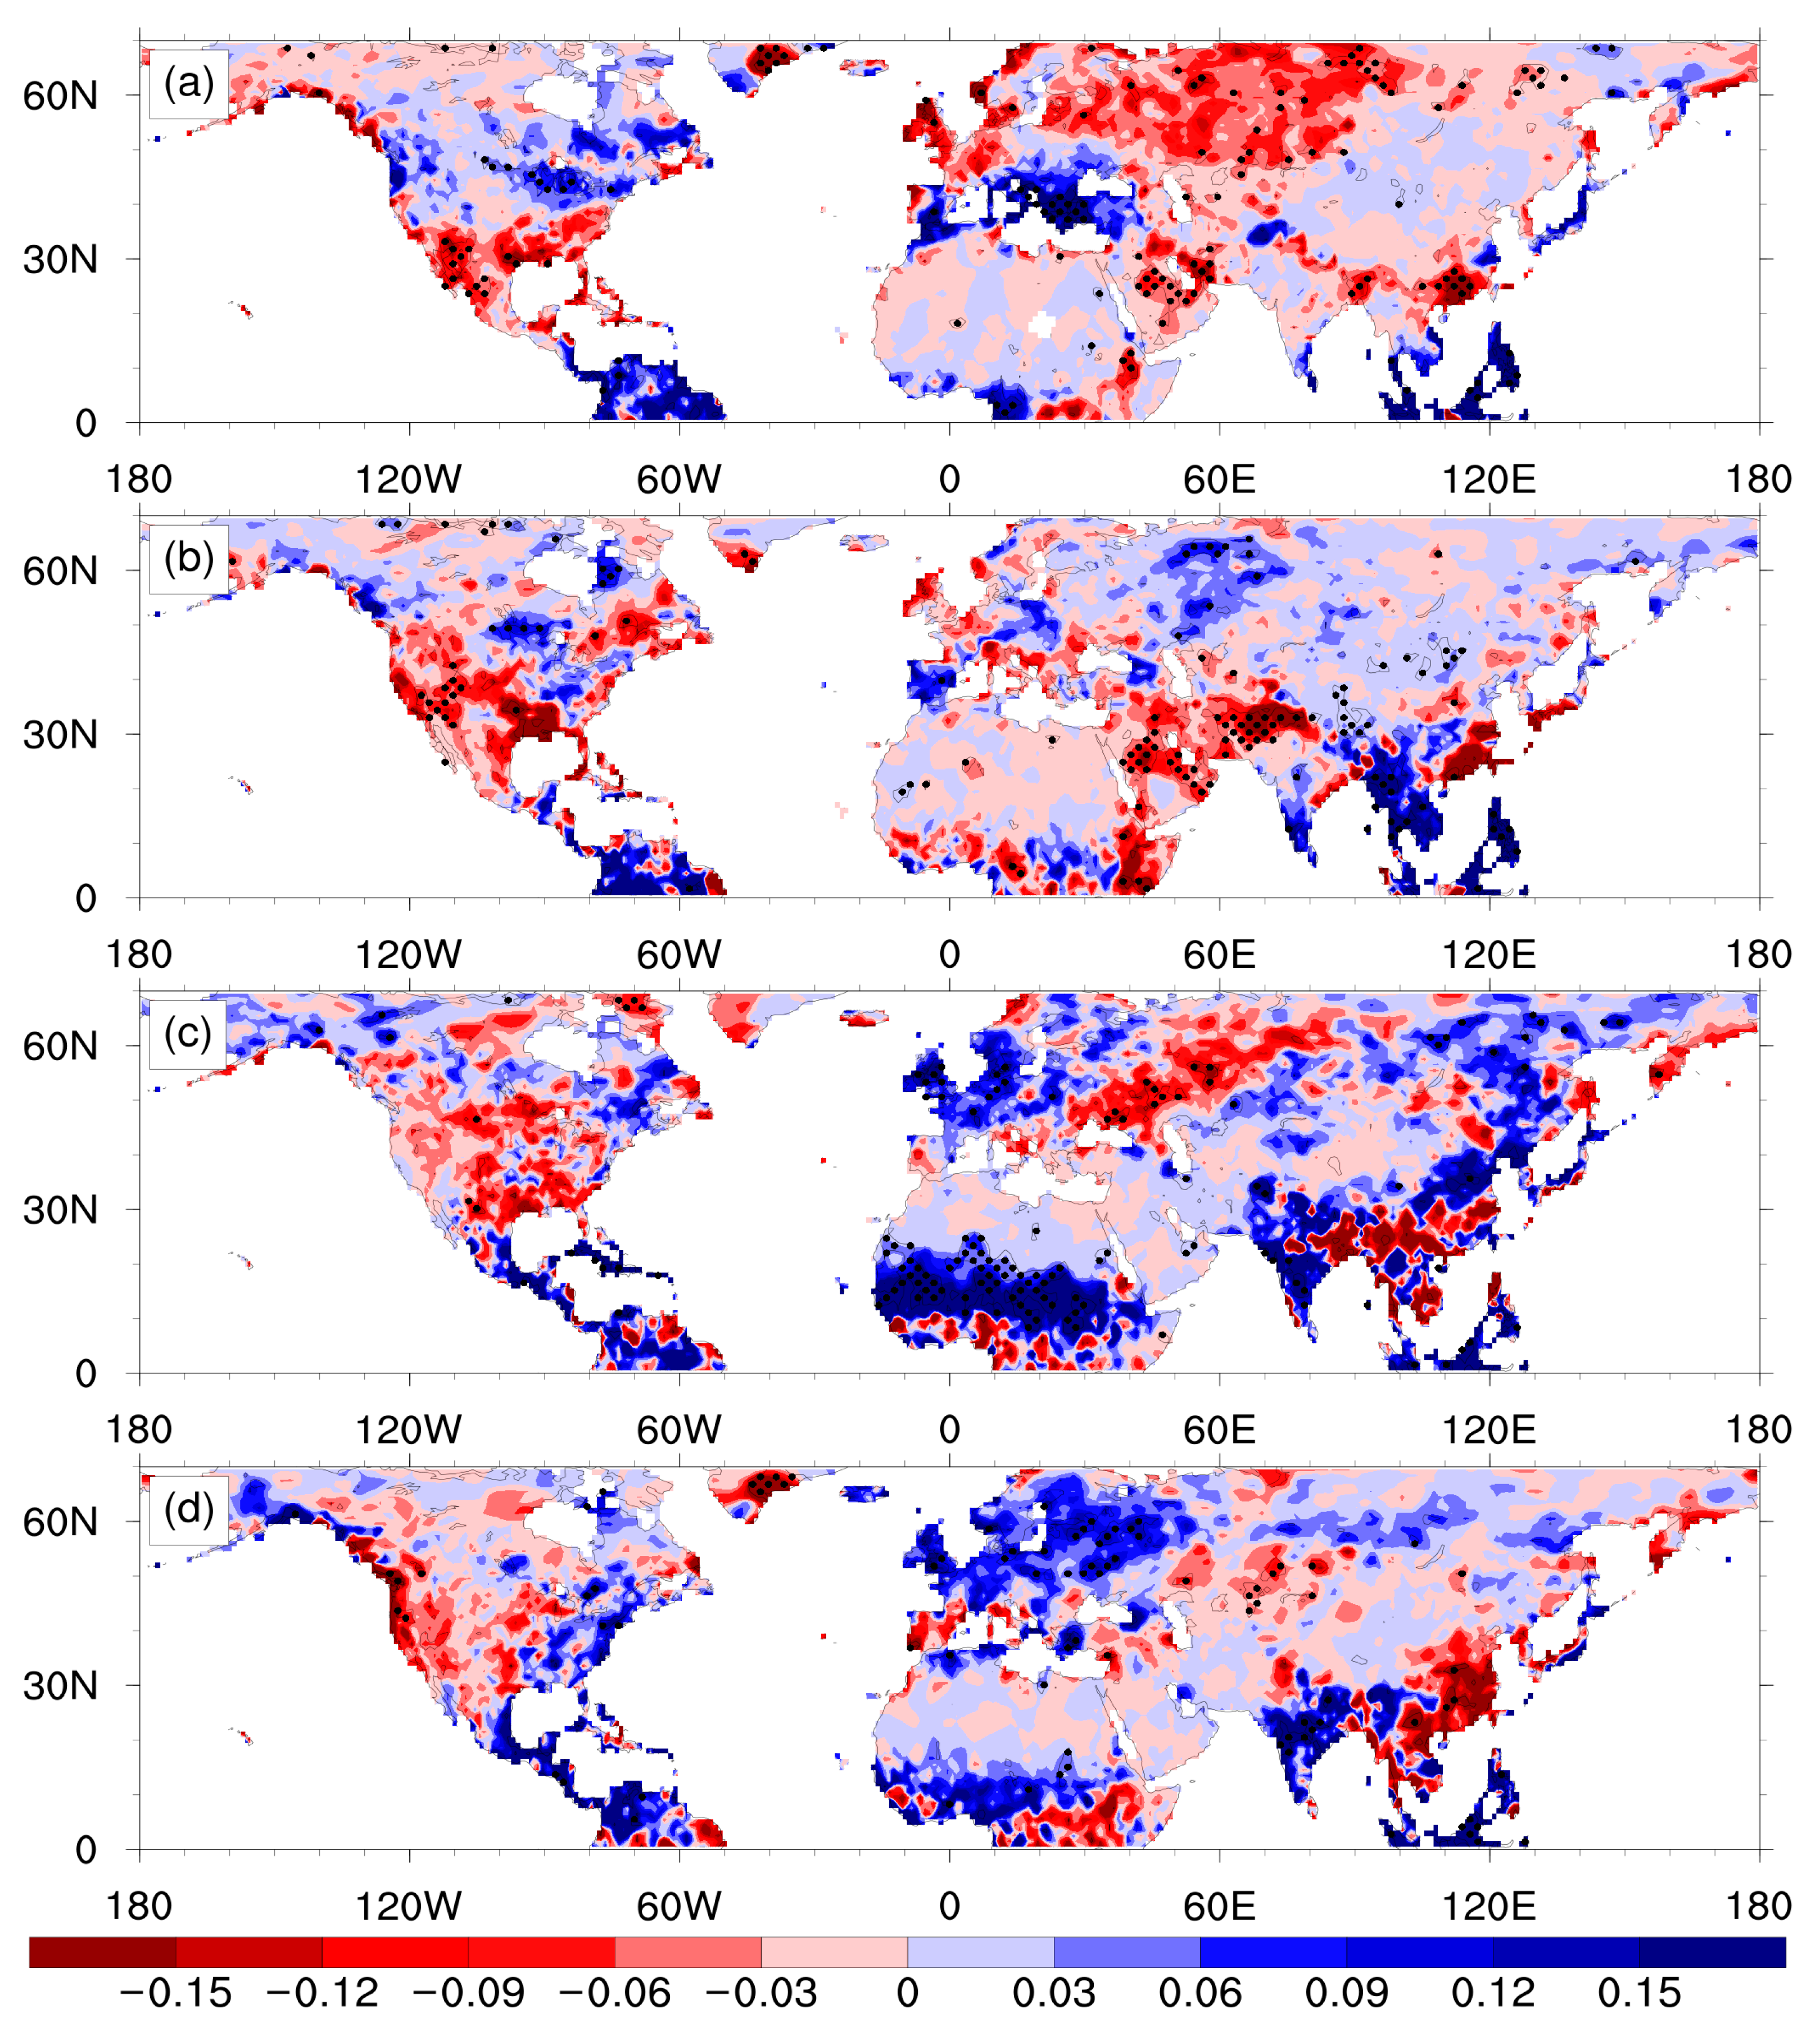
Figure 1. Spatial distributions of the leading empirical orthogonal function (EOF) of the decadal-to-multidecadal variability of land precipitation from the Global Precipitation Climatology Centre (GPCC) in the northern hemisphere in (a) winter, (b) spring, (c) summer, and (d) autumn. Dotted regions indicate exceeding 95% significance t-test. Unit: mm/day.
Atmosphere 11 00195 g001
Figure 2. The normalized first principle component of the decadal-to-multidecadal variability of land precipitation from GPCC in the northern hemisphere in (a) winter, (b) spring, (c) summer, and (d) autumn.
Atmosphere 11 00195 g002
Figure 3. Spectrum of the first principle component of the decadal-to-multidecadal variability of land precipitation from GPCC in the northern hemisphere in (a) winter, (b) spring, (c) summer, and (d) autumn (black curves). The red solid curves are corresponding red noise spectrum, and the blue dashed curves are 5% confidence upper limit of red noise spectrum. The y-axis is power. The x-axis is period, unit: year.
Atmosphere 11 00195 g003
Figure 4. Regressions of the sea surface temperature (SST) anomalies onto the first principle component of the decadal-to-multidecadal variability of land precipitation from GPCC in the northern hemisphere in (a) winter, (b) spring, (c) summer, and (d) autumn. Regions exceeding the 95% significance t-test are dotted. Unit: degrees Celsius.
Atmosphere 11 00195 g004
Figure 5. Scatter plot of the spatial and temporal correlation coefficients between the leading EOF mode of GPCC and the leading EOF mode of each ensemble member from the coupled models in CMIP6 historical simulations. (a) Winter, (b) spring, (c) summer, and (d) autumn. Different models are indicated by different marks. The numeral beside the marks indicates the ordinal of member in the ensemble. Good models are located inside red boxes, and poor models are inside blue boxes.
Atmosphere 11 00195 g005
Figure 6. Averages of the spatial distributions of the leading EOF from (left) good models and (right) poor models in (a,b) winter, (c,d) spring, (e,f) summer, and (g,h) autumn. Unit: mm/day.
Atmosphere 11 00195 g006
Figure 7. Averages of regressions of SST anomalies onto the first principle component from (left) good models and (right) poor models in (a,b) winter, (c,d) spring, (e,f) summer, and (g,h) autumn. Unit: degrees Celsius.
Atmosphere 11 00195 g007
Figure 8. Spatial distributions of the leading EOF of the externally forced wintertime land precipitation in northern hemisphere from (a) GPCC, (b) the first member of the CanESM5 model ensemble in CMIP6 historical all-forcings simulation, and (c) the first member of the CanESM5 model ensemble in CMIP6 historical aerosol forcing experiment. Regions exceeding 95% significance t-test are dotted. Unit: mm/day. (d) The normalized first principle component. Note that the externally forced component of all ensemble members of CanESM5 had a similar feature in a single experiment, thus the result of the first member is displayed.
Atmosphere 11 00195 g008
Table 1. The coupled models from CMIP6 historical simulations.
ModelsNo. of Ensemble Members
CanESM510
CNRM-CM6-110
GISS-E2-1-G10
GISS-E2-1-H10
IPSL-CM6A-LR10
MIROC610
CESM29
CNRM-ESM2-15
UKESM1-0-LL5
BCC-CSM2-MR3
BCC-ESM13
CESM2-WACCM3