
Calcium Signaling and Molecular Adhesion Processes May Hold the Key to Genetic Risk for Autism: A Molecular Pathway Analysis on Two Independent Samples

Abstract
1. Introduction
2. Methods
2.1. Dataset
2.2. Toolset
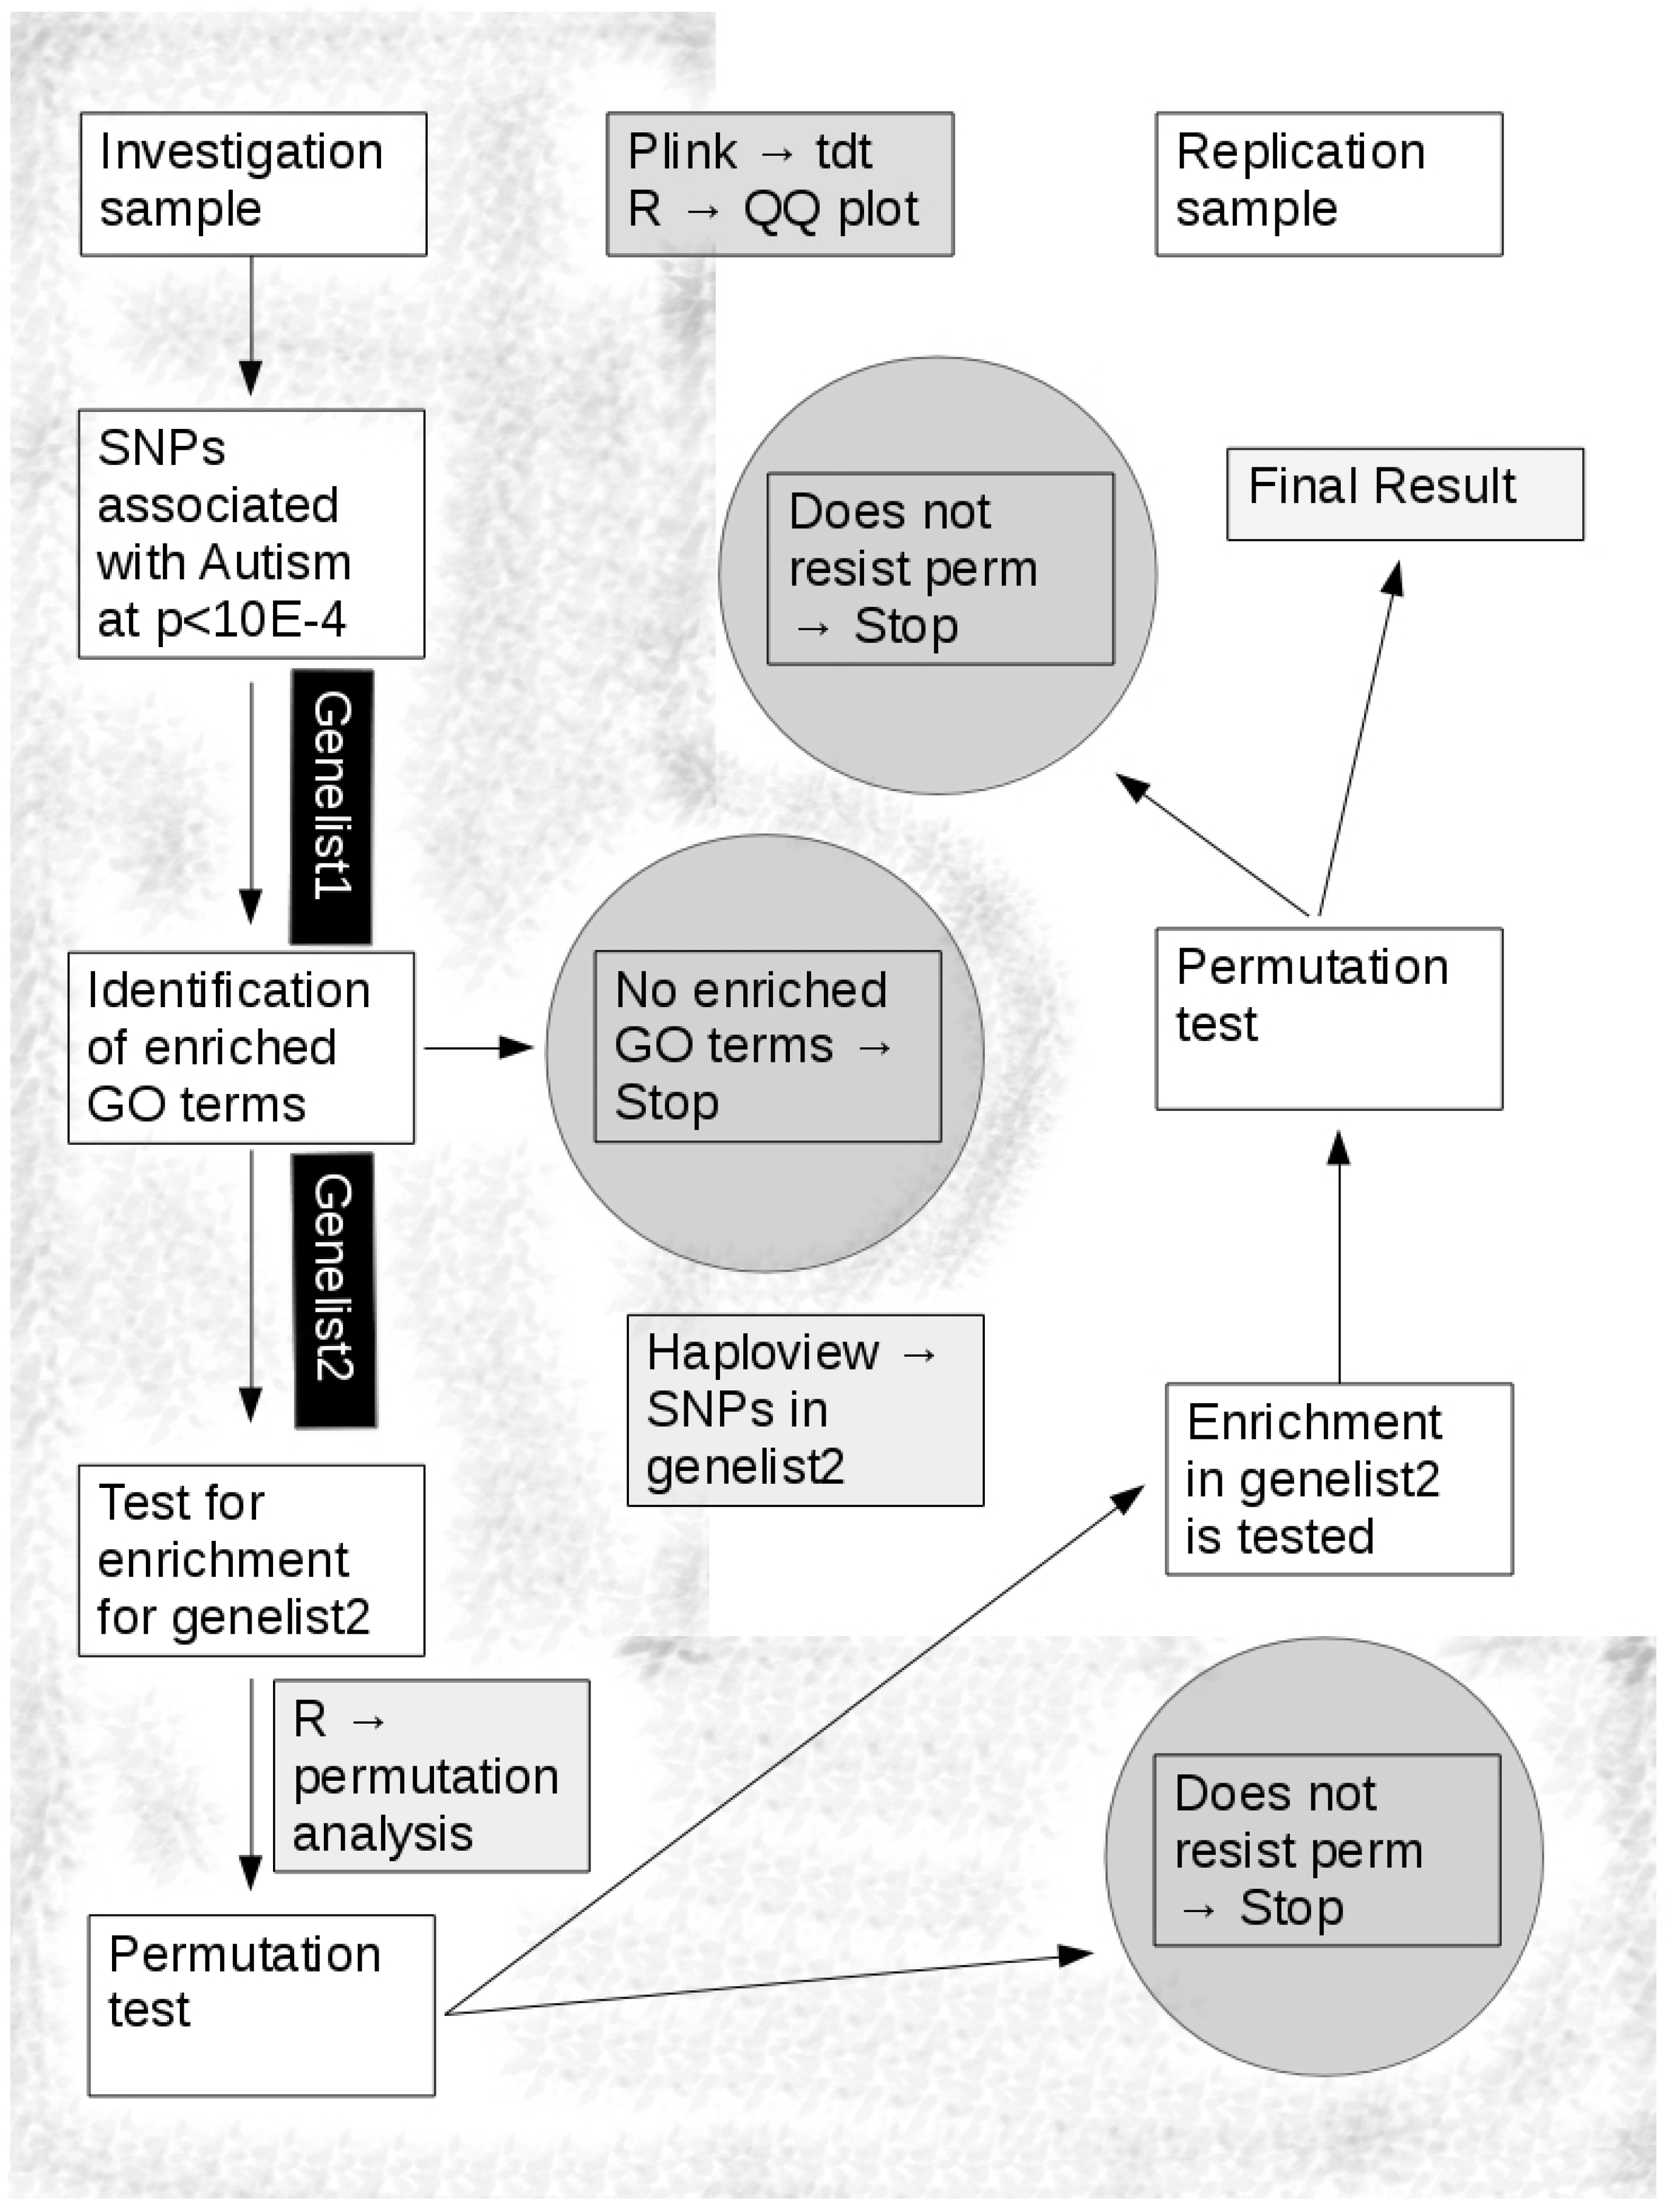
2.3. Analysis Flow
2.3.1. Investigation Sample
2.3.2. Replication Sample
2.4. Selection of Significant Thresholds
2.5. Index Pathway Definition
2.6. Simulation
- should be associated with autism at a p threshold < 0.001 in the investigation sample;
- should be available in the replication sample;
- should have the same direction of association (OR> or <1 as in the investigation sample).
2.6.1. Acceptance of H0 (Null Hypothesis)
2.6.2. Acceptance of H1 (Enrichment Hypothesis)
3. Results
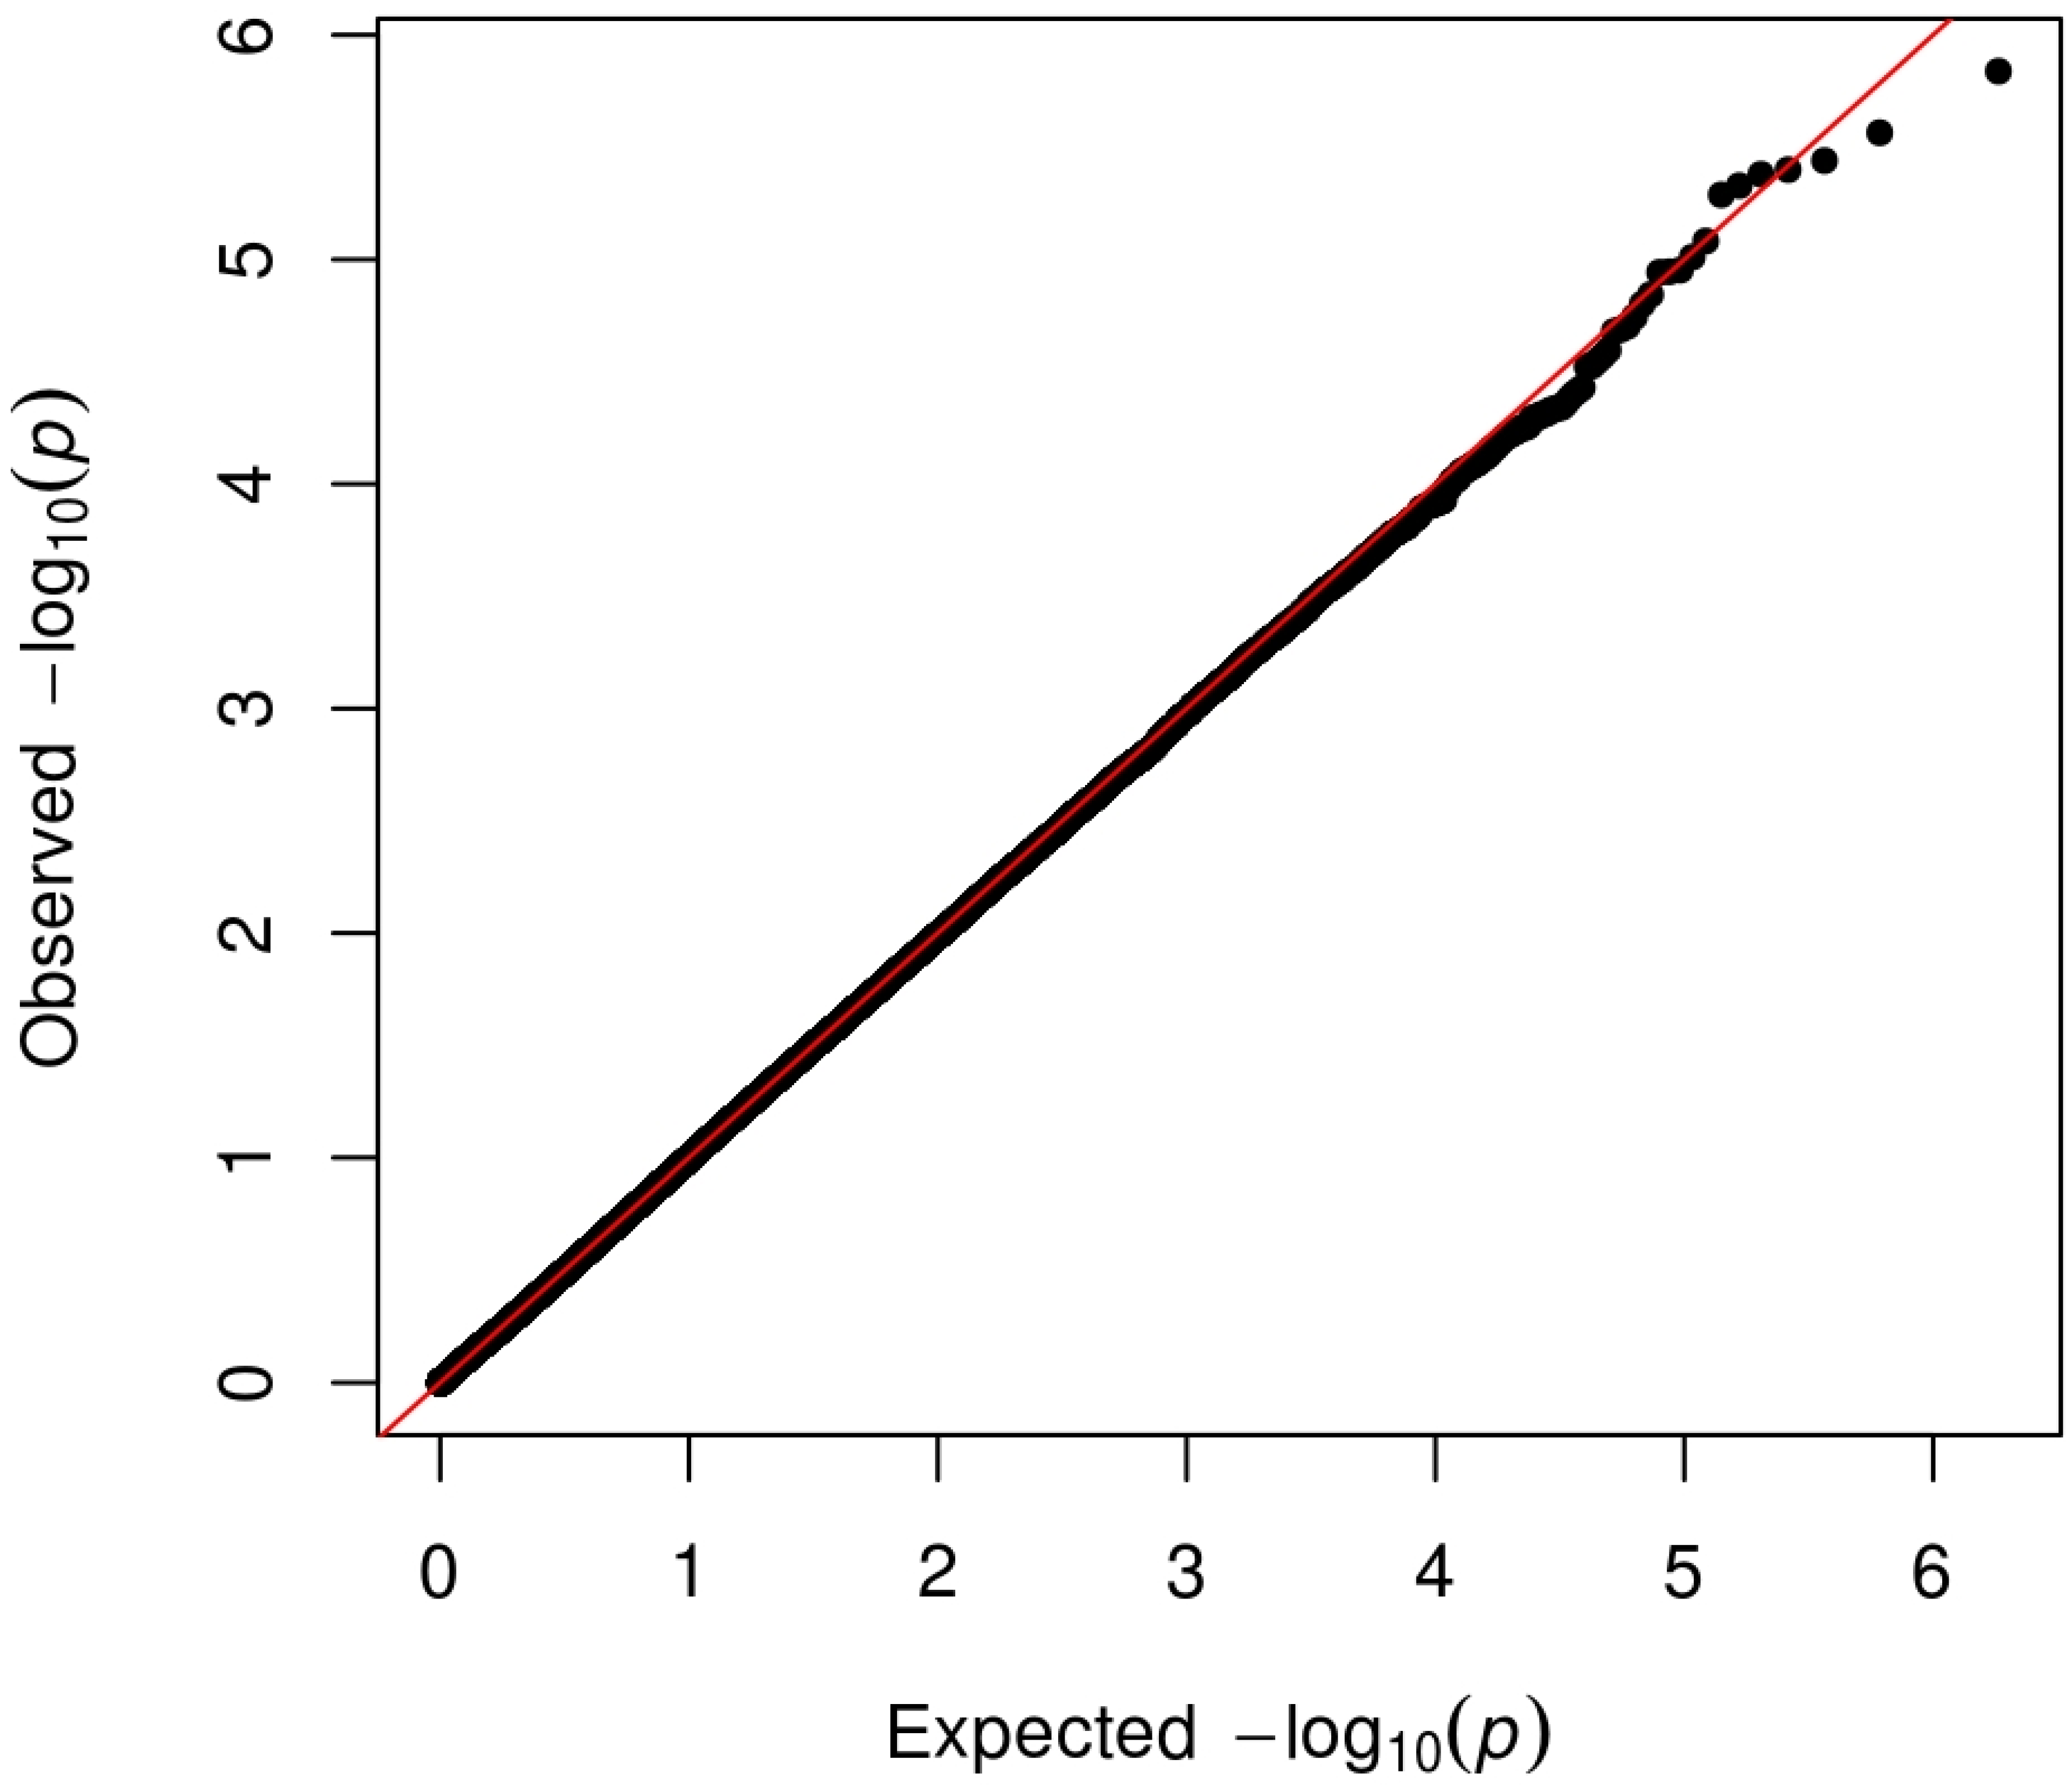
3.1. Investigation Sample
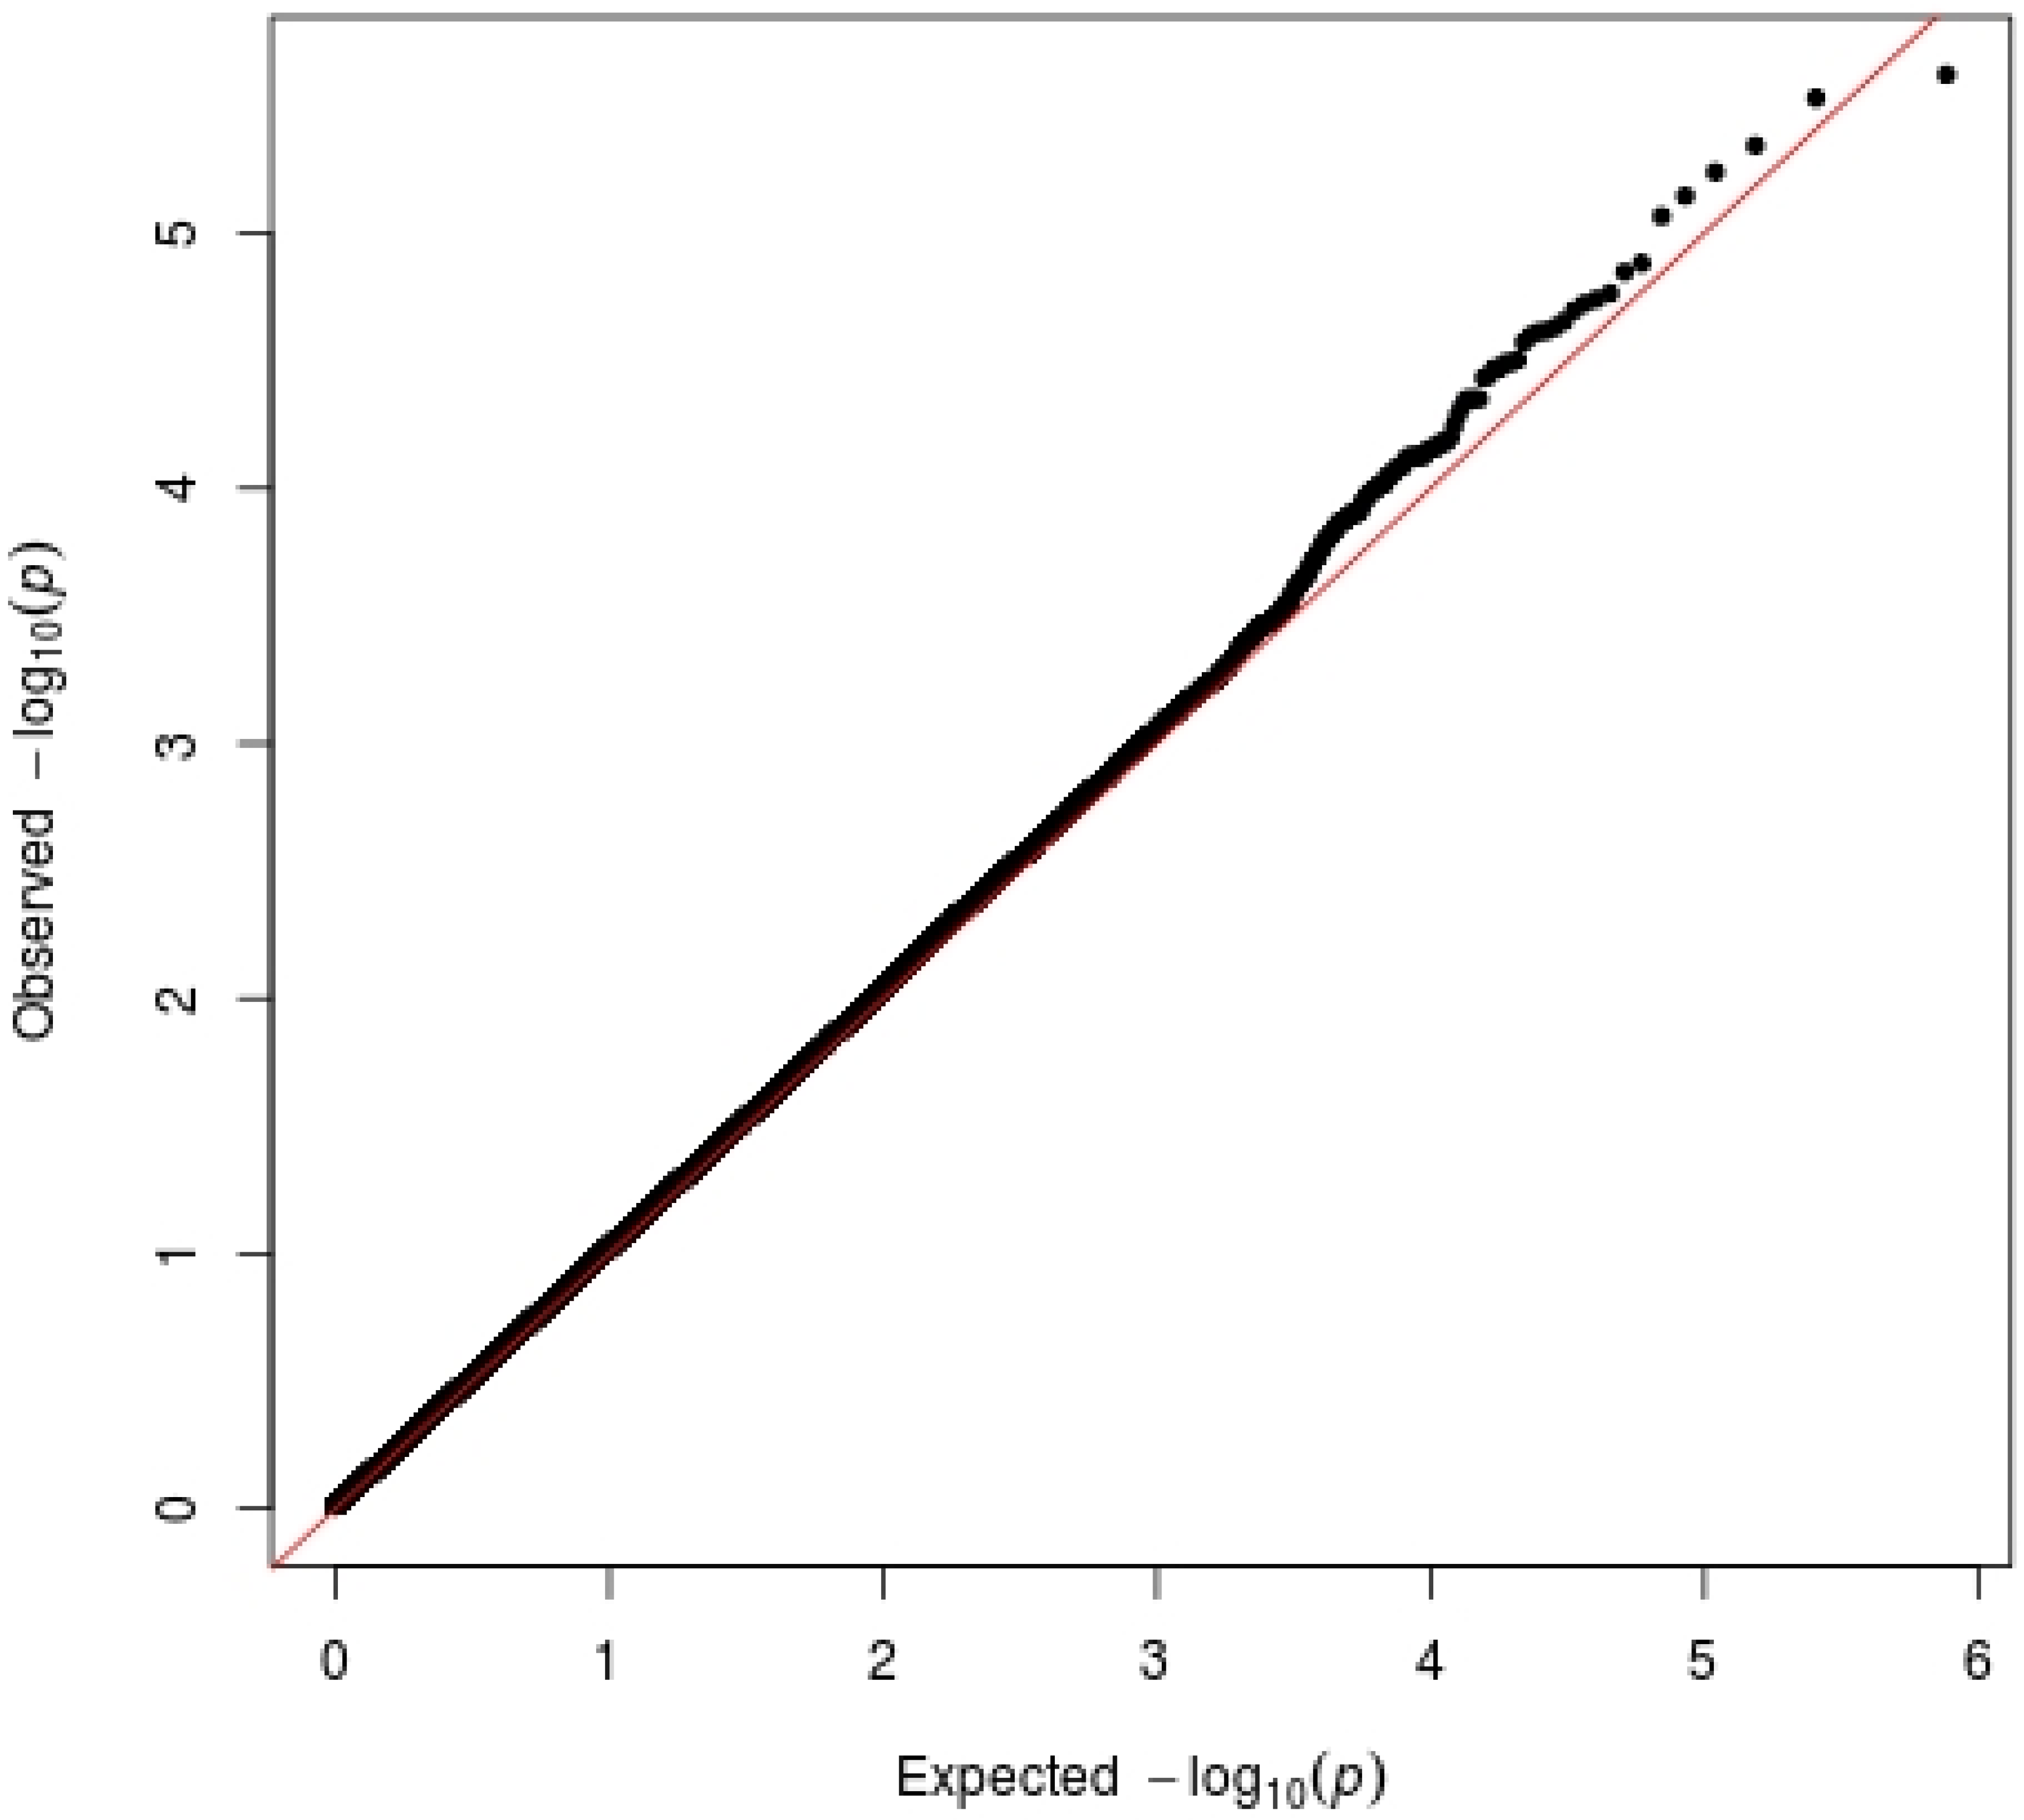
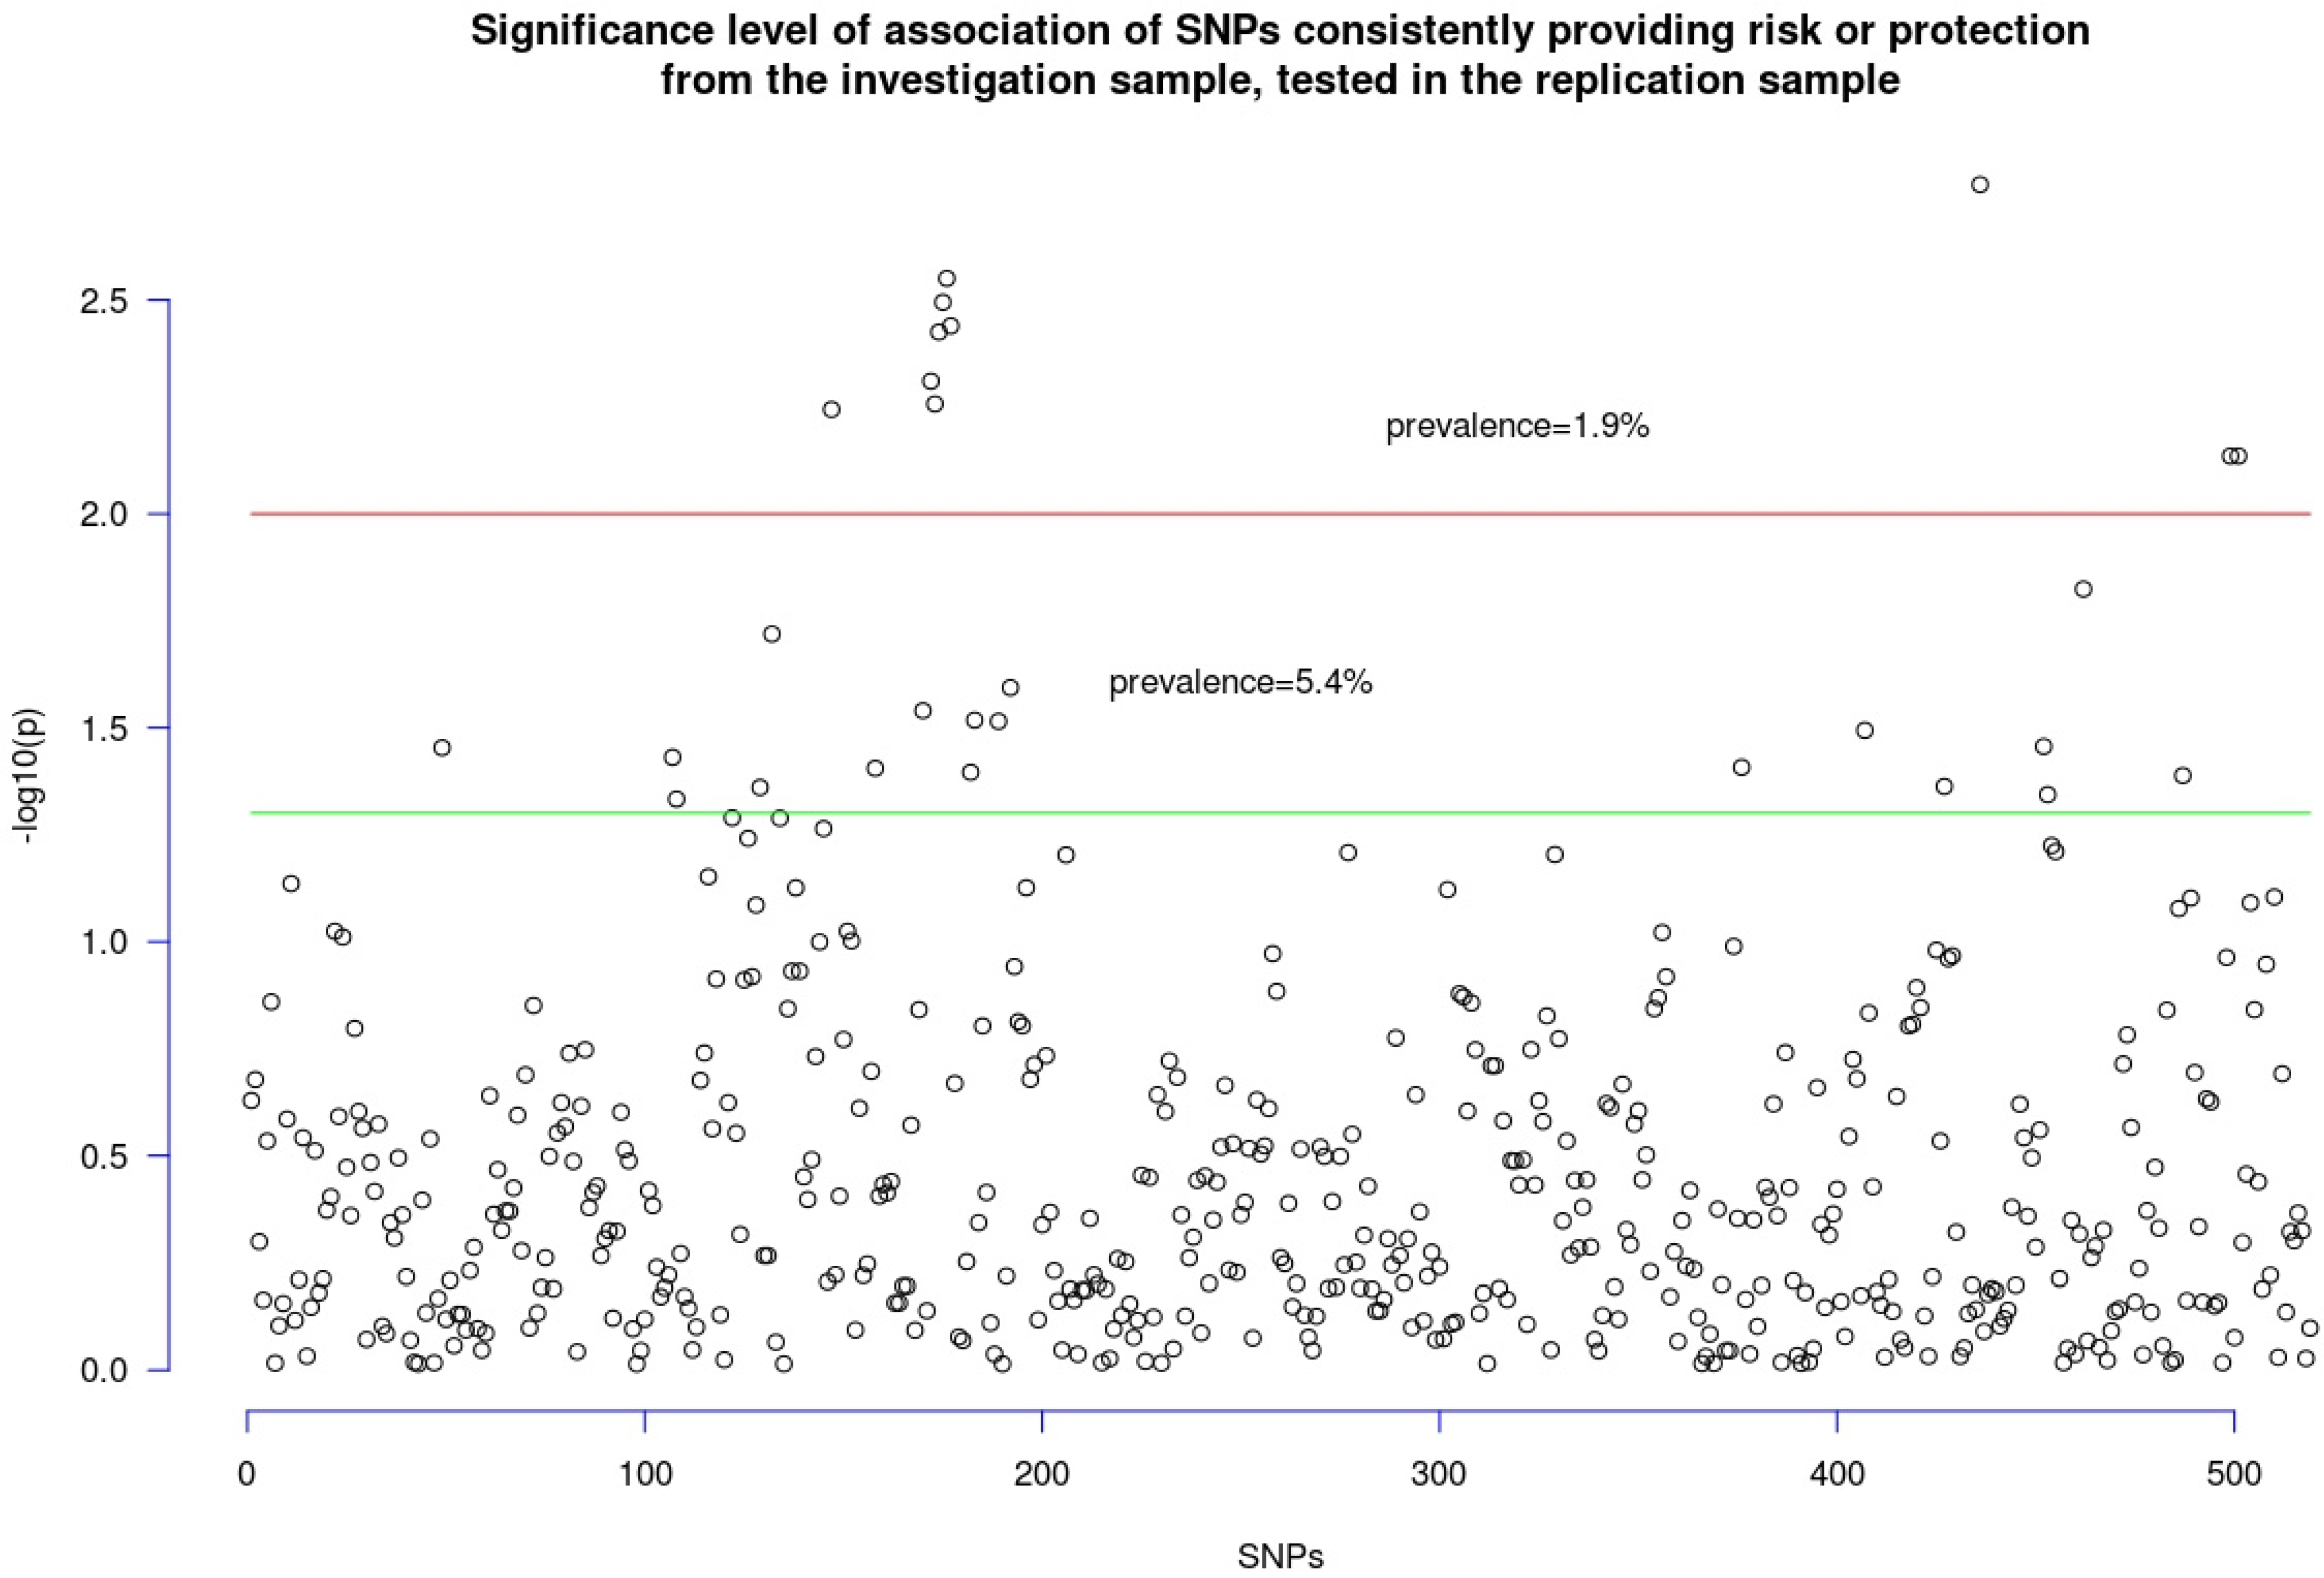
3.2. Replication Sample
4. Discussion
5. Dataset
5.1. Investigation Sample
5.2. Replication Sample
5.3. Computational Power
Author Contributions
Funding
Institutional Review Board Statement
Informed Consent Statement
Data Availability Statement
Conflicts of Interest
References
- Geschwind, D.H. Advances in autism. Annu. Rev. Med. 2009, 60, 367–380. [Google Scholar] [CrossRef]
- Lai, M.-C.; Lombardo, M.V.; Baron-Cohen, S. Autism. Lancet 2014, 383, 896–910. [Google Scholar] [CrossRef] [PubMed]
- Ozonoff, S.; Young, G.S.; Carter, A.; Messinger, D.; Yirmiya, N.; Zwaigenbaum, L.; Bryson, S.; Carver, L.J.; Constantino, J.N.; Dobkins, K.; et al. Recurrence risk for autism spectrum disorders: A Baby Siblings Research Consortium study. Pediatrics 2011, 128, e488–e495. [Google Scholar] [CrossRef] [PubMed]
- Bailey, A.; Le Couteur, A.; Gottesman, I.; Bolton, P.; Simonoff, E.; Yuzda, E.; Rutter, M. Autism as a strongly genetic disorder: Evidence from a British twin study. Psychol. Med. 1995, 25, 63–77. [Google Scholar] [CrossRef] [PubMed]
- Cakir, J.; Frye, R.E.; Walker, S.J. The Lifetime Social Cost of Autism: 1990–2029. Res. Autism Spectr. Disord. 2020, 72, 101502. [Google Scholar] [CrossRef]
- Horecka-Lewitowicz, A.; Lewitowicz, W.; Wawszczak-Kasza, M.; Lim, H.; Lewitowicz, P. Autism Spectrum Disorder Pathogenesis-A Cross-Sectional Literature Review Emphasizing Molecular Aspects. Int. J. Mol. Sci. 2024, 25, 11283. [Google Scholar] [CrossRef]
- Autism Spectrum Disorders Working Group of the Psychiatric Genomics Consortium. Meta-Analysis of GWAS of over 16,000 Individuals with Autism Spectrum Disorder Highlights a Novel Locus at 10q24.32 and a Significant Overlap with Schizophrenia. Mol. Autism 2017, 8, 21. [Google Scholar] [CrossRef]
- Grove, J.; Ripke, S.; Als, T.D.; Mattheisen, M.; Walters, R.; Won, H.; Pallesen, J.; Agerbo, E.; Andreassen, O.A.; Anney, R.; et al. Common Risk Variants Identified in Autism Spectrum Disorder. bioRxiv 2017. [Google Scholar] [CrossRef]
- Choi, L.; An, J.-Y. Genetic Architecture of Autism Spectrum Disorder: Lessons from Large-Scale Genomic Studies. Neurosci. Biobehav. Rev. 2021, 128, 244–257. [Google Scholar] [CrossRef]
- Khoodoruth, M.A.S.; Khoodoruth, W.N.C.-K.; Uroos, M.; Al-Abdulla, M.; Khan, Y.S.; Mohammad, F. Diagnostic and Mechanistic Roles of MicroRNAs in Neurodevelopmental & Neurodegenerative Disorders. Neurobiol. Dis. 2024, 202, 106717. [Google Scholar] [CrossRef]
- Nóbrega, I.d.S.; Teles E Silva, A.L.; Yokota-Moreno, B.Y.; Sertié, A.L. The Importance of Large-Scale Genomic Studies to Unravel Genetic Risk Factors for Autism. Int. J. Mol. Sci. 2024, 25, 5816. [Google Scholar] [CrossRef] [PubMed]
- Vilela, J.; Rasga, C.; Santos, J.X.; Martiniano, H.; Marques, A.R.; Oliveira, G.; Vicente, A.M. Bridging Genetic Insights with Neuroimaging in Autism Spectrum Disorder—A Systematic Review. Int. J. Mol. Sci. 2024, 25, 4938. [Google Scholar] [CrossRef]
- Levy, D.; Ronemus, M.; Yamrom, B.; Lee, Y.; Leotta, A.; Kendall, J.; Marks, S.; Lakshmi, B.; Pai, D.; Ye, K.; et al. Rare de novo and transmitted copy-number variation in autistic spectrum disorders. Neuron 2011, 70, 886–897. [Google Scholar] [CrossRef]
- Marshall, C.R.; Noor, A.; Vincent, J.B.; Lionel, A.C.; Feuk, L.; Skaug, J.; Shago, M.; Moessner, R.; Pinto, D.; Ren, Y.; et al. Structural variation of chromosomes in autism spectrum disorder. Am. J. Hum. Genet. 2008, 82, 477–488. [Google Scholar] [CrossRef] [PubMed]
- Sebat, J.; Lakshmi, B.; Malhotra, D.; Troge, J.; Lese-Martin, C.; Walsh, T.; Yamrom, B.; Yoon, S.; Krasnitz, A.; Kendall, J.; et al. Strong association of de novo copy number mutations with autism. Science 2007, 316, 445–449. [Google Scholar] [CrossRef]
- Utami, K.H. The implications of de novo coding mutations in simplex autism families. Clin. Genet. 2015, 87, 428–429. [Google Scholar] [CrossRef] [PubMed]
- Gaugler, T.; Klei, L.; Sanders, S.J.; Bodea, C.A.; Goldberg, A.P.; Lee, A.B.; Mahajan, M.; Manaa, D.; Pawitan, Y.; Reichert, J.; et al. Most genetic risk for autism resides with common variation. Nat. Genet. 2014, 46, 881–885. [Google Scholar] [CrossRef] [PubMed]
- Veltman, M.W.M.; Craig, E.E.; Bolton, P.F. Autism spectrum disorders in Prader-Willi and Angelman syndromes: A systematic review. Psychiatr. Genet. 2005, 15, 243–254. [Google Scholar] [CrossRef] [PubMed]
- Klei, L.; Sanders, S.J.; Murtha, M.T.; Hus, V.; Lowe, J.K.; Willsey, A.J.; Moreno-De-Luca, D.; Yu, T.W.; Fombonne, E.; Geschwind, D.; et al. Common genetic variants, acting additively, are a major source of risk for autism. Mol. Autism 2012, 3, 9. [Google Scholar] [CrossRef] [PubMed]
- Aryal, S.; Bonanno, K.; Song, B.; Mani, D.R.; Keshishian, H.; Carr, S.A.; Sheng, M.; Dejanovic, B. Deep Proteomics Identifies Shared Molecular Pathway Alterations in Synapses of Patients with Schizophrenia and Bipolar Disorder and Mouse Model. Cell Rep. 2023, 42, 112497. [Google Scholar] [CrossRef] [PubMed]
- Calabró, M.; Briuglia, S.; Crisafulli, C.; Drago, A. Body Weight Changes and Bipolar Disorder: A Molecular Pathway Analysis. Pharmacogenet. Genom. 2022, 32, 308–320. [Google Scholar] [CrossRef] [PubMed]
- Gong, M.; Li, J.; Qin, Z.; Machado Bressan Wilke, M.V.; Liu, Y.; Li, Q.; Liu, H.; Liang, C.; Morales-Rosado, J.A.; Cohen, A.S.A.; et al. MARK2 Variants Cause Autism Spectrum Disorder via the Downregulation of WNT/β-Catenin Signaling Pathway. Am. J. Hum. Genet. 2024, 111, 2392–2410. [Google Scholar] [CrossRef]
- Müller-Myhsok, B. The Usefulness of Single Nucleotide Polymorphisms (SNPs) for Genetic Epidemiological Investigation of Complex Psychiatric Diseases. Prog. Neuropsychopharmacol. Biol. Psychiatry 2005, 29, 1017–1020. [Google Scholar] [CrossRef] [PubMed]
- Faust, K.; Croes, D.; van Helden, J. Prediction of metabolic pathways from genome-scale metabolic networks. Biosystems 2011, 105, 109–121. [Google Scholar] [CrossRef]
- Purcell, S.; Neale, B.; Todd-Brown, K.; Thomas, L.; Ferreira, M.A.R.; Bender, D.; Maller, J.; Sklar, P.; de Bakker, P.I.W.; Daly, M.J.; et al. PLINK: A tool set for whole-genome association population-based linkage analyses. Am. J. Hum. Genet. 2007, 81, 559–575. [Google Scholar] [CrossRef] [PubMed]
- R Foundation for Statistical Computing. R: A Language and Environment for Statistical Computing; R Foundation for Statistical Computing: Vienna, Austria, 2013. [Google Scholar]
- Barrett, J.C.; Fry, B.; Maller, J.; Daly, M.J. Haploview: Analysis and Visualization of LD and Haplotype Maps. Bioinformatics 2005, 21, 263–265. [Google Scholar] [CrossRef]
- Huber, W.; Carey, V.J.; Gentleman, R.; Anders, S.; Carlson, M.; Carvalho, B.S.; Bravo, H.C.; Davis, S.; Gatto, L.; Girke, T.; et al. Orchestrating High-Throughput Genomic Analysis with Bioconductor. Nat. Methods 2015, 12, 115–121. [Google Scholar] [CrossRef]
- Yu, G.; He, Q.-Y. ReactomePA: An R/Bioconductor Package for Reactome Pathway Analysis and Visualization. Mol. Biosyst. 2016, 12, 477–479. [Google Scholar] [CrossRef] [PubMed]
- Croft, D.; Mundo, A.F.; Haw, R.; Milacic, M.; Weiser, J.; Wu, G.; Caudy, M.; Garapati, P.; Gillespie, M.; Kamdar, M.R.; et al. The Reactome Pathway Knowledgebase. Nucleic Acids Res. 2014, 42, D472–D477. [Google Scholar] [CrossRef] [PubMed]
- Shannon, P.; Markiel, A.; Ozier, O.; Baliga, N.S.; Wang, J.T.; Ramage, D.; Amin, N.; Schwikowski, B.; Ideker, T. Cytoscape: A Software Environment for Integrated Models of Biomolecular Interaction Networks. Genome Res. 2003, 13, 2498–2504. [Google Scholar] [CrossRef] [PubMed]
- Hodges, H.; Fealko, C.; Soares, N. Autism Spectrum Disorder: Definition, Epidemiology, Causes, and Clinical Evaluation. Transl. Pediatr. 2020, 9, S55–S65. [Google Scholar] [CrossRef]
- Defo, J.; Awany, D.; Ramesar, R. From SNP to Pathway-Based GWAS Meta-Analysis: Do Current Meta-Analysis Approaches Resolve Power and Replication in Genetic Association Studies? Brief. Bioinform. 2023, 24, bbac600. [Google Scholar] [CrossRef]
- Schulmann, A.; Ryu, E.; Goncalves, V.; Rollins, B.; Christiansen, M.; Frye, M.A.; Biernacka, J.; Vawter, M.P. Novel Complex Interactions between Mitochondrial and Nuclear DNA in Schizophrenia and Bipolar Disorder. Mol. Neuropsychiatry 2019, 5, 13–27. [Google Scholar] [CrossRef] [PubMed]
- Cui, H.; Dhroso, A.; Johnson, N.; Korkin, D. The Variation Game: Cracking Complex Genetic Disorders with NGS and Omics Data. Methods 2015, 79–80, 18–31. [Google Scholar] [CrossRef]
- Andrews, S.V.; Sheppard, B.; Windham, G.C.; Schieve, L.A.; Schendel, D.E.; Croen, L.A.; Chopra, P.; Alisch, R.S.; Newschaffer, C.J.; Warren, S.T.; et al. Case-Control Meta-Analysis of Blood DNA Methylation and Autism Spectrum Disorder. Mol. Autism 2018, 9, 40. [Google Scholar] [CrossRef] [PubMed]
- Yao, X.; Glessner, J.T.; Li, J.; Qi, X.; Hou, X.; Zhu, C.; Li, X.; March, M.E.; Yang, L.; Mentch, F.D.; et al. Integrative Analysis of Genome-Wide Association Studies Identifies Novel Loci Associated with Neuropsychiatric Disorders. Transl. Psychiatry 2021, 11, 69. [Google Scholar] [CrossRef]
- Lipska, B.K.; Mitkus, S.N.; Mathew, S.V.; Fatula, R.; Hyde, T.M.; Weinberger, D.R.; Kleinman, J.E. Functional Genomics in Postmortem Human Brain: Abnormalities in a DISC1 Molecular Pathway in Schizophrenia. Dialogues Clin. Neurosci. 2006, 8, 353–357. [Google Scholar] [CrossRef] [PubMed]
- O’Dushlaine, C.; Kenny, E.; Heron, E.; Donohoe, G.; Gill, M.; Morris, D.; International Schizophrenia Consortium; Corvin, A. Molecular Pathways Involved in Neuronal Cell Adhesion and Membrane Scaffolding Contribute to Schizophrenia and Bipolar Disorder Susceptibility. Mol. Psychiatry 2011, 16, 286–292. [Google Scholar] [CrossRef]
- Espregueira Themudo, G.; Leerschool, A.-R.; Rodriguez-Proano, C.; Christiansen, S.L.; Andersen, J.D.; Busch, J.R.; Christensen, M.R.; Banner, J.; Morling, N. Targeted Exon Sequencing in Deceased Schizophrenia Patients in Denmark. Int. J. Legal Med. 2020, 134, 135–147. [Google Scholar] [CrossRef]
- Bhattacharyya, U.; John, J.; Lencz, T.; Lam, M. Dissecting Schizophrenia Biology Using Pleiotropy with Cognitive Genomics. MedRxiv Prepr. Serv. Health Sci. 2024. [Google Scholar] [CrossRef]
- Wang, G.; Zhao, J.; Zhou, M.; Lu, H.; Mao, F. Unveiling Diabetic Nephropathy: A Novel Diagnostic Model through Single-Cell Sequencing and Co-Expression Analysis. Aging 2024, 16, 10972–10984. [Google Scholar] [CrossRef] [PubMed]
- Hu, K.; Ou, Y.; Xiao, L.; Gu, R.; He, F.; Peng, J.; Shu, Y.; Li, T.; Hao, L. Identification and Construction of a Disulfidptosis-Mediated Diagnostic Model and Associated Immune Microenvironment of Osteoarthritis from the Perspective of PPPM. J. Inflamm. Res. 2024, 17, 3753–3770. [Google Scholar] [CrossRef]
- Xiong, Z.; Fang, Y.; Lu, S.; Sun, Q.; Sun, Y.; Yang, P.; Huang, J. Exploring the Relevance of Disulfidptosis to the Pathophysiology of Ulcerative Colitis by Bioinformatics Analysis. J. Inflamm. Res. 2024, 17, 2757–2774. [Google Scholar] [CrossRef]
- Liu, H.; Tang, T. Pan-Cancer Genetic Analysis of Cuproptosis and Copper Metabolism-Related Gene Set. Front. Oncol. 2022, 12, 952290. [Google Scholar] [CrossRef]
- Liu, H.; Xie, R.; Dai, Q.; Fang, J.; Xu, Y.; Li, B. Exploring the Mechanism Underlying Hyperuricemia Using Comprehensive Research on Multi-Omics. Sci. Rep. 2023, 13, 7161. [Google Scholar] [CrossRef] [PubMed]
- Li, Y.; Garg, P.K.; Wu, J. Associations between Daytime Napping, Sleep Duration, and Depression and 15 Cardiovascular Diseases: A Mendelian Randomization Study. Cardiovasc. Diagn. Ther. 2024, 14, 771–787. [Google Scholar] [CrossRef] [PubMed]
- Rahnama, M.; Tehrani, H.A.; Mirzaie, M. Vahid Ziaee Identification of Key Genes and Convergent Pathways Disrupted in Autism Spectrum Disorder via Comprehensive Bioinformatic Analysis. Inform. Med. Unlocked 2021, 24, 100589. [Google Scholar] [CrossRef]
- Huang, G.; Chen, S.; Chen, X.; Zheng, J.; Xu, Z.; Doostparast Torshizi, A.; Gong, S.; Chen, Q.; Ma, X.; Yu, J.; et al. Uncovering the Functional Link Between SHANK3 Deletions and Deficiency in Neurodevelopment Using iPSC-Derived Human Neurons. Front. Neuroanat. 2019, 13, 23. [Google Scholar] [CrossRef]
- Miozzo, F.; Murru, L.; Maiellano, G.; Zippo, A.; Moretto, E.; Avendano, A.Z.; Metodieva, V.D.; Riccardi, S.; D’Aliberti, D.; Spinelli, S.; et al. Disruption of Autism-Associated Pcdh9 Gene Leads to Transcriptional Alterations, Synapses Overgrowth and Aberrant Excitatory Transmission in the CA1. 2024. Available online: https://www.biorxiv.org/content/10.1101/2024.01.27.577576v1.abstract (accessed on 15 July 2024).
- Gupta, V.; Ben-Mahmoud, A.; Ku, B.; Velayutham, D.; Jan, Z.; Yousef Aden, A.; Kubbar, A.; Alshaban, F.; Stanton, L.W.; Jithesh, P.V.; et al. Identification of Two Novel Autism Genes, TRPC4 and SCFD2, in Qatar Simplex Families through Exome Sequencing. Front. Psychiatry 2023, 14, 1251884. [Google Scholar] [CrossRef] [PubMed]
- Horowitz, A.; Chanez-Paredes, S.D.; Haest, X.; Turner, J.R. Paracellular Permeability and Tight Junction Regulation in Gut Health and Disease. Nat. Rev. Gastroenterol. Hepatol. 2023, 20, 417–432. [Google Scholar] [CrossRef]
- Peñagarikano, O. New Therapeutic Options for Autism Spectrum Disorder: Experimental Evidences. Exp. Neurobiol. 2015, 24, 301–311. [Google Scholar] [CrossRef]
- Kolevzon, A.; Bush, L.; Wang, A.T.; Halpern, D.; Frank, Y.; Grodberg, D.; Rapaport, R.; Tavassoli, T.; Chaplin, W.; Soorya, L.; et al. A pilot controlled trial of insulin-like growth factor-1 in children with Phelan-McDermid syndrome. Mol. Autism 2014, 5, 54. [Google Scholar] [CrossRef] [PubMed]
- Wei, H.; Dobkin, C.; Sheikh, A.M.; Malik, M.; Brown, W.T.; Li, X. The therapeutic effect of memantine through the stimula-tion of synapse formation and dendritic spine maturation in autism and fragile X syndrome. PLoS ONE 2012, 7, e36981. [Google Scholar] [CrossRef]
- Chez, M.G.; Burton, Q.; Dowling, T.; Chang, M.; Khanna, P.; Kramer, C. Memantine as adjunctive therapy in children diagnosed with autistic spectrum disorders: An observation of initial clinical response and maintenance tolerability. J. Child Neurol. 2007, 22, 574–579. [Google Scholar] [CrossRef] [PubMed]
- Erickson, C.A.; Posey, D.J.; Stigler, K.A.; Mullett, J.; Katschke, A.R.; McDougle, C.J. A retrospective study of memantine in children and adolescents with pervasive developmental disorders. Psychopharmacology 2007, 191, 141–147. [Google Scholar] [CrossRef]
- Berry-Kravis, E.M.; Hessl, D.; Rathmell, B.; Zarevics, P.; Cherubini, M.; Walton-Bowen, K.; Mu, Y.; Nguyen, D.V.; Gonza-lez-Heydrich, J.; Wang, P.P.; et al. Effects of STX209 (arbaclofen) on neurobehavioral function in children and adults with fragile X syndrome: A randomized, controlled, phase 2 trial. Sci. Transl. Med. 2012, 4, 152ra127. [Google Scholar] [CrossRef]
- Erickson, C.A.; Veenstra-Vanderweele, J.M.; Melmed, R.D.; McCracken, J.T.; Ginsberg, L.D.; Sikich, L.; Scahill, L.; Cherubini, M.; Zarevics, P.; Walton-Bowen, K.; et al. King BHSTX209 (arbaclofen) for autism spectrum disorders: An 8-week open-label study. J. Autism Dev. Disord. 2014, 44, 958–964. [Google Scholar] [CrossRef] [PubMed]
- Griffiths, J.L.; Mishaal, R.A.; Nabetani, M.; Goldman, R.D. Oxytocin for the Treatment of Autism Spectrum Disorder in Children. Can. Fam. Physician Med. Fam. Can. 2022, 68, 103–105. [Google Scholar] [CrossRef] [PubMed]
- Yenkoyan, K.; Ounanian, Z.; Mirumyan, M.; Hayrapetyan, L.; Zakaryan, N.; Sahakyan, R.; Bjørklund, G. Advances in the Treatment of Autism Spectrum Disorder: Current and Promising Strategies. Curr. Med. Chem. 2024, 31, 1485–1511. [Google Scholar] [CrossRef]
- Kurup, D.; FitzPatrick, A.M.; Badura, A.; Serra, I. Bridging the Gap: Neurodevelopmental Disorder Risks in Inborn Errors of Immunity. Curr. Opin. Allergy Clin. Immunol. 2024, 24, 472–478. [Google Scholar] [CrossRef] [PubMed]
- Courchesne, E. Brainstem, Cerebellar and Limbic Neuroanatomical Abnormalities in Autism. Curr. Opin. Neurobiol. 1997, 7, 269–278. [Google Scholar] [CrossRef]
- Catani, M.; Dell’acqua, F.; Thiebaut de Schotten, M. A Revised Limbic System Model for Memory, Emotion and Behaviour. Neurosci. Biobehav. Rev. 2013, 37, 1724–1737. [Google Scholar] [CrossRef] [PubMed]
- Borrell, V.; Götz, M. Role of radial glial cells in cerebral cortex folding. Curr. Opin. Neurobiol. 2014, 27, 39–46. [Google Scholar] [CrossRef] [PubMed]
- Yao, Y.; Li, Q. The Role of Parvalbumin Interneurons in Autism Spectrum Disorder. J. Neurosci. Res. 2024, 102, e25391. [Google Scholar] [CrossRef] [PubMed]
- Casanova, M.F.; Buxhoeveden, D.P.; Switala, A.E.; Roy, E. Minicolumnar pathology in autism. Neurology 2002, 58, 428–432. [Google Scholar] [CrossRef]
- Kim, Y.S.; Choi, J.; Yoon, B.-E. Neuron-Glia Interactions in Neurodevelopmental Disorders. Cells 2020, 9, 2176. [Google Scholar] [CrossRef] [PubMed]
- Gzielo, K.; Nikiforuk, A. Astroglia in Autism Spectrum Disorder. Int. J. Mol. Sci. 2021, 22, 11544. [Google Scholar] [CrossRef]


| Gene | Sequence | Position | SNP |
|---|---|---|---|
| CAMTA1[intronic] | >>NNNTTACAGT(C):(T)TTAACCACTG>> | chr1:7,143,344..7,143,344 | rs2187901 |
| C1orf110(dist = 3597), RGS4(dist = 196194)[intergenic] | >>aaaataactg(C):(T)aagaaaaaag>> | chr1:162,842,202..162,842,202 | rs12047510 |
| LOC642587(dist = 111217), CAMK1G(dist = 39936)[intergenic] | >>aaggtgcaaa(T):(G)atctatgcat>> | chr1:209,717,109..209,717,109 | rs4844851 |
| ESRRG[intronic] | >>atgattcccc(C):(T)atcctggtat>> | chr1:216,966,601..216,966,601 | rs7355008 |
| C1orf110[intronic] | >>aagaaaaaga(C):(T)atacagactg>> | chr1:162,835,703..162,835,703 | rs12137443 |
| C1orf110(dist = 28505), RGS4(dist = 171286)[intergenic] | >>GGATCCAGGG(T):(G)CATAGAACAC>> | chr1:162,867,110..162,867,110 | rs7533937 |
| TTC7A[UTR3] | >>CTGTGGTTGC(C):(T)AGATCCAGTC>> | chr2:47,301,744..47,301,744 | rs1046263 |
| DKFZp686O1327(dist = 12942), PABPC1P2(dist = 1497392)[intergenic] | >>GAAAAAAAAA(A):(G)TCAATGCCCA>> | chr2:145,847,233..145,847,233 | rs2663966 |
| TFPI(dist = 395225), GULP1(dist = 342946)[intergenic] | >>caataagaga(C):(A)atctgatgta>> | chr2:188,814,444..188,814,444 | rs10170218 |
| TFPI(dist = 411011), GULP1(dist = 327160)[intergenic] | >>aacaataata(C):(T)aGTTAGAAtg>> | chr2:188,830,230..188,830,230 | rs12105426 |
| TMEM194B(dist = 39273), NAB1(dist = 75107)[intergenic] | >>TCATCCAGCT(C):(A)GGAAGCTGCA>> | chr2:191,438,741..191,438,741 | rs7603849 |
| TMEM194B(dist = 46800), NAB1(dist = 67580)[intergenic] | >>TACCTTAGTT(T):(G)ATAATGTACA>> | chr2:191,446,268..191,446,268 | rs11680758 |
| TMEM194B(dist = 53431), NAB1(dist = 60949)[intergenic] | >>AGACATTTTT(T):(G)CAGTGGGAcc>> | chr2:191,452,899..191,452,899 | rs4321393 |
| TMEM194B(dist = 93698), NAB1(dist = 20682)[intergenic] | >>TGCTAGTTAA(A):(G)AGCATGTATA>> | chr2:191,493,166..191,493,166 | rs887695 |
| SH3BP4(dist = 245560), AGAP1(dist = 192818)[intergenic] | >>GCATCAATGA(A):(G)CCTCAAGAAA>> | chr2:236,209,918..236,209,918 | rs13019316 |
| MECOM(dist = 14218), TERC(dist = 86617)[intergenic] | >>ATGCCTATCT(A):(G)GCCTACGGCA>> | chr3:169,395,781..169,395,781 | rs17507954 |
| ZNF385D (dist = 108667), UBE2E2(dist = 1343301)[intergenic] | >>TTTTTAATTT(C):(T)TGATACTTTT>> | chr3:21,901,483..21,901,483 | rs1679235 |
| PPP2R2C[intronic] | >>ATTCAGTGTG(T):(G)CTTCATCTCC>> | chr4:6,523,276..6,523,276 | rs4075006 |
| GPRIN3(dist = 179798), SNCA(dist = 236291)[intergenic] | >>CTTCGAGATG(A):(G)TTTCTACTTA>> | chr4:90,408,959..90,408,959 | rs17015665 |
| GPRIN3(dist = 206392), SNCA(dist = 209697)[intergenic] | >>CGGTCATTAC(T):(G)AGATAGCATT>> | chr4:90,435,553..90,435,553 | rs924033 |
| IRX4(dist = 740038), IRX2(dist = 123361)[intergenic] | >>ATGCCTGCTG(C):(T)GGAGGAGGTG>> | chr5:2,622,918..2,622,918 | rs172834 |
| LOC100505738(dist = 492614), SEMA5A(dist = 79315)[intergenic] | >>CATAAGAAAA(T):(G)ACCACAAGGA>> | chr5:8,955,823..8,955,823 | rs6874770 |
| RAB3C[intronic] | >>CTAACACTGC(T):(G)CTAATTAAGA>> | chr5:57,916,579..57,916,579 | rs386161 |
| SLCO4C1[UTR3] | >>CAAGGGCTGC(A):(G)TTGTATTTTA>> | chr5:101,570,236..101,570,236 | rs3811976 |
| AKAP7(dist = 34960), ARG1(dist = 254730)[intergenic] | >>TTCTGAGGAC(C):(T)GATCAGAGAT>> | chr6:131,639,635..131,639,635 | rs1322595 |
| NXPH1(dist = 200291), PER4(dist = 681016)[intergenic] | >>ATCAGTTGGG(C):(T)CTATCATTAT>> | chr7:8,992,884..8,992,884 | rs10250332 |
| C7orf69, PKD1L1[intronic] | >>ATTTGTTTAC(A):(G)TGCATGTCTG>> | chr7:47,835,174..47,835,174 | rs4724645 |
| C7orf69, PKD1L1[intronic] | >>tgtaTTCTTT(C):(T)ACTTCAGGAG>> | chr7:47,846,770..47,846,770 | rs2348460 |
| STAG3L4(dist = 1500655), AUTS2(dist = 776737)[intergenic] | >>TCTCTGTGAC(A):(G)TTCCTTCCAA>> | chr7:68,287,168..68,287,168 | rs6460468 |
| PCLO[intronic] | >>GAATGCATAC(C):(A)AAACAAAATT>> | chr7:82,653,249..82,653,249 | rs6977045 |
| PCLO[intronic] | >>TTATACTGCA(A):(G)TATATCCTAA>> | chr7:82,659,856..82,659,856 | rs12707538 |
| CDK6(dist = 157200), SAMD9(dist = 105685)[intergenic] | >>AGGCATTTTC(A):(G)GAACCCGCTA>> | chr7:92,623,141..92,623,141 | rs1013803 |
| RELN[intronic] | >>CAGGGTTAAA(C):(T)TTAGTACTCA>> | chr7:103,511,617..103,511,617 | rs17133124 |
| RELN[intronic] | >>AAACCAATGA(A):(G)ATATAATGCT>> | chr7:103,512,401..103,512,401 | rs17133142 |
| DPP6[intronic] | >>TAATACAATC(C):(T)GTTATGTAAA>> | chr7:153,720,890..153,720,890 | rs3852281 |
| LZTS1(dist = 462664), LOC286114(dist = 256030)[intergenic] | >>CTCAAACCCA(C):(T)GCAGCTCAAG>> | chr8:20,575,467..20,575,467 | rs6984463 |
| CA8[intronic] | >>AATATATAGT(C):(T)TGTTTTATAT>> | chr8:61,120,636..61,120,636 | rs13261565 |
| KCNQ3[intronic] | >>TGTCAACACA(C):(T)AAATAAGTGA>> | chr8:133,286,978..133,286,978 | rs4736412 |
| COLEC10(dist = 15923), MAL2(dist = 85485)[intergenic] | >>CCTAGCTCTT(C):(T)AGTCTTGTAG>> | chr8:120,135,125..120,135,125 | rs13269842 |
| LCN12(dist = 9064), PTGDS(dist = 12943)[intergenic] | >>CTTCCCCGGC(C):(T)GTGTTTGTGT>> | chr9:139,859,013..139,859,013 | rs7040970 |
| LCN12(dist = 10315), PTGDS(dist = 11692)[intergenic] | >>GCAGCTGGCC(C):(T)GATGTGAGCC>> | chr9:139,860,264..139,860,264 | rs11145951 |
| CCDC3(dist = 87431), OPTN(dist = 10947)[intergenic] | >>ACTACACAGC(A):(G)GACCATATAA>> | chr10:13,131,135..13,131,135 | rs11258183 |
| NCRNA00245(dist = 234721), C10orf11(dist = 139058)[intergenic] | >>AGACCTCTTC(C):(T)AACATTAGAA>> | chr10:77,403,461..77,403,461 | rs4746315 |
| KCNMA1[intronic] | >>AATCAAGATG(A):(G)TAAGAAAGAT>> | chr10:79,212,639..79,212,639 | rs16934809 |
| NRG3[intronic] | >>tctcttctca(A):(G)tttctcaact>> | chr10:83,964,496..83,964,496 | rs1764072 |
| PTEN(dist = 71081), RNLS(dist = 234008)[intergenic] | >>GCAAGACCAA(A):(G)TGTGTGTAGG>> | chr10:89,799,613..89,799,613 | rs692788 |
| MAML2[intronic] | >>TTATAATTTC(A):(G)TTTATGCCCT>> | chr11:95,991,923..95,991,923 | rs1978763 |
| DSCAML1[intronic] | >>TTCCTGGAGC(A):(G)AACTTGGCAG>> | chr11:117,661,100..117,661,100 | rs625447 |
| OR8B8(dist = 59751), OR8B12(dist = 41886)[intergenic] | >>AAGCTTTTGA(A):(G)TTTGCCTCAG>> | chr11:124,370,732..124,370,732 | rs7119089 |
| OR8B8(dist = 75030), OR8B12(dist = 26607)[intergenic] | >>GAAACTTCTT(C):(T)ATAAATCAAG>> | chr11:124,386,011..124,386,011 | rs4282990 |
| FAR1(dist = 199511), SPON1(dist = 30510)[intergenic] | >>AGGATTTCAG(C):(T)CTACAGAGGA>> | chr11:13,953,404..13,953,404 | rs16913463 |
| SHANK2[intronic] | >>TCATCCACAG(C):(G)AGGCCCTGCT>> | chr11:70,801,075..70,801,075 | rs4627107 |
| SLC16A7(dist = 1133479), FAM19A2(dist = 793154)[intergenic] | >>TTTCTATTAT(A):(G)AAAAATGTTA>> | chr12:61,308,887..61,308,887 | rs1480174 |
| TRPC4[UTR5] | >>CTATTTCTTC(A):(G)TCTCTGAAAG>> | chr13:38,357,494..38,357,494 | rs12583681 |
| PCDH9[intronic] | >>ATCATCTGAC(T):(G)TAGTTTCACA>> | chr13:67,487,682..67,487,682 | rs10492592 |
| CHGA[intronic] | >>CTCAAATGGT(C):(T)CCGCACAGGT>> | chr14:93,400,879..93,400,879 | rs750678 |
| CYFIP1[intronic] | >>GGAATTCTGC(C):(T)GTACGTGGTA>> | chr15:22,972,196..22,972,196 | rs17841095 |
| LOC145845[ncRNA] | >>AGACAAATTG(A):(G)GACAGGATAT>> | chr15:37,167,090..37,167,090 | rs8039031 |
| MEIS2[intronic] | >>CTCTAAATTG(A):(G)CTACAAATTG>> | chr15:37,259,697..37,259,697 | rs896052 |
| GCOM1(dist = 25118), ALDH1A2(dist = 210749)[intergenic] | >>ATTTTCAAAC(C):(T)TGTTCCCTTC>> | chr15:58,034,873..58,034,873 | rs12912067 |
| FTO[intronic] | >>TTATTGCTAT(C):(T)ACACAGAATT>> | chr16:54,009,328..54,009,328 | rs9921255 |
| FTO[intronic] | >>CTGTACTCTA(C):(T)GAATCTTACC>> | chr16:54,009,545..54,009,545 | rs9302654 |
| HTA(dist = 218362), LOC100506172(dist = 74670)[intergenic] | >>tgaaattgtg(A):(G)cacgtgacaa>> | chr16:73,346,034..73,346,034 | rs6564635 |
| AP2B1[intronic] | >>TAAGCCAAGA(C):(A)AGTGACCGCC>> | chr17:33,988,453..33,988,453 | rs9911836 |
| AP2B1[intronic] | >>CTCTTTCCCC(A):(G)ATCTTAAAGA>> | chr17:33,996,764..33,996,764 | rs9906872 |
| AP2B1[intronic] | >>CAACAAGGTG(A):(G)GTGTTCAACA>> | chr17:34,042,468..34,042,468 | rs9904187 |
| NPTX1[UTR3] | >>GCTGTCAAAG(T):(G)CCCCCAAAAA>> | chr17:78,443,507..78,443,507 | rs4889852 |
| NPTX1[exonic] | >>TGGTGGCCCC(T):(G)CCGTAGATCT>> | chr17:78,444,658..78,444,658 | rs12943620 |
| None | NA | NA | rs4890026 |
| CBLN2(dist = 158798), NETO1(dist = 39028)[intergenic] | >>accatatcaG(A):(G)TACTTATTTT>> | chr18:70,370,521..70,370,521 | rs1564793 |
| BMP2(dist = 950910), HAO1(dist = 151811)[intergenic] | >>AAACCCTGAT(C):(T)TATGATCTAT>> | chr20:7,711,820..7,711,820 | rs8121909 |
| XRN2[intronic] | >>TTATATATTA(C):(T)TATTTTTGTC>> | chr20:21,320,653..21,320,653 | rs1546995 |
| XRN2[intronic] | >>ATTGTTTTTA(A):(G)TTTAAGCATA>> | chr20:21,324,510..21,324,510 | rs6082391 |
| XRN2[intronic] | >>CATTCTTTGA(C):(T)TTCAGATCCA>> | chr20:21,325,711..21,325,711 | rs6035850 |
| TMEM189-UBE2V1(dist = 25078), CEBPB(dist = 11963)[intergenic] | >>TGGCACGCCT(A):(G)TAATTAAAGT>> | chr20:48,795,413..48,795,413 | rs6125931 |
| TMEM189-UBE2V1(dist = 32659), CEBPB(dist = 4382)[intergenic] | >>TTTCACTACC(A):(G)GTCCTGAGCA>> | chr20:48,802,994..48,802,994 | rs6020348 |
| RPS6KA3(dist = 176767), CNKSR2(dist = 931019)[intergenic] | >>GCCAATAGGG(C):(T)CCTTGTTGAG>> | chrX:20,461,517..20,461,517 | rs5990877 |
| RPS6KA3(dist = 185595), CNKSR2(dist = 922191)[intergenic] | >>CCTAAGCCTA(C):(T)GGGTGCAATG>> | chrX:20,470,345..20,470,345 | rs5950318 |
| RPS6KA3(dist = 197922), CNKSR2(dist = 909864)[intergenic] | >>ATATGGGAGA(C):(T)TTATATACCA>> | chrX:20,482,672..20,482,672 | rs10521908 |
| RPS6KA3(dist = 211946), CNKSR2(dist = 895840)[intergenic] | >>TCCCAAGTAG(A):(G)GAATGGGAAG>> | chrX:20,496,696..20,496,696 | rs2035111 |
| Upload_1 (p-Value) | Upload_1 (Fold Enrichment) | Upload_1 (Over/Under) | Upload_1 (Expected) | Upload_1 (48) | Homo Sapiens—REFLIST (20814) | GO Biological Process Complete |
|---|---|---|---|---|---|---|
| 2.84 × 10⁻² | >5 | + | 2.01 | 11 | 870 | central nervous system development (GO:0007417) |
| 0.00 × 100 | 0.81 | − | 9.85 | 8 | 4272 | Unclassified (UNCLASSIFIED) |
| Tagging SNPs | Exons | End Position | Start Position | Position | Ensembl | Long Name/Synonyms | Gene |
|---|---|---|---|---|---|---|---|
| 547 | 9 | 67369460 | 66163708 | 13q21.32 | ENSG00000184226 | Cadherin (PC00069) | PCDH9 |
| 1229 | 1 | 117852683 | 117372348 | 11q23 | ENSG00000177103 | immunoglobulin receptor superfamily (PC00197); protein phosphatase (PC00084); protein phosphatase (PC00124); immunoglobulin receptor superfamily (PC00181); immunoglobulin superfamily cell adhesion molecule (PC00195) | DSCAML1 |
| 102 | 11 | 92871382 | 92570164 | 7q21-q22 | ENSG00000105810 | non-receptor serine/threonine protein kinase (PC00220); non-receptor tyrosine protein kinase (PC00137); non-receptor serine/threonine protein kinase (PC00193); non-receptor tyrosine protein kinase (PC00167) | CDK6 |
| 393 | 11 | 37905191 | 37598481 | 13q13.3 | ENSG00000133107 | ion channel (PC00227) | TRPC4 |
| 203 | 3 | 6782147 | 6765808 | replicated_SNPs 20p12 | ENSG00000125845 | growth factor (PC00207) | BMP2 |
| 1664 | 65 | 104067175 | 103394123 | 7q22 | ENSG00000189056 | Homo sapiens | RELN |
| 413 | 17 | 132534741 | 132066872 | 8q24 | ENSG00000184156 | voltage-gated potassium channel (PC00227); voltage-gated ion channel (PC00133) | KCNQ3 |
| 585 | 22 | 169750828 | 168996455 | 3q26.2 | ENSG00000085276 | KRAB box transcription factor (PC00218) | MECOM |
| 96 | 26 | 20284672 | 20132332 | Xp22.2-p22.1 | ENSG00000177189 | non-receptor serine/threonine protein kinase (PC00220); transfer/carrier protein (PC00137); non-receptor serine/threonine protein kinase (PC00193); annexin (PC00167); calmodulin(PC00219) | RPS6KA3 |
| 225 | 5 | 80478069 | 80465366 | 17q25.3 | ENSG00000171246 | antibacterial response protein (PC00090) | NPTX1 |
| 78 | 16 | 87988203 | 87847163 | 10q23.3 | ENSG00000171862 | protein phosphatase (PC00181); protein phosphatase (PC00195) | PTEN |
| Gene | Sequence | Position | SNP |
|---|---|---|---|
| TMPRSS4 | >>CTGTCTACCA(C):(T)TTTGGAGCAG>> | chr11:118,002,372..118,002,372 | rs11216779 |
| TRPC4 | >>atttctagcc(A):(G)ttattattcc>> | chr13:38,777,701..38,777,701 | rs2460316 |
| TRPC4 | >>gctggcaatg(A):(T)gtcagtacca>> | chr13:38,805,771..38,805,771 | rs2202120 |
| TRPC4 | >>gaaaatgagt(T):(G)gatacaaaca>> | chr13:38,814,602..38,814,602 | rs7320458 |
| TRPC4 | >>tggacaagac(A):(G)taaaaggaag>> | chr13:38,814,629..38,814,629 | rs7338934 |
| TRPC4 | >>gttctgacat(A):(G)tttctagtgt>> | chr13:38,814,687..38,814,687 | rs7336867 |
| TRPC4 | >>taagtcagaa(C):(T)ttggaactgc>> | chr13:38,814,817..38,814,817 | rs6563591 |
| TRPC4 | >>TATTCGATTC(A):(G)GAAAAATATG>> | chr13:38,804,435..38,804,435 | rs9315565 |
| >>ACAATTGTAT(A):(G)ACCAGTACAC>> | chr13:68,233,727..68,233,727 | rs17619273 | |
| PCDH9 | >>AAATTCGTCT(C):(G)AAATATAGCA>> | chr13:68,246,757..68,246,757 | rs17535905 |
| N Tagging SNPs | N Exons | Stop | Start | Position | Ensembl | Gene |
|---|---|---|---|---|---|---|
| 547 | 9 | 67369460 | 66163708 | 13q21.32 | ENSG00000184226 | PCDH9 |
| 393 | 11 | 37905191 | 37598481 | 13q13.3 | ENSG00000133107 | TRPC4 |
| 259 | 16 | 118132778 | 118069737 | 11q23.3 | ENSG00000137648 | TMPRSS4 |
Disclaimer/Publisher’s Note: The statements, opinions and data contained in all publications are solely those of the individual author(s) and contributor(s) and not of MDPI and/or the editor(s). MDPI and/or the editor(s) disclaim responsibility for any injury to people or property resulting from any ideas, methods, instructions or products referred to in the content. |
© 2024 by the authors. Licensee MDPI, Basel, Switzerland. This article is an open access article distributed under the terms and conditions of the Creative Commons Attribution (CC BY) license (https://creativecommons.org/licenses/by/4.0/).
Share and Cite
Drago, A.; Calabro, M.; Crisafulli, C. Calcium Signaling and Molecular Adhesion Processes May Hold the Key to Genetic Risk for Autism: A Molecular Pathway Analysis on Two Independent Samples. Genes 2024, 15, 1609. https://doi.org/10.3390/genes15121609
Drago A, Calabro M, Crisafulli C. Calcium Signaling and Molecular Adhesion Processes May Hold the Key to Genetic Risk for Autism: A Molecular Pathway Analysis on Two Independent Samples. Genes. 2024; 15(12):1609. https://doi.org/10.3390/genes15121609
Chicago/Turabian StyleDrago, Antonio, Marco Calabro, and Concetta Crisafulli. 2024. "Calcium Signaling and Molecular Adhesion Processes May Hold the Key to Genetic Risk for Autism: A Molecular Pathway Analysis on Two Independent Samples" Genes 15, no. 12: 1609. https://doi.org/10.3390/genes15121609
APA StyleDrago, A., Calabro, M., & Crisafulli, C. (2024). Calcium Signaling and Molecular Adhesion Processes May Hold the Key to Genetic Risk for Autism: A Molecular Pathway Analysis on Two Independent Samples. Genes, 15(12), 1609. https://doi.org/10.3390/genes15121609