Abstract
Drought is a major abiotic stress factor affecting the growth and development of plants at all stages. Developing a screening tool for identifying drought stress tolerance during seedling establishment is important in the deployment of rice varieties suited to water-limited growing environments. An experiment was conducted to evaluate 100 rice genotypes, mostly belonging to the tropical japonica subspecies, for drought stress tolerance using low-cost, pre-fabricated mini-hoop structures. The rice seedlings were subjected to two different soil moisture regimes- control pots managed at 100% and drought pots at 50% field capacity, from 12 to 30 days after sowing (DAS). Several morpho-physiological parameters including root traits were measured to assess the response of genotypes to drought stress. Significant moisture stress × genotype interactions were found for most of the parameters measured. A cumulative drought stress response index (CDSRI) was developed by adding the individual response indices of all cultivars. Based on CDSRI and standard deviation values, 5 and 28 genotypes were identified as highly sensitive and sensitive to drought, respectively, and 45 as moderately sensitive. On the other hand, 16 and 6 genotypes were classified as tolerant and highly tolerant to drought, respectively. Cheniere, a released cultivar, and RU1402174, an experimental breeding line, were identified as the least and most tolerant to drought among the 100 genotypes tested. Significant linear correlation coefficients were obtained between CDSRI and root growth parameters (R2 = 0.91, n = 100) and CDSRI with shoot growth parameters (R2 = 0.48, n = 100), revealing the importance of root traits in studying and identifying drought tolerant lines during the seedling establishment stages in rice. The tolerant rice genotypes identified will be valuable for rice scientists in studying the mechanism for early season drought as well as for rice breeders for developing new genotypes best suited under growing environments prone to early-season drought.
1. Introduction
Rice (Oryza sativa L.) is one of the most widely consumed cereal crops across the globe, providing a staple diet for almost half of the human population [1]. As an annual C3 crop of the Poaceae family, rice is diverse in adaptation, with rice growing occupying large areas in the tropics, subtropics, semiarid tropics, and temperate regions of the world [2]. Water is undoubtedly one of the most precious inputs that rice requires to grow optimally during its entire life cycle starting from sowing itself. Rice needs water, not only for its growth and development but also to be able to produce higher yields.
With the onset of climate change-related challenges, the intensity and frequency of droughts are predicted to increase in most of the rice-growing areas. Drought could extend further into water-limited irrigated areas with greater severity. For example, water scarcity already affects more than 23 million hectares of rainfed rice production area in South and Southeast Asia alone. In Africa, recurring drought affects about 80% of the potential 20 million hectares of rainfed lowland rice. Drought also affects rice production in Australia, China, USA, and many other countries. The world’s irrigated area per capita has decreased from 48 ha/1000 people in late 1970 to about 42 ha/1000 people in 2002 [3]. Therefore, drought stress is a primary constraint to rice production and yield stability and, while it is generally avoided in irrigated rice production belts, it is a consistent feature across much of the 63.5 million ha of rainfed rice sown annually, mostly in tropical Asia, Africa, and Latin America [4].
Rice originated in semi-aquatic environments and is commonly considered as being poorly adapted to limited water conditions [5]. Drought occurrence in rice can be in both upland and non-irrigated lowland systems and can affect early juvenile, reproductive, and grain developmental stages of the crop. To date, most of the drought research has been conducted at the latter stage looking at the stress effects on panicle initiation and anthesis and spikelet sterility [6,7]. However, in the US Midsouth, the majority of rice is drill-seeded or direct seeded, and permanent flooding is established after the four-leaf stage [8]. Therefore, similar to later growth stages, determining tolerance at the early seedling growth stage is crucial in achieving a greater rice yield. During the early vegetative growth stage, tillers are formed, crop stand is established, and organs for resource capture (leaf canopy and root system) are deployed for optimized growth. These processes also affect the resource availability during later crop development phases, through delays of flowering and maturity that can extend the growth cycle into the dry season [9]. During the vegetative phase, the rapid ground cover achieved with early vigor [10] can reduce soil evaporation, accelerate root access to soil water and nitrogen, and reduce competition with weeds [11]. Early vigor may also accelerate the rapid depletion of soil water reserves, making less water available for later crop stages [12]. Early-season vigor can thus, surely contribute to improving yield stability, more specifically in drought-prone environments. For ensuring above ground shoot and vigor parameters, any genotype needs a proper root anchorage. However, root systems for any crop are difficult to study because of their highly structured underground distribution pattern, the complexity of vigorous interactions with the immediate environment, and their functional diversity [13]. The root system of a rice plant, for example, consists of numerous nodal roots and their laterals. The growth direction of these nodal roots under the soil affects the spatial distribution of the root system, which seems to relate to yield. A vigorous root system typically improves exploration of the soil profile in search of water, and thus, possesses the potential for rapid emergence and stand establishment under limited soil moisture conditions [13]. To date, very little information has been available describing the effects of drought on rice root morphology and root-related traits at early growth stages. Therefore, a thorough understanding of how shoot and root parameters respond to early drought is important as these parameters provide a greater foundation for canopy development and are useful in improving selection criteria in the breeding of drought-tolerant cultivars.
Identifying rice varieties and breeding lines with promising levels of drought tolerance for use as donors in breeding and gene discovery is one of the main challenges for rice research [14]. However, little is known on how different traits express and respond under drought stress as well as on trade-offs of key traits with drought tolerance. For breeders, putative traits directly or indirectly contributing to yield are useful if they are easily measurable and correlated with yield while having greater genetic diversity than yield itself [15]. However, very little is known on the extent of genetic variation for vigor-related traits under drought stress among tropical japonica varieties - the primary varietal group used in commercial production in the US Midsouth. Earlier drought studies conducted on rice have primarily used genotypes belonging to the indica rice subspecies that is the most predominant rice subspecies grown worldwide.
We hypothesized that the potential variability in the genotypes could serve as a pre-breeding resource for the U.S Midsouth and similar rice-growing areas under limited irrigation conditions. The overall objective of the present study, therefore, was to explore the morphogenetic plant features of rice related to early vigor and trait expression under water-limited conditions among tropical japonicas. Specific objectives were to (1) screen different rice germplasm for drought stress tolerance based on their above and below-ground traits; (2) classify rice genotypes based on combined stress response index to limited water conditions, and (3) study the interrelationships among different morphometric traits. We expect that this information will be useful for identifying promising genetic donors for tolerance to responsiveness to limited moisture stress that can be used for breeding promising rice varieties.
2. Materials and Methods
2.1. Germplasm Used and Experimental Setup
A total of 100 rice genotypes were evaluated for response to drought during the summer of 2016. Of these, 95 belonged to the tropical japonica varietal group, four were indicas (El Paso 144, Inia Tacuari, IRGA409, and N-22), and one was a temperate japonica (Niponbare). Seventy of these genotypes were breeding lines under development while 30 were commercially released varieties. Of the latter, 25 were released for commercial use in the US Midsouth. The experiment was conducted using pre-fabricated mini-hoop structures (Figure 1) located at the Rodney Foil Plant Science Research facility of Mississippi State University, Mississippi State, USA (33°28′ N, 88°47′ W), MS, USA. Each structure consisted of a PVC framework with 4 MIL polythene wrapping having the dimensions of 2 m width × 1.5 m height × 5 m length. Space was enough to cover 300 pots in each structure and accommodate one experimental set of three replications. Fungicide-treated seeds were sown in 600 polyvinyl-chloride pots (15.2-cm diameter and 30.5-cm height) filled with the soil medium comprising of 3:1 sand/top soil classified as a sandy loam (87% sand, 2% clay, and 11% silt) and the bottom of each pot was filled with 500 g of gravel. Initially, five seeds were sown in each pot at optimum depth and, 7 days after emergence, the plants were thinned to one per pot. Plants were irrigated three times a day through an automated, computer-controlled drip system with full-strength Hoagland’s nutrient solution [16], delivered at 0800, 1200, and 1700 h until drought treatment was imposed on one set. After imposing drought treatment in the drought set, fertigation was managed through the real-time determination of the soil moisture status of the pots.

Figure 1.
Pre-fabricated and modular mini-hoop structures used in this study to assess drought stress effects on morpho-physiological traits of rice genotypes. Pot: a polyvinyl-chloride plastic pot of 15.2-cm diameter and 30.5-cm height.
2.2. Drought Treatments
All test rice genotypes were laid out in three replications using a completely randomized design in both the control and drought stress treatment. A similar experiment to screen the rice genotypes at vegetative stage under drought conditions using rainout structures was previously carried out, revealing the effectiveness of the experimental setup [17]. After the establishment of seedlings (12 days after sowing), the drought treatment was imposed by maintaining soil moisture at 50% until harvesting of the trial (30 days after sowing). The soil moisture status and the temperature in mini-hoop structures were monitored through real-time sensors (Model EM50R Soil Moisture and Temperature Sensor, Decagon Devices, Inc., Pullman, WA, USA) throughout the experiment. A summary of the soil moisture status of the trial is shown in Figure 2. The net solar radiation availability of approximately 97 percent under the mini-hoop structures is also monitored at various stages of the experiment using a light meter (Li-250A, LI-COR, Inc., Lincoln, NE, USA). Real-time temperature sensors were used to measure the diurnal temperature regimes and the average day temperature recorded was 33.2 °C, while the night temperatures hovered around 22.7 °C.
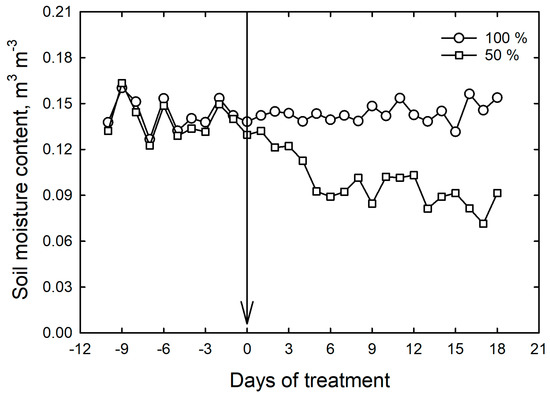
Figure 2.
Real-time management of soil moisture status of the trial under the control and drought treatments. The arrow indicates the day when the treatments were imposed. Bars indicate standard errors of the mean of ± three replications.
2.3. Measurements
2.3.1. Developmental Parameters
Plant height (PH), tiller number (TN), and leaf number (LN) were measured on the 28th day of sowing. Leaf area was measured using the LI-3100 leaf-area meter (LI-COR, Inc. Lincoln, NE, USA) on harvesting followed by measurement of plant components. Leaf dry weight (LDW), stem dry weight (SDW), shoot dry weight (SHDW) and total dry weights (TDW) were measured from all plants after oven drying at 75 °C until a constant weight was reached. From the shoot and root dry weight, root/shoot (RSR) was estimated in all the rice plants and treatments. To account for genotypic differences, all comparisons were done concerning the control.
2.3.2. Physiological Parameters
Instant chlorophyll measurements were recorded in all genotypes using a SPAD meter (SPAD 502 Minolta Inc., Ontario, Canada) on the 25th day after sowing. Chlorophyll fluorescence was measured using the Fluropen 1000 (Photo System Instruments, Kolackova, Czech Republic) for OJIP Analysis. Application of chlorophyll fluorescence fast-transient analysis (OJIP) is a simple and non-invasive tool for monitoring chloroplast function. The OJIP analysis is used as a sensitive, reliable, and quick test for the functionality and vitality of the photosynthetic system. Minimal Fluorescence Intensity (Fo), Maximal Fluorescence Intensity (Fm), Maximal Variable Fluorescence (Fv) and Fv/Fm were measured to get the maximum potential quantum efficiency of Photosystem II to derive clues about the stress effect on the experimental rice lines.
2.3.3. Root Image Capture and Analysis
After uprooting plants from columns, roots were cut and separated from the stems and washed carefully avoiding any disturbance to the root system. Longest root length (LRL) was measured using a metric ruler. The cleaned individual root systems were floated in 5 mm of water in a 0.3- by 0.2-m pre-cleaned Plexiglas tray. For a clear scan, roots were untangled and separated with a plastic paintbrush to minimize root overlap. The tray was placed on top of a specialized dual-scan optical WinRHIZO scanner (Regent Instruments, Inc. Quebec, Canada, 2009), linked to a computer software system. Gray-scale root images were acquired according to the same procedure described [13,18,19] previously by setting the parameters to high accuracy (resolution 800 × 800 dpi). Acquired images were analyzed using the WinRHIZO optical scanner and associated software for the cumulative root length (RCL), root surface area (RSA), average root diameter (ARD), root volume (RV), number of roots (RN), number of root tips (NRT), number of root forks (NRF), and number of root crossings (NRC).
2.4. Data Analysis, Terminology and Drought Tolerance Indices
The data from all measurements of root traits were recorded and compiled in Microsoft Excel 2016. Descriptive analysis including means, standard deviations (SD), coefficients of variation (CV), and analysis of variance (ANOVA), were calculated for the traits under control and drought treatments using SAS program [20] (v 9.4, SAS Institute, Inc., Cary, NC, USA, 2011) using a completely randomized design considering rice lines and drought as source of variance. Data were analyzed using a one-way ANOVA via PROC GLM in SAS to determine the effect of drought on the developmental, physiological, and root parameters. The Fisher’s protected least significant difference test at p = 0.05 was employed to test the differences among the treatments for the measured parameters. The standard errors of the mean were calculated using Sigma Plot 13.0 (Systat Software, Inc., San Jose, CA, USA, 2015) and presented in the figures as error bars.
2.5. Drought Response Characterization
All rice lines examined in the study were classified into different response groups based on their early stage individual response to the drought stress and subsequent summation of individual index values for each trait [21]. The Combined Drought Stress Response Indices (CDSRI) was calculated by adding Individual Drought Stress Response Indices (IDSRI) for all traits. Initially, IDSRI values for each parameter were calculated as the trait value of a parameter (Pvl) under drought for a given rice line divided by the trait value for the same parameter (Po) under controlled conditions as follow:
IDSRI = Pvl/Po; and CDSRI = (PH vl/PH o) + (TN vl/TN o) + (LN vl/LN o) + (LA vl/LA o) + ( LDW vl/LDW o) (SDW vl/SDW o) + (RDW vl/RDW o) + (SHDW vl/SHDW o) + (TDW vl/TDW o) + ( RS vl/RS o) (LRL vl/LRL o) + (F0 vl/F0 o) + (FM vl/FM o) + (FV vl/FV o) + (Fv/Fmvl/Fv/Fm o) (CRL vl/CRL o) + (RSA vl/RSA o) + (ARD vl/ARD o) + (RV vl/RV o) + (RN vl/RN o) (NRT vl/NRT o) + (NRF vl/NRF o) + (NRC vl/NRC o)
Based on the CDSRI values, rice genotypes were classified into five response groups viz highly sensitive, sensitive, moderately sensitive, tolerant, and highly tolerant.
3. Results
3.1. Performance of Rice Genotypes and Interaction with Drought
The analysis of variance for developmental traits revealed significant (p > 0.001) differences among the rice genotypes, drought treatments, and genotype × drought interaction for all traits except LN and SDW (p > 0.05) (Table 1). Among root traits, non-significant interactions were observed in RSA, ARD, NRT, LRL, and RN while for physiological traits, the non-significant interaction was observed in SPAD and Fv/Fm. Significant variation was observed for most traits among lines and even across experimental setups, indicating the presence of genetic variation, which could be exploitable through breeding.

Table 1.
Analysis of variance across the genotype, treatments, and their interaction for the morphological parameters measured viz plant height (PH, cm plant−1), tiller number (TN, no. plant−1), leaf number (LN, no. plant−1), leaf area (LA, cm2 plant−1), leaf dry weight (LDW, g plant−1), stem dry weight (SDW, g plant−1), root dry weight (RDW, g plant−1) shoot dry weight (SHDW, g plant−1), root/shoot ratio (RSR), total dry weights (TDW, g plant−1), cumulative root length (RCL, cm plant−1), average root diameter (ARD, mm plant−1), root volume (RV, cm3 plant−1), number of root tips (NRT, no. plant−1), number of root forks (NRF, no. plant−1), number of root crossings (NRC, no. plant−1), longest root length (LRL, cm plant−1), number of roots (RN, no. plant−1), chlorophyll content (SPAD), minimal fluorescence intensity (Fo), maximal fluorescence intensity (Fm), maximal variable fluorescence (Fv), and fluorescence (Fv/Fm). Measurements were taken at harvesting time, 28 days after sowing.
Pairwise correlations among the traits were calculated to assess the extent of interrelationships between the traits as continuous variables, which could potentially serve as a basis for indirect selection of promising lines. The developmental traits LA, PH, and TN, were positively correlated (p < 0.001) with all traits except LN (Supplementary file, Table S1). In root traits, the relationships between ARD and NRC (r = −0.04, n = 100), and between ARD and NRT (r = −0.03, n = 100) were found to be non-significant along with the relationship between RSR and NRT (r = 0.004, n = 100). The rest of the root traits had positive and significant correlations with r-values ranging from 0.055 to 0.736. Among the physiological traits, Fv/Fm exhibited non-significant correlation with most of the traits while SPAD had negative and significant correlation with Fo (r = 0.15, p < 0.01, n = 100), Fm (r = 0.13, p < 0.01, n = 100) and Fv (r = 0.13, p < 0.01, n = 100) (Supplementary file, Table S1).
3.2. Developmental Traits
All the developmental traits like PH, TN, LA, LDW, and SDW were affected by drought imposition except LN that more or less remained constant across treatments and even across genotypes (Supplementary file, Tables S2 and S3). Under drought conditions, PH ranged from 9.23 cm (RU0603075) to 25.50 cm (N-22), with an overall mean of 14.66 cm while the average PH under the control treatment was 21.02 cm. Maximum PH reduction of 11.50 cm was observed in RU1305001. Under drought conditions, 43% of the rice genotypes exceeded the average PH value of 14.66 cm. LA was also drastically reduced in all genotypes under drought conditions and ranged from 40.05 cm2 (RU1504194) to 210.40 cm2 (CL Jazzman), with an average of 104.54 cm2 as compared to average LA of 294.30 cm2 under the control treatment. Maximum reduction of 253% was observed in the genotype RU1303138. LA changes under drought treatment corresponded with the respective changes in LDW, with genotype RU1504194 having the lowest LDW of 0.41 g while the maximum reduction of 2.633 g was observed in CL Jazzman. The average decline of 2.09 g was observed for TDW, and maximum impact of drought treatment was observed on the genotype CL Jazzman (5.90 g). Thus, there was coherence of LA and TDW responses on the same genotype. Under drought conditions, maximum TDW of 3.39 g was observed for N-22, and minimum TDW of 1.49 g was expressed by LA 2008. Under drought condition, RSR changed significantly with an average increment of 86%. The minimum RSR under drought was expressed by 14CLPYT033 (0.129) and the maximum by RU1404196 (0.555), with an average value of 0.369 as compared to 0.198 under control conditions.
3.3. Root Traits
Major root growth parameters like RCL, RSA, and RN were severely affected by drought stress conditions in most of the rice genotypes. Average RCL in controlled conditions was 6009 cm as compared to 5498 cm under drought. Under drought conditions, maximum RCL of 7455 cm was expressed by genotype N-22 and minimum CRL of 3136 cm by Cheniere (Table 2 and Supplementary file, Table S4). The ARD of 0.50 mm was found to be similar under both control and drought stress treatments, with the genotype RU1401067 having the maximum ARD of 0.52 mm. Drastic reduction in RN was observed under drought conditions where it ranged between 20 and 50, with an average RN of 32. Maximum RN under drought was found in the genotype N-22, and minimum RN was in RU1401090. Plant roots optimize their architecture to acquire water and essential nutrients. Under drought conditions, the number of forks and crossings differed significantly among the rice genotypes, with genotype RU1204197 having maximum NRF of 89,898 and the genotype RU1402005 with minimum NRF of 13,078 and average NRF of 63,434 under drought conditions (Supplementary file, Table S4). A significant reduction was observed in NRC between the control (7076) and drought treatment (4603). There was no significant effect of drought on NRT, with the genotype GSOR100417 having maximum NRT of 47,327 and genotype Cheniere with minimum NRT of 18,491 under drought conditions, as compared to the average NRT of 32,059 under control conditions.
Table 2.
Classification of rice genotypes into five drought response groups based on the cumulative drought stress response index (CDSRI), along with individual scores in parenthesis.
3.4. Physiological Traits
In the present study, significant differences were observed among all genotypes under control and drought condition though with a narrow range. Under drought conditions, the maximum SPAD was observed for genotype RU1301084 (45.73) and the minimum in genotype Niponbare (32.83), with an average value of 41.00, which is higher than the control average of 38.78. Fv/Fm ratio under drought conditions averaged at 0.692 with the maximum value in genotype CL271 and minimum in RU1504100, with 73% of the genotypes falling below the average values (Supplementary file, Table S2). Individually, Fv and Fm result under both control and drought conditions were significant for cultivars as well as for their genotype × drought interactions (Table 1, Supplementary file, Table S5).
3.5. Root Traits Using Image Analysis
In the present study, scanner-based root image analysis was used to unravel the architecture of rice genotypes. The visual appearance of root scan results revealed correspondence of early vigor parameters with the root scan images among the respective response group genotypes, wherein CDRI values were effective in classifying the genotypes based on the overall responses (Figure 3). The genotype (GSOR 10758) and rice breeding line (RU 1402174) contributed a strong, well-structured root system and higher abundant root hairs while genotypes (CHENERY, CL 151) and rice breeding line RU 1,401,161 exhibited a less-structured root system with reduced RN and RNL at the drought treatment (Figure 3). Comparatively, all rice breeding lines and genotypes designated as drought tolerant in the current study revealed larger, more robust and branched root systems with higher values for root parameters, whereas drought sensitive rice breeding line and genotypes showed less organized root structures with low values for root parameters.

Figure 3.
Representative scanned root images from control and drought sets in each drought stress response classes, (A) highly sensitive, (B) sensitive, (C) moderately sensitive, (D) tolerant, and (E) highly tolerant groups.
3.6. Classification of Rice Genotypes Based on Drought Response
Using mini-hoop structures in combination with developmental, root, and physiological traits, this study effectively developed a scoring system for early season drought tolerance in rice. Results indicated that by using two indices (CDSRI and IDSRI), all rice genotypes could be classified into different groups viz highly sensitive, sensitive, moderately sensitive, tolerant, and highly tolerant to drought based on their cumulative response for all shoot and root parameters. The CDSRI values ranged from 14.70 (highly sensitive) for the genotype Cheniere to 27.96 (highly tolerant) for the genotype RU1402174. Based on the resilience to drought, six genotypes were classified as highly drought tolerant and five genotypes were grouped in the highly sensitive class, with the majority of genotypes (45) falling under moderate response class (Table 2). The correlation coefficient (r2) between the combined root drought response index and cumulative drought stress response index using CDSRI for drought tolerance was positively correlated (r2 = 0.91 for root and r2 = 0.48 for shoot at p = 0.0001, n = 100) This implies the greater importance of root parameters than shoot parameters in identifying drought tolerant rice lines using these indices. The plot of shoot drought response index relative to the root drought stress response index also revealed a positive correlation coefficient (r2 = 0.45, p = 0.0001, n = 100) (Figure 4 and Figure 5).
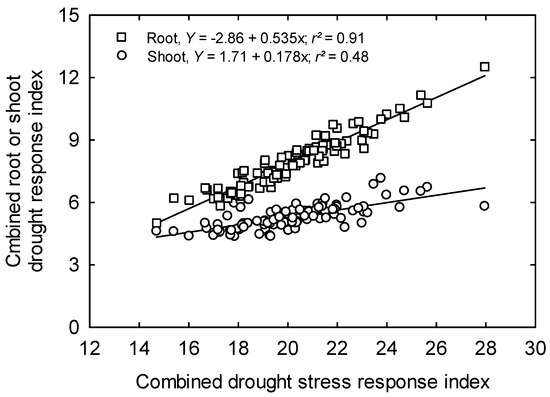
Figure 4.
The relationship between cumulative drought response index and cumulative drought stress response index of root and shoot indices of 100 elite rice genotypes.

Figure 5.
The relationship between root and shoot drought response index of 100 elite rice genotypes.
4. Discussion
In the southern US, where rice is grown on more than two million acres (>809,000 hectares), almost all the varieties cultivated belong to the tropical japonica subspecies or varietal grouping. Tropical japonica rice, however, has not been well characterized for drought stress tolerance-related traits, in general, and using mini-hoop structures, in particular. This study is the first to screen a wide array of rice genotypes of diverse origin in a perfect or uniform phenotypic platform, with all traits closely monitored across treatments with desired automation. Therefore, assessing genetic variability for drought tolerance using this methodology in tropical japonicas could be important, not only for commercial cultivation under current drought-challenged conditions but also for the future development of tropical japonica varieties suited for water-limited environments and cropping systems requiring less water in the future.
Many studies have been done on drought stress in rice, but all these involved different methodologies, both in the field [15] and greenhouse [22,23]. Achieving early vigor quickly and accumulating biomass rapidly will be critical factors under both normal and stressed rice [24]. Recently, using mini-hoop structures has been found as an effective approach for studying the effect of drought conditions on some crops such as high-value off-season vegetables like French bean and amaranth [25]. In Mississippi, tropical japonica varieties were grown on almost 200,000 acres in 2016 [26]. Tropical japonica rice, however, has not been well characterized for drought stress tolerance-related traits, in general, and using mini-hoop structures, in particular. Moreover, physiological expression of rice genotypes and its suitable interpretation in rice breeding perspective can lead to more reliable control of water-stress severity and duration at the critical growth stages, and this will result in the development and utilization of effective selection measures on a longer-term basis [27].
4.1. Performance of Rice Genotypes and Interaction with Drought
Drought occurring at different stages of crop development, in different soil types, and under diverse management regimes, affects crop growth differently. Identifying the combination(s) of favorable morphological traits from different available germplasm pools can lead to obtaining sustainable rice yields [28,29]. The results of the analysis of variance for developmental traits may be expected at early stages since the leaf number and above ground weight per se were constant across lines and over treatments. Among root traits, the non-significant interaction was observed in RSA, ARD, NRT, LRL, and RN while for physiological traits, non-significant interaction was observed in SPAD and Fv/Fm. Significant variation was observed for most traits among lines and even across experimental setups, indicating the presence of genetic variation, which could be exploitable through breeding both using exclusively tropical japonicas as parents and using identified tropical japonica genotypes to improve drought tolerance of indica and temperate japonica germplasm. The results of pairwise correlations among the developmental traits LA, PH, and TN with all traits are indicating that the canopy architecture attributes are complementing each other, which can lead to enhanced biomass accumulation during early vegetative stages of the rice life cycle. The drought tolerance of rice plants is always associated with constitutive and plant-type traits, like rooting depth, root thickness, leaf area, plant height, and flowering time [30]. The correlation analysis can be necessary to determine the direction of selection and the numbers of characteristics that need to be considered in improving any important plant character. For plant breeders, component traits directly or indirectly contributing to yield are useful if they are easily measurable and correlated with each other while having greater genetic diversity than yield itself [13].
4.2. Developmental Traits
Abiotic stresses like drought can affect the physiological status of an organism and certainly have adverse effects on growth, development, and metabolism [31]. Negative effects of water deficit on mineral nutrition and metabolism drastically affect the plant developmental features like plant height and leaf area and alter assimilate partitioning among the plant organs [32]. All the developmental traits like PH, TN, LA, LDW, and SDW were affected by drought imposition except LN, which more or less remained constant across treatments and even across genotypes. These findings are in agreement with Islam [33] that found moisture stress in early vegetative stages to hamper plant height due to the inhibition of the increase in cell length as well as to the reduction in cell division under water deficit. LA was also drastically reduced in all genotypes under drought conditions. The drastic reduction of leaf area can be attributed to limited photosynthesis due to a decline in Rubisco activity [34]. The activity of the photosynthetic electron transport chain is finely tuned to the availability of CO2 in the chloroplast and change in photosystem II under drought conditions [35].
Leaf area being an important benchmark for virtual plant performance under drought as leaf area declines according to the onset and rate of senescence, thus determining the amount of green leaf area maintained throughout plant life [36]. Water stress can also affect leaf area by speeding the rate of leaf senescence [37]. Farooq et al. [38] suggested that total dry biomass could be exploited as a stress parameter to estimate drought tolerance. Under drought stress, the reduction in the dry matter can be attributed to the reduction of leaf area leading to slow photosynthesis rate resulting in limited assimilates under drought [39]. Under drought condition, RSR changed significantly with an average increment of 86%. This increase in RSR can be attributed to the increase in dry matter and soluble sugars in roots under drought conditions because of an increase in leaf sucrose phosphate synthase and root invertase activity resulting in more sucrose availability for transport from leaves to roots [40].
4.3. Root Traits
Roots play a crucial role in mineral and water acquisition and are targeted to enhance plant productivity under a diverse range of growing conditions including drought [41]. Under different types of prevailing drought stress, plasticity in root length density or total root length [42] and lateral root length and branching [43] have always been observed to improve shoot biomass, water uptake, and photosynthesis under drought in rice. Major root growth parameters like RCL, RSA, and RN were severely affected by drought stress conditions in most of the rice genotypes. Generally, if root length exceeds a certain size, the branching process starts by initiation, emergence, and growth of lateral roots from the root pericycle and epidermis [44]. Lateral roots are responsible for the capturing larger quantities of water and nutrient absorption [45] as they account for approximately 77% of the surface area of the root system in any crop under all prevailing crop growing conditions [46]. In water-stressed soils, there is reduced oxygen supply, with a physical barrier like hardpans, and generally poor adaptation of roots to the aerobic condition. These in turn limit exploitation of deeper soil layers, hence reducing root length and biomass production [47]. The ARD of 0.50 mm was found to be similar under both control and drought stress treatments, with the genotype RU1401067 having the maximum ARD of 0.52 mm. This finding suggests that the comparable values of ARD under stress are probably because of enhanced cell elongation that provides drought resistance because of enhanced penetration ability [48]. Drastic reduction in RN was observed under drought conditions. Plant roots optimize their architecture to acquire water and essential nutrients. The number of root forks, tips, and crossings plays an important role in root architecture as they have the potential to enhance penetration through soil layers, resulting in a positive effect on plant nutrient uptake. Under drought conditions, unlike NRT the number of forks and crossings differed significantly among the rice genotypes.
4.4. Physiological Traits
Many physiological factors may be responsible for drought stress injury as drought stress both damages the photosynthetic apparatus and diminish chlorophyll content [49]. The multiplicity of crop growth factors involved in drought stress injury suggests that screening studies of many kinds may be useful for characterizing drought resistance [50]. In the present study, significant differences were observed among all genotypes under control and drought condition though with a narrow range. The decline in SPAD values is a progressive phenomenon under drought conditions as chlorophyll degradation is one of the consequences of drought stress that may result from sustained photo-inhibition and photo-bleaching [51]. Even though other plant processes, like cell division and cell expansion, are the earliest to respond to water deficit stress, a decline in SPAD index is a sensitive and readily measurable trait that could be used to screen for stress tolerance [27]. Chlorophyll fluorescence measurements of Fv/Fm represent the maximum photochemical efficiency of PSII and in turn indicate that the effect of drought stress in the fluorescence parameter Fv/Fm, which is a measure of cumulative photo-oxidative damage to PSII [52]. For Fv/Fm, 73 percent of the genotypes fell below the average value under induced drought conditions. Drought stress generally results in decreased Fv/Fm ratio, which will be mainly expressed in drought-susceptible genotypes. Stress-induced reduction in Fv/Fm is an indication of photoinhibition associated with an over-reduction of PSII [53]. The ability to maintain high Fv/Fm under drought stress thus indicates a high efficiency of radiation use, possibly for photochemistry and carbon assimilation. Colom and Vazzana [54] reported similar correlations between Fv/Fm and drought tolerance in Weeping lovegrass cultivars, with high Fv/Fm values being associated with drought tolerance and low Fv/Fm values being associated with susceptibility to drought stress. Individually, Fv and Fm result under both control and drought conditions were significant for cultivars as well as for their genotype × drought interactions.
4.5. Classification of Rice Genotypes Based on Drought Response
Present systems for classifying genotypes for drought tolerance include filed based rating scales such as those in the Standard Evaluation System [55]. The identified tolerant genotypes in this study could withstand early season drought stress under dry direct seeding practice. Moreover, farmers could use the identified tolerant genotypes to manipulate flushing practice following planting. Using mini-hoop structures in combination with developmental, root, and physiological traits, this study effectively developed a scoring system for early season drought tolerance in rice. The rice breeding lines (RU1402195, RU1401145, and RU1402174) and genotypes (INIA Tacuari, CL163, and N-22) were identified to be the most drought tolerant genotypes in the present study. Thus, they may be used along with other water-saving strategies to improve crop yields in commercial rice production. The cultivar N-22 is a rice genetic donor that has been used extensively in previous drought response studies and has shown tolerance to heat and other stresses as well [56]. Singh et al. [6] and Massey et al. [57] have also determined similar or higher yields for (RU1104122, CL151, CL142-AR, and CL111) when grown under intermittent flooding as compared to continuous flooding. The high and very high drought tolerant rice breeding lines and genotypes in this study may have inherent tolerance under variable drought levels, which could let them fit well with different water saving strategies.
5. Conclusions
The screening of 100 rice genotypes in this study revealed ample genetic diversity in concerning their response for all traits measured under early season drought stress. The low-cost prefabricated module used as a screening platform enabled efficient dissection of plant traits. Drought exposure significantly affected all the genotypes for the growth parameters that influenced processes essential for healthy canopy establishment, which subsequently is pivotal for reproductive growth and final yield recovery. Root scan imaging using WinRHIZO revealed extensive insight into the functional architecture of roots under stress and results revealed coherence of the scan capture with the overall performance of the genotype that can potentially be exploited for screening purposes. Based on the CDSRI-based classification, the genotypes N-22 and RU1402174 were the most tolerant concerning most of the traits measured under drought stress and Cheniere was the most sensitive among the genotypes to drought. Retrospective insight on the phenotypic potential of a genotype is essential for its effective use to meet research objectives. Thorough early season drought stress tolerance screening using the platform in this study resulted in the identification of promising genotypes that can be harnessed by breeders for increasing the level and improving the sustainability of rice production to meet future demands. Further, there is a need to test these rice genotypes under different growth stages by including a reproductive period for their response to soil moisture stress conditions.
Supplementary Materials
The following are available online at https://www.mdpi.com/2073-4395/9/4/199/s1, Table S1: Pairwise correlations among various growth, developmental, and physiological traits of 100 rice lines and genotypes. Measurements were taken at harvest, 28 days after sowing. Table S2: Drought stress effects on morpho-physiological parameters measured at the harvest, 28 days after sowing. Plant height (PH, cm plant−1), leaf area (LA, cm2 plant−1), total dry weight (TDW, g plant−1), root surface area (RSA, mm2 plant−1), root volume (RV, mm3 plant−1), total chlorophyll content (SPAD), and quantum efficiency (Fv/Fm). Table S3: Drought stress effects on morphological parameters measured viz tiller number (TN, no. plant−1), leaf number (LN, no. plant−1), leaf dry weight (LDW, g plant−1), stem dry weight (SDW, g plant−1), and shoot dry weight (SHDW, g plant−1). Table S4: Drought stress effects on root parameters viz cumulative root length (RCL, cm plant−1), average root diameter (ARD, mm plant−1), number of root tips (NRT, no. plant−1), number of root forks (NRF, no. plant−1), number of root crossings (NRC, no. plant−1), longest root length (LRL, cm plant−1), number of roots (RN, no. plant−1), root dry weight (RDW, g plant-1), and root-shoot ratio (RSR). Measurements were taken at harvesting time, 28 days after sowing. Table S5: Drought stress effects on physiological parameters measured viz. minimal fluorescence intensity (Fo), maximal fluorescence intensity (Fm), and maximal variable fluorescence (Fv). Measurements were taken at 28 days after sowing.
Author Contributions
Conceptualization, K.R.R.; Methodology, K.R.R.; A.A.L.; S.H.J.; C.W.; S.T. and E.D.R.; Software and Formal Analysis, A.A.L.; S.H.J.; C.W.; K.R.R. and S.T.; Investigation, K.R.R.; A.A.L.; S.H.J. and S.T.; Resources, K.R.R.; Data Curation, K.R.R.; Writing-Original Draft Preparation, A.A.L. and C.W; Writing-Review & Editing, A.A.L., C.W.; S.H.J.; S.T.; E.D.R.; and K.R.R.; Supervision, K.R.R.; Project Administration, K.R.R.; Funding Acquisition, K.R.R., and E.D.R.
Funding
This work was partially supported by the USDA NIFA (2016-34263-25763 and MIS 043040), Mississippi Rice Promotion Board, and the MAFES-SRI, Mississippi State, MS.
Acknowledgments
We thank David Brand for technical assistance and graduate students of the Environmental Plant Physiology Lab at Mississippi State University for their support during data collection. This article is a contribution from the Department of Plant and Soil Sciences, Mississippi State University, Mississippi Agricultural, and Forestry Experiment Station.
Conflicts of Interest
The authors declare no conflict of interest.
References
- Song, Z.P.; Lu, B.R.; Zhu, Y.G.; Chen, J.K. Gene flow from cultivated rice to the wild species Oryza rufipogon under experimental field conditions. New Phytol. 2003, 157, 657–665. [Google Scholar] [CrossRef]
- Muthayya, S.; Sugimoto, J.D.; Montgomery, S.; Maberly, G.F. An overview of global rice production, supply, trade, and consumption. Ann. N. Y. Acad. Sci. 2014, 1324, 7–14. [Google Scholar] [CrossRef] [PubMed]
- Gleick, P.H. Water in Crisis. A Guide to the World’s Fresh Water Resources; Oxford University Press: New York, NY, USA, 1993. [Google Scholar]
- Narciso, J.; Hossain, M. World Rice Statistics. IRRI, 2002. Available online: http://ricestat.irri.org:8080/wrs/ (accessed on 19 July 2017).
- Lafitte, H.R.; Yongsheng, G.; Yan, S.; Li, Z. Whole plant responses, key processes, and adaptation to drought stress: The case of rice. J. Exp. Bot. 2007, 58, 169–175. [Google Scholar] [CrossRef]
- Wu, N.; Guan, Y.; Shi, Y. Effect of water stress on physiological traits and yield in rice backcross lines after anthesis. Energy Procedia 2011, 5, 255–260. [Google Scholar] [CrossRef]
- Singh, S.; Prasad, S.; Yadav, V.; Kumar, A.; Jaiswal, B. Effect of drought stress on yield and yield components of rice (Oryza sativa L.) genotypes. Int. J. Curr. Microbiol. Appl. Sci. 2018, 7, 2752–2759. [Google Scholar]
- Singh, B.; Reddy, K.R.; Redona, E.D.; Walker, T. Screening of rice cultivars for morpho-physiological responses to early-season soil moisture stress. Rice Sci. 2017, 24, 322–335. [Google Scholar] [CrossRef]
- Finch-Savage, W.E.; Clay, H.A.; Lynn, J.R.; Morris, K. Towards a genetic understanding of seed vigour in small-seeded crops using natural variation in (Brassica oleracea). Plant Sci. 2010, 179, 582–589. [Google Scholar] [CrossRef]
- Wopereis, M.C.S.; Kropff, M.J.; Maligaya, A.R.; Tuong, T.P. Drought-stress responses of two lowland rice cultivars to soil water status. Field Crops Res. 1996, 46, 21–39. [Google Scholar] [CrossRef]
- Shipley, B. Net assimilation rate, specific leaf area and leaf mass ratio: Which is most closely correlated with relative growth rate? A meta-analysis. Funct. Econ. 2006, 20, 565–574. [Google Scholar] [CrossRef]
- Zhang, Z.; Qu, X.; Wan, S.; Chen, L.; Shu, Y. Comparison of QTL controlling seedling vigour under different temperature conditions using recombinant inbred lines in rice (Oryza sativa). Ann. Bot. 2005, 95, 423–429. [Google Scholar] [CrossRef]
- Wijewardana, C.; Hock, M.; Henry, B.; Reddy, K.R. Screening corn hybrids for cold tolerance using morphological traits for early-season seeding. Crop Sci. 2015, 55, 851–867. [Google Scholar] [CrossRef]
- Serraj, R.; Atlin, G. Drought-resistant rice for increased rainfed production and poverty alleviation: A concept note. In Drought Frontiers in Rice: Crop Improvement for Increased Rainfed Production; Serraj, R., Bennett, J., Hardy, D., Eds.; IRRI: Los Banos, Philippines, 2008; pp. 385–400. [Google Scholar]
- Tuberosa, R.; Salvi, S.; Sanguineti, M.C.; Landi, P.; Maccaferri, M.; Conti, S. Mapping QTLs regulating morpho-physiological traits and yield: Case studies, shortcomings, and perspectives in drought-stressed maize. Ann. Bot. 2002, 89, 941–963. [Google Scholar] [CrossRef]
- Hewitt, E.J. Sand and Water Culture Methods Used in the Study of Plant Nutrition; Tech. Comm, No. 22; Commonwealth Bureau of Horticulture and Plantation Crops, Commonwealth Agriculture Bureau Farnham Royal: Buckinghamshire, UK, 1952.
- Bunnag, S.; Pongthai, P. Selection of rice (Oryza sativa L.) cultivars tolerant to drought stress at the vegetative stage under field conditions. Am. J. Plant Sci. 2013, 4, 1701–1708. [Google Scholar] [CrossRef]
- Brand, D.; Wijewardana, C.; Gao, W.; Reddy, K.R. Interactive effects of carbon dioxide, low temperature, and ultraviolet-B radiation on cotton seedling root and shoot morphology and growth. Front. Earth Sci. 2016, 10, 607–620. [Google Scholar] [CrossRef]
- Reddy, K.R.; Brand, D.; Wijewardana, C.; Gao, W. Temperature effects on cotton seedling emergence, growth, and development. Agron. J. 2017, 109, 1379–1387. [Google Scholar] [CrossRef]
- SAS Institute. SAS Guide to Macro Processing; SAS Institute: Cary, NC, USA, 2011; Volume 11. [Google Scholar]
- Raman, A.; Verulkar, S.B.; Mandal, N.P.; Variar, M.; Shukla, V.; Dwivedi, J.; Singh, B.N.; Singh, N.O.; Pamini, S.; Mall, K.A.; et al. Drought yield index to select high yielding rice lines under different drought stress severities. Rice 2012, 5, 31. [Google Scholar] [CrossRef]
- Farooq, M.; Wahid, A.; Kobayashi, N.; Fujita, D.; Basra, S.M.A. Plant drought stress effects, mechanisms, and management. Agron. Sustain. Dev. 2009, 29, 185–212. [Google Scholar] [CrossRef]
- Luciano, L.B.G.; Su, S.; Wu, C.; Hsieh, C. Establishment of a rapid screening method for drought tolerance of rice genotypes at seedling stage. J. Int. Coop. 2012, 7, 107–122. [Google Scholar]
- Rebolledo, M.C.; Dingkuhn, M.; Pere, P.; Mcnally, K.L.; Luquet, D. Developmental dynamics and early growth vigour in rice. I. relationship between development rate (1/Phyllochron) and growth. J. Agron. Crop Sci. 2012, 198, 374–384. [Google Scholar] [CrossRef]
- Yadav, R.K.; Kalia, P.; Choudhary, H.; Brihama, Z.H. Low-cost polyhouse technologies for higher income and nutritional security. Int. J. Agric. Food Sci. Technol. 2014, 5, 191–196. [Google Scholar]
- Redoña, E.D.; Golden, B.R.; Dickey, Z.D.; Smith, W.E.; Glenn, J.; Lanford, L.S. Mississippi Rice: Variety Trials (2016); Information Bulletin No. 517; Mississippi Agricultural and Forestry Experiment Station, Mississippi State University: Starkville, MS, USA, 2017; 18p. [Google Scholar]
- O’Neill, P.M.; Shanahan, J.F.; Schepers, J.S. Use of chlorophyll fluorescence assessments to differentiate corn hybrid response to variable water conditions. Crop Sci. 2006, 46, 681–687. [Google Scholar] [CrossRef]
- Kamoshita, A.; Rodriguez, R.; Yamauchi, A.; Wade, L. Genotypic variation in response of rainfed lowland rice to prolonged drought and rewatering. Plant Prod. Sci. 2004, 7, 406–420. [Google Scholar] [CrossRef]
- Serraj, R.; McNally, K.L.; Slamet-Loedin, I.; Kohli, A.; Haefele, S.M.; Atlin, G.; Kumar, A. Drought resistance improvement in rice: An integrated genetic and resource management strategy. Plant Prod. Sci. 2011, 14, 1–14. [Google Scholar] [CrossRef]
- Kamoshita, A.; Babu, R.C.; Boopathi, N.M.; Fukai, S. Phenotypic and genotypic analysis of drought-resistance traits for development of rice cultivars adapted to rainfed environments. Field Crops Res. 2008, 109, 1–23. [Google Scholar] [CrossRef]
- Chutia, J.; Borah, S.P. Water stress effects on leaf growth and chlorophyll content but not the grain yield in traditional rice (Oryza sativa Linn.) genotypes of Assam, India II. Protein and proline status in seedlings under PEG induced water stress. Am. J. Plant Sci. 2012, 3, 971–980. [Google Scholar] [CrossRef]
- Zain, N.A.M.; Ismail, M.R.; Mahmood, M.; Puteh, A.; Ibrahim, M.H. Alleviation of water stress effects on mr220 rice by application of periodical water stress and potassium fertilization. Molecules 2014, 19, 1795–1819. [Google Scholar] [CrossRef] [PubMed]
- Islam, M.T. Plant Water Relation Studies in Diverse Rice Cultivars under Bangladesh Climatic Conditions. Ph.D. Thesis, Institute of Agronomy, University of Agricultural Sciences, Vienna, Austria, 1999. [Google Scholar]
- Bota, J.; Medrano, H.; Flexas, J. Is photosynthesis limited by decreased Rubisco activity and RuBP content under progressive water stress? New Phytol. 2004, 162, 671–681. [Google Scholar] [CrossRef]
- Loreto, F.; Tricoli, D.; Di, M.G. On the relationship between electron transport rate and photosynthesis in leaves of the C4 plant (Sorghum bicolor) exposed to water stress, temperature changes and carbon metabolism inhibition. Aust. J. Plant Physiol. 1995, 22, 885–892. [Google Scholar] [CrossRef]
- Borrell, A.K.; Hammer, G.L.; Douglas, A.C.L. Does maintaining green leaf area in sorghum improve yield under drought? I. Leaf growth and senescence. Crop Sci. 2000, 40, 1026–1037. [Google Scholar] [CrossRef]
- Murty, P.S.S.; Murty, K.S. Spikelet sterility in relation to nitrogen and carbohydrate contents in rice. Ind. J. Plant Physiol. 1982, 25, 40–48. [Google Scholar]
- Farooq, M.; Kobayashi, N.; Ito, O.; Wahid, A.; Serraj, R. Broader leaves result in better performance of indica rice under drought stress. J. Plant Physiol. 2010, 167, 1066–1075. [Google Scholar] [CrossRef] [PubMed]
- Mostajeran, A.; Rahimi-Eichi, V. Effects of drought stress on growth and yield of rice (Oryza sativa L.) cultivars and accumulation of proline and soluble sugars in sheath and blades of their different ages leaves. Am. Eurasian J. Agric. Environ. Sci. 2009, 5, 264–272. [Google Scholar]
- Xu, W.; Cui, K.; Xu, A.; Nie, L.; Huang, J.; Peng, S. Drought stress condition increases root to shoot ratio via alteration of carbohydrate partitioning and enzymatic activity in rice seedlings. Acta Physiol. Plant. 2015, 37, 9. [Google Scholar] [CrossRef]
- Paez-Garcia, A.; Motes, C.; Scheible, W.R.; Chen, R.; Blancaflor, E.; Monteros, M. Root traits and phenotyping strategies for plant improvement. Plants 2015, 4, 334–355. [Google Scholar] [CrossRef] [PubMed]
- Tran, T.T.; Kano-Nakata, M.; Suralta, R.R.; Menge, D.; Mitsuya, S.; Inukai, Y.; Yamauchi, A. Root plasticity and its functional roles were triggered by water deficit but not by the resulting changes in the forms of soil N in rice. Plant Soil 2014, 386, 65–76. [Google Scholar] [CrossRef]
- Kano-Nakata, M.; Inukai, Y.; Wade, L.; Siopongco, J.D.; Yamauchi, A. Root development, water uptake, and shoot dry matter production under water deficit conditions in two CSSLs of rice: Functional roles of root plasticity. Plant Prod. Sci. 2011, 14, 307–317. [Google Scholar] [CrossRef]
- Abe, J.; Morita, S. Growth direction of nodal roots in rice: Its variation and contribution to root system formation. Plant Soil 1994, 165, 333–337. [Google Scholar] [CrossRef]
- Yoshida, S.; Hasegawa, S. The rice root system: Its development and function. In Drought Resistance in Crops with Emphasis on Rice; International Rice Research Institute: Manila, Philippines, 1982; pp. 97–114. [Google Scholar]
- Parker, J.S.; Alison, C.C.; Liam, D.; Keith, R.; Claire, S.G. Genetic interactions during root hair morphogenesis in Arabidopsis. Plant Cell Online 2000, 12, 1961–1974. [Google Scholar] [CrossRef]
- Samson, B.; Wade, L. Soil physical constraints affecting root growth, water extraction, and nutrient uptake in rainfed lowland rice. In Rainfed Lowland Rice: Advances in Nutrient Management Research; Ladha, J.K., Wade, L.J., Dobermann, A., Reinhardt, W., Kirk, W., Piggin, C., Eds.; International Rice Research Institute: Manila, Philippines, 1998; pp. 231–244. [Google Scholar]
- Clark, L.J.; Price, A.H.; Steele, K.A.; Whalley, W.R. Evidence from near-isogenic lines that root penetration increases with root diameter and bending stiffness in rice. Fun. Plant Biol. 2008, 35, 1163–1171. [Google Scholar] [CrossRef]
- Fu, J.; Huang, B. Involvement of antioxidants and lipid peroxidation in the adaptation of two cool-season grasses to localized drought stress. Environ. Exp. Bot. 2001, 45, 105–114. [Google Scholar] [CrossRef]
- Hura, T.; Grzesiak, S.; Hura, K.; Thiemt, E.; Tokarz, K.; Wȩdzony, M. Physiological and biochemical tools useful in drought-tolerance detection in genotypes of winter triticale: Accumulation of ferulic acid correlates with drought tolerance. Ann. Bot. 2007, 100, 767–775. [Google Scholar] [CrossRef] [PubMed]
- Long, S.P.; Humphries, S.; Falkowski, P.G. Photoinhibition of photosynthesis in nature. Ann. Rev. Plant Physio. Biol. 1994, 45, 633–662. [Google Scholar] [CrossRef]
- Ambavaram, M.M.R.; Basu, S.; Krishnan, A.; Ramegowda, V.; Batlang, U.L.; Rahman, A.P. Coordinated regulation of photosynthesis in rice increases yield and tolerance to environmental stress. Nat. Commun. 2014, 5, 5302. [Google Scholar] [CrossRef] [PubMed]
- Maxwell, K.; Johanson, G.N. Chlorophyll fluorescence-a practical guide. J. Exp. Bot. 2000, 51, 659–668. [Google Scholar] [CrossRef] [PubMed]
- Colom, M.R.; Vazzana, C. Photosynthesis and PSII functionality of drought-resistant and drought-sensitive weeping lovegrass plants. Environ. Exp. Bot. 2003, 49, 135–144. [Google Scholar] [CrossRef]
- IRRI. Standard Evaluation System for Rice, 5th ed.; International Rice Research Institute: Los Baños, the Philippines, 2014. [Google Scholar]
- Krishnan, P.; Ramakrishnan, B.; Reddy, K.R.; Reddy, V.R. High temperature effects on rice growth, yield, and grain quality. Adv. Agron. 2011, 111, 87–206. [Google Scholar]
- Massey, J.H.; Walker, T.W.; Anders, M.M.; Smith, M.C.; Avila, L.A. Farmer adaptation of intermittent flooding using multiple inlet rice irrigation in Mississippi. Agric. Water Manag. 2014, 146, 297–304. [Google Scholar] [CrossRef]
© 2019 by the authors. Licensee MDPI, Basel, Switzerland. This article is an open access article distributed under the terms and conditions of the Creative Commons Attribution (CC BY) license (http://creativecommons.org/licenses/by/4.0/).