You are currently viewing a new version of our website. To view the old version click .
Agronomy
  • Article
  • Open Access

4 November 2025

Hydrological Control of SOC Dynamics via Particle Size Redistribution Along Elevation Gradients in the Water Level Fluctuation Zone of the Three Gorges Reservoir

,
,
,
,
and
1
Key Laboratory of Mountain Surface Processes and Ecological Regulation, Institute of Mountain Hazards and Environment, Chinese Academy of Sciences, Chengdu 610041, China
2
University of Chinese Academy of Sciences, Beijing 100049, China
3
POWERCHINA Chengdu Engineering Corporation Limited, Chengdu 611130, China
4
Yantai Institute of Coastal Zone Research, Chinese Academy of Sciences, Yantai 264003, China
This article belongs to the Section Water Use and Irrigation

Abstract

The water level fluctuation zone (WLFZ) of the Three Gorges Reservoir (TGR) represents a distinctive ecotone with inverted hydrological regimes, where elevation gradients play a critical role in determining the spatial distribution and stability of soil organic carbon (SOC). The objective of this study was to test whether soil particle size mediates the effects of hydrological fluctuations on SOC dynamics across elevation gradients. In this study, soils from three elevation zones (155–165 m, 165–175 m, and non-flooded zones) were collected, and bulk soil and particle-size fractions (sand, silt, and clay) were incubated for 60 days to assess SOC mineralization. The results indicated that the SOC stock in the main stream was greater at middle elevations (3.94 ± 0.26 kg·m−2) than at high elevations (3.20 ± 0.18 kg·m−2), whereas the SOC stock in the tributary was greater at high elevations (3.39 ± 0.18 kg·m−2). Random forest and linear regression analyses revealed that total nitrogen (TN) and sand contents were the primary factors controlling SOC. Despite its lower SOC content, the sand fraction presented significantly higher turnover rates (102.14 ± 36.13 μg CO2-C·g−1C·h−1) than the finer fractions, indicating lower carbon stability. These findings suggest that hydrological fluctuations regulate SOC by altering the soil particle-size composition across elevation gradients.

1. Introduction

The Three Gorges Reservoir (TGR) is among the largest hydropower projects globally. Since its completion and commencement of operation, the reservoir’s water level has fluctuated between 145 m and 175 m []. This periodic regulation has resulted in the formation of a distinct ecotone at the interface of aquatic and terrestrial ecosystems along the reservoir’s shoreline, referred to as the water level fluctuation zone (WLFZ) []. Under the “winter storage, summer release” scheduling regime, the WLFZ exhibits pronounced wet–dry alternations and hydrological characteristics opposite those of natural rhythms [,,]. This distinctive hydrological regime profoundly influences vegetation recovery, soil structure, and carbon-nitrogen cycling processes, rendering the WLFZ one of the most intensively disturbed ecosystems worldwide [,,]. The frequent alternation between flooding and exposure in the WLFZ disrupts the input–output dynamics of soil organic carbon (SOC) [], resulting in recurrent transitions between carbon sink and source states. Nevertheless, the understanding of the stability and mineralization characteristics of SOC in the WLFZ remains limited.
The substantial 30-m elevation difference between the dry season and water storage period in the TGR has resulted in pronounced variations in SOC along the elevation gradient []. The duration of submergence varies markedly across elevation zones: the 165–175 m zone is flooded for an average of 169 days per year, the 155–165 m zone is flooded for 237 days, and the 145–155 m zone is flooded for 286 days annually []. These differences result in distinct flood frequencies, intensities of hydrological disturbance, and vegetation succession trajectories, all of which influence soil characteristics, nutrient cycling, and microbial activity []. The region’s alternating “high-temperature drought-high-pressure flooding” cycle leads to substantial fluctuations in soil temperature, redox conditions, and moisture content, driving highly dynamic soil biogeochemical processes [,,]. The reversed seasonal hydrology—characterized by summer exposure and winter submergence—causes many native terrestrial plants to decline, paving the way for the establishment of new flood-tolerant communities [,]. Moreover, the composition and function of microbial communities shift considerably, playing a pivotal role in regulating SOC mineralization and accumulation []. Additionally, the WLFZ serves as a dynamic interface between land and water, where SOC dynamics are shaped by both internal mechanisms (such as plant inputs and microbial processes) and external influences (including sediment deposition) [,]. Although SOC variation along elevational gradients has been widely reported in riparian zones or WLFZs, the direction and underlying mechanisms of change remain unclear [,]. For example, Wei et al. (2025) reported that the SOC content increases with elevation in the WLFZ of the TGR []. In contrast, Ran et al. (2023) reported that mid-elevation soils stored significantly more SOC than both lower and higher elevations did []. These contrasting results suggest that the effects of elevation on SOC may vary depending on regional type, disturbance intensity, and local environmental conditions. Research indicates that elevation primarily indirectly controls SOC dynamics through factors such as vegetation [], soil total nitrogen (TN) [], and soil texture []. However, how hydrological fluctuations in the WLFZ reshape the soil particle-size composition along elevational gradients and how these changes in turn mediate SOC accumulation and mineralization remain poorly understood.
Soil texture is a fundamental determinant of SOC stability and significantly influences mineralization rates and storage capacity []. Variations in particle size fractions alter mineral adsorption abilities, nitrogen dynamics, and the accessibility of carbon substrates, which collectively affect the efficiency of microbial decomposition and thereby modulate SOC mineralization and stabilization [,,]. Research has demonstrated that sandy soils tend to have elevated SOC activity and are more susceptible to mineralization, whereas finer fractions, such as silt and clay, contribute to greater SOC stability through enhanced physical protection and mineral associations [,]. Consequently, shifts in the particle size composition constitute a critical physical basis for SOC stabilization. In the WLFZ of the TGR, intense hydrological disturbances cause frequent sediment erosion and deposition, leading to systematic alterations in the soil structure [,]. Empirical studies indicate that sediment deposition in the WLFZ decreases with increasing elevation, resulting in pronounced differences in soil texture among elevation zones [,]. This variation in soil texture is likely a major factor contributing to the lower SOC content and elevated mineralization rates at higher elevations. However, studies on SOC mineralization characteristics in different soil particle size fractions are limited [,], especially in the unique ecosystem of the WLFZs. Particle size fractionation and cultivation experiments provide useful methods for characterizing SOC stability in isolated fractions, offering important evidence for assessing its long-term stability and environmental sensitivity [].
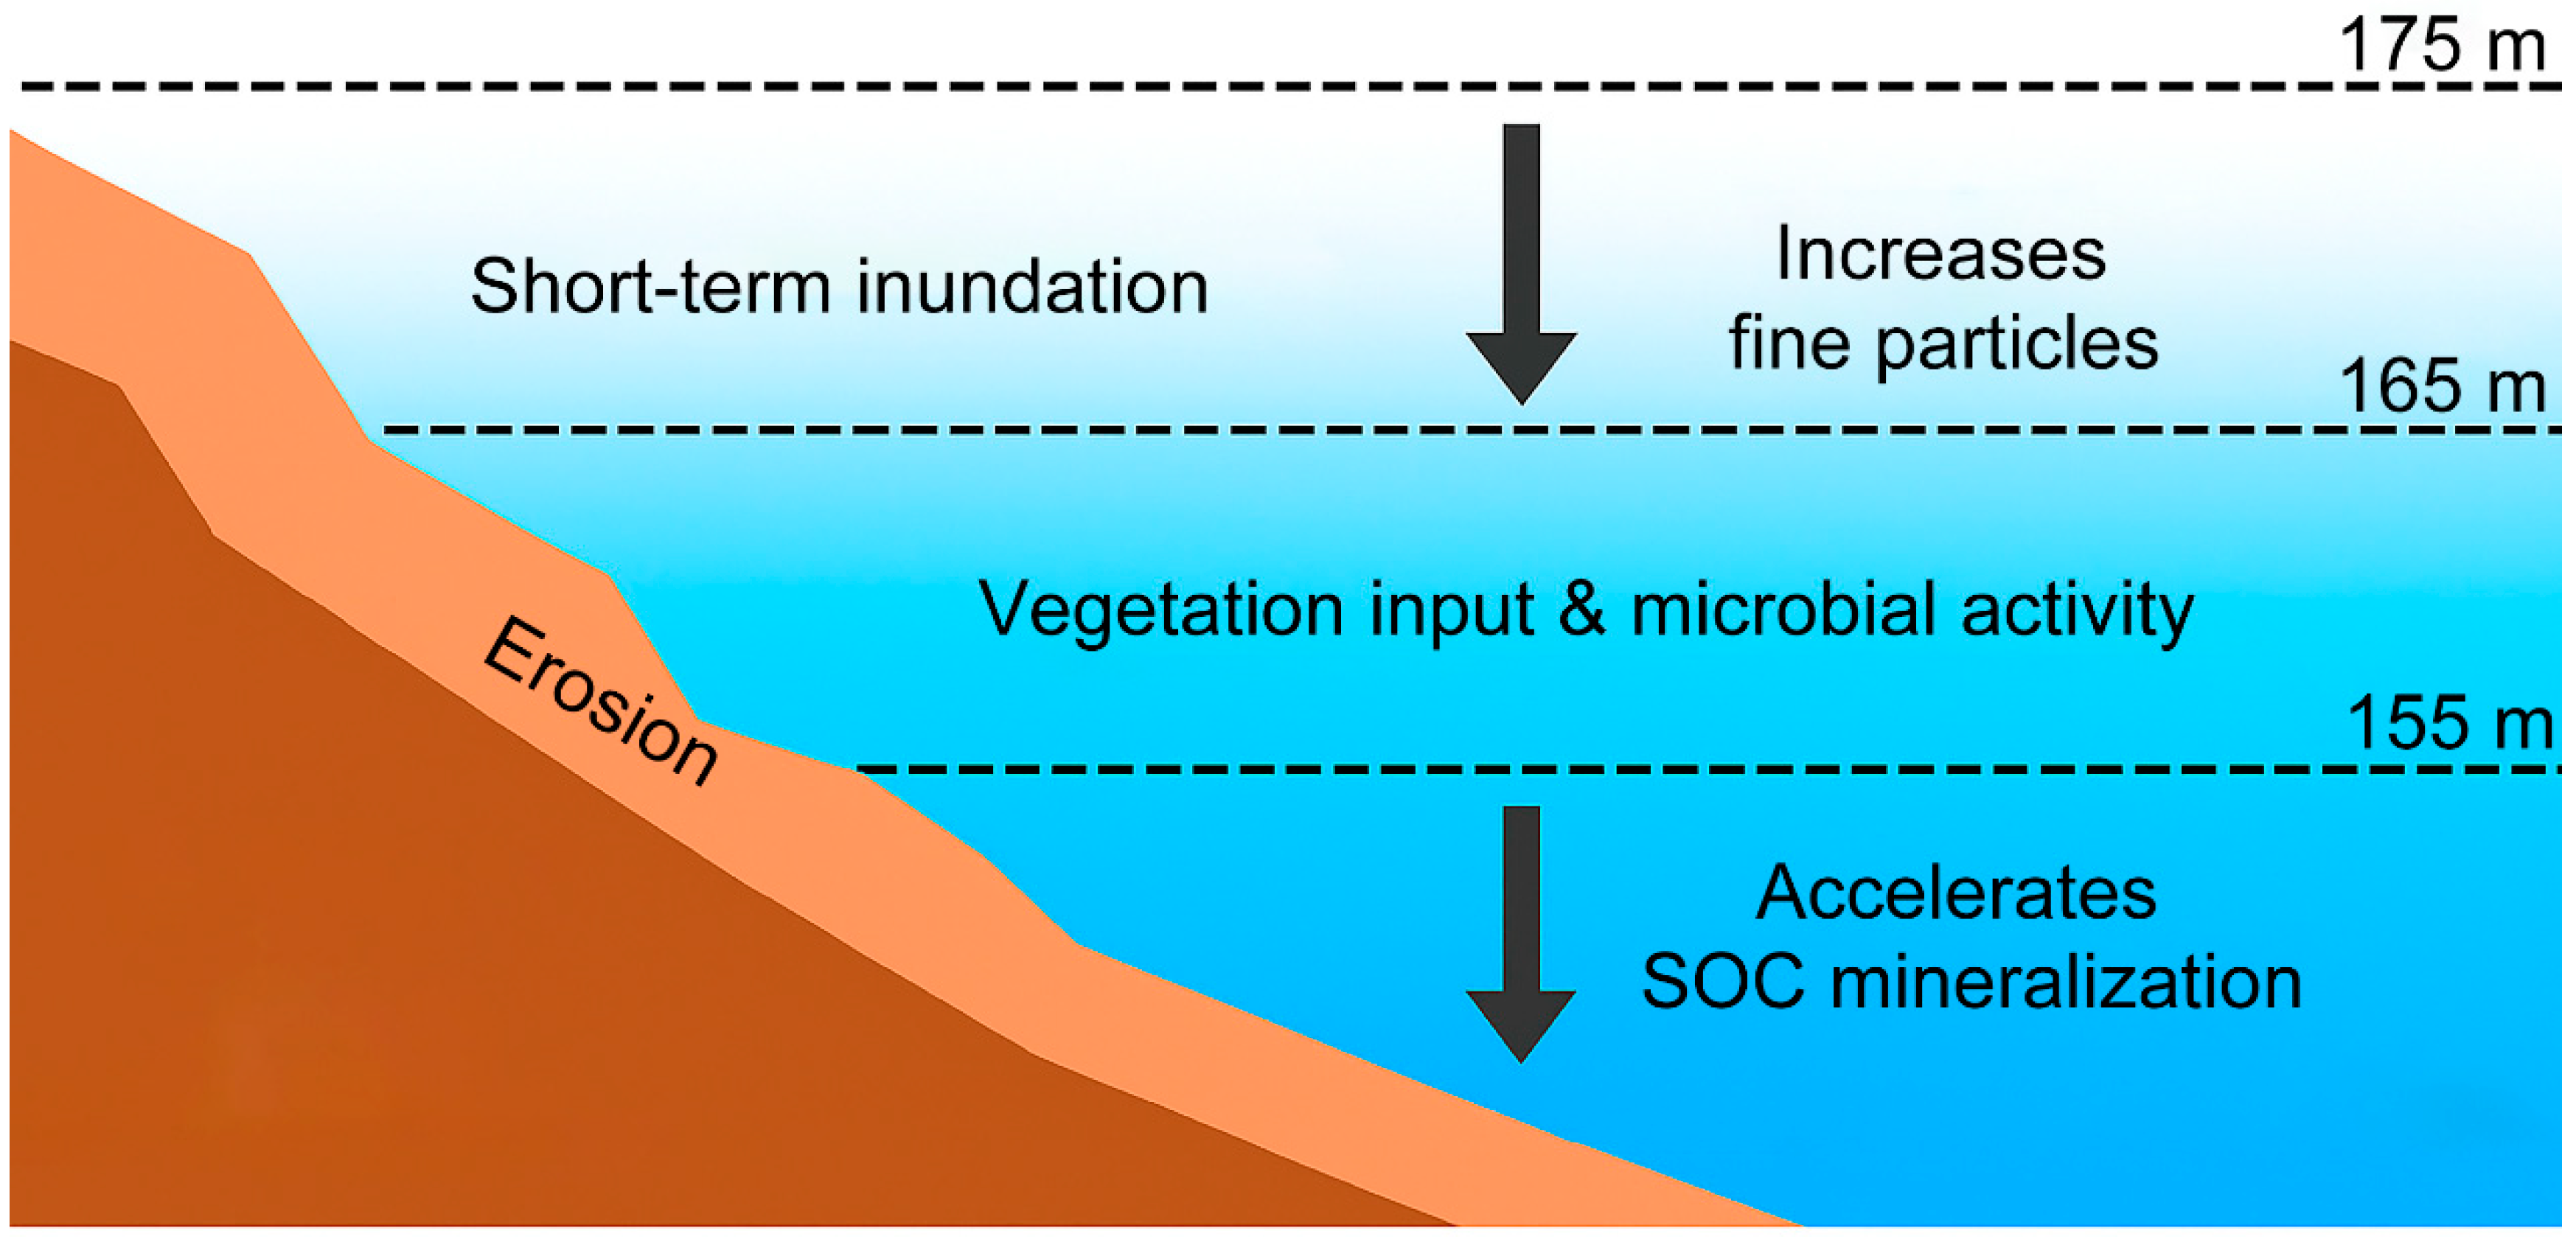
This study is designed to investigate the underlying mechanisms and key determinants of SOC variation across elevation gradients in the WLFZ of the TGR, with a particular focus on how particle size composition influences SOC dynamics and mineralization patterns. Although previous studies have reported significant variations in SOC along elevational gradients in riparian zones and WLFZs, the mechanisms through which hydrological fluctuations reshape soil particle-size composition and, in turn, regulate SOC accumulation and mineralization remain poorly understood. Existing research has mainly focused on bulk soils, while the contribution and response of specific particle-size fractions to SOC stabilization and turnover under fluctuating hydrological conditions have received limited attention. Addressing this knowledge gap is essential for improving our understanding of carbon cycling processes and SOC stability in hydrologically disturbed ecosystems such as the WLFZ of the TGR. We therefore hypothesize that soil particle-size composition mediates the effects of hydrological fluctuations on SOC accumulation and mineralization, leading to elevation-dependent differences in SOC content and stability (Figure 1). As shown in Figure 1, short-term inundation at higher elevations enhances the deposition of fine particles, whereas longer flooding and stronger erosion at lower elevations intensify SOC mineralization. Mid-elevation zones experience moderate hydrological disturbance, where vegetation input and microbial activity jointly regulate carbon turnover. To test this hypothesis, we established sampling transects in the typical main stream and tributary WLFZ of the TGR and collected soil samples from the 0–40 cm soil layer at three elevation zones: 155–165 m, 165–175 m, and the non-flooded zone. We conducted particle size fractionation, SOC concentration measurements, and a 60-day incubation experiment. By combining CO2 emission rates with a random forest model to identify the primary controlling factors of SOC, we systematically assessed the regulatory effects of elevation and particle size structure on SOC stability.
Figure 1. Conceptual framework of the expected interactions among elevation, hydrology, particle size, and SOC in the WLFZ of the TGR.

2. Materials and Methods

2.1. Experiment Site

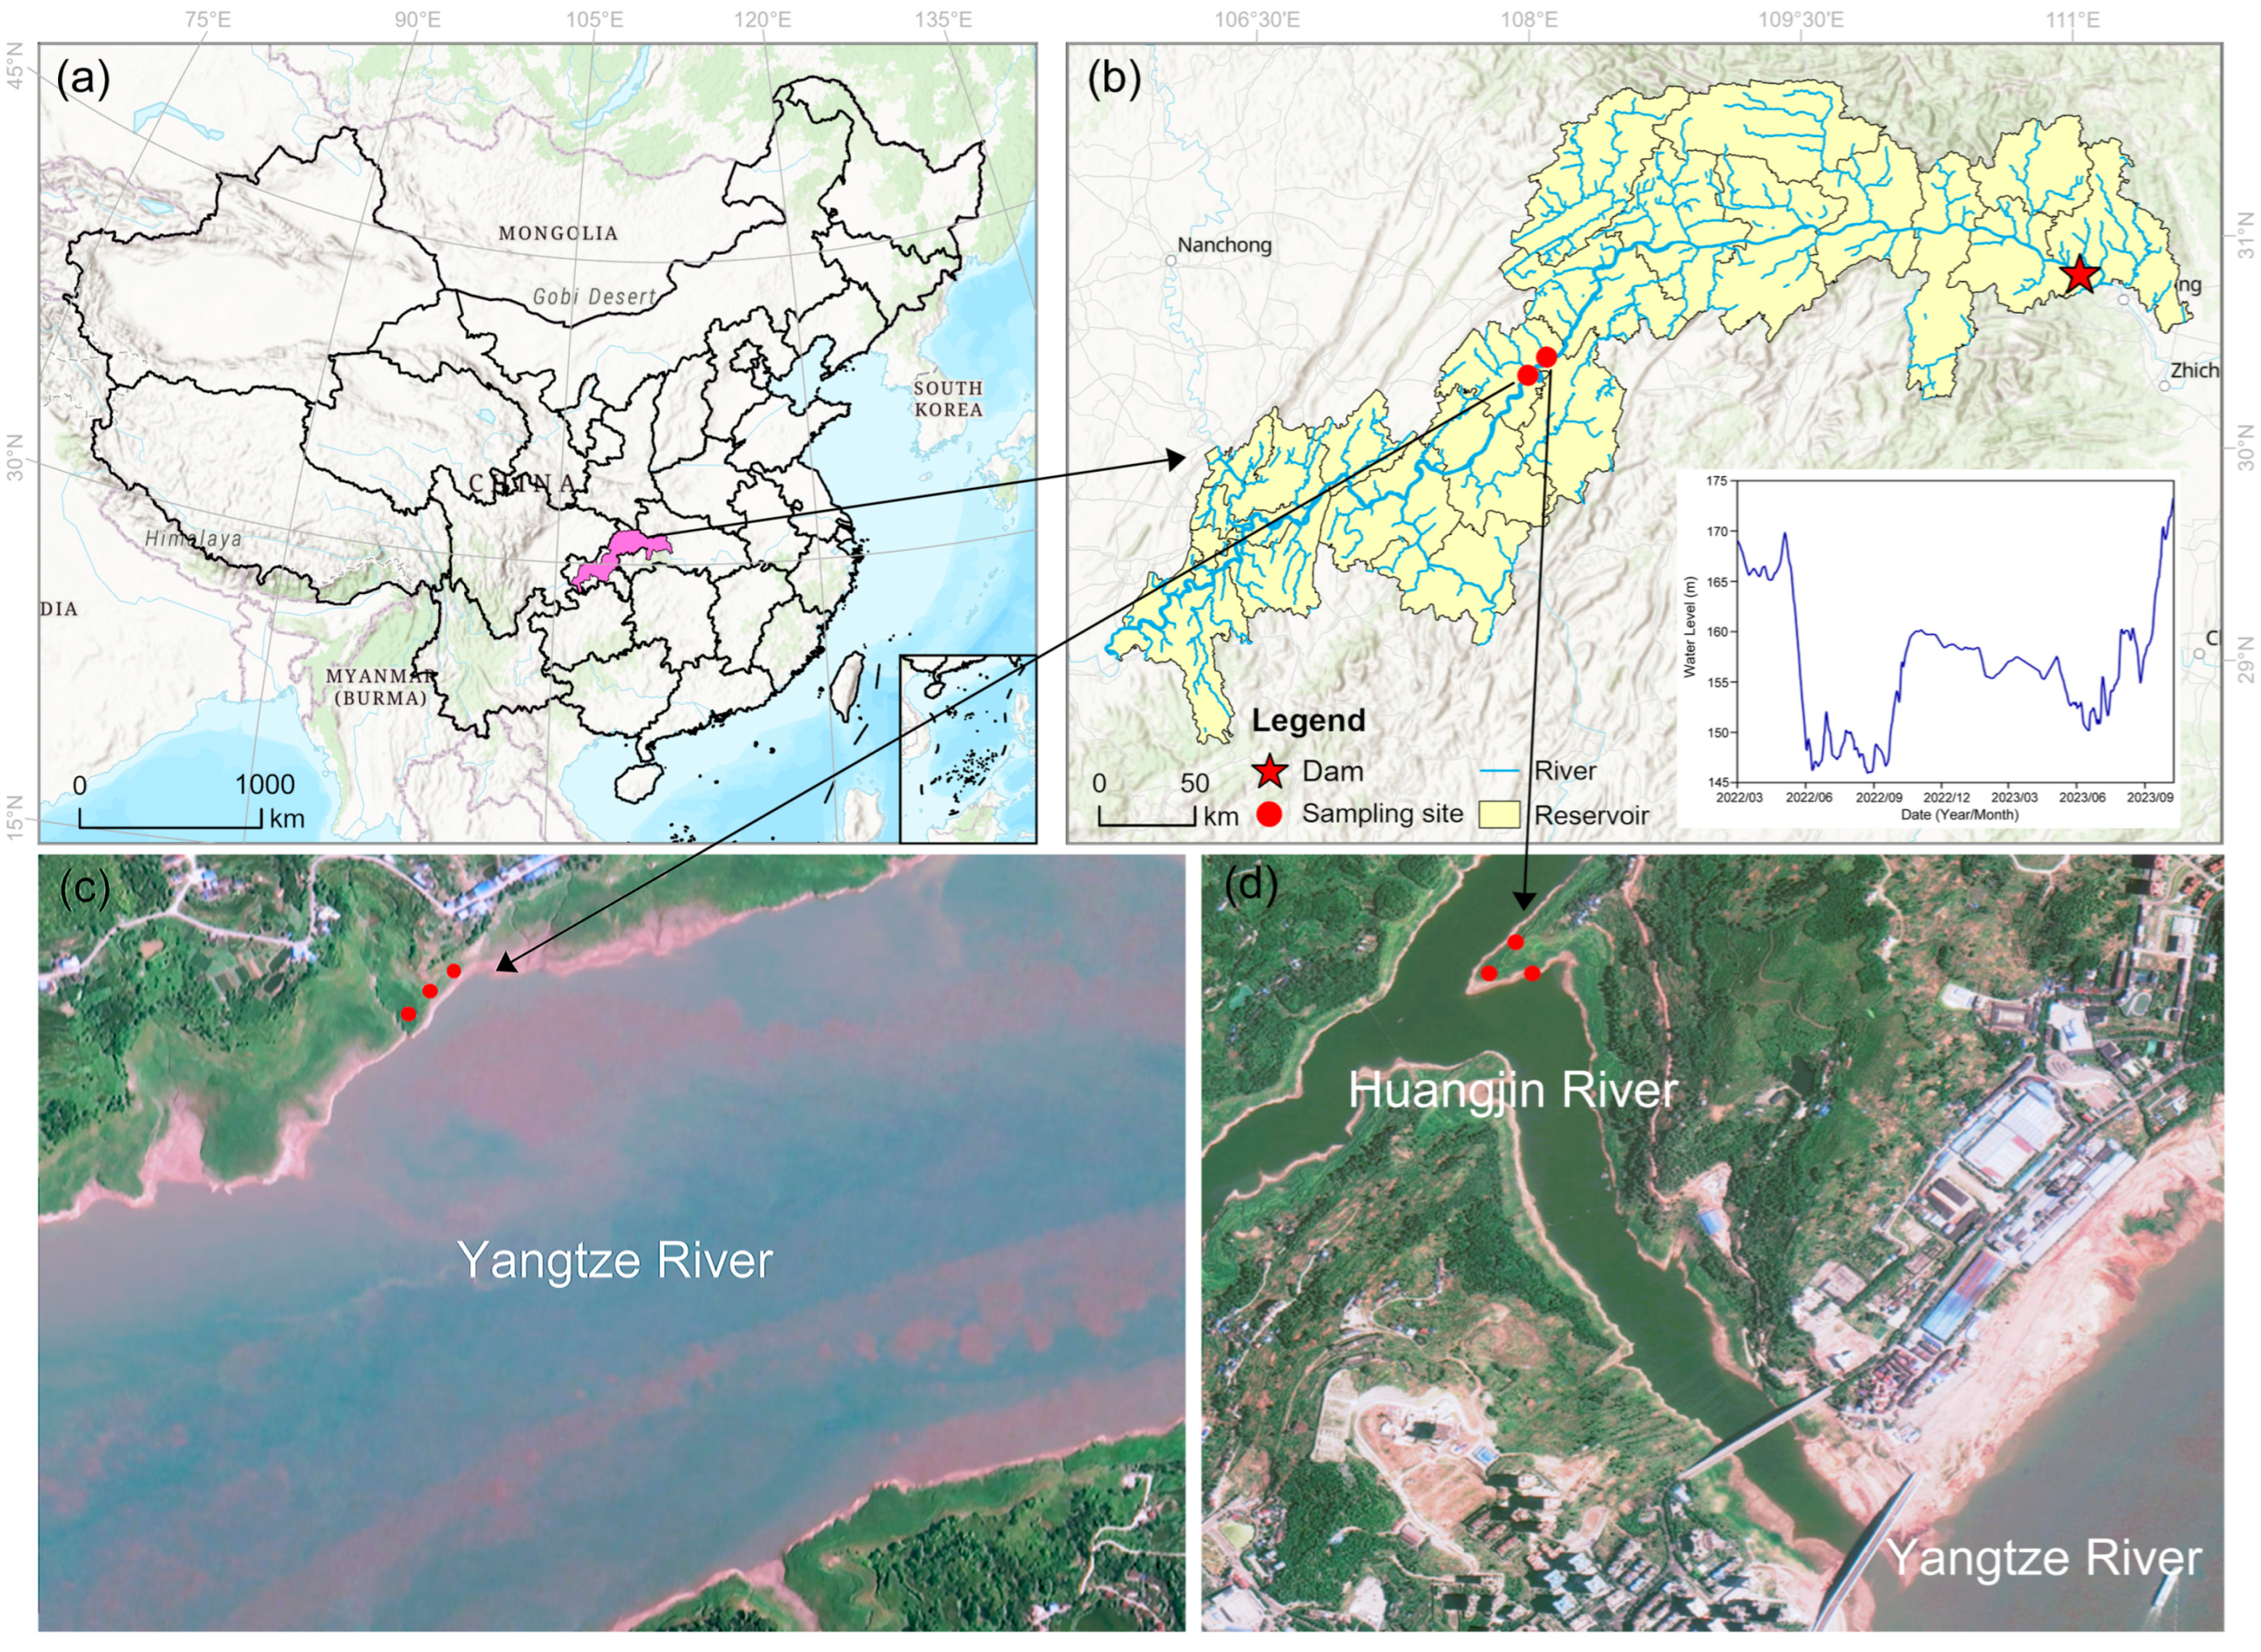
The research was carried out in the WLFZ along the main stretch of the Yangtze River in Zhong County (30°24′57″ N, 108°10′26″ E) and in the WLFZ of the Huangjin River, a tributary of the Yangtze River (30°19′24″ N, 108°2′38″ E) (Figure 2). The WLFZ within the TGR region covers a total area of 348.93 km2, extending across 21 counties and municipalities in Hubei Province and Chongqing City []. In Zhong County, the WLFZ primarily consists of terraced and steppe terrains shaped by reservoir impoundment. The area is characterized by a subtropical humid monsoon climate, with an average annual temperature of 18.5 °C, an accumulated temperature (>10 °C) of 5891.4 °C·d, and an average yearly rainfall of about 1200 mm, most of which occurs between May and September.
Figure 2. Locations of typical plots in the WLFZ of the TGR. (a) Location of the TGR in China; (b) location of sampling sites in the TGR, with the left red point indicating the site in the main stream and the right red point indicating the site in the tributary; (c,d) show the sampling sites in the main stream and tributary, respectively.
Control of the Three Gorges Dam has led to rising water levels in winter and the lowest levels in summer, creating a fluctuation pattern opposite that of the natural seasonal variation, known as “counter-seasonal” []. According to hydrological data from the Three Gorges Dam in 2023, water levels mainly fluctuate above 150 m, with soils below 150 m being submerged (Figure 1). Therefore, the WLFZ was divided into two elevation zones: the middle-elevation zone (155–165 m) and the high-elevation zone (165–175 m). Additionally, for accurate comparative analysis, we selected areas above 175 m that had not been disturbed by human activities and had not experienced alternating wet and dry cycles as non-flooded zones for comparison with the lower WLFZs.

2.2. Soil Sampling and Physicochemical Analyses

Soil sampling was conducted in the dry season of 2023, when the water level of the TGR was at its lowest and soils in the WLFZ were fully exposed. In each elevation band and in the reference soil located above 175 m, three 1 m × 1 m plots were randomly selected for sampling using a composite collection strategy across various depths, with plot locations chosen to ensure similar slopes, aspects, and vegetation cover to minimize microsite variability within the terrace landscape. Soil samples were obtained at four depth intervals (0–10, 10–20, 20–30, and 30–40 cm) and thoroughly mixed within each layer to ensure homogeneity. Undisturbed samples were also removed via a ring knife to measure the bulk density (BD) and soil moisture content. All the soil samples were pre–processed to eliminate organic residues and other debris. The mixed samples at each depth were split into two parts, sealed in bags, and kept cool during transportation to the laboratory. Once in the laboratory, one part of each sample was air-dried, finely ground using a ball mill, and passed through both 2 mm and 100-mesh sieves. The 2 mm fractions were reserved for pH analysis, particle size classification, and incubation studies. The finer 100-mesh portion was divided: one subset was used to assess total nitrogen (TN) content, whereas the other subset underwent acidification to quantify the SOC and analyze stable carbon isotope ratios. The remaining fresh samples were refrigerated at 4 °C for subsequent determination of ammonium nitrogen, nitrate nitrogen, and dissolved organic carbon (DOC), as well as for preparing microbial inocula for incubation experiments.
The soil pH was determined by extracting the soil with ultrapure water at a ratio of 1:2.5, followed by vigorous stirring with a glass rod for 1–2 min. After resting for 30 min, the pH of the supernatant was measured using a pH meter. BD and soil moisture were measured using the ring knife method (100 cm3). The soil particle-size fractions were separated following the method of Ding et al. [], combining ultrasonic dispersion, wet sieving, and repeated centrifugation. Briefly, 20 g of air-dried soil was ultrasonically dispersed in ultrapure water to disrupt aggregates. The resulting suspension was passed through a 50 μm sieve to collect the sand fraction (>50 μm). The silt (2–50 μm) and clay (<2 μm) fractions were subsequently separated from the filtrate according to Stokes’ law by stepwise centrifugation. All fractions were dried at 40 °C to constant weight, gently ground, and weighed to calculate their mass percentages relative to the total soil sample. The processed samples were then stored for subsequent physicochemical and incubation analyses to assess SOC mineralization characteristics among different particle-size classes. The TN and SOC contents were determined using an elemental analyzer (FlashEA1112, Thermo, Waltham, MA, USA). The soil ammonium nitrogen (NH4+-N) and nitrate nitrogen (NO3-N) contents were leached using a 1 mol·L−1 KCl solution, and the soil DOC was leached using ultrapure water, both with a water-to-soil ratio of 5:1, and measured by an AA3 flow analyzer (SEAL, Norderstedt, Germany) after leaching. The δ13C values of the soil samples were measured using an isotope ratio mass spectrometer coupled with an elemental analyzer (IRMS-EA, IsoPrime 100, Vario MICRO cube, Elementar, Hanau, Germany) []. Except for NH4+-N, NO3-N, and DOC, which were determined on a fresh-weight basis to reflect their in-situ concentrations in moist soils, all the other soil parameters were expressed on a dry-weight basis to ensure consistency and comparability across samples.

2.3. Incubation Experiment

To investigate the mineralization characteristics of SOC across different particle size fractions in the WLFZ of the Three Gorges Reservoir region, soil samples from three distinct elevation zones were subjected to incubation experiments. At each elevation, the soil was stratified into two depth layers: 0–20 cm and 20–40 cm. Dried samples of sand, silt, clay, and bulk soil (sieved through a 2 mm mesh) were weighed to 10 g and placed into 250 mL incubation flasks, with three replicates per sample type. Three empty flasks were included as blanks to account for background CO2. To reduce potential artifacts introduced by pre-treatment processes such as drying, wet sieving, sonication, and centrifugation on microbial activity, 2 mL of microbial inoculum was added to each flask. To standardize the microbial input across samples, the inoculum was prepared following the method of Christensen (1987) []: 100 g of fresh soil was mixed with 1000 mL of ultrapure water, thoroughly shaken, and allowed to settle overnight, and the clear supernatant was collected as the inoculum mixture. To improve soil aeration and to disperse the inoculum uniformly, the soil was loosened, stirred, and slightly levelled. The soil moisture was subsequently adjusted to 60% of the soil pore water content based on the relationship between the water-filled pore space (WFPS) and the soil mass water content, which was calculated by Equations (1) and (2) []. The incubation flasks were sealed with rubber stoppers equipped with two stainless steel vent tubes: a thicker tube (Φ = 4 mm) for gas sampling and a thinner tube (Φ = 0.5 mm) to equalize the internal pressure with ambient air. The flasks were then placed in a constant-temperature incubator maintained at 25 °C for the duration of the experiment. Throughout the incubation period, water loss from the soil was compensated using the constant weight method to ensure moisture stability and maintain the integrity of the experimental conditions.
W F P S ( % ) = [ P w × ( D B / S t ) ] × 100
S t ( % ) = [ 1 ( D B / P d ) ] × 100
where WFPS is the water-filled pore space (%); Pw is the soil mass water content (%); DB is the soil bulk weight (g·cm−3); St is the total porosity (%); and Pd represents the soil density, which is generally 2.65 g·cm−3.
The soil was incubated for a total of 114 days, and to reduce the effects of drying and rewetting on soil microbial activity, the soil samples were placed in a constant-temperature incubator at 25 °C for a one-week preincubation period to restore microbial activity. After preincubation, gas samples were collected on days 1, 3, 5, 7, 10, 14, 21, 28, 35, 42, 49, 56, 63, 70, 77, and 107 of incubation. Before each gas collection, to ensure that the initial air conditions in each culture bottle were consistent, all the incubation bottles were aerated for 30 min using an air pump. The three-way valves were subsequently closed, and the incubation bottles were sealed in a 25 °C constant-temperature incubator for 4 h. After aeration and sealing for 4 h, the gases were collected separately with a syringe, and the CO2 concentration in the gases was determined by gas chromatography (GC, Agilent 7890A, Santa Clara, CA, USA).

2.4. Data Processing and Statistical Methods

The SOC stock was determined according to Equation (3) as follows:
S O C S = S O C C × B D × D 100
where SOCs is the SOC stock (kg·m−2), SOCc is the SOC content (g·kg−1), BD is the soil bulk density (g·cm−3), and D is the soil thickness (cm). Coarse fragments (>2 mm) were not present or assumed to be negligible in the analyzed samples and were therefore not included in the calculation []. According to Zhang et al. (2022) [], the CO2 emission rate and cumulative emission flux were calculated via Equations (4) and (5), respectively:
F = ρ × d c d t × V × 273 ( 273 + T ) × W
where F is the soil CO2 emission rate (mg CO2-C·kg−1·h−1); ρ is the density of CO2-C in the standard state, which is 0.536 kg·m−3; dc/dt is the increase in gas concentration in the incubation bottle per unit of time in ppm·h−1; V is the effective spatial volume of the gas in the incubation flask (m3); W is the mass of dry soil in the incubation bottle (kg); and T is the incubation temperature (°C). The cumulative emission flux of CO2 is calculated as follows:
C i = 1 i F i 1 + F i 2 × T i
where Ci is the cumulative emission flux of soil CO2-C (mg·kg−1), Fi and Fi−1 are the soil CO2 emission rates (mg CO2-C·kg−1·h−1) of two adjacent measurements, and Ti is the time interval between the two measurements (h).
Two-way ANOVA (p < 0.05) was conducted to assess the effects of elevation and soil depth on the SOC content. To visualize the relationships between the variables and SOC, scatter plots were generated with fitted linear regression lines and corresponding 95% confidence intervals. The relative importance of influencing factors was evaluated using a random forest model in R version 4.4.0 with the “randomForest” package, which uses 500 trees and the default mtry setting. Model performance was assessed with 10-fold cross-validation repeated three times. All graphical visualizations were produced using the “ggplot2” package in R version 4.4.0.

3. Results

3.1. SOC Content and Stock

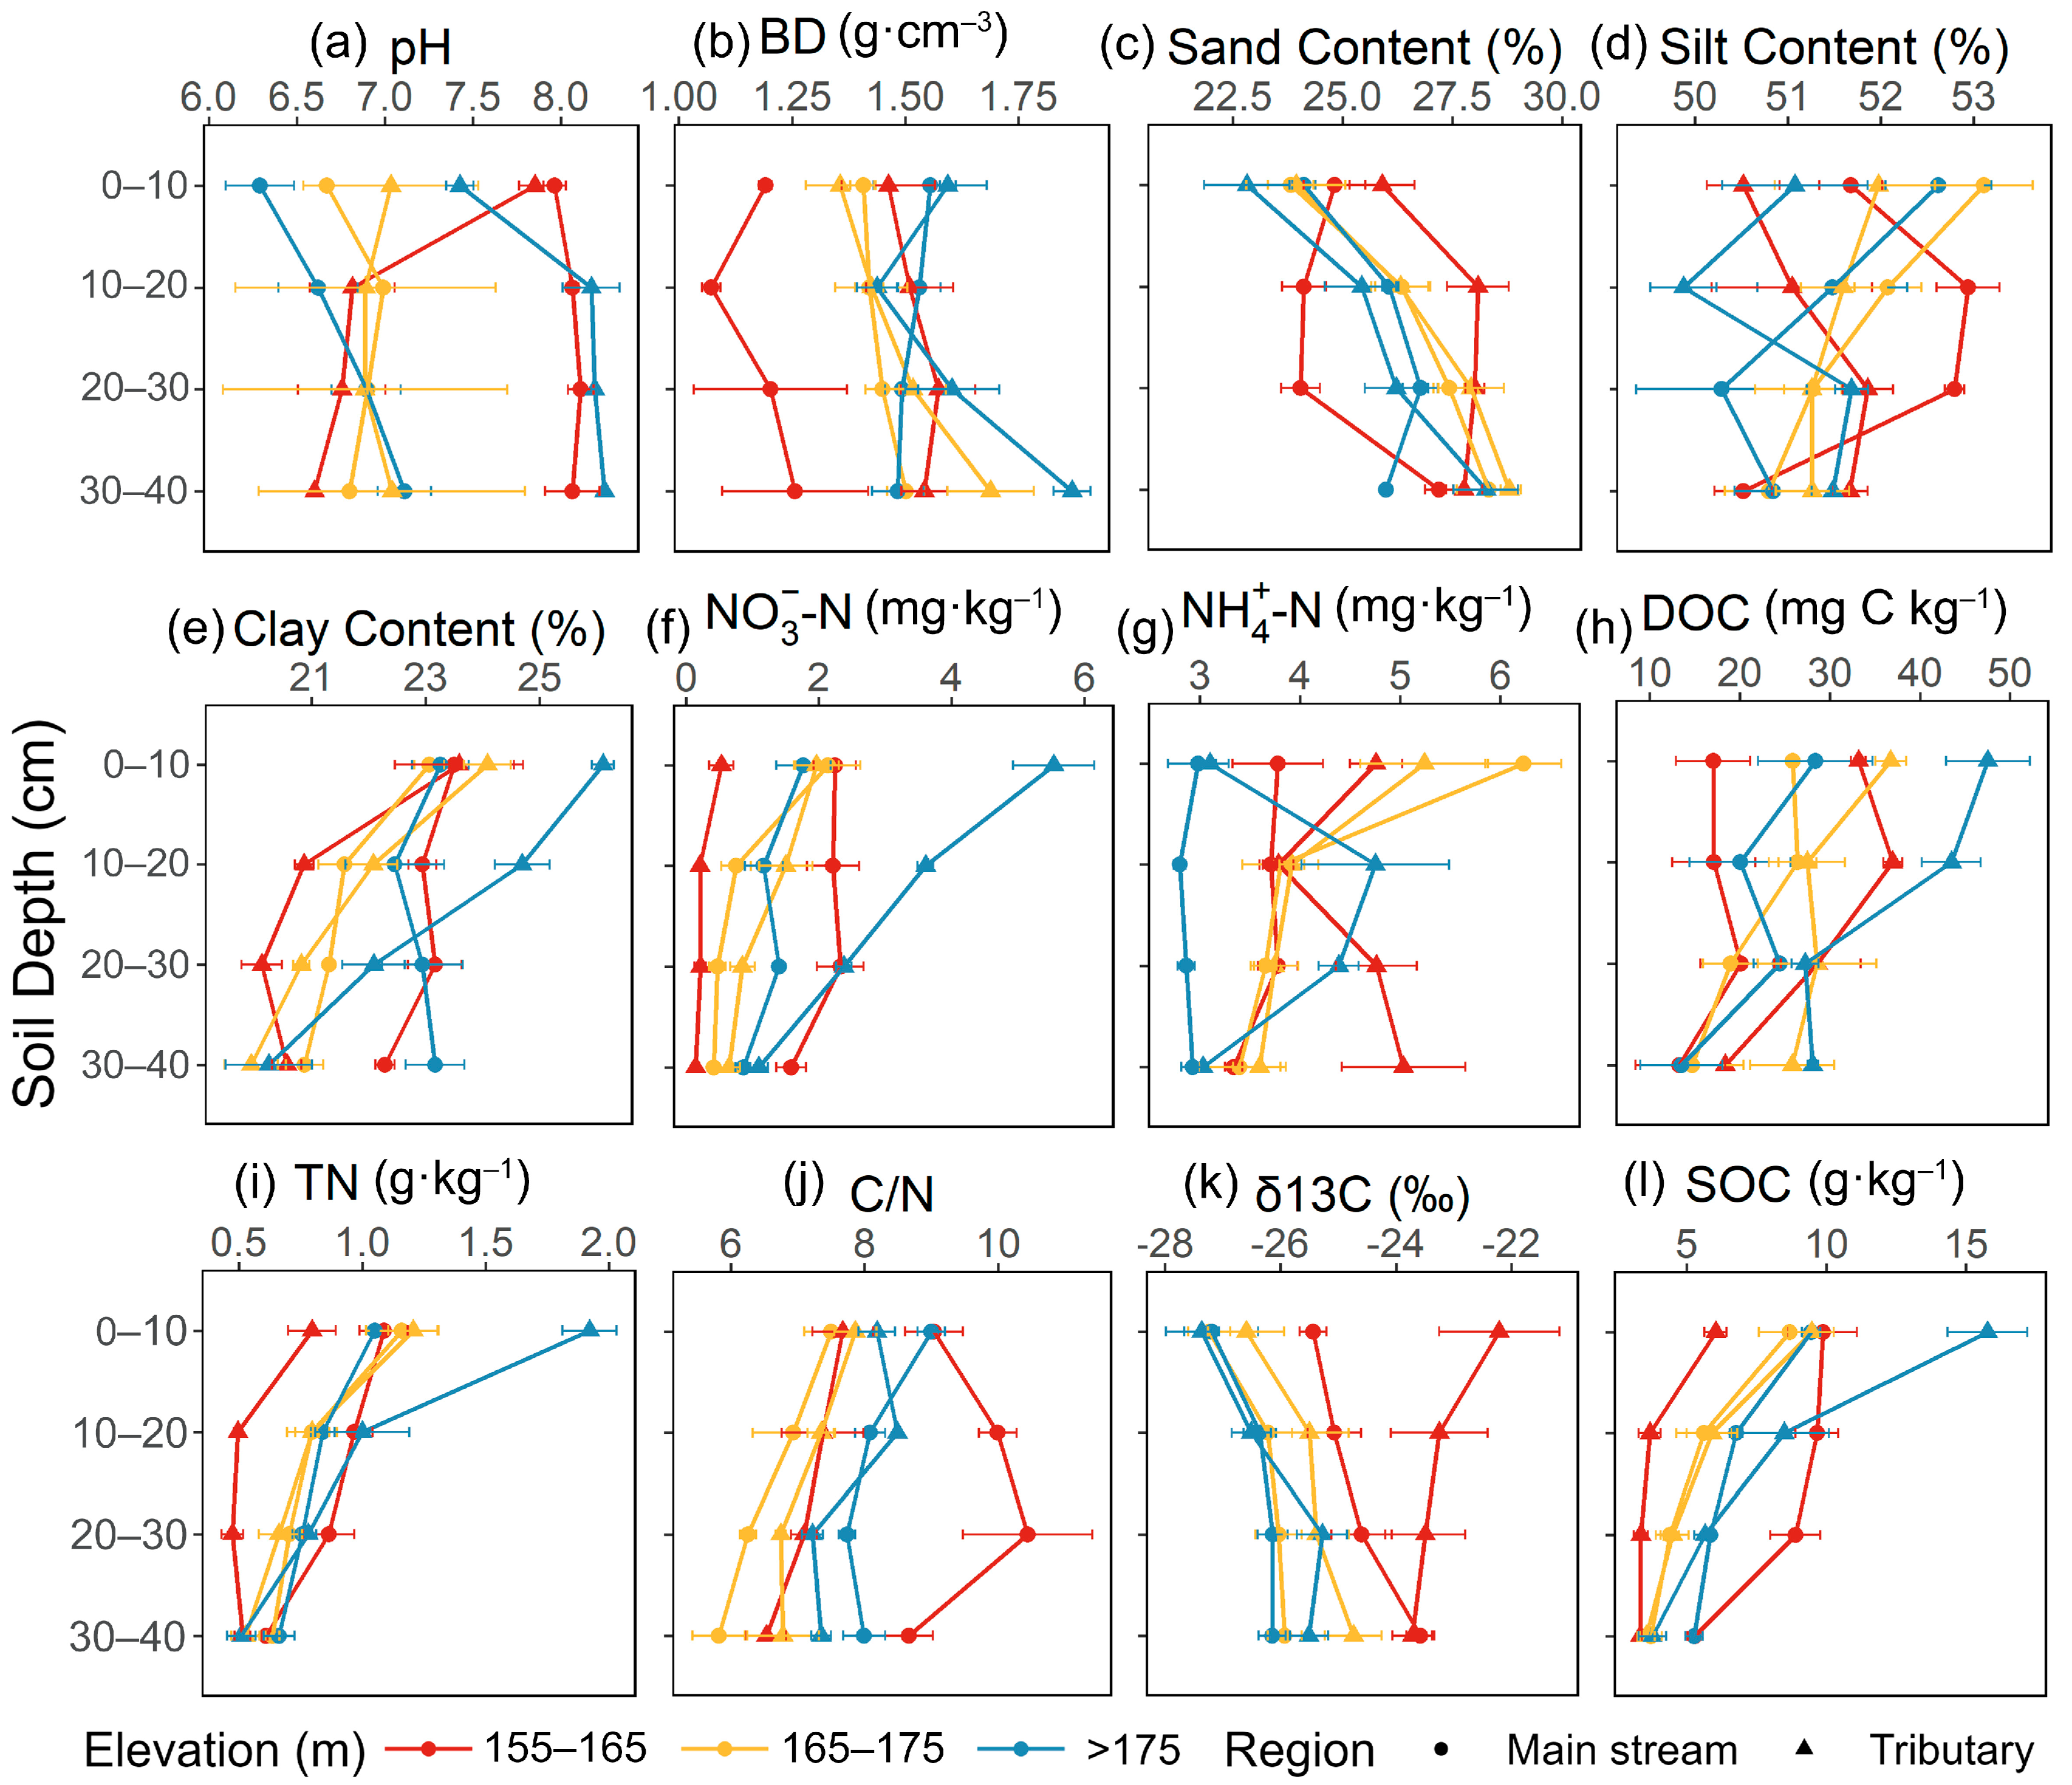
Figure 3 shows the trend of soil physicochemical properties with depth in different elevation zones in the main stream and tributary regions of the TGR, and Table 1 further clarifies the significance of the effects of elevation, depth, and their interactions on various physicochemical parameters by two-way ANOVA. In the main stream region, the effects of elevation on the pH, BD, sand content, clay content, NO3-N, NH4+-N, C/N ratio, δ13C, and SOC content were significant (p < 0.05), with BD, pH, and SOC exhibiting relatively high values at 155–165 m in elevation. Depth affected mainly the sand and silt contents, NH4+-N, TN, and C/N ratio, among other parameters. The soil nutrient contents were generally greater in the surface layer (0–20 cm) than in the deeper layer (20–40 cm), and SOC and δ13C accumulated more significantly in the surface layer. In the tributary region, significant differences (p < 0.05) in pH; clay content; and NO3-N, TN, C/N, δ13C and SOC contents were detected between elevations. In particular, NO3-N, TN and SOC all showed significant interactions between elevation and depth (p < 0.01), suggesting that elevation and the soil horizon jointly regulate the vertical distributions of the soil nitrogen and carbon contents. The silt and clay contents were affected mainly by depth (p < 0.001), with the soil particle size gradually decreasing with increasing depth.
Figure 3. pH (a), BD (b), Sand content (c), Silt content (d), Clay content (e), NO3-N content (f), NH4+-N content (g), DOC content (h), TN content (i), C/N ratio (j), δ13C (k), and SOC content (l) at different elevations of the water level fluctuation zone of the main stream and tributary regions in the TGR (mean ± standard error, n = 3).
Table 1. Two-way ANOVA of the effects of elevation and depth on the soil pH, BD, Sand, Silt, Clay, NO3-N, NH4+-N, DOC, TN, C/N, δ13C, and SOC.
The SOC content decreased with increasing depth but exhibited different trends with elevation in the main stream and tributary (Table 1, Figure 3). In the main stream at 155–165 m in elevation, the SOC content was significantly greater than that in the non-flooded zone and at 165–175 m in elevation, especially in the 10–20 cm and 20–30 cm soil layers (p < 0.05). In the 30–40 cm soil layer, the SOC content at 155–165 m elevation (5.29 ± 0.46 g·kg−1) and in the non-flooded zone (5.26 ± 0.55 g·kg−1) was significantly greater than that at 165–175 m elevation (3.72 ± 0.66 g·kg−1) (p < 0.05). In the tributary, in the 0–10 cm soil layer, the SOC content in the non-flooded zone (15.77 ± 2.47 g·kg−1) was significantly greater than that at both the 165–175 m elevation (9.47 ± 1.39 g·kg−1) and the 155–165 m elevation (6.03 ± 0.69 g·kg−1) (p < 0.05). In the 20–30 cm soil layer, the SOC content in the non-flooded zone (5.64 ± 0.64 g·kg−1) was significantly greater than that in the 155–165 m elevation zone (3.34 ± 0.44 g·kg−1) (p < 0.05).
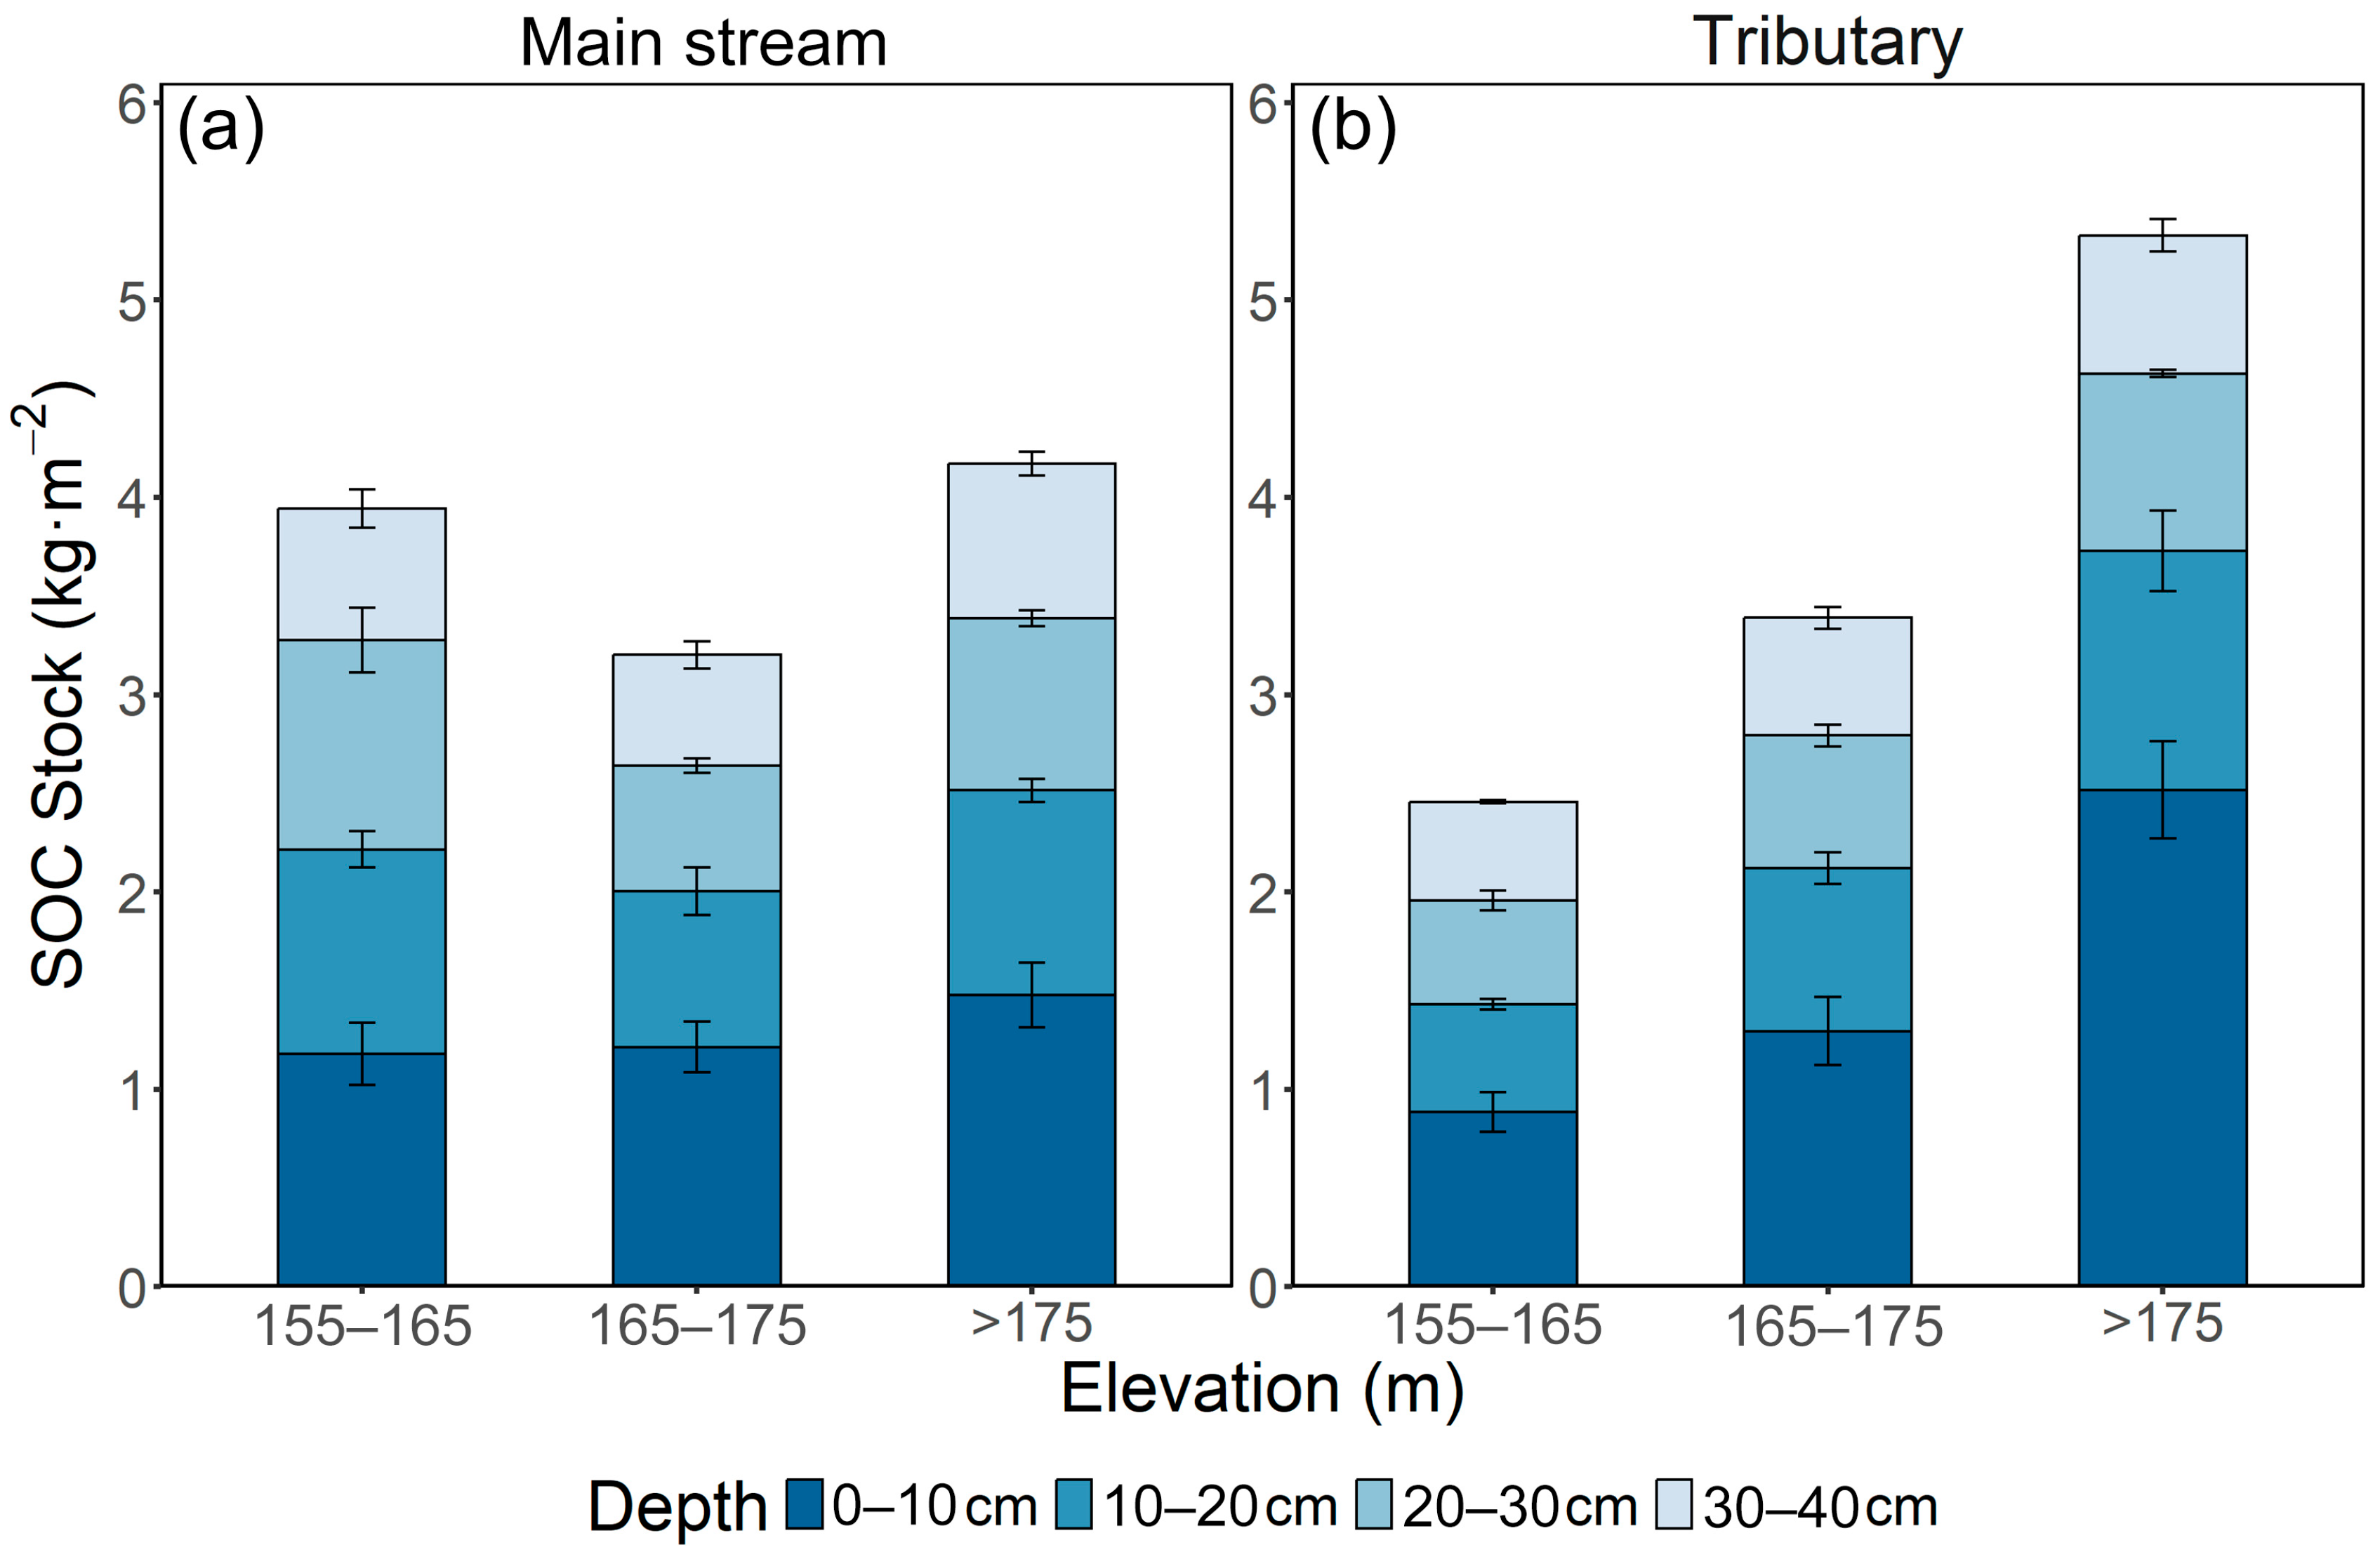
The pattern of SOC stock variation with elevation and soil depth closely mirrored that of the SOC content. In the main stream area, the differences in the SOC stock among the elevation zones were not statistically significant. In contrast, the SOC stock in the tributary region clearly decreased with decreasing elevation (Figure 4). Notably, in the 0–10 cm and 20–30 cm soil layers, the SOC stock in the non-flooded zone was significantly greater than that in the 155–165 m and 165–175 m elevation zones (p < 0.05).
Figure 4. SOC stocks at different elevations in the water-level fluctuation zones of the main stream (a) and tributary regions (b) in the TGR (mean ± standard error, n = 3).

3.2. Main Controls on the SOC

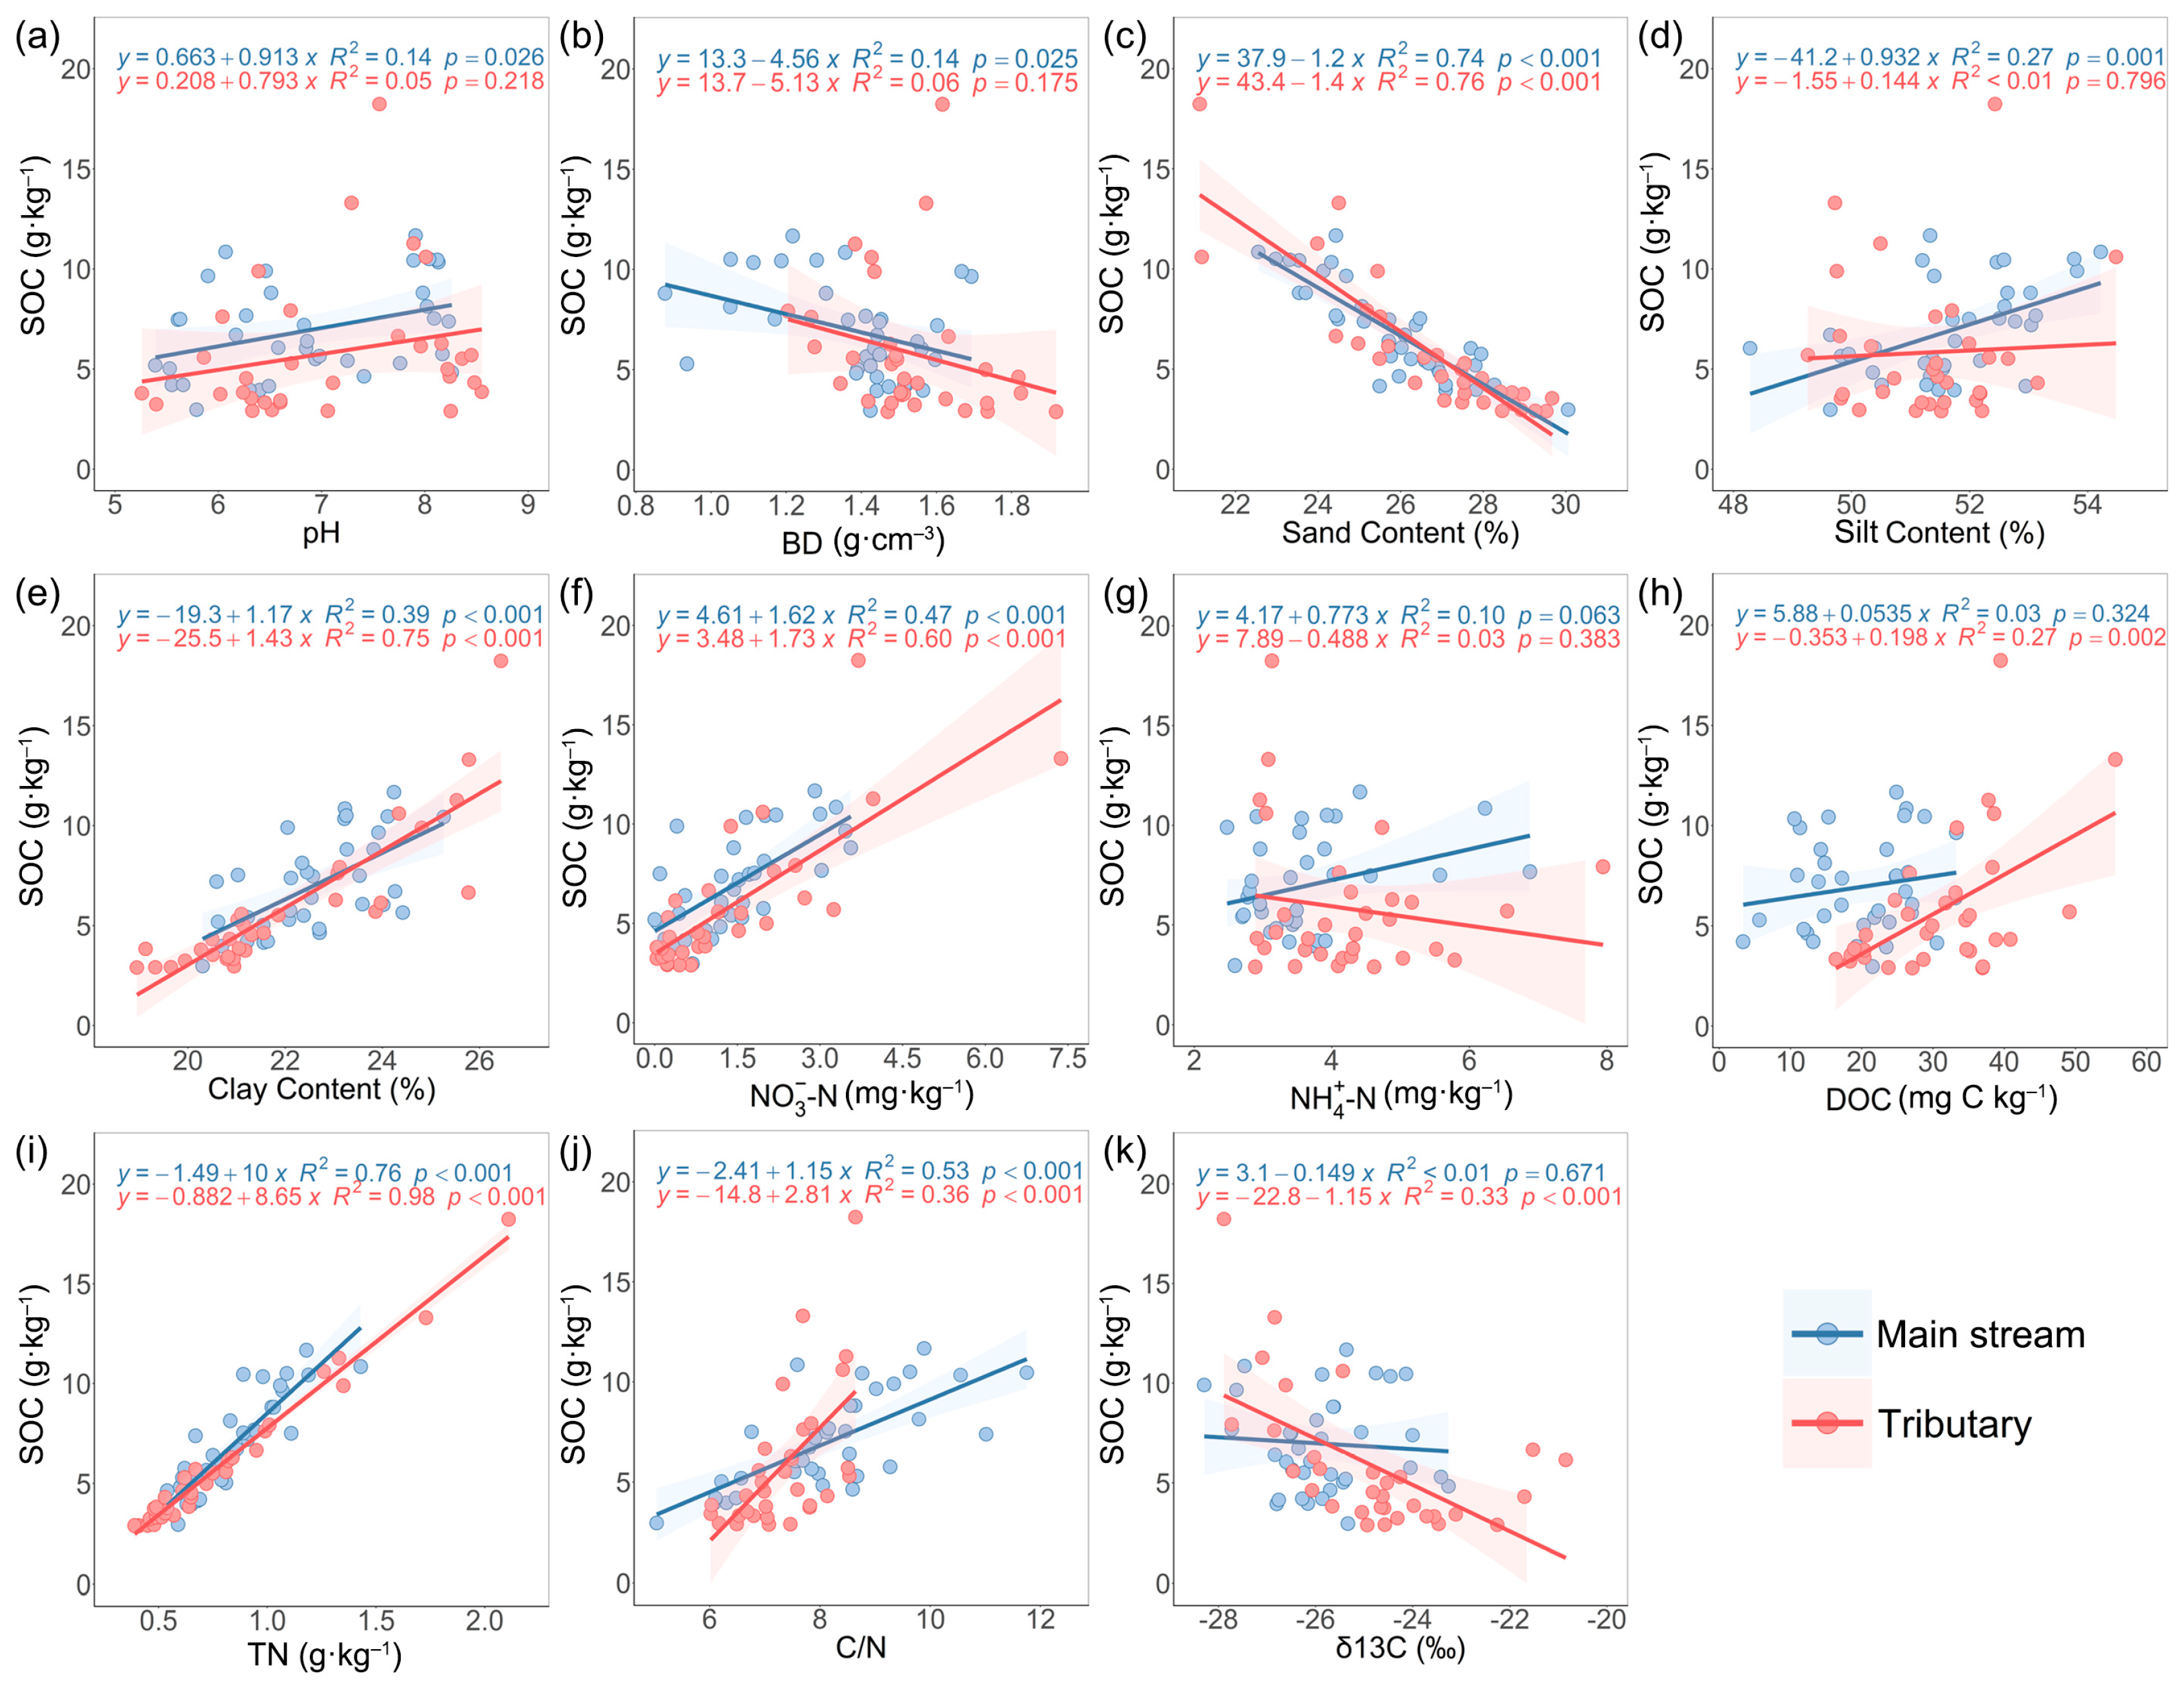
To clarify the main factors controlling the SOC content in the WLFZ, the response and importance of soil physicochemical properties to SOC were explored via linear fitting analysis (Figure 5) and a random forest regression model (Figure 6), respectively. In the main stream region, the SOC content was significantly positively correlated (p < 0.05) with pH, silt, clay, NO3-N, and TN contents and the C/N ratio but was negatively correlated with the sand content and BD, with the most prominent correlations with the TN and sand contents. In the tributary region, the SOC content was significantly positively correlated with the clay content, NO3-N, DOC, TN, and C/N ratio and negatively correlated with the sand content and δ13C. The correlations between the TN, sand, and clay contents and the SOC content were very significant. The results indicated that the nitrogen supply and soil particle size fraction play important roles in regulating SOC accumulation, both in the main stream and tributary regions.
Figure 5. Relationships between soil physicochemical properties and SOC contents in the water level fluctuation zones of the main stream and tributary regions of the Three Gorges Reservoir. Panels show pH (a), bulk density (b), sand content (c), silt content (d), clay content (e), NO3-N (f), NH4+–N (g), DOC (h), total nitrogen (i), the C/N ratio (j), and δ13C (k).
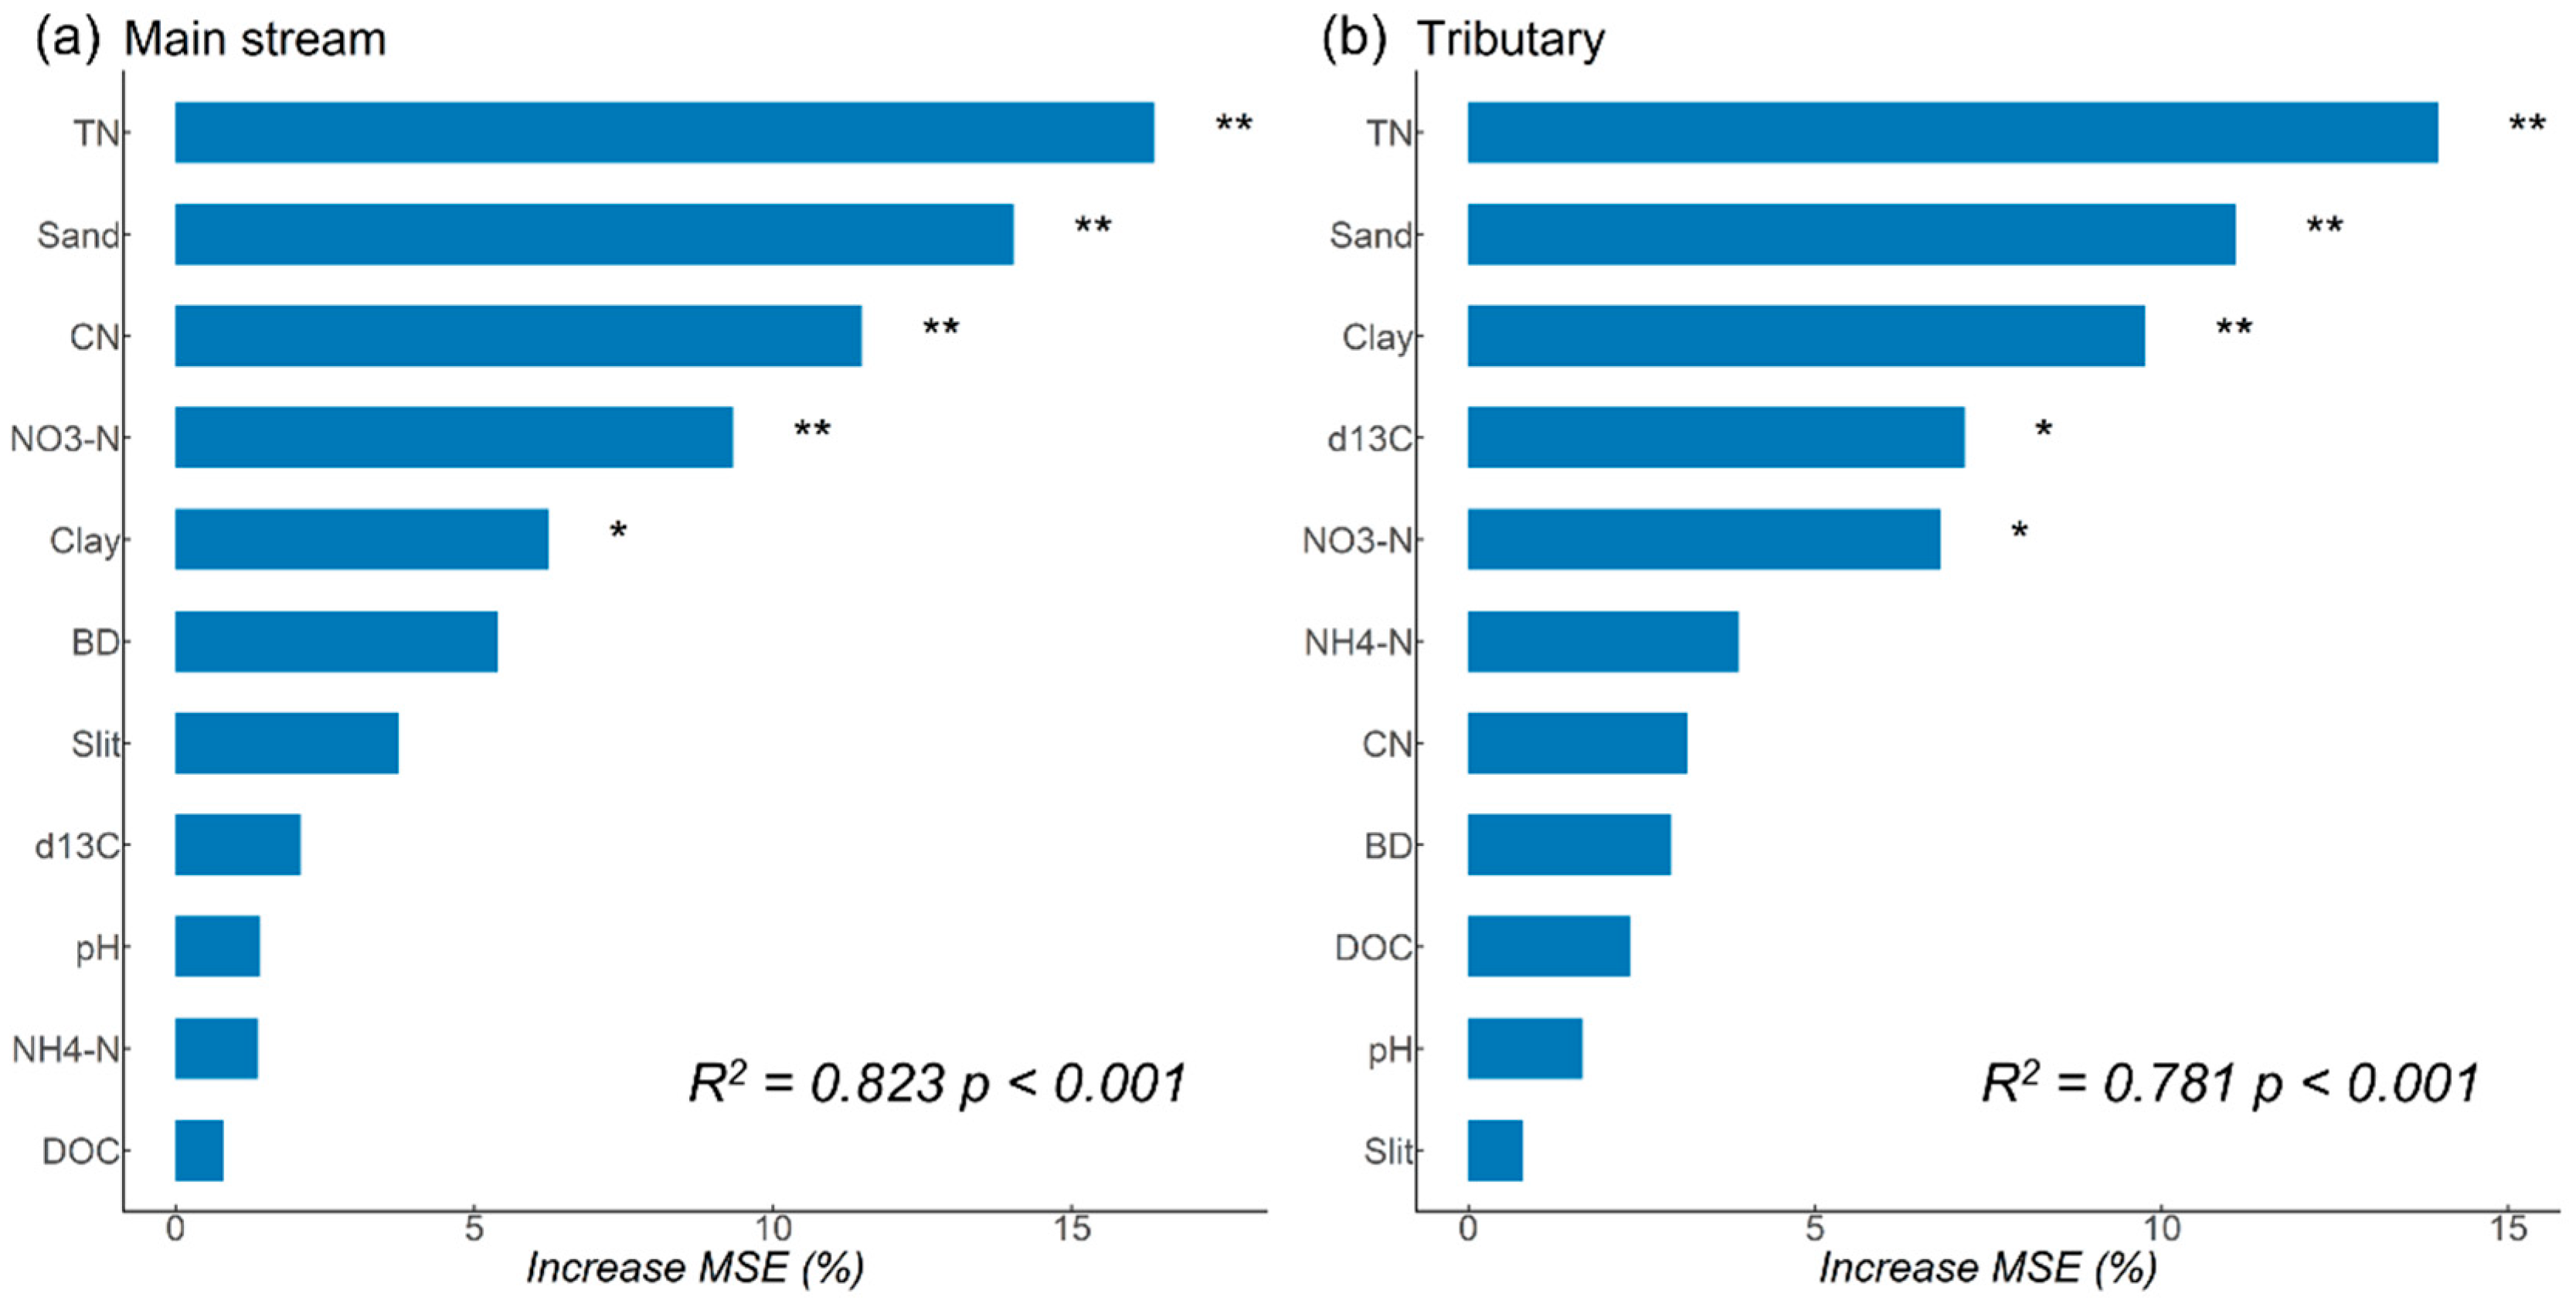
Figure 6. Effects of random forest predictor significance (increase in mean squared error [MSE; %]) on SOC in the water level fluctuation zones of the main stream (a) and tributary (b) regions of the Three Gorges Reservoir. The significance levels for each predictor were as follows: * p < 0.05 and ** p < 0.01.
The random forest model further revealed the significance of the main predictor variables on SOC (measured by the increase in the mean squared error (MSE)) (Figure 6). The results revealed that the TN content, sand content, C/N ratio, NO3-N ratio, and clay content significantly predicted the SOC content in the main stream region, with increases in the TN content, sand content, and C/N ratio exceeding 10%. In the tributary region, the SOC was driven mainly by the TN, sand, clay, δ13C, and NO3-N contents. Consistent with the main stream, the TN and sand contents remained the most important factors influencing the SOC.

3.3. Mineralization Dynamics of Different Soil Particle Size Fractions

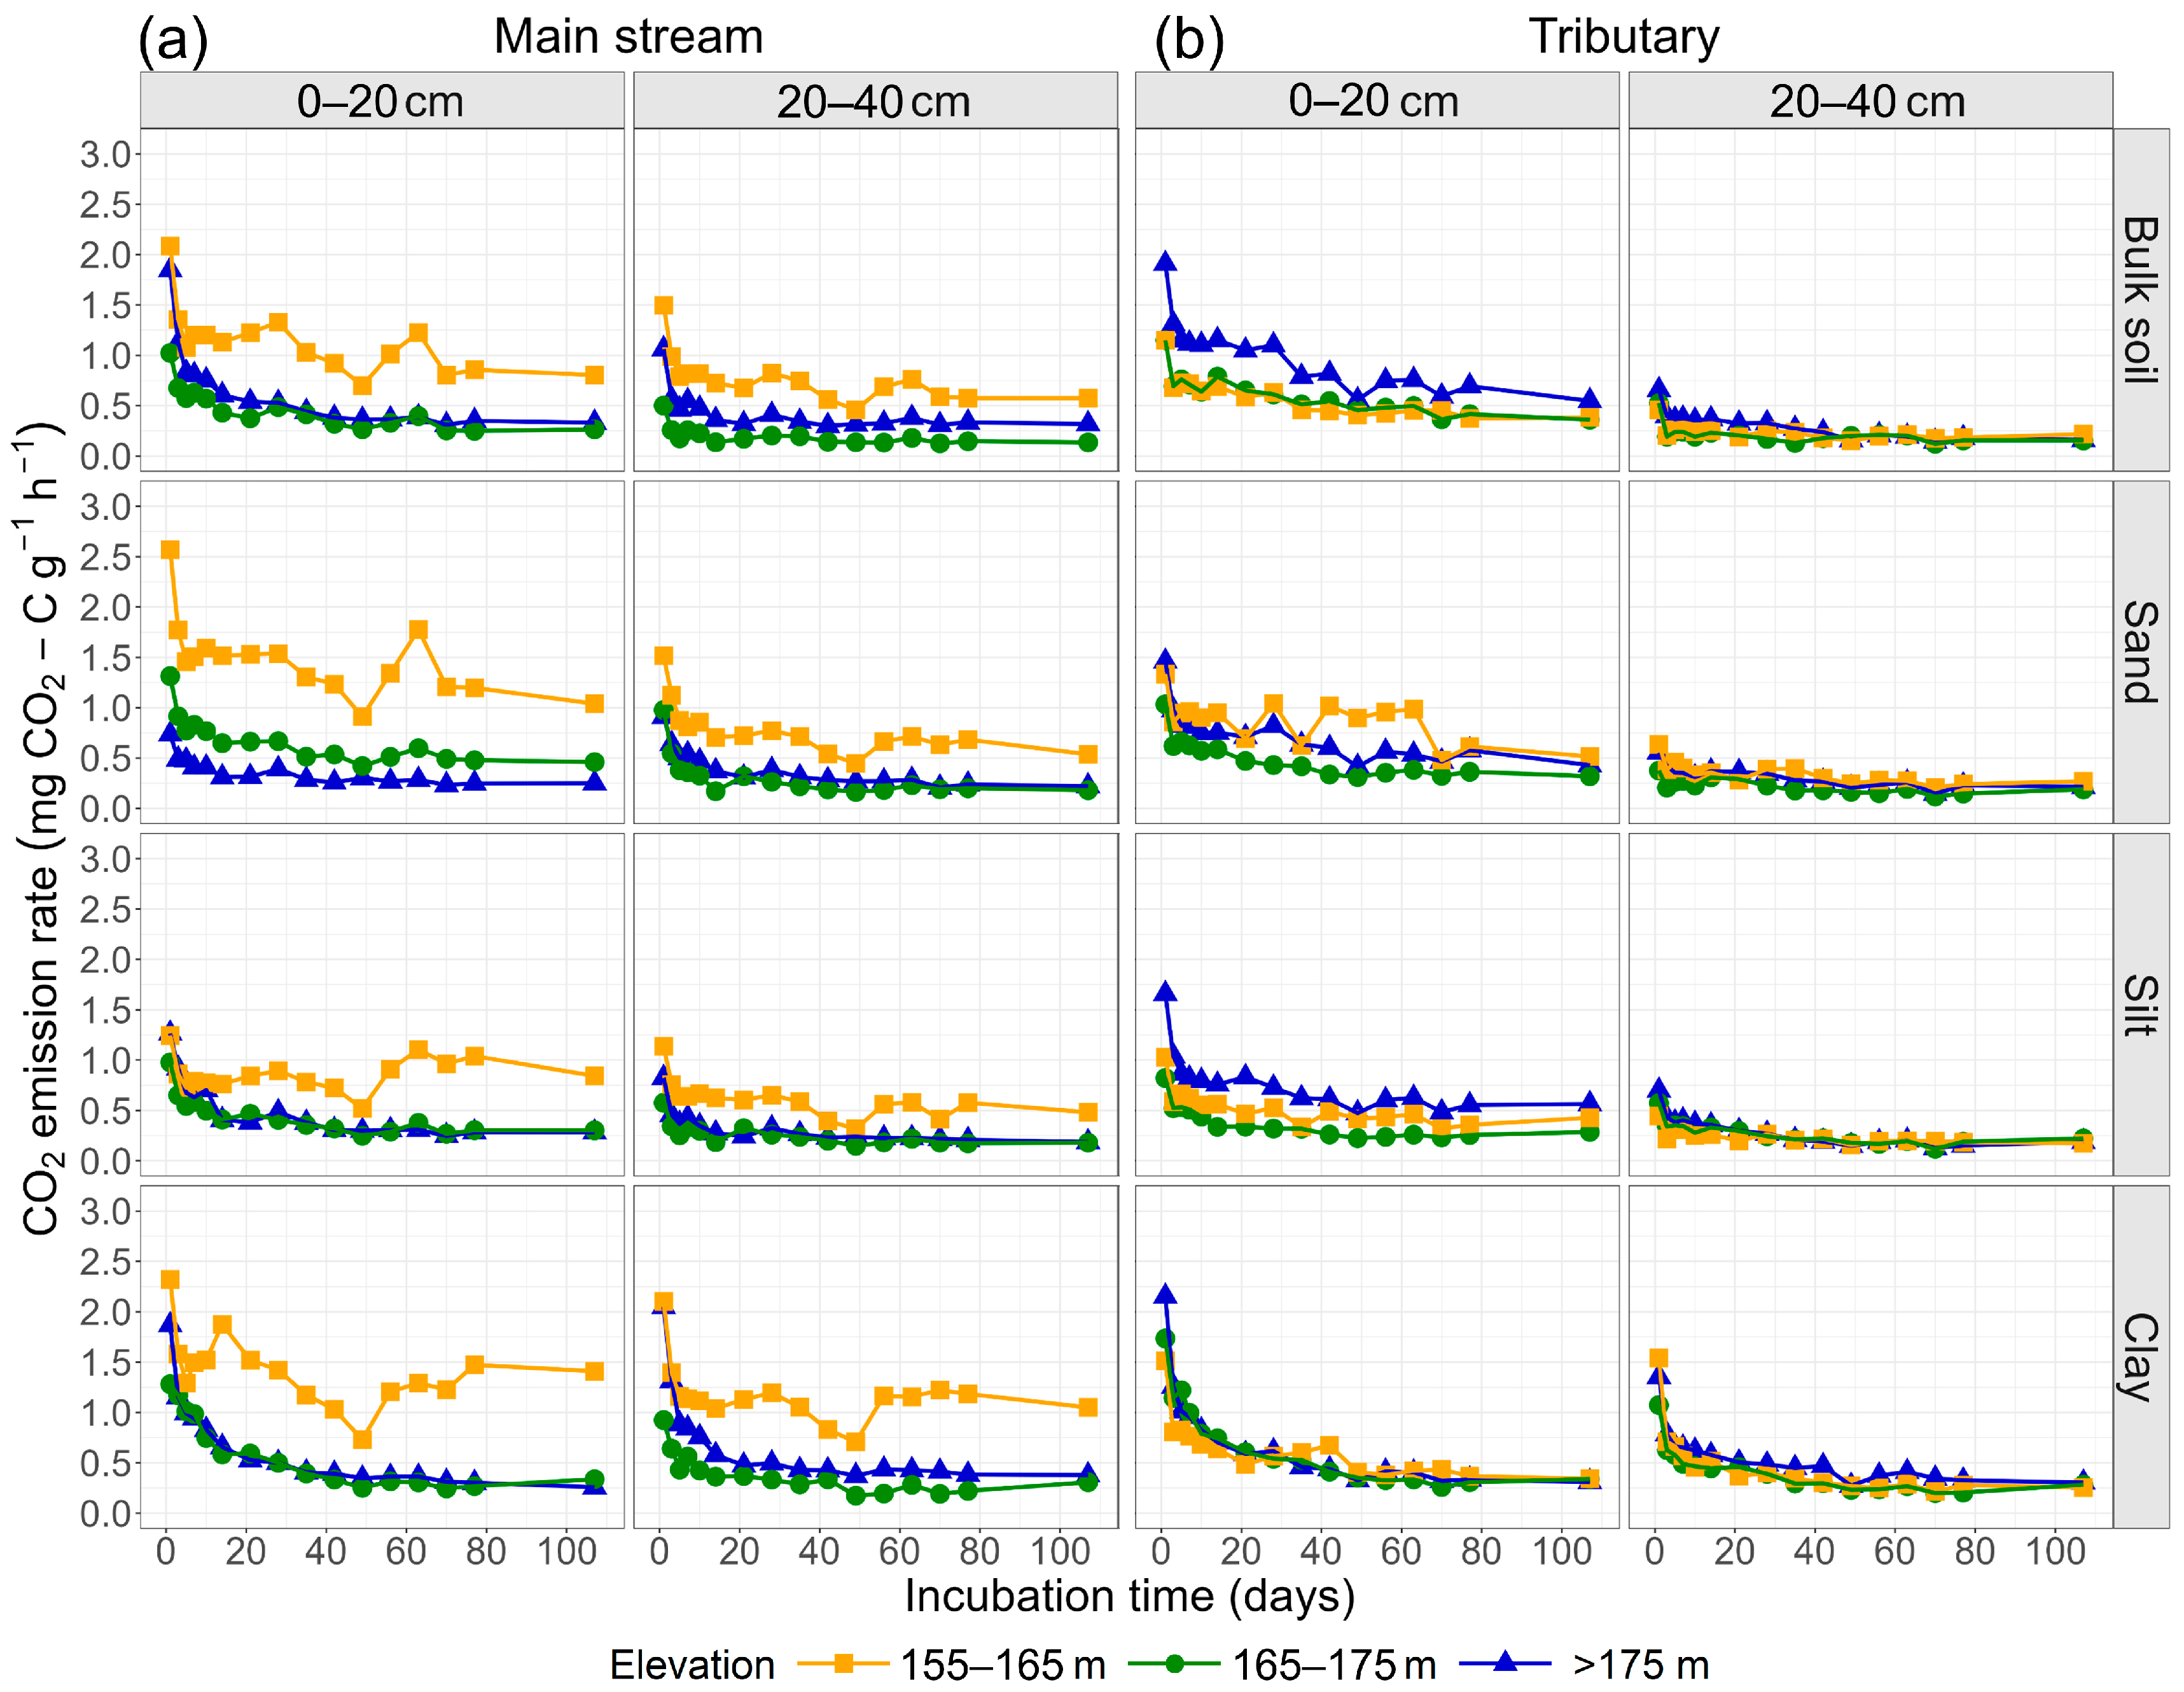
As shown in Figure 7, the CO2 emission rate per unit soil mass across different elevation zones generally decreased over the course of the incubation period. In the main stream region, the 155–165 m elevation zone presented a significantly higher emission rate than both the 165–175 m elevation zone and the non-flooded zone (p < 0.05). Specifically, in the 0–20 cm soil layer, the CO2 emission rate of the sand fraction increased significantly with decreasing elevation. In the 20–40 cm layer, both the bulk soil and all particle size fractions in the 155–165 m zone presented significantly higher emission rates than those at higher elevations (p < 0.05). Conversely, the tributary region displayed the opposite pattern, where the non-flooded zone had a significantly higher CO2 emission rate than did the fluctuation zones (p < 0.05). In terms of particle size, the clay fraction generally presented higher emission rates than both the silt and sand fractions did, particularly in the 20–40 cm soil layer. For example, in both the non-flooded zones of the main stream and the tributary, as well as in certain areas of the fluctuation zones, the clay fraction presented significantly higher emission rates than the other two fractions (p < 0.05). Additionally, notable differences were observed between clay and silt in some surface soil samples, with the clay fraction in the surface soil of the non-flooded zones in the main stream showing significantly higher emission rates than the sand fraction (p < 0.05).
Figure 7. CO2 emission rates per unit of soil mass at different elevations in the water-level-fluctuation zones of the main stream (a) and tributary (b) regions of the Three Gorges Reservoir (mean ± standard error, n = 3).
As shown in Table 2, the cumulative soil CO2 emission fluxes exhibited significant elevation differences in the WLFZ, where the 155–165 m elevation zone was significantly greater than the 165–175 m elevation zone and the non-flooded zone (p < 0.05). This trend was significant for the bulk soil, sand, silt, and clay fractions in the 0–20 cm soil layer, and the emission fluxes of the silt and clay fractions in the 20–40 cm soil layer were also significantly greater at 155–165 m than at the other elevations (p < 0.05). In the tributary region, although soils from the non-flooded zone generally presented higher cumulative CO2 emission fluxes than those from the two fluctuation zones, the differences among elevation levels were not statistically significant overall. Notably, significant distinctions were evident among the particle size fractions within the same elevation and depth. In the 0–20 cm layer of the main stream region, the CO2 fluxes from the sand fraction were significantly lower than those from the bulk soil and clay fractions at 165–175 m in elevation and in the non-flooded zone (p < 0.05), whereas no marked differences were observed among the particle sizes at 155–165 m in elevation. In the 20–40 cm layer, the clay fraction generally presented greater emission fluxes than the silt and sand fractions in both the 155–165 m elevation and non-flooded zones, with some of these differences being statistically significant (p < 0.05). A similar pattern was identified in the tributary region, where in the 20–40 cm layer, CO2 fluxes from the clay fraction in the non-flooded zone and at 155–165 m elevation were significantly greater than those from the silt and sand fractions (p < 0.05). These results indicate that finer particles, particularly clay, contribute more substantially to carbon mineralization in subsoil layers.
Table 2. Cumulative fluxes of soil CO2 emissions in the water level fluctuation zones of the main stream and tributary regions of the Three Gorges Reservoir (mg CO2-C·kg−1).
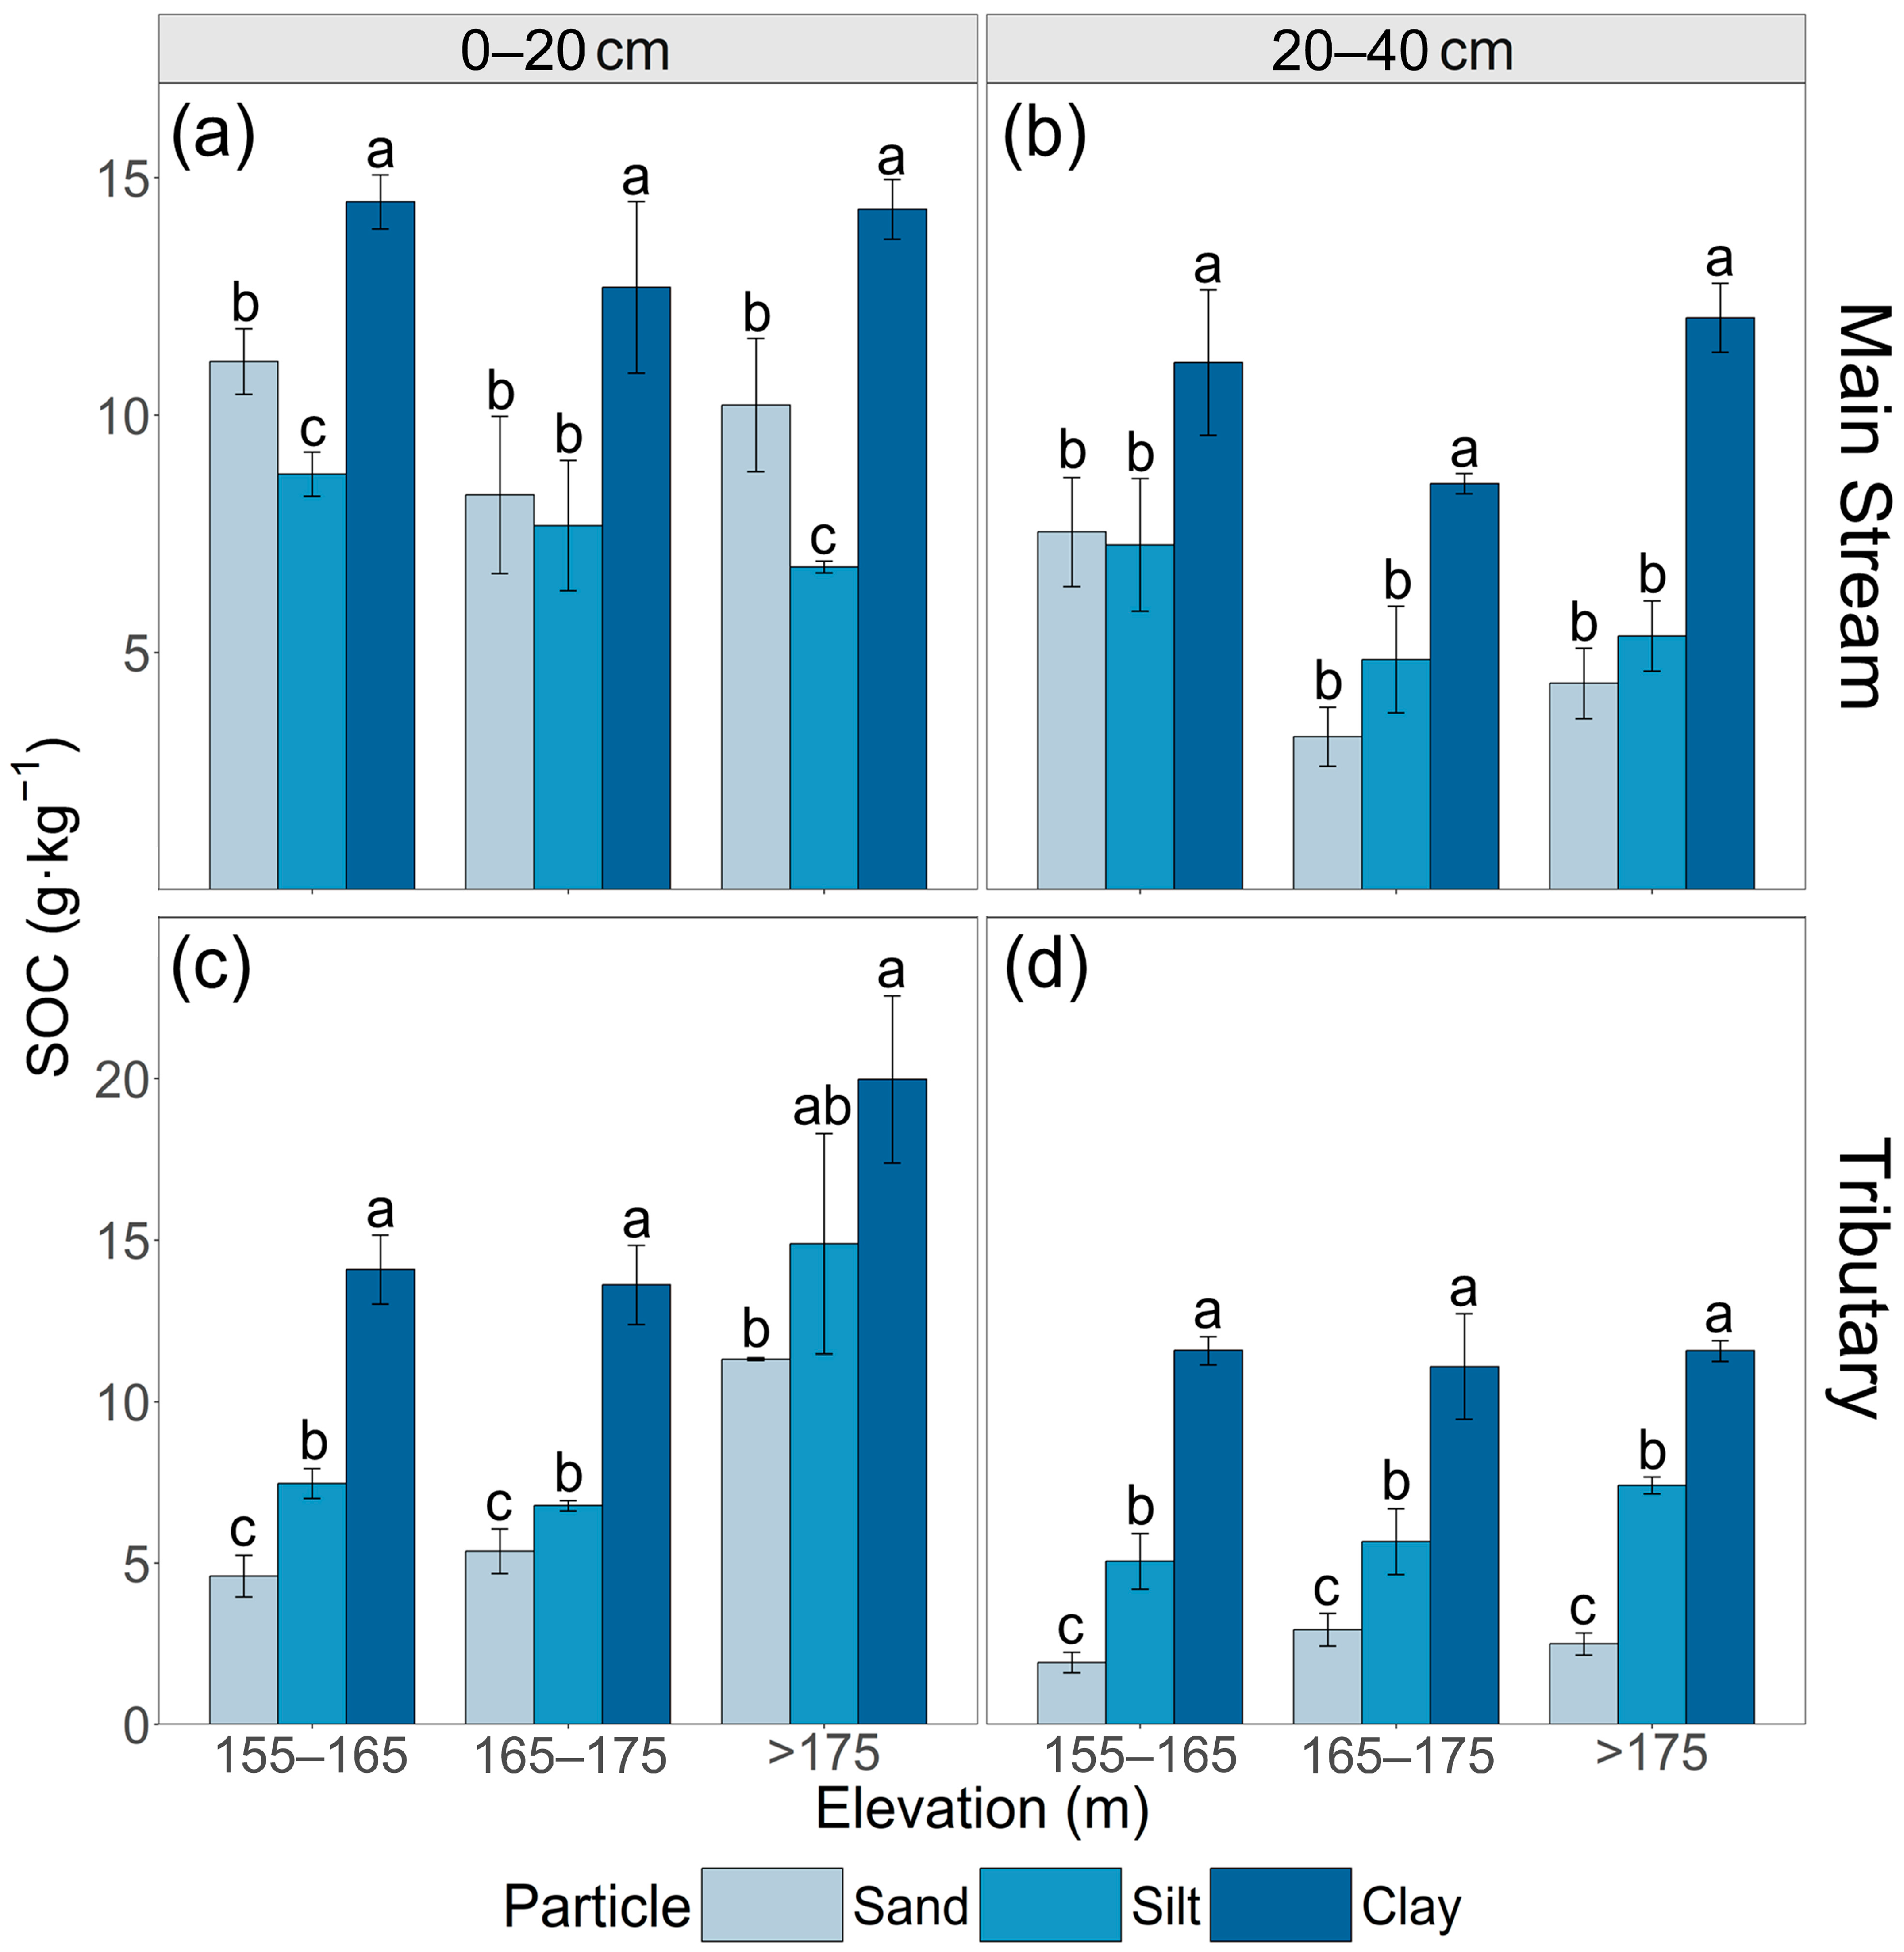
Figure 8 shows the distribution of the SOC content in different particle size fractions in the main stream and tributary regions. Overall, a consistent pattern was observed in the WLFZ, where the clay fraction had the highest SOC content, followed by the sand and silt fractions. In the main stream region, the clay fraction had a significantly greater SOC content than did the sand and silt fractions (p < 0.05). In contrast, the difference between the sand and silt fractions was not significant, except for the sand fraction, which was significantly greater than the silt fraction at 155–165 m in elevation and in the non-flooded zone in the 0–20 cm soil layer (p < 0.05). In the tributary region, the SOC contents of the different particle size fractions significantly decreased in the order of clay > silt > sand (p < 0.05), except in the non-flooded zone in the 0–20 cm soil layer, where the difference between the SOC contents of silt and those of clay and sand was not significant.
Figure 8. Soil organic carbon content of each particle size fraction at different elevations in the water level fluctuation zones of the main stream ((a): 0–20 cm; (b): 20–40 cm) and tributary ((c): 0–20 cm; (d): 20–40 cm) in the Three Gorges Reservoir (mean ± standard error, n = 3), different lowercase letters indicate significant (p < 0.05) differences between the same particle size fractions of the same soil layer at different elevations.
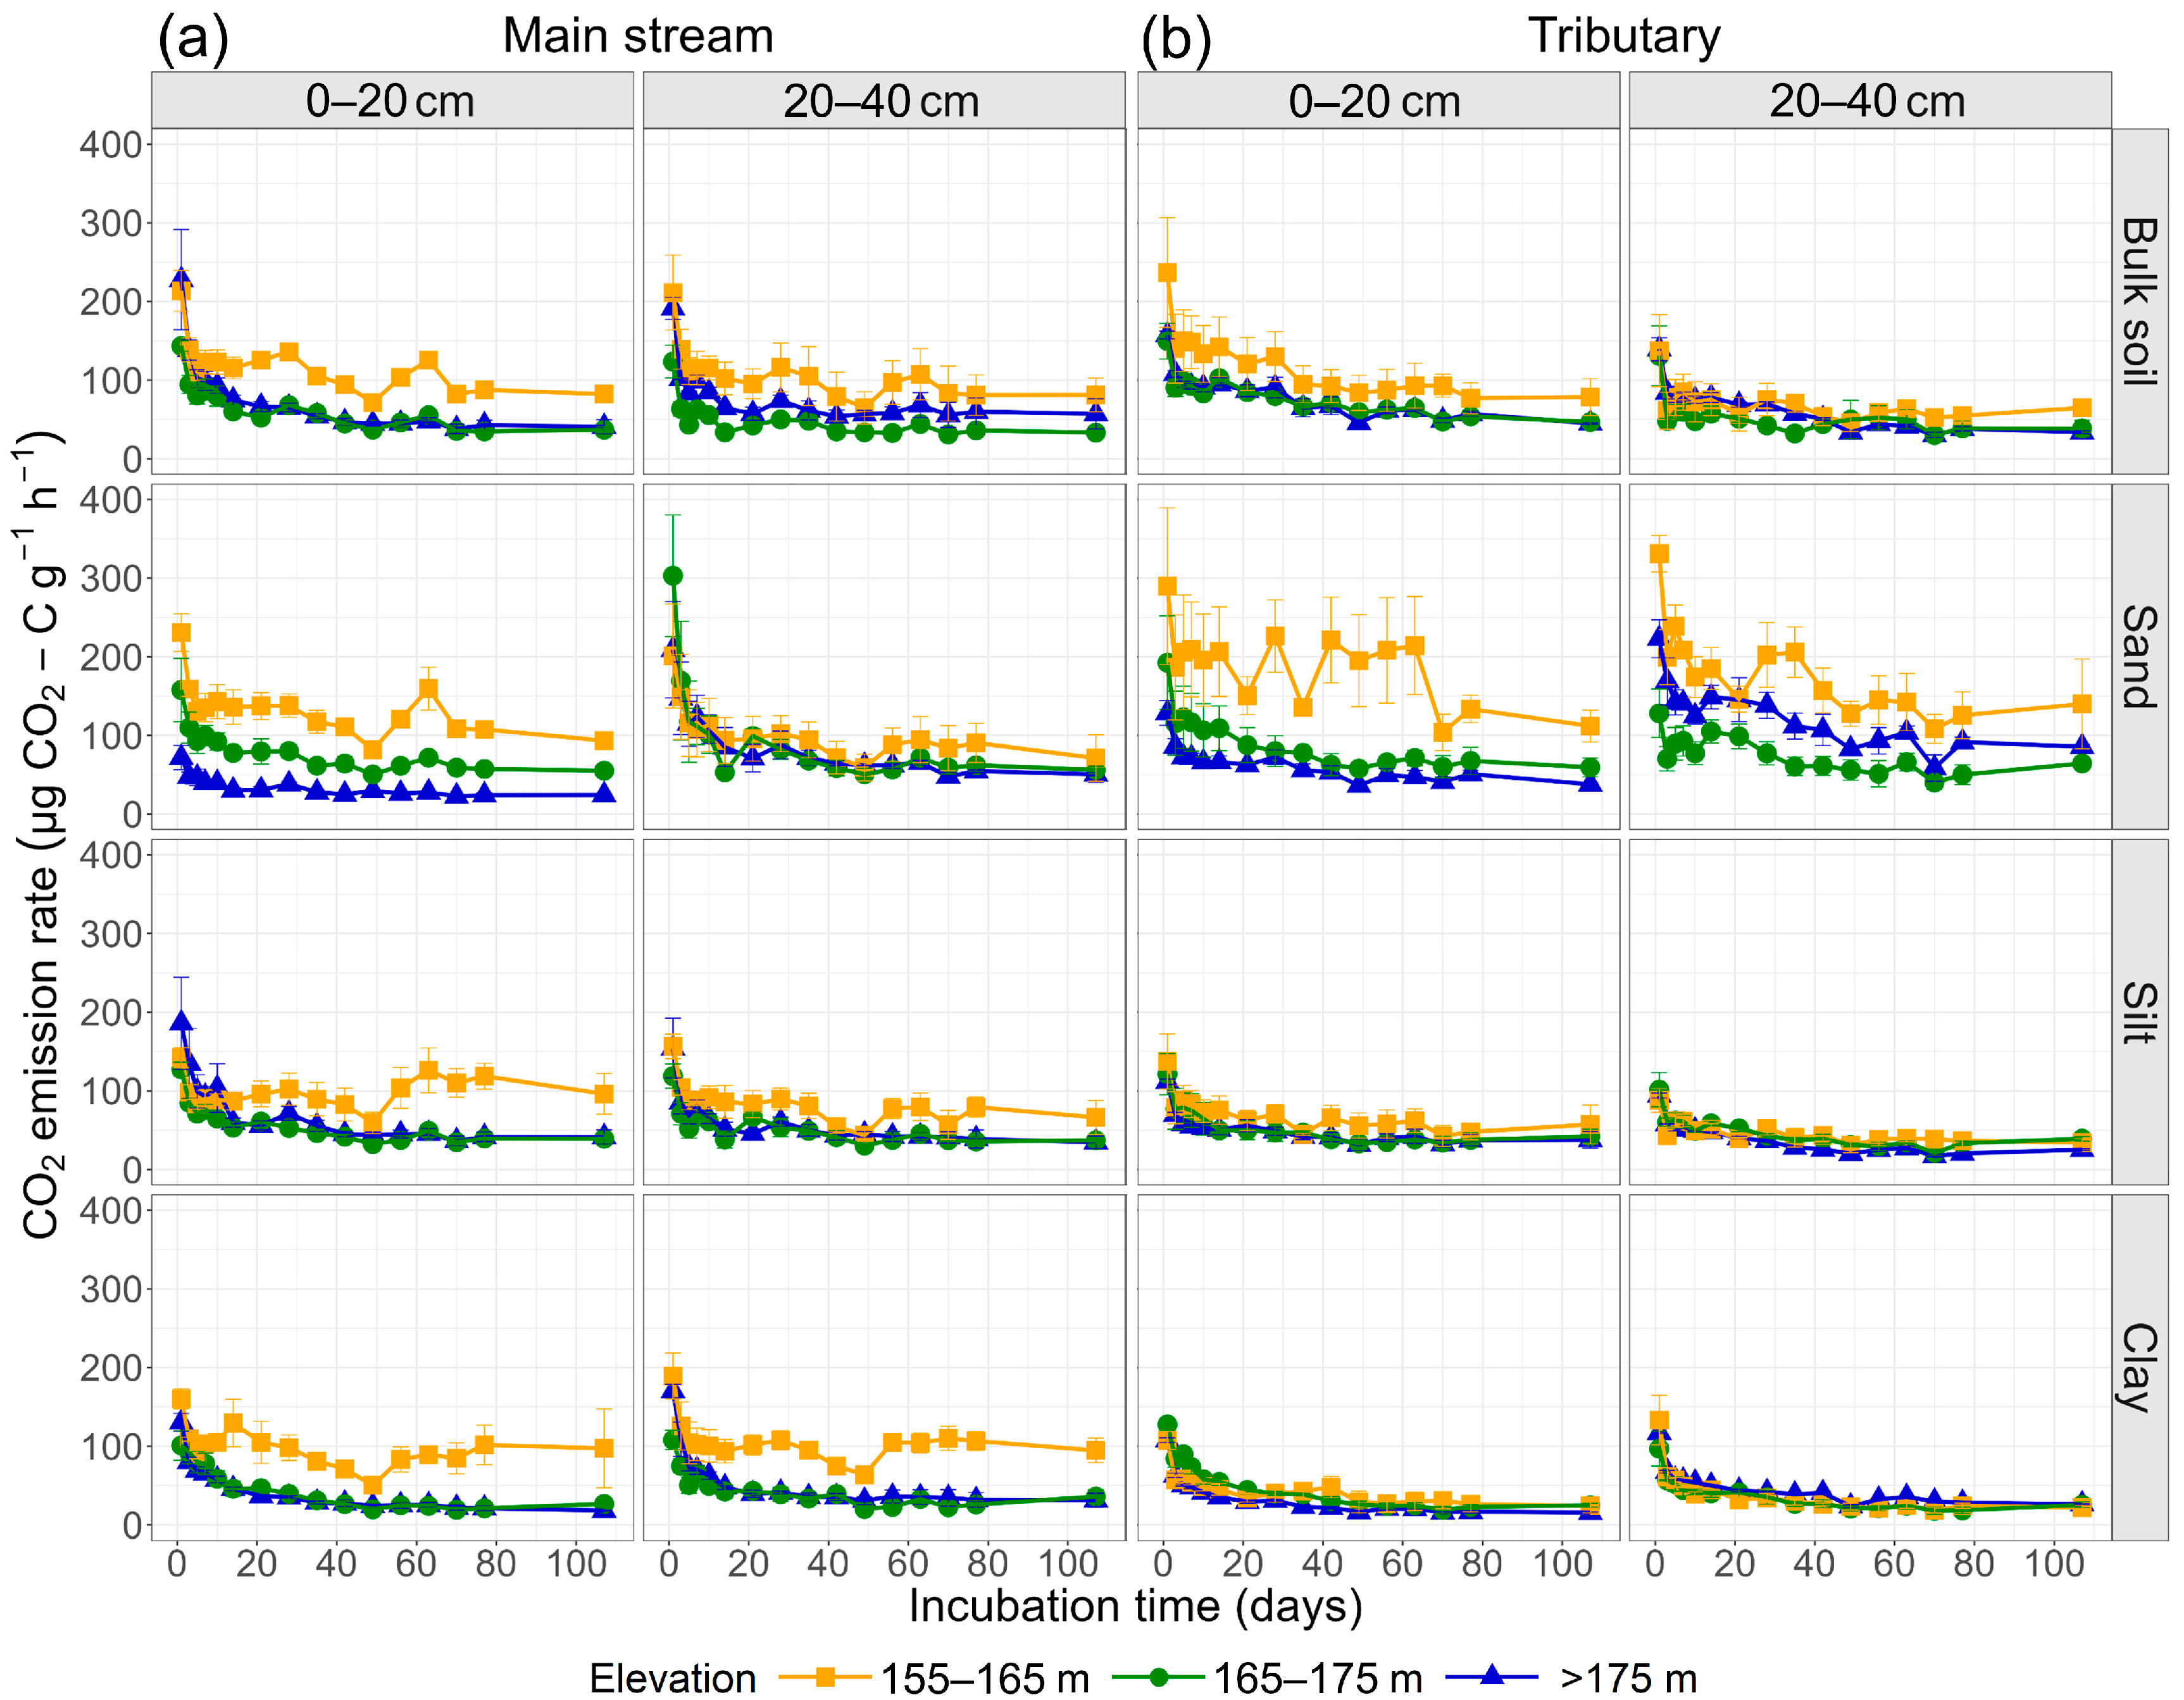
The CO2 emission rate per unit of C (μg CO2-C·g−1C·h−1) reflects the turnover rate of the soil carbon pool. Overall, the carbon turnover rates decreased with increasing incubation time (Figure 9). Across both the main stream and tributary regions, the turnover rates followed a trend: 155–165 m > 165–175 m > non-flooded zone (p < 0.05). In the 20–40 cm soil layer of the main stream, the bulk soil at 155–165 m exhibited significantly greater turnover than that in the non-flooded zone, which in turn was greater than that at 165–175 m (p < 0.05). A similar pattern was observed for the sand fraction in the tributary region. In the 0–20 cm layer, the turnover rates of the sand fractions significantly increased with decreasing elevation in both regions (p < 0.05). Additionally, across most layers, the sand fraction presented significantly higher turnover rates than did silt and clay (p < 0.05), with the most pronounced stratification (sand > silt > clay) found in the 0–20 cm layer at 155–165 m in the tributary region.
Figure 9. CO2 emission rates per unit of C at different elevations in the water-level-fluctuation zones of the main stream (a) and tributary (b) regions of the Three Gorges Reservoir (mean ± standard error, n = 3).

4. Discussion

4.1. Elevation-Dependent Soil Organic Carbon Dynamics

The elevation gradient in the WLFZ of the TGR significantly regulates the accumulation and mineralization of SOC by altering the soil particle size fraction, nutrient availability, and hydrological conditions. This study revealed that the SOC content and stock in the tributary decreased with decreasing elevation (Figure 3), which is consistent with the results reported by Su et al. (2017) []. At lower elevations, prolonged exposure to water erosion and sediment transport intensifies soil loss, resulting in significant losses of carbon and nitrogen []. However, in the main stream, the SOC content and stock at 155–165 m elevation were significantly greater than those at 165–175 m elevation and in the non-flooded zone (Figure 3), which is consistent with the findings of Ran et al. (2023) []. This pattern may be attributed to intensified biogeochemical processes caused by ship traffic and rainfall-driven runoff. Continuous flood-exposure cycles result in low redox potential, which suppresses organic matter mineralization and enhances SOC accumulation [].
Additionally, the study identified TN and soil particle size—particularly the proportion of sand—as primary factors influencing the SOC content (Figure 5). As TN is predominantly associated with organic matter, it serves as an indicator of organic input. It plays a regulatory role in microbial processes that affect SOC accumulation and decomposition []. Higher nitrogen availability supports microbial breakdown and assimilation of organic material, thereby increasing the proportion of readily decomposable organic carbon [,]. Differences in sediment deposition rates along elevation gradients further influence soil texture and the spatial distribution of SOC. Studies by Bao et al. (2015) and Su et al. (2017) reported that lower elevations in both the main stream and tributary sections of the TGR are subject to significantly greater sediment deposition [,]. Over time, this process increases the sand content while depleting silt and clay, resulting in progressively coarser soil textures at mid-elevations [,,]. In this study, although the sand fractions contained less SOC overall, they presented notably higher carbon turnover rates than the silt and clay fractions (Figure 7). Thus, elevation affects the SOC content and stock by affecting sediment deposition rates, which increases the proportion of sand in low-elevation zones and enhances SOC mineralization rates. This partially explains why, despite the higher SOC content at 155–165 m elevation, the carbon pool is more active and has a faster turnover rate.
Furthermore, elevation gradients play a crucial role in influencing SOC stability and mineralization rates by altering hydrological regimes and the frequency of wet–dry cycles. The 155–165 m elevation zone, in particular, experiences extensive and frequent alternations between flooding and exposure, creating a pronounced “wet-dry cycle” environment []. These moisture fluctuations accelerate the incorporation of plant residues and organic matter, while markedly stimulating microbial activity, thereby resulting in enhanced SOC mineralization, as evidenced by a high CO2 emission rate per unit mass of carbon (Figure 8) [,]. Wang et al. (2024) reported that alternating wet–dry conditions intensify the priming effect by increasing soil microbial biomass and nutrient availability []. Microorganisms adapted to initial wet–dry cycles exhibit greater tolerance to water stress and sustain active decomposition of soil organic matter. Their increased population further contributes to the acceleration of SOC mineralization []. Nagano et al. (2019) reported that repeated wet–dry cycles increase microbial degradation in both labile and older organic carbon pools []. These cycles also induce considerable redox shifts within the soil: reducing conditions during submergence inhibit SOC breakdown and temporarily favor carbon accumulation, whereas oxidizing conditions following re-stimulate microbial processes, triggering rapid mineralization and pulsed CO2 emissions—a phenomenon known as the Birch effect []. Thus, alternating redox environments may increase carbon inputs but simultaneously accelerate carbon losses, leading to increased SOC turnover and decreased carbon stability at lower elevations. The findings of the present study corroborate these dynamics (Figure 6 and Figure 8). Compared with previous studies that mainly described elevation–SOC patterns, our results further demonstrate that such patterns are mediated by hydrological fluctuations that reshape the soil particle-size composition, suggesting that elevation effects on SOC are expressed through changes in soil texture and associated stability.

4.2. Differences in Carbon Stability Among Particle Size Fractions

SOC stability is strongly influenced by its distribution among different particle size fractions. Particle size affects both the binding capacity of organic matter to minerals and microbial efficiency in utilizing carbon sources, thus jointly determining SOC stability and turnover []. Our results show that at most elevations and depths, the sand fraction results in a significantly higher SOC turnover rate than the silt and clay fractions do (p < 0.05), indicating greater carbon activity and lower stability (Figure 6 and Figure 8). This pattern is consistent with previous studies showing that sand particles, owing to their lower surface area and weaker organo-mineral associations, retain less stable SOC [,]. However, the extent of SOC instability in the sand fractions in our study was even more pronounced than that in other ecosystems []. This may be related to the unique hydrological disturbance and sedimentation dynamics of the TGR. Previous research has indicated that sediment deposition rates in the WLFZ increase as elevation decreases [,], with lower elevation zones (e.g., 155–165 m) tending to accumulate a greater proportion of coarse particles due to hydrodynamic sorting. In addition, the WLFZ experiences periodic wet–dry alternations that cause strong redox fluctuations, increasing substrate availability and microbial decomposition, particularly in coarse-textured soils with high aeration [,]. The dominance of annual and biennial herbaceous vegetation with labile litter inputs may further contribute to rapid carbon turnover, while microbial communities adapted to such hydrological variability exhibit flexible metabolism that accelerates SOC mineralization [,]. Our findings are consistent, showing elevated sand content and greater carbon turnover at mid-elevations, suggesting that prolonged sediment deposition has altered the soil texture and reduced SOC stability. Moreover, while finer particles such as clay and silt are well-documented for their role in stabilizing SOC through strong mineral associations and the formation of soil aggregates [,], our data provide empirical support for this mechanism, as evidenced by the significantly lower SOC mineralization rates observed in the clay fractions (Figure 8). The variation in SOC stability across particle size classes appears to result not only from physical protection mechanisms but also from differences in microbial efficiency in accessing and utilizing organic carbon substrates [,]. Although clay fractions generally present relatively high microbial biomass carbon (MBC) concentrations, the ratio of MBC to SOC remains low [], indicating limited microbial assimilation efficiency. This may be attributed to the restricted availability of organic substrates caused by strong mineral binding and reduced accessibility, reinforcing the role of mineral-associated protection in SOC stabilization [,]. Our results indicate that hydrological disturbances in the WLFZ affect sediment deposition and particle size composition, thereby increasing SOC instability in the sand fraction. These findings suggest that SOC stability in TGR is shaped jointly by the particle size class and elevation-dependent hydrological conditions.

4.3. Management Implications

This study revealed that soils at middle elevations (155–165 m) of the TGR have a high sand content, which contributes to increased CO2 emission fluxes and turnover rates, indicating high carbon reactivity but low stability. The loose structure, low surface area, and poor adsorption capacity of sandy particles make it difficult to form stable organic-mineral complexes, which are key factors contributing to the easy mineralization and loss of SOC [,]. One potential management approach involves reducing sand accumulation through hydrological regulation, such as adaptive control of seasonal water storage during the winter impoundment period, which can mitigate sediment disturbance and promote the retention of fine particles []. However, large-scale hydrological adjustments in the TGR are constrained by its operational priorities of flood control and hydropower generation, which limits the feasibility of basin-scale interventions. The restoration and optimization of vegetation structure represent another ecological strategy to improve soil texture and SOC stability []. Over the past few decades, a series of ecological restoration initiatives have been implemented throughout TGR, including slope stabilization and vegetation reconstruction along the WLFZ, which have significantly improved sediment retention, soil structure, and vegetation recovery []. Root exudates and root activity increase the formation of soil aggregates, promote fine particle stability, and increase organic carbon input to the soil []. Based on these principles, we recommend the zoned cultivation of functional plant species across elevational gradients in the WLFZ []. Flood-tolerant, soil-stabilizing perennial grasses—such as Cynodon dactylon and Trifolium repens—should be established at various elevations. At the same time, high-elevation zones should be planted with species characterized by high carbon input potential and favorable C/N ratios to improve the quality of organic matter inputs.

4.4. Limitations

This study investigated the influence of water level fluctuations on SOC dynamics in the WLFZ of the TGR through a combination of field sampling and laboratory incubation experiments. Key regulatory factors were identified, and SOC mineralization patterns across different environmental conditions were characterized. The sampling sites were located in the midstream section of the WLFZ and focused on natural soils primarily covered by annual and biennial herbaceous vegetation. Representative plots were selected to minimize variation in the soil properties, vegetation coverage, and microtopography within each elevation zone. Although the sampling design effectively captured the dominant elevation-dependent trends in SOC across the study area, we acknowledge that the limited number of replicates constrains the generalization of our findings to the entire WLFZ. The SOC mineralization experiments were performed at constant temperature and moisture to ensure comparability among the treatments. However, these static incubation conditions cannot fully represent the natural hydrological fluctuations characteristic of the WLFZ. In field environments, alternating wet–dry cycles can substantially modify the soil oxygen status, substrate availability, and microbial community composition [,,]. These changes may trigger microbial priming effects and transient redox reactions that accelerate the decomposition of both labile and mineral-associated organic carbon. Consequently, SOC mineralization rates under fluctuating conditions could differ markedly from those observed under constant incubation. Future research should therefore aim to simulate dynamic moisture regimes or incorporate in situ monitoring to better capture the non-linear SOC responses to hydrological variability. Moreover, expanding the spatial coverage of sampling and integrating remote sensing and geochemical modeling approaches could improve the regional applicability of the findings. Such combined field–laboratory frameworks would help elucidate both the mechanistic and spatial controls of SOC stability in the WLFZ.

5. Conclusions

This study focuses on the typical main stream and tributary WLFZ of the TGR and systematically assesses the SOC distribution, mineralization characteristics, and key controlling factors across different elevations. The SOC content and mineralization rates clearly exhibited spatial patterns influenced by elevation. In the main stream area, soils at mid-elevations (155–165 m) present both high SOC contents and elevated mineralization rates. In contrast, in the tributary region, SOC tends to accumulate more at higher elevations. The results of the particle size analysis further indicate that the sand fraction results in a significantly greater SOC turnover rate than the silt and clay fractions do, reflecting reduced carbon stability in the sand-dominated soils. The random forest analysis identified TN and soil particle size composition as the dominant variables influencing the spatial variability of SOC. These results support the hypothesis that, in addition to nitrogen availability, the particle size fraction plays a central role in shaping the SOC distribution across the WLFZ. Elevation-dependent sedimentation patterns driven by hydrological fluctuations in the TGR are key in determining soil texture, which in turn affects SOC dynamics. This research deepens the understanding of the mechanisms governing SOC behavior in the WLFZ. It provides a scientific basis for improving land management, guiding ecological restoration, and enhancing carbon sequestration in reservoir environments.

Author Contributions

X.L.: Writing—review and editing, Writing—original draft, Visualization, Validation, Software, Formal analysis, Data curation. Q.L.: Data curation, Writing—original draft, Visualization. D.H.: Software, Visualization. H.D.: Data curation, Investigation. B.Y.: Software, Visualization. X.W.: Conceptualization, Funding acquisition, Project administration, Methodology, Supervision, Resources, Writing—review and editing. All authors have read and agreed to the published version of the manuscript.

Funding

This study was supported by the National Natural Science Foundation of China (42171067) and the National Key Research and Development Program of China (2023YFD1901204).

Data Availability Statement

The data that support the findings of this study are available from the corresponding author upon reasonable request.

Conflicts of Interest

Author Qiuhong Li was employed by the company POwERCHINA Chengdu Engineering Corporation Limited. The remaining authors declare that the research was conducted in the absence of any commercial or financial relationships that could be construed as a potential conflict of interest.

References

  1. Zhao, Y.; Lin, J.; Cheng, S.; Wang, K.; Kumar, A.; Yu, Z.-G.; Zhu, B. Linking Soil Dissolved Organic Matter Characteristics and the Temperature Sensitivity of Soil Organic Carbon Decomposition in the Riparian Zone of the Three Gorges Reservoir. Ecol. Indic. 2023, 154, 110768. [Google Scholar] [CrossRef]
  2. Yu, Z.; Kumar, A.; Zhang, S.; Yu, Z.-G.; Shan, S.; Zhu, B.; Lin, J. Thermal Sensitivity of Soil Organic Carbon Decomposition in Riparian Ecosystems. Plant Soil 2024, 1–15. [Google Scholar] [CrossRef]
  3. Ye, C.; Li, S.; Zhang, Y.; Tong, X.; Zhang, Q. Assessing Heavy Metal Pollution in the Water Level Fluctuation Zone of China’s Three Gorges Reservoir Using Geochemical and Soil Microbial Approaches. Environ. Monit. Assess. 2013, 185, 231–240. [Google Scholar] [CrossRef] [PubMed]
  4. Miao, C.; Borthwick, A.; Liu, H.; Liu, J. China’s Policy on Dams at the Crossroads: Removal or Further Construction? Water 2015, 7, 2349–2357. [Google Scholar] [CrossRef]
  5. Bai, Q.; Bao, Y.; Yu, Y.; Yang, J.; Wang, Y.; Wei, J. Effects of Different Vegetation Restoration Models on Soil Nutrients in the Water Level Fluctuation Zone of a Large Reservoir. Ecol. Indic. 2024, 169, 112955. [Google Scholar] [CrossRef]
  6. Zhu, K.; Li, W.; Yang, S.; Ran, Y.; Lei, X.; Ma, M.; Wu, S.; Huang, P. Intense Wet-Dry Cycles Weakened the Carbon Sequestration of Soil Aggregates in the Riparian Zone. CATENA 2022, 212, 106117. [Google Scholar] [CrossRef]
  7. Wei, C.; Qiu, Y.; Chi, Y.; Li, Y.; Yi, W.; Zhou, Y.; Yan, C. The Patterns and Controlling Factors of Soil Carbon and Nitrogen in the Water Level Fluctuation Zone of the Three Gorges Reservoir. J. Soils Sediments 2024, 25, 179–194. [Google Scholar] [CrossRef]
  8. Wang, H.; Gao, D.; Hu, G.; Xu, W.; Zhuge, Y.; Bai, E. Drying-Rewetting Events Enhance the Priming Effect on Soil Organic Matter Mineralization by Maize Straw Addition. CATENA 2024, 238, 107872. [Google Scholar] [CrossRef]
  9. Ye, C.; Butler, O.M.; Chen, C.; Liu, W.; Du, M.; Zhang, Q. Shifts in Characteristics of the Plant-Soil System Associated with Flooding and Revegetation in the Riparian Zone of Three Gorges Reservoir, China. Geoderma 2020, 361, 114015. [Google Scholar] [CrossRef]
  10. Shi, W.; Du, M.; Ye, C.; Zhang, Q. Divergent Effects of Hydrological Alteration and Nutrient Addition on Greenhouse Gas Emissions in the Water Level Fluctuation Zone of the Three Gorges Reservoir, China. Water Res. 2021, 201, 117308. [Google Scholar] [CrossRef]
  11. Zhu, K.; Ma, M.; Ran, Y.; Liu, Z.; Wu, S.; Huang, P. In Mitigating CO2 Emission in the Reservoir Riparian: The Influences of Land Use and the Dam-Triggered Flooding on Soil Respiration. Soil Tillage Res. 2020, 197, 104522. [Google Scholar] [CrossRef]
  12. Liu, F.; Ding, Y.; Liu, J.; Latif, J.; Qin, J.; Tian, S.; Sun, S.; Guan, B.; Zhu, K.; Jia, H. The Effect of Redox Fluctuation on Carbon Mineralization in Riparian Soil: An Analysis of the Hotspot Zone of Reactive Oxygen Species Production. Water Res. 2024, 265, 122294. [Google Scholar] [CrossRef] [PubMed]
  13. Ye, C.; Zhang, K.; Deng, Q.; Zhang, Q. Plant Communities in Relation to flooding and Soil Characteristics in the Water Level Fluctuation Zone of the Three Gorges Reservoir, China. Environ. Sci. Pollut. Res. 2013, 20, 1794–1802. [Google Scholar] [CrossRef]
  14. Wang, Y.; Liu, Y.; Ma, M.; Ding, Z.; Wu, S.; Jia, W.; Chen, Q.; Yi, X.; Zhang, J.; Li, X.; et al. Dam-Induced Difference of Invasive Plant Species Distribution along the Riparian Habitats. Sci. Total Environ. 2022, 808, 152103. [Google Scholar] [CrossRef]
  15. Khurram, D.; Tang, Q.; Bao, Y.; He, X.; Li, J. Flow Regulation Controls Sediment, Carbon, and Nutrient Dynamics across the Elevation Gradient in the Water Level Fluctuation Zone of the Three Gorges Reservoir, China. J. Soils Sediments 2023, 23, 3201–3218. [Google Scholar] [CrossRef]
  16. Ran, Y.; Wu, S.; Jiang, Y.; Qu, J.; Kaushalya Herath, I.; Huang, P. The Legacy Effects of Soil Types on Carbon Content Are Erased by Extreme Flooding Stress in a Water-Level Drawdown Zone. CATENA 2023, 231, 107283. [Google Scholar] [CrossRef]
  17. Teng, M.; Zeng, L.; Xiao, W.; Huang, Z.; Zhou, Z.; Yan, Z.; Wang, P. Spatial Variability of Soil Organic Carbon in Three Gorges Reservoir Area, China. Sci. Total Environ. 2017, 599–600, 1308–1316. [Google Scholar] [CrossRef] [PubMed]
  18. Li, D.; Niu, S.; Luo, Y. Global Patterns of the Dynamics of Soil Carbon and Nitrogen Stocks Following Afforestation: A Meta-analysis. New Phytol. 2012, 195, 172–181. [Google Scholar] [CrossRef]
  19. Ran, Y.; Wu, S.; Zhu, K.; Li, W.; Liu, Z.; Huang, P. Soil Types Differentiated Their Responses of Aggregate Stability to Hydrological Stresses at the Riparian Zones of the Three Gorges Reservoir. J. Soils Sediments 2020, 20, 951–962. [Google Scholar] [CrossRef]
  20. Von Lützow, M.; Kögel-Knabner, I.; Ekschmitt, K.; Flessa, H.; Guggenberger, G.; Matzner, E.; Marschner, B. SOM Fractionation Methods: Relevance to Functional Pools and to Stabilization Mechanisms. Soil Biol. Biochem. 2007, 39, 2183–2207. [Google Scholar] [CrossRef]
  21. Ding, F.; Sun, W.; Huang, Y.; Hu, X. Larger Q10 of Carbon Decomposition in Finer Soil Particles Does Not Bring Long-lasting Dependence of Q10 on Soil Texture. Eur. J. Soil Sci. 2018, 69, 336–347. [Google Scholar] [CrossRef]
  22. Craine, J.M.; Morrow, C.; Fierer, N. Microbial Nitrogen Limitation Increases Decomposition. Ecology 2007, 88, 2105–2113. [Google Scholar] [CrossRef] [PubMed]
  23. Bimüller, C.; Mueller, C.W.; Von Lützow, M.; Kreyling, O.; Kölbl, A.; Haug, S.; Schloter, M.; Kögel-Knabner, I. Decoupled Carbon and Nitrogen Mineralization in Soil Particle Size Fractions of a Forest Topsoil. Soil Biol. Biochem. 2014, 78, 263–273. [Google Scholar] [CrossRef]
  24. Tang, Q.; Collins, A.L.; Wen, A.; He, X.; Bao, Y.; Yan, D.; Long, Y.; Zhang, Y. Particle Size Differentiation Explains Flow Regulation Controls on Sediment Sorting in the Water-Level Fluctuation Zone of the Three Gorges Reservoir, China. Sci. Total Environ. 2018, 633, 1114–1125. [Google Scholar] [CrossRef]
  25. Wang, Y.; Chen, F.; Zhang, M.; Chen, S.; Tan, X.; Liu, M.; Hu, Z. The Effects of the Reverse Seasonal Flooding on Soil Texture within the Hydro-Fluctuation Belt in the Three Gorges Reservoir, China. J. Soils Sediments 2018, 18, 109–115. [Google Scholar] [CrossRef]
  26. Swanston, C.W.; Caldwell, B.A.; Homann, P.S.; Ganio, L.; Sollins, P. Carbon Dynamics during a Long-Term Incubation of Separate and Recombined Density Fractions from Seven Forest Soils. Soil Biol. Biochem. 2002, 34, 1121–1130. [Google Scholar] [CrossRef]
  27. Mueller, C.W.; Gutsch, M.; Kothieringer, K.; Leifeld, J.; Rethemeyer, J.; Brueggemann, N.; Kögel-Knabner, I. Bioavailability and Isotopic Composition of CO2 Released from Incubated Soil Organic Matter Fractions. Soil Biol. Biochem. 2014, 69, 168–178. [Google Scholar] [CrossRef]
  28. Willison, J.H.M.; Li, R.; Yuan, X. Conservation and Ecofriendly Utilization of Wetlands Associated with the Three Gorges Reservoir. Environ. Sci. Pollut. Res. 2013, 20, 6907–6916. [Google Scholar] [CrossRef]
  29. New, T.; Xie, Z. Impacts of Large Dams on Riparian Vegetation: Applying Global Experience to the Case of China’s Three Gorges Dam. Biodivers. Conserv. 2008, 17, 3149–3163. [Google Scholar] [CrossRef]
  30. Christensen, B.T. Decomposability of Organic Matter in Particle Size Fractions from Field Soils with Straw Incorporation. Soil Biol. Biochem. 1987, 19, 429–435. [Google Scholar] [CrossRef]
  31. Ding, F.; Sun, W.; Huang, Y. Net N2O Production from Soil Particle Size Fractions and Its Response to Changing Temperature. Sci. Total Environ. 2019, 650, 97–104. [Google Scholar] [CrossRef] [PubMed]
  32. Rodríguez Martín, J.A.; Álvaro-Fuentes, J.; Gonzalo, J.; Gil, C.; Ramos-Miras, J.J.; Grau Corbí, J.M.; Boluda, R. Assessment of the Soil Organic Carbon Stock in Spain. Geoderma 2016, 264, 117–125. [Google Scholar] [CrossRef]
  33. Zhang, Y.; Song, C.; Wang, X.; Chen, N.; Zhang, H.; Du, Y.; Zhang, Z.; Zhu, X. Warming Effects on the Flux of CH4 from Peatland Mesocosms Are Regulated by Plant Species Composition: Richness and Functional Types. Sci. Total Environ. 2022, 806, 150831. [Google Scholar] [CrossRef]
  34. Su, X.; Nilsson, C.; Pilotto, F.; Liu, S.; Shi, S.; Zeng, B. Soil Erosion and Deposition in the New Shorelines of the Three Gorges Reservoir. Sci. Total Environ. 2017, 599–600, 1485–1492. [Google Scholar] [CrossRef] [PubMed]
  35. Nsabimana, G.; Hong, L.; Yuhai, B.; De Dieu Nambajimana, J.; Jinlin, L.; Ntacyabukura, T.; Xiubin, H. Soil Aggregate Disintegration Effects on Soil Erodibility in the Water Level Fluctuation Zone of the Three Gorges Reservoir, China. Environ. Res. 2023, 217, 114928. [Google Scholar] [CrossRef]
  36. Iqbal, J.; Hu, R.; Feng, M.; Lin, S.; Malghani, S.; Ali, I.M. Microbial Biomass, and Dissolved Organic Carbon and Nitrogen Strongly Affect Soil Respiration in Different Land Uses: A Case Study at Three Gorges Reservoir Area, South China. Agric. Ecosyst. Environ. 2010, 137, 294–307. [Google Scholar] [CrossRef]
  37. Wang, X.; Li, Y.; Duan, Y.; Wang, L.; Niu, Y.; Li, X.; Yan, M. Spatial Variability of Soil Organic Carbon and Total Nitrogen in Desert Steppes of China’s Hexi Corridor. Front. Environ. Sci. 2021, 9, 761313. [Google Scholar] [CrossRef]
  38. Song, R.; Han, X.; Yang, Q.; Zheng, Z.; Xi, D. Effects of Understory Vegetation Heterogeneity on Soil Organic Carbon Components in Cunninghamia Lanceolata Plantation. Land 2022, 11, 2300. [Google Scholar] [CrossRef]
  39. Yao, Y.; Dai, Q.; Gao, R.; Yi, X.; Wang, Y.; Hu, Z. Characteristics and Factors Influencing Soil Organic Carbon Composition by Vegetation Type in Spoil Heaps. Front. Plant Sci. 2023, 14, 1240217. [Google Scholar] [CrossRef]
  40. Bao, Y.; Tang, Q.; He, X.; Hu, Y.; Zhang, X. Soil Erosion in the Riparian Zone of the Three Gorges Reservoir, China. Hydrol. Res. 2015, 46, 212–221. [Google Scholar] [CrossRef]
  41. Zhang, S.; Tang, Q.; Bao, Y.; He, X.; Tian, F.; Lü, F.; Wang, M.; Anjum, R. Effects of Seasonal Water-Level Fluctuation on Soil Pore Structure in the Three Gorges Reservoir, China. J. Mt. Sci. 2018, 15, 2192–2206. [Google Scholar] [CrossRef]
  42. Nsabimana, G.; Bao, Y.; He, X.; Nambajimana, J.D.D.; Wang, M.; Yang, L.; Li, J.; Zhang, S.; Khurram, D. Impacts of Water Level Fluctuations on Soil Aggregate Stability in the Three Gorges Reservoir, China. Sustainability 2020, 12, 9107. [Google Scholar] [CrossRef]
  43. Chen, S.; Zhang, G.; Luo, Y.; Zhou, H.; Wang, K.; Wang, C. Soil Erodibility Indicators as Affected by Water Level Fluctuations in the Three Gorges Reservoir Area, China. CATENA 2021, 207, 105692. [Google Scholar] [CrossRef]
  44. Canarini, A.; Dijkstra, F.A. Dry-Rewetting Cycles Regulate Wheat Carbon Rhizodeposition, Stabilization and Nitrogen Cycling. Soil Biol. Biochem. 2015, 81, 195–203. [Google Scholar] [CrossRef]
  45. Bagheri Novair, S.; Mirseyed Hosseini, H.; Etesami, H.; Razavipour, T. Rice Straw and Composted Azolla Alter Carbon and Nitrogen Mineralization and Microbial Activity of a Paddy Soil under Drying–Rewetting Cycles. Appl. Soil Ecol. 2020, 154, 103638. [Google Scholar] [CrossRef]
  46. Nagano, H.; Atarashi-Andoh, M.; Koarashi, J. Effect of Dry-Wet Cycles on Carbon Dioxide Release from Two Different Volcanic Ash Soils in a Japanese Temperate Forest. Soil Sci. Plant Nutr. 2019, 65, 525–533. [Google Scholar] [CrossRef]
  47. Evans, S.; Dieckmann, U.; Franklin, O.; Kaiser, C. Synergistic Effects of Diffusion and Microbial Physiology Reproduce the Birch Effect in a Micro-Scale Model. Soil Biol. Biochem. 2016, 93, 28–37. [Google Scholar] [CrossRef]
  48. Ding, F.; Huang, Y.; Sun, W.; Jiang, G.; Chen, Y. Decomposition of Organic Carbon in Fine Soil Particles Is Likely More Sensitive to Warming than in Coarse Particles: An Incubation Study with Temperate Grassland and Forest Soils in Northern China. PLoS ONE 2014, 9, e95348. [Google Scholar] [CrossRef]
  49. Franzluebbers, A. Potential C and N Mineralization and Microbial Biomass from Intact and Increasingly Disturbed Soils of Varying Texture. Soil Biol. Biochem. 1999, 31, 1083–1090. [Google Scholar] [CrossRef]
  50. Ludwig, B.; John, B.; Ellerbrock, R.; Kaiser, M.; Flessa, H. Stabilization of Carbon from Maize in a Sandy Soil in a Long-term Experiment. Eur. J. Soil Sci. 2003, 54, 117–126. [Google Scholar] [CrossRef]
  51. Sessitsch, A.; Weilharter, A.; Gerzabek, M.H.; Kirchmann, H.; Kandeler, E. Microbial Population Structures in Soil Particle Size Fractions of a Long-Term Fertilizer Field Experiment. Appl. Environ. Microbiol. 2001, 67, 4215–4224. [Google Scholar] [CrossRef]
  52. Lagomarsino, A.; Grego, S.; Kandeler, E. Soil Organic Carbon Distribution Drives Microbial Activity and Functional Diversity in Particle and Aggregate-Size Fractions. Pedobiologia 2012, 55, 101–110. [Google Scholar] [CrossRef]
  53. Liu, Y.; Ma, M.; Ran, Y.; Yi, X.; Wu, S.; Huang, P. Disentangling the Effects of Edaphic and Vegetational Properties on Soil Aggregate Stability in Riparian Zones along a Gradient of Flooding Stress. Geoderma 2021, 385, 114883. [Google Scholar] [CrossRef]
  54. Xiao, Y.; Xiao, Q.; Xiong, Q.; Yang, Z. Effects of Ecological Restoration Measures on Soil Erosion Risk in the Three Gorges Reservoir Area Since the 1980s. GeoHealth 2020, 4, e2020GH000274. [Google Scholar] [CrossRef] [PubMed]
  55. Liu, L.; Huang, X.; Zhang, J.; Cai, Z.; Jiang, K.; Chang, Y. Deciphering the Relative Importance of Soil and Plant Traits on the Development of Rhizosphere Microbial Communities. Soil Biol. Biochem. 2020, 148, 107909. [Google Scholar] [CrossRef]
  56. Ye, F.; Ma, M.H.; Wu, S.J.; Jiang, Y.; Zhu, G.B.; Zhang, H.; Wang, Y. Soil Properties and Distribution in the Riparian Zone: The Effects of Fluctuations in Water and Anthropogenic Disturbances. Eur. J. Soil Sci. 2019, 70, 664–673. [Google Scholar] [CrossRef]
Disclaimer/Publisher’s Note: The statements, opinions and data contained in all publications are solely those of the individual author(s) and contributor(s) and not of MDPI and/or the editor(s). MDPI and/or the editor(s) disclaim responsibility for any injury to people or property resulting from any ideas, methods, instructions or products referred to in the content.

Article Metrics

Citations

Article Access Statistics

Multiple requests from the same IP address are counted as one view.