Abstract
Genotype-by-environment (GEI) analysis guides the recommendation of best-performing crop genotypes and production environments. The objective of this study was to determine the extent of GEI on seed yield in tepary bean for genotype recommendation and cultivation in drought-prone environments. Forty-five genetically diverse tepary bean genotypes were evaluated under non-stressed and drought-stressed conditions for two seasons using a 9 × 5 alpha lattice design with three replications in four testing environments. Data were collected on seed yield (SY) and days to physiological maturity (DTM) and computed using a combined analysis of variance, the additive main effect and multiplicative interaction (AMMI), the best linear unbiased predictors (BLUPs), the yield stability index (YSI), the weighted average of absolute scores (WAASB) index, the multi-trait stability index (MTSI), and a superiority measure. AMMI analysis revealed a significant (p < 0.001) GEI, accounting for 13.82% of the total variation. Genotype performance was variable across the test environments, allowing the selection of best-suited candidates for the target production environment. The environment accounted for a substantial yield variation of 52.62%. The first and second interaction principal component axes accounted for 94.8 and 4.7% of the total variation in the AMMI-2 model, respectively, of surmountable variation due to GEI. The AMMI 2 model family was sufficient to guide the selection of high-yielding and stable genotypes. Based on best linear unbiased predictors (BLUPs), yield stability index (YSI), superiority measure (Pi), and broad adaptation, the following tepary bean genotypes were identified as high-yielding and suited for drought-prone environments: G40138, G40148, G40140, G40135, and G40158. The selected tepary bean genotypes are recommended for cultivation and breeding in Malawi or other related agroecologies.
1. Introduction
Recurrent drought remains an impediment to the attainment of the Sustainable Development Goals (SDGs) of the United Nations, notably SDG 2, which calls for zero hunger, achieving food security and improved nutrition, and SDG 13, which advocates for strengthening resilience and adaptability to climate-related hazards [1]. Drought affects sustainable agricultural production and productivity, impacting food systems. The impact of drought in southern Africa is exacerbated by erratic rainfall, the cultivation of drought-sensitive cultivars, a lack of crop genetic diversity to extreme climatic events, and the poor resilience of smallholder farmers to drought shocks [2]. There is an increased interest in drought tolerance breeding through the phenotyping and selection of obsolete, cultivated, and wild genetic resources whose genetic variability for fitness to arid production environments is substantial [3]. This could potentially ensure the breeding of crop ideotypes for sustainable food production for humankind.
Tepary bean (Phaseolus acutifolius A. Gray, 2n = 2x = 22) is an economically important legume crop that originated in the Sonoran Desert in Arizona and Mexico. Tepary bean has relatively high drought and heat tolerance [3] emanating from its underlining physiological and morphological mechanisms, including stomatal adjustments, small leaf structure, and deep root systems, which allow for efficient water use and crop adaptation [4,5]. The grains of tepary bean are rich in proteins, sucrose, lipids, and mineral elements such as N, P, K, Mg, Ca, Cu, Fe, Mn, S, and Zn [6,7,8]. Between 34 and 40 Kilodaltons of lectin protein present in tepary bean have been associated with beneficial health effects such as anticancer and antidiabetic properties [9]. Further, the crop is resistant to various insect pests (e.g., bean weevil, leafhopper, thrips) and diseases (i.e., common bacterial blight, anthracnose, fusarium wilt, angular leaf spot, ashy stem blight) [10,11,12,13,14,15].
Tepary bean shows wide genetic and morphological variation [16,17,18], with yield gains that can be above 2000 kg per hectare [19]. For example, Mhlaba et al. [20] and Blair et al. [21] revealed high genetic diversity in tepary bean using simple sequence repeats (SSR) markers. The genetic variability offers opportunities for cultivar development with the farmer and market-preferred desired traits. Morphological characterization revealed variation for economic traits, including seed yield [16,18,19,22], hundred seed weight [18,22], number of pods per plant [16,18], harvest index [16,23], pod harvest index, and pod partitioning index [24]. These phenotypic traits are paramount in selecting suitable and stable genotypes for population development and effective breeding [25]. The phenotypic variation in seed yield performance is primarily due to differences in genetic backgrounds, environmental conditions, agronomic management, abiotic and biotic stresses, and/or their interactions.
Understanding the nature and magnitude of genotype-by-environment (GEI) interaction effects on the seed yield of tepary bean genotypes is important for selection programs and variety release [26]. GEI effects have caused variable performance in seed yield traits among cowpea (Vigna unguiculata (L.) Walp), common bean (Phaseolus vulgaris L.), and soybean (Glycine max L.) genotypes across the production environments [27,28,29,30]. GEI has a confounding effect on genotype performance and selection response [31]. Various statistical methodologies are used to understand the pattern and magnitude of GEI, including the additive main effect and multiplicative interaction (AMMI), genotype plus genotype by environment (GGE) interaction biplot analyses [32,33,34]. The AMMI model estimates genotype (G), environment (E), and GEI components through a combination of analysis of variance as an additive model while partitioning significant interactions into principal components [35,36]. Several of these statistical methodologies have been extensively utilized to account for GEI effects on legume crops such as cowpea, common bean, and soybean [27,28,30]. Other methodologies have been routinely used to assess the yield stability of genotypes in multiple environment trials (METs), including best linear unbiased predictors (BLUPs), best linear unbiased estimators (BLUEs), parametric stability statistics (e.g., superiority index, Shukla’s stability variance, and Wricke’s Ecovalence), BLUPs (e.g., weighted average of absolute scores index), and AMMI-based stability indexes (e.g., AMMI stability value, sums of the absolute value of the IPCA scores) [37,38,39,40,41]. BLUPs, AMMI-based stability parameters, and other parametric stability statistics have reportedly been used to select stable and high-yielding genotypes in chickpea (Cicer arietinum) [37], groundnut (Arachis hypogaea) [38], and common bean (Phaseolus vulgaris L.) [39].
In the southern African region, specifically in Botswana, South Africa, Zimbabwe, and Malawi, the tepary bean is gaining popularity as an alternative source of food and protein. Hence, the crop has the potential to support livelihoods and nutritional security [25,42]. In the region, the crop is grown by smallholder farmers using genetically unimproved landraces such as Uchokwane and Motsumi. The productivity of landraces is less than 500 kg per hectare [43,44].
In an effort to improve the productivity of tepary bean in the southern African region, a diverse panel of tepary bean germplasm was introduced into South Africa from the International Center for Tropical Agriculture (CIAT-Columbia) [25]. Initially, the genotypes were evaluated for their phenotypic performance in the glasshouse and field environments [16]. Promising genotypes with high seed yield and harvest index were identified and recommended [16]. However, the assembled germplasm’s performance was not investigated under drought stress, and the concomitant influence of GEI on seed yield is yet to be deciphered to guide breeding. The objective of this study was to determine the extent of GEI on seed yield in tepary bean for genotype recommendation and cultivation in drought-prone production environments.
2. Materials and Methods
2.1. Study Sites
The study was conducted under field conditions at two sites in Malawi (Figure 1). The Malawi sites were the Lilongwe University of Agriculture and Natural Resources (LUANAR) Horticulture Research Farm, Bunda, and Kasinthula Research Station, Chikwawa. Table 1 presents the descriptions of the study sites, growing seasons, and prevailing weather conditions during the study, while Table 2 presents the soil characteristics of the two study sites in Malawi.
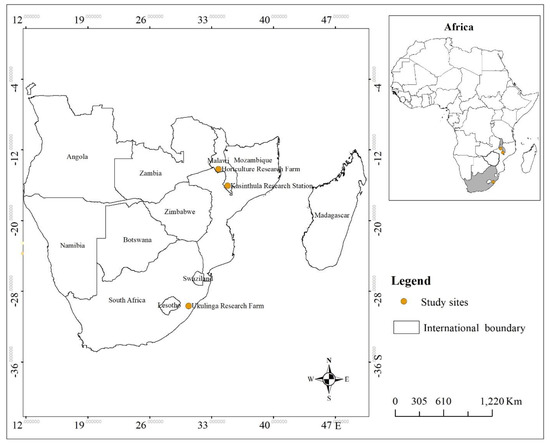
Figure 1.
Map of the study sites in Malawi and germplasm source in South Africa.

Table 1.
Description of the study sites.
Table 2.
Soil physical characteristics of the study sites.
2.2. Plant Materials
For this study, 45 genetically diverse tepary bean accessions [16] were sourced from the African Center for Crop Improvement (ACCI) in South Africa and smallholder farmers in South Africa and Zimbabwe. Tepary bean genetic resources with promising seed yield potential and marketable seed coat colors were selected. The details of the genotypes, including their seed coat colors, are presented in Table 3.
Table 3.
Genotype codes, names, and seed coat colours of tepary bean accessions used in the study.
2.3. Trial Design and Management
Field trials were conducted for two seasons in Malawi: from August to November 2020–2021 and from July to October 2021–2022. The 45 tepary bean genotypes were established in a 9 × 5 alpha lattice design with two replications and two water regimes (non-stressed, NS, and terminal drought stress, DS) per location. The genotypes were each grown in two rows per plot, consisting of 3 m row length, with 0.75 m inter-row spacing and 0.15 m intra-row spacing. The two water regimes were applied through furrow irrigation with approximately 35 mm of water per irrigation (~80% field capacity, FC) [24,45,46]. The non-stressed treatment was irrigated when soil moisture content dropped to 30% FC from 80% FC determined through an ML3 Theta probe soil moisture sensor (Delta-T devices, Cambridge, UK) up to physiological maturity. The drought stress was initiated in the DS treatment from the mid-pod filling stage by withholding irrigation till physiological maturity [47].
The combinations of the two sites and two water treatments (NS and DS) resulted in four testing environments (designated as E), namely E1 (LUANAR, non-stressed); E2 (LUANAR, drought-stressed); E3 (Kasinthula, non-stressed); and E4 (Kasinthula, drought-stressed). To control weeds, insect pests, and diseases, an amalgamation of cultural practices and chemical applications was used in accordance with legume crop recommendations.
2.4. Data Collection
Days to physiological maturity (DTM) was measured as days from planting to when 90% of the pods changed from green to yellow or beige color in the plot. Data on seed yield were collected at harvest from two central rows of each plot, consisting of 10 plants. Seed yield per plot in grams (g) was converted to kg/ha after adjusting for 14% moisture content (MC) as follows according to Parker and Namuth-Covert [48]:
SY = 10,000 m2/plot area (m2) × plot yield (g)/1000 g × 100% − MC/100% − MC
2.5. Data Analysis
2.5.1. Analysis of Variance
The eight environment–season combinations were considered random. The individual location and combined analysis of variance for seed yield and days to maturity were performed in Genstat 18th Edition [49]. The homogeneity of error variances was assessed using Bartlet’s test [50] before a combined analysis of variance.
2.5.2. AMMI Analysis
The additive main effects and multiplicative interaction (AMMI) analysis was performed to account for G, E, and GEI effects on seed yield trait using Genstat 18th Edition [50] using the following linear model according to Zobel et al. [51]:
where Yij is the yield of the ith genotype in the jth environment; µ is the grand mean; gi and ej are the genotype and environment deviations from the grand mean, respectively; τn is the eigenvalue of the PC analysis axis n; γin and δjn are the genotype and environment principal component scores for axis n; and N is the number of principal components retained in the model; and εij is the error term.
The AMMI model diagnosis was performed as follows: GEI noise (GEIN) was calculated as a product of residual mean square and the degrees of freedom for GEI. The GEI signal (GEIs) was calculated as the difference of the sum of squares for GEI with GEIN [29].
2.5.3. AMMI Stability Value
The AMMI stability value (ASV) was computed according to Purchase [52] using the following formula:
where SSIPCA1/SSIPCA2 represents the proportion of the sum of squares for the first and second interaction principal component axes, while IPCA1 and IPCA2 denote the genotypic scores of these respective components in the AMMI model. Genotypes with lower ASV are regarded as the most stable [52].
2.5.4. Yield Stability Index
The Yield Stability Index (YSIi) for each tested tepary bean genotype was computed as the summation of the rankings based on AMMI Stability Value (RASVi) and mean yield (RYi) of the ith genotype across environments. Genotypes with the smallest YSI are stable and high-yielding [36]. The formula for computing YSIi according to Kang [53] is shown below:
YSIi = RASVi + RYi
2.5.5. Cultivar Superiority Measure
Superiority measure, an AMMI stability parameter, was computed according to Lin and Binns [54] using the following formula: , where n is the number of environments, Yij is the yield of the ith genotype in the jth environment, and Mj is the maximum yield in the j-th environment.
2.5.6. BLUPs and BLUEs Estimation
The BLUPs estimates for seed yield were performed in Multi-Environment Trial Analysis with R (META-R) Version 6.0 [55] based on the lattice procedure using the following linear model:
where Yijkl is the trait of interest in our study seed yield; µ is the grand mean; Geni is the genotype effect; Envj is the environment effect; Repj (Envi) is replications within environment effect; Blockj (Repi) is the effect of the incomplete block within replications; Geni × Envj is the genotype by environment interaction effect; and εijk is the error or residual.
Yijkl = µ + Geni + Envj + Repk (Envj) + Blockl (Envj Repk) + Geni × Envj + εijkl
2.5.7. BLUP-Based Stability Parameter and Multi-Trait Stability Index
The metan R package was used to perform a weighted average of the absolute scores (WAASB) from the matrix’s singular value decomposition and multi-trait stability indexes analysis [56].
2.5.8. Broad-Sense Heritability
Broad-sense heritability for seed yield for individual and across environments was computed according to [55] using the following formula:
where = genetic variance, = error variance, and nreps = number of replications.
where = genetic variance, genotype by environment interaction variance, nEnvs = number of environments, = error variance, and nreps = number of replications.
3. Results
3.1. The Combined Analysis of Variance
The combined analysis of variance for seed yield and days to physiological maturity showed that genotype, season, environment, and their interactions were highly significant (p ≤ 0.001) (Table S1). The contributions of the environment, season, genotype, and genotype by season by the environment to the total sum of squares for seed yield were 31.28%, 11.43%, 20.14%, and 7.80%, respectively.
3.2. AMMI Analysis for Seed Yield
The AMMI analysis of variance revealed that seed yield response was significantly influenced by genotype, environment, and GEI effects (p ≤ 0.001) (Table 4). The environment had a higher (52.62%) contribution toward the sum of squares for seed yield, followed by G (33.56%) and GEI (13.82%). The first interaction principal component axis (IPCA1) significantly accounted for 94.80% of the total variation in seed yield among tepary bean genotypes.
Table 4.
AMMI analysis of variance with explained variation in seed yield of tepary bean accessions evaluated in four environments.
AMMI 2 Biplot
The AMMI2 biplot showing genotypes and test environments as defined by their IPCA 1 and IPCA 2 scores on the abscissa and ordinate, respectively, is presented in Figure 2. The AMMI model sufficiently accounted for 99.50% of the total GEI variation in SY, with IPCA1 and IPCA2 explaining 94.80% and 4.70% of the variation, respectively. The longer vectors of the four environments—E1, E2, E3, and E4—indicated a high GEI. Genotypes G37, G31, G24, G26, G13, G32, G44, and G25 were close to the origin, implying that they were less responsive to environmental variance. Conversely, genotypes G30, G41, G35, G39, G8, G7, G36, and G19 exhibited higher interaction with the environment.
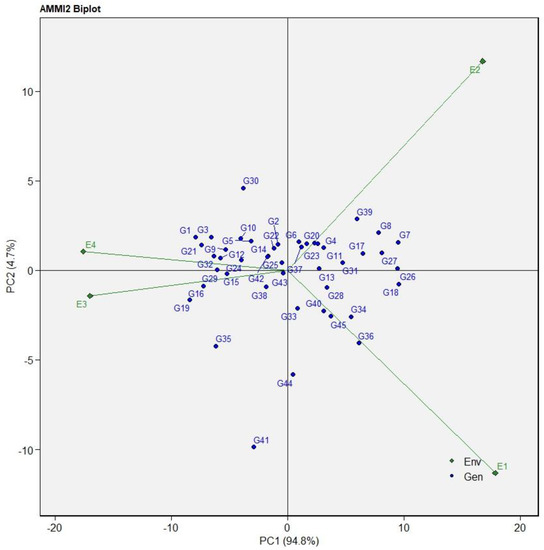
Figure 2.
AMMI model biplot for IPCA1, IPCA2 scores, and seed yield in kilograms per hectare for 45 tepary bean accessions evaluated in four testing environments. E1 = LUANAR, non-stressed; E2 = LUANAR, drought-stressed; E3 = Kasinthula, non-stressed; E4 = Kasinthula, drought-stressed. Genotype codes are provided in Table 3.
3.3. Estimation of BLUPs and BLUEs for Seed Yield among Tepary Bean Genotypes
The BLUPs and BLUEs estimates for seed yield of tepary bean genotypes in a specific environment and across the four test environments are presented in Table 5 and Table 6. The BLUPs and BLUEs for E1 ranged from 237.67 to 1157.92 kg and were high for G28 (1030.46 and 1157.92 kg), followed by G31 (933.38 and 1022.50 kg), whereas G1 had the lowest BLUPs and BLUEs of 370.76 and 237.67 kg, respectively. In E2, the maximum BLUPs value was 937.19 kg for G28, and the minimum was 349.06 kg for G1. Similarly, BLUEs were highest in G28 and lowest in G1 in E2, with 1066.44 and 221.00 kg, respectively. In E3, genotypes G9, G12, G15, G16, G19, G20, G24, G28, G29, G31, G32, G33, G35, G37, G38, G40, and G41 had BLUPs and BLUEs above a grand mean of 345.06 kg per hectare, whereas genotypes G1, G10, G11, and the rest had BLUPs and BLUEs below the grand mean. In E4, genotypes G9, G12, G15, G16, G19, G28, G29, G31, G33, G35, G37, G40, and G41 recorded BLUPs and BLUEs of ≥298.77 kg per hectare, while the least BLUPs and BLUEs were observed in G4 (172.56 and 129.67 kg per hectare, in that order). The overall mean value across drought stress and non-stress environments varied from 298.77 to 707.74 kg per hectare.
Table 5.
Best linear and unbiased predictions (BLUPs) and best linear and unbiased estimates (BLUEs) for the seed yield in kg/ha of 45 tepary bean accessions evaluated in four environments in Malawi.
Table 6.
Best linear and unbiased predictions (BLUPs) and best linear and unbiased estimates (BLUEs) in kg/ha of 45 tepary bean accessions evaluated across four environments in Malawi.
Across environments, BLUPs and BLUEs of >600 kg per hectare and greater than the grand mean (Table 6; Figure 3) were recorded for G19, G28, G29, G31, G33, G37, and G40. Broad-sense heritability for SY was 0.54 under non-stress environments and 0.48 under drought-stress environments (Table 5 and Table 6). A high broad-sense heritability of 0.79 for seed yield was computed across the six environments. In addition, the environment contributed markedly to total phenotypic variation in seed yield, followed by G and GEI (Table 5). Overall, genotypes differed in their seed yield performance across environments, evident from the different winner genotypes in each environment (G28 in E1 and E2; G29 in E3 and E4).
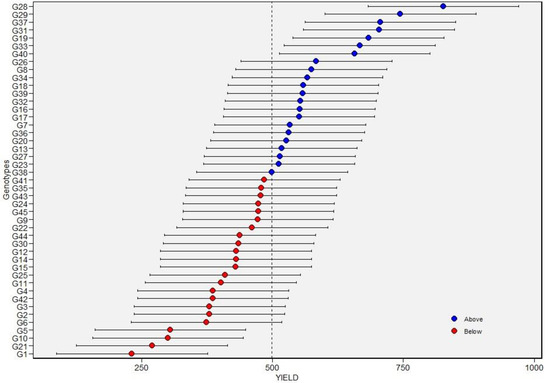
Figure 3.
Best linear unbiased predictions (BLUPs) values of 45 tepary bean accessions for seed yield. Blue and red circles indicate the genotypes that had BLUPs above and below of BLUPs grand mean, respectively. Horizontal error bars indicate the 95% confidence interval of the prediction line with a two-tailed t-test. See Table 1 for genotype codes.
3.4. Mean Performance of Tepary Bean Genotypes in Days to 90% Maturity
The average performance of tepary bean genotypes for DTM in E1 and E2 was 84 and 79 days in seasons 1 and 2, while in E3 and E4, it was 80 and 75 days in seasons 1 and 2, and 82 days and 77 days in season 2, respectively. The overall mean for DTM was 79.98 days with a coefficient of variation of 1.44% (Table S2). G37 (with 75 maturity days) and G41 (74 days) were some of the earliest maturing genotypes (Table S2).
3.5. Identification of Stable Genotypes Using ASV, YSI, and WAASB Biplot
The average genotype performance for ASV, YSI, and Pi among tepary bean genotypes evaluated for seed yield across four testing environments in Malawi is presented in Table 7. Genotypes were ranked based on their mean yield performance across the testing environments. A higher ASV indicates that a genotype is more suited to a particular environment with a high inherent yield, while a lower ASV entails stable genotypic performance across the testing sites with low yield potential [52]. On the contrary, genotypes with the least YSI value are regarded as the most stable and high yielding [36]. Genotypes G18, G7, G26, G19, G27, G1, G8, G21 and others recorded the highest ASV values of greater than 10.00, while genotypes G43, G25, G44, G33, G2, G6, G37 and others recorded the lowest ASV of <3.00, in that order. Based on YSI values, G33, G37, G28, G40, G43, and G31 were ranked as stable and high-yielding genotypes. Based on the superiority measure (Pi), genotypes G28, G37, G29, G31, G33 and G40 had a desirable performance, with values of 1120.56, 15,139.08, 16,661.46, 17,210.02, 23,934.88, and 26,849.72, respectively (Table 8).
Table 7.
Tepary bean accessions ranked based on seed yield, AMMI stability value, and yield stability index when evaluated across four test environments in Malawi.
Table 8.
Cultivar superiority measure of assessed tepary bean genotypes.
The WAASB biplot with four quadrants classifying genotypes and environments aided in the concurrent identification of productive environments and stable genotypes [55]. The first quadrant contained very unstable genotypes and highly discriminative environments. E3 and E4 were highly discriminative, while genotypes G1, G3, G21, G12, and G35 were highly unstable, with a mean performance below the grand mean (Figure 4). Genotypes and environments with mean performance above the grand mean included G18, G26, G19, G16, G8, G7, G17, and G32 in E1 and E2, respectively, positioned in the second quadrant. The third quadrant contains stable and widely adapted genotypes, though they had low yields and mean performances below the grand mean. The third quadrant included G10, G5, G30, G2, G6, G44, G14, G42, G11, and G25. The genotypes in the fourth quadrant are widely adapted and high yielding, with mean performance that exceeds the grand mean and a lower WAASB score. The genotypes in the fourth quadrant included G37 (0.73), G28 (1.89), G33 (0.57), G31 (2.42), G40 (1.65), G23 (0.83), G13 (1.29), and G20 (1.17). The genotypes with the lowest WAASB score, which were therefore highly stable include, G43 (0.22), G25 (0.32), G44 (0.38), G6 (0.52), G2 (0.53), and G33 (0.57).
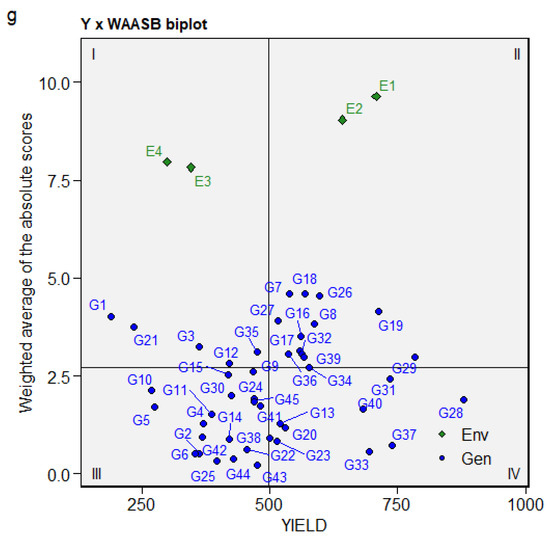
Figure 4.
Biplot of the seed yield (kg/ha) and weighted average of the absolute scores.
3.6. MTSI Analysis
Simultaneous selection of high-yielding and early maturing genotypes was explored through a multi-trait stability analysis. MTSI index with a 15% selection intensity enabled the selection of the following genotypes: G33 (0.32), G14 (0.34), G43 (0.43), G23 (0.79), G25 (0.83), G22 (0.93), and G42 (0.99) (Figure 5). However, among those selected, only G33 and G23 were high-yielding, with a mean yield and mean maturity performance above the grand mean. The selection differentials for seed yield and days to maturity expressed as a mean were −23.8 and −0.33, respectively (Table S3). The selection differential percentages were negative for both seed yield (4.78%) and days to maturity (0.41%) traits.
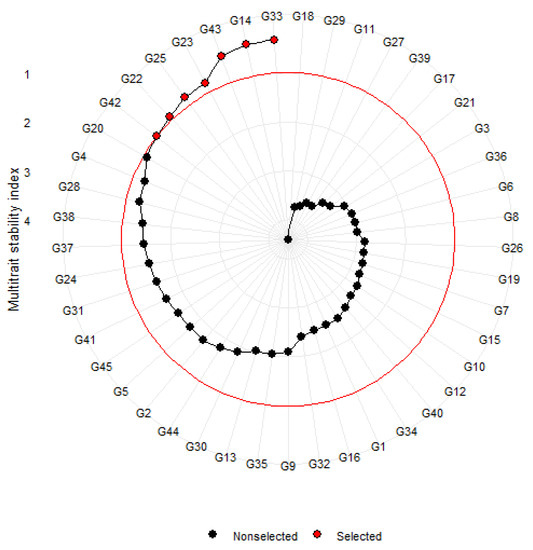
Figure 5.
MTSI analysis of tepary bean genotypes for seed yield and days to maturity.
4. Discussion
Genotype-by-environment (GEI) interaction analysis is vital in crop breeding programs to recommend candidate genotypes for large-scale production in the targeted production environments. Tepary bean is becoming an increasingly popular legume crop in Africa, but its production is currently hampered by a lack of improved varieties and limited access to seed and extension services [43,44]. The present study determined the extent of GEI on seed yield in tepary bean genotypes to aid in recommendation and cultivation of well-suited genotypes, especially in drought-prone production environments.
The assessed tepary bean genotypes showed marked heterogeneity in seed yield performance across the tested environments in this study (Table 4). The performance of the assessed tepary bean genotypes in seed yield and days to physiological maturity traits was influenced by seasonal fluctuations, locational heterogeneity, and interaction effects. (Table S1). The AMMI analysis revealed that GEI for seed yield among tepary bean genotypes was significant, with a 13.82% contribution to the total phenotypic variation. The genotypes exhibited a cross-over type of GEI as shown by the differential performance of genotypes in different environments (Table 5), warranting the need for stability analysis [34]. Consequently, this confounds the selection of superior tepary bean genotypes for cultivation and cultivar development [27]. The significant GEI effect detected in the current study corroborates with the findings of Mhlaba et al. [16]. In addition, the cross-over type of GEI corresponds to the results by Mushoriwa et al. [30] and Tukamuhabwa et al. [57] in soybeans. Differences in agroecologies, especially climatic conditions and soil and biophysical properties, could have contributed to this cross-over type of GEI [29].
The higher contribution to the sum of squares (SS) by E than G and GEI, as reflected in the AMMI analysis (Table 4), suggests that the environment significantly modulated the performance of tepary bean genotypes. This is expected for a trait which is controlled by many genes. The agrometeorological differences across seasons and edaphic factors at the two sites contributed to the predominance of environmental influence (Table 1 and Table 2). For instance, Kasinthula experienced relatively higher temperatures than Bunda, which could have caused the abortion of flowers and reduced the viability of pollen, impacting seed set and grain development [58]. Consequently, this lowers seed numbers and overall yield (Table 5). Our results of higher environmental contributions to total variation are comparable with the findings of Temesgen et al. [59] in another legume, faba beans.
The lower contribution of G than E and GEI toward total SS for seed yield in the present study indicates that the performance of the genotypes was masked by the environment [60]. Consequently, this lowers the selection efficiency of genotypes across several environments [61,62]. To ensure genotypes correspond with their phenotypes, including marker-assisted selection in the current germplasm collection would enhance the selection of superior genotypes [5,58]. The limited contribution of G effect can also be attributed to the low genetic variation in cultivated tepary bean [20,21,63] due to single geographic location domestication bottleneck effects. Hence, this study used statistical models with reliable and sufficient prediction capacity, such as BLUPs [56] (Table 5 and Table 6; Figure 3), to enhance the selection and recommendation of appropriate genotypes for cultivation. The BLUPs analysis in the current study sufficiently corrected the environmental effect and enhanced the genotypic effect for seed yield across environments (Table 6). For instance, the broad sense heritability across the six environments was 0.79, implying a higher genetic contribution and lowering the impact of environmental variance on total phenotypic variance (Table 6).
BLUPs and AMMI-based stability parameters have been extensively used in legume crops such as chickpea, groundnut, and common bean [37,38,39] to select stable and high-yielding genotypes across environments. As shown in Table 7 and Figure 4, the most stable genotypes, such as G25, G43, and G44, with low ASV and WAASB scores, were mostly not high-yielding, undermining the common use of the stability parameter as a breeding goal in a breeding program. A stability index such as the YSI that combines yield performance and stability is ideal for guiding the selection and recommendation of genotypes for cultivation. Based on YSI, the following genotypes were identified and recommended for cultivation in drought-prone and irrigated environments in Malawi or other similar agroecologies in southern Africa: G28, G29, G37, G31, G19, G33, G40, and G26. However, the use of BLUP and/or AMMI-based stability measures is dependent on the magnitude and pattern of GEI, which is explained by the first two principal component axes [64,65,66]. In the current study, the two IPCAs explained 99.5% of GEI variation, thus justifying the use of AMMI-based stability parameters. Further, the use of multiple traits to guide varietal recommendation based on mean performance and stability was explored through MTSI analysis in the current study [56]. The seed yield is negatively correlated with a shorter growth cycle (earliness) which could have contributed to limited effectiveness of selection intensity and MTSI. Almost 74 kg ha−1 of seed yield potential is reduced in beans due to a shorter growth cycle [67]. Despite having a high MTSI index score (Table S4) and not being favorably selected, G37 had a shorter mean number of days to maturity and a high seed yield. This could be attributable to its outstanding photosynthetic remobilization ability [68].
Genotypes G40138, G40148, G40140, G40135, and G40158 were recommended for cultivation in drought-prone environments due to their higher seed yield BLUPs, lower YSI and Pi values, and broad adaptation. Interestingly, the high-performing genotypes, such as G40138 and G40148, were of Mexican Sonoran Desert origin, with some having disease resistance attributes to Fusarium oxysporum and rusts, respectively.
5. Conclusions
The present study found that genotypes, environments, and genotype-by-environment interaction significantly affected seed yield response in tepary bean accessions. The following accessions G40138, G40148, G40140, G40135, and G40158, with relatively better seed yields (>600 kg/ha), were identified and recommended. The selected accessions are ideal candidates for breeding or cultivation in water-limited environments targeting yield gains.
Supplementary Materials
The following supporting information can be downloaded at: https://www.mdpi.com/article/10.3390/agronomy13010012/s1, Table S1: Combined analysis of variance for seed yield and days to maturity in 45 tepary bean genotypes evaluated across two seasons and four environments, Table S2: Days to maturity for 45 tepary bean genotypes evaluated across two seasons and four environments, Table S3: Selection differential for mean performance and weighted average of the stability and mean performance (WAASBY) scores for seed yield and days to maturity in 45 tepary bean genotypes evaluated across two seasons and four environments, Table S4: Multi trait stability index (MTSI) values for 45 tepary bean genotypes evaluated across two seasons and four environments.
Author Contributions
Conceptualization, S.E.M., H.S., J.M.; methodology, S.E.M.; software, S.E.M., validation, S.E.M., H.S., J.M; formal analysis, S.EM., J.M., W.N.; investigation, S.E.M.; Resources, S.E.M., H.S; writing original draft, S.E.M.; writing—review and editing, S.E.M., H.S., W.N., A.S., I.F., J.M.; supervision, H.S. All authors have read and agreed to the published version of the manuscript.
Funding
This research received no external funding.
Institutional Review Board Statement
Not applicable.
Informed Consent Statement
Not applicable.
Data Availability Statement
Not applicable.
Acknowledgments
The authors acknowledge the technical support they received from G. Dawa and the technical staff of Lilongwe University of Agriculture and Natural Resources, Maxwell Kamba, Archangel Mwase of CIAT-Malawi, and the staff of Kasinthula Agricultural Research Station are thanked for research support.
Conflicts of Interest
The authors declare no conflict of interest.
References
- Available online: https://sdgs.un.org/goals (accessed on 15 August 2022).
- Maggio, G.; Sitko, N.; Ignaciuk, A. Cropping system diversification in Eastern and Southern Africa: Identifying policy options to enhance productivity and build resilience. In FAO Agricultural Development Economics Working Paper; FAO: Rome, Italy, 2018. [Google Scholar]
- Moghaddam, S.M.; Oladzad, A.; Koh, C.; Ramsay, L.; Hart, J.; Mamidi, S.; Hoopes, G.; Sreedasyam, A.; Wiersma, A.; Zhao, D.; et al. The tepary bean genome provides insight into evolution and domestication under heat stress. Nat. Commun. 2021, 12, 2638. [Google Scholar] [CrossRef] [PubMed]
- Mohamed, F.; Mohamed, M.; Schmitz-Eiberger, N.; Keutgen, N.; Noga, G. Comparative drought postponing and tolerance potentials of two tepary bean lines in relation to seed yield. Afr. Crop. Sci. J. 2005, 13, 49–60. [Google Scholar]
- Beebe, S.E.; Rao, I.M.; Blair, M.W.; Acosta-Gallegos, J.A. Phenotyping common beans for adaptation to drought. Front. Physiol. 2013, 4, 35. [Google Scholar] [CrossRef] [PubMed]
- Amarteifio, J.O.; Moholo, D. The chemical composition of four legumes consumed in Botswana. J. Food Comp. Anal. 1998, 11, 329–332. [Google Scholar] [CrossRef]
- Bhardwaj, H.L.; Hamama, A.A. Oil and fatty acid composition of tepary bean seed. HortScience 2005, 40, 1436–1438. [Google Scholar] [CrossRef]
- Porch, T.G.; Cichy, K.; Wang, W.; Brick, M.; Beaver, J.S.; Santana-Morant, D.; Grusak, M.A. Nutritional composition and cooking characteristics of tepary bean (Phaseolus acutifolius Gray) in comparison with common bean (Phaseolus vulgaris L.). Genet. Resour. Crop Evol. 2017, 64, 935–953. [Google Scholar] [CrossRef]
- López-Ibarra, C.; Ruiz-López, F.d.J.; Bautista-Villarreal, M.; Báez-González, J.G.; Romero, B.A.R.; González-Martínez, B.E.; López-Cabanillas, L.M.; Vázquez-Rodríguez, J.A. Protein Concentrates on Tepary Bean (Phaseolus acutifolius Gray) as a Functional Ingredient: In silico Docking of Tepary Bean Lectin to Peroxisome Proliferator-Activated Receptor Gamma. Front. Nutr. 2021, 8, 661463. [Google Scholar] [CrossRef]
- Kusolwa, P.; Myers, J. Seed storage proteins ARL2 and its variants from the apalocus of wild tepary bean G40199 confers resistance to Acanthoscelides obtectus when expressed in common beans. Afr. Crop. Sci. J. 2011, 19, 255–265. [Google Scholar]
- Singh, S.P.; Muñoz, C.G. Resistance to common bacterial blight among Phaseolus species and common bean improvement. Crop Sci. 1999, 39, 80–89. [Google Scholar] [CrossRef]
- Miklas, P.N.; Kelly, J.D.; Beebe, S.E.; Blair, M.W. Common bean breeding for resistance against biotic and abiotic stresses: From classical to MAS breeding. Euphytica 2006, 147, 105–131. [Google Scholar] [CrossRef]
- Salgado, M.O.; Schwartz, H.F.; Brick, M.A.; Pastor-Corrales, M.A. Resistance to Fusarium oxysporum f.sp. phaseoli in tepary bean (Phaseolus acutifolius). Plant Dis. 1994, 78, 357–360. [Google Scholar]
- Miklas, P.N.; Schwartz, H.F.; Salgado, M.O.; Nina, R.; Beaver, J.S. Reaction of select tepary bean to ashy stem blight and fusarium wilt. HortScience 1998, 33, 136–139. [Google Scholar]
- Porch, T.G.; Beaver, J.S.; Brick, M.A. Registration of tepary germplasm with multiple-stress tolerance, TARS-Tep 22 and TARS-Tep 32. J. Plant Reg. 2013, 7, 358–364. [Google Scholar] [CrossRef]
- Mhlaba, Z.B.; Amelework, B.; Shimelis, H.A.; Modi, A.T.; Mashilo, J. Variance components and heritability of yield and yield-related traits in tepary bean (Phaseolus acutifolius). South Afr. J. Plant Soil 2018, 36, 117–128. [Google Scholar] [CrossRef]
- Muñoz, L.C.; Debouck, D.; Rivera, M.; Muñoz, J.; Alpala, D.; Sarsu, F.; Rao, I. Mutation breeding for heat and drought tolerance in tepary bean (Phaseolus acutifolius A. Gray). Aust. J. Crop Sci. 2021, 15, 60–68. [Google Scholar] [CrossRef]
- Suárez, J.C.; Contreras, A.T.; Anzola, J.A.; Vanegas, J.I.; Rao, I.M. Physiological Characteristics of Cultivated Tepary Bean (Phaseolus acutifolius A. Gray) and Its Wild Relatives Grown at High Temperature and Acid Soil Stress Conditions in the Amazon Region of Colombia. Plants 2022, 11, 116. [Google Scholar] [CrossRef]
- Pratt, R.; Grant, L.; Velasco-Cruz, C.; Lauriault, L. Field performance of selected and landrace tepary bean varieties in diverse southwestern USA irrigated production environments. Legume Sci. 2022, e157. [Google Scholar] [CrossRef]
- Mhlaba, Z.B.; Amelework, B.; Shimelis, H.A.; Modi, A.T.; Mashilo, J. Genetic interrelationship among tepary bean (Phaseolus acutifolius A. Gray) genotypes revealed through SSR markers. Aust. J. Crop Sci. 2018, 12, 1587–1595. [Google Scholar] [CrossRef]
- Blair, M.W.; Pantoja, W.; Muñoz, L.C. First use of microsatellite markers in a large collection of cultivated and wild accessions of tepary bean (Phaseolus acutifolius A. Gray). Theor. Appl. Genet. 2012, 125, 1137–1147. [Google Scholar] [CrossRef]
- Federici, C.T.; Ehdaie, B.; Waines, J.G. Domesticated and wild tepary bean: Field performance with and without drought stress. Agron. J. 1990, 82, 896–900. [Google Scholar] [CrossRef]
- Souter, J.R.; Gurusamy, V.; Porch, T.G.; Bett, K.E. Successful introgression of abiotic stress tolerance from wild tepary bean to common bean. Crop Sci. 2017, 57, 1160–1171. [Google Scholar] [CrossRef]
- Rao, I.; Beebe, S.; Polania, J.; Ricaurte, J.; Cajiao, C.; Garcia, R.; Riverra, M. Can tepary bean be a model for improvement of drought resistance in common bean? Afr. Crop Sci. J. 2013, 21, 265–281. [Google Scholar]
- Mhlaba, Z.B.; Mashilo, J.; Shimelis, H.; Assefa, A.B.; Modi, A.T. Progress in genetic analysis and breeding of tepary bean (Phaseolus acutifolius A. Gray): A review. Sci. Hortic. 2018, 237, 112–119. [Google Scholar] [CrossRef]
- Gurmu, F.; Shimelis, H.; Laing, M. Genotype-By-Environment Interaction and Stability of Sweetpotato Genotypes for Root Dry Matter, Β-carotene and Fresh Root Yield. Open Agric. 2017, 2, 473–485. [Google Scholar] [CrossRef]
- Gerrano, A.; van Rensburg, W.; Mathew, I.; Shayanowako, A.; Bairu, M.; Venter, S.; Swart, W.; Mofokeng, A.; Mellem, J.; Labuschagne, M. Genotype and genotype × environment interaction effects on the grain yield performance of cowpea genotypes in dryland farming system in South Africa. Euphytica 2020, 216, 80. [Google Scholar] [CrossRef]
- Ligarreto–Moreno, G.; Pimentel–Ladino, C. Grain yield and genotype x environment interaction in bean cultivars with different growth habits. Plant Prod. Sci. 2022, 25, 232–241. [Google Scholar] [CrossRef]
- Mwiinga, B.; Sibiya, J.; Kondwakwenda, A.; Musvosvi, C.; Chigeza, G. Genotype x environment interaction analysis of soybean (Glycine max (L.) Merrill) grain yield across production environments in Southern Africa. Field Crops Res. 2020, 256, 107922. [Google Scholar] [CrossRef]
- Mushoriwa, H.; Mathew, I.; Gwata, E.T.; Tongoona, P.; Derera, J. Grain Yield Potential and Stability of Soybean Genotypes of Different Ages across Diverse Environments in Southern Africa. Agronomy 2022, 12, 1147. [Google Scholar] [CrossRef]
- Yan, W.; Kang, M.S.; Ma, B.; Woods, S.; Cornelius, P. GGE Biplot vs. AMMI analysis of genotype by environment data. Crop Sci. 2007, 47, 643–655. [Google Scholar] [CrossRef]
- Gauch, H.G. Statistical analysis of yield trials by AMMI and GGE. Crop Sci. 2006, 46, 1488–1500. [Google Scholar] [CrossRef]
- Gauch, H.G.; Piepho, H.P.; Annicchiarico, P. Statistical analysis of yield trials by AMMI and GGE: Further considerations. Crop Sci. 2008, 48, 866–889. [Google Scholar] [CrossRef]
- Yan, W.; Tinker, N.A. Biplot analysis of multi-environment trial data: Principles and applications. Can. J. Plant Sci. 2006, 86, 623–645. [Google Scholar] [CrossRef]
- Babic, V.B.; Babic, M.M.; Ivanovic, M.R.; Filipovic, M.R. Pattern in interaction in the maize yield trial. J. Agric. Sci. 2011, 56, 101–110. [Google Scholar] [CrossRef]
- Bose, L.K.; Jambhulkar, N.N.; Singh, O.N. Additive main effects and multiplicative interaction (AMMI) analysis of grain yield stability in early duration rice. J. Anim. Plant Sci. 2014, 24, 1885–1897. [Google Scholar]
- Zali, H.; Farshadfar, E.; Sabaghpour, S.H.; Karimizadeh, R. Evaluation of genotype × environment interaction in chickpea using measures of stability from AMMI model. Ann. Biol. Res. 2012, 3, 3126–3136. [Google Scholar]
- Ajay, B.C.; Bera, S.K.; Singh, A.L.; Kumar, N.; Gangadhar, K.; Kona, P. Evaluation of Genotype × Environment Interaction and Yield Stability Analysis in Peanut Under Phosphorus Stress Condition Using Stability Parameters of AMMI Model. Agric. Res. 2020, 9, 477–486. [Google Scholar] [CrossRef]
- Burbano-Erazo, E.; León-Pacheco, R.I.; Cordero-Cordero, C.C.; López-Hernández, F.; Cortés, A.J.; Tofiño-Rivera, A.P. Multi-environment yield components in advanced common bean (Phaseolus vulgaris L.) tepary bean (P. acutifolius A. Gray) interspecific lines for heat and drought tolerance. Agronomy 2021, 11, 1978. [Google Scholar] [CrossRef]
- Pour-Aboughadareh, A.; Khalili, M.; Poczai, P.; Olivoto, T. Stability Indices to Deciphering the Genotype-by-Environment Interaction (GEI) Effect: An Applicable Review for Use in Plant Breeding Programs. Plants 2022, 11, 414. [Google Scholar] [CrossRef]
- Gerrano, A.S.; Thungo, Z.G.; Shimelis, H.; Mashilo, J.; Mathew, I. Genotype-by-Environment Interaction for the Contents of Micro-Nutrients and Protein in the Green Pods of Cowpea (Vigna unguiculata L. Walp.). Agriculture 2022, 12, 531. [Google Scholar] [CrossRef]
- Molosiwa, O.O.; Baleseng, L.; Chirwa, L. Effect of Plant Spacing on Agronomic Performance and Fodder Quality of Four Tepary Bean (Phaseolus acutifolius A. Gray) Cultivars. Hindawi Int. J. Agron. 2022, 2022, 6590608. [Google Scholar] [CrossRef]
- Molosiwa, O.O.; Kgokong, S.B.; Makwala, B.; Gwafila, C.M.; Ramokapane, M.G. Genetic diversity in tepary bean (Phaseolus acutifolius) landraces grown in Botswana. J. Plant Breed. Crop Sci. 2014, 6, 194–199. [Google Scholar] [CrossRef]
- Konvalina, P. Alternative Crops and Cropping Systems; IntechOpen: London, UK, 2016. [Google Scholar] [CrossRef]
- Polania, J.; Rao, I.M.; Cajiao, C.; Grajales, M.; Rivera, M.; Velasquez, F.; Raatz, B.; Beebe, S.E. Shoot and root traits contribute to drought resistance in recombinant inbred lines of MD 23–24 × SEA 5 of common bean. Front. Plant Sci. 2017, 8, 296. [Google Scholar] [CrossRef] [PubMed]
- Smith, M.R.; Veneklaas, E.; Polania, J.; Rao, I.M.; Beebe, S.E.; Merchant, A. Field drought conditions impact yield but not nutritional quality of the seed in common bean (Phaseolus vulgaris L.). PLoS ONE. 2019, 14, e0217099. [Google Scholar] [CrossRef] [PubMed]
- Ambachew, D.; Mekbib, F.; Asfaw, A.; Beebe, S.E.; Blair, M.W. Trait associations in common bean genotypes grown under drought stress and field infestation by BSM bean fly. Crop J. 2015, 3, 305–316. [Google Scholar] [CrossRef]
- Parker, A.; Namuth-Covert, D. Guidelines for the Conduct of Tests for Distinctness, Uniformity and Stability; International Union for the Protection of New Varieties of Plants (UPOV): Geneva, Switzerland, 2017. [Google Scholar]
- Payne, R.; Murray, D.; Harding, S. An Introduction to the GenStat Command Language; VSN International: Hempstead, UK, 2017. [Google Scholar]
- Bartlett, M.S. Properties of sufficiency and statistical tests. Proc. R. Soc. Lond. 1937, 160, 268–282. [Google Scholar]
- Zobel, R.W.; Wright, M.G.; Gauch, H.G. Statistical analysis of yield trial. Agron. J. 1988, 80, 388–393. [Google Scholar] [CrossRef]
- Purchase, J.L.; Hatting, H.; Van Deventer, C.S. Genotype × environment interaction of winter wheat (Triticum aestivum L.) in South Africa: II. Stability analysis of yield performance. South Afr. J. Plant Soil 2000, 17, 101–107. [Google Scholar] [CrossRef]
- Kang, M.S. Simultaneous selection for yield and stability in crop performance trials: Consequences for growers. Agron. J. 1993, 85, 754–757. [Google Scholar] [CrossRef]
- Lin, C.S.; Binns, M.R. A superiority measure of cultivar performance for cultivar x location data. Can. J. Plant Sci. 1988, 68, 193–198. [Google Scholar] [CrossRef]
- Alvarado, G.; Roodríguez, F.M.; Pacheco, A.; Burgueño, J.; Crossa, J.; Vargas, M.; Pérez-Rodríguez, P.; Lopez-Cruz, M.A. META-R: A Software to analyse data from multi-environment plant breeding trials. Crop J. 2020, 8, 745–756. [Google Scholar] [CrossRef]
- Olivoto, T.; Lúcio, A.D. Metan: An R package for multi-environment trial analysis. Methods Ecol. Evol. 2020, 11, 783–789. [Google Scholar] [CrossRef]
- Tukamuhabwa, P.; Asiimwe, M.; Nabasirye, M.; Kabayi, P.; Maphosa, M. Genotype by environment interaction of advanced generation soybean lines for grain yield in Uganda. Afr. Crop Sci. J. 2011, 20, 107–115. [Google Scholar]
- Assefa, T.; Mahama, A.A.; Brown, A.V.; Cannon, E.K.S.; Rubyogo, J.C.; Rao, I.M.; Blair, M.W.; Cannon, S.B. A review of breeding objectives, genomic resources, and marker-assisted methods in common bean (Phaseolus vulgaris L.). Mol. Breed. 2019, 39, 20. [Google Scholar] [CrossRef]
- Temesgen, T.; Keneni, G.; Sefera, T.; Jarso, M. Yield stability and relationships among stability parameters in faba bean (Vicia faba L.) genotypes. Crop J. 2015, 3, 258–268. [Google Scholar] [CrossRef]
- Yohane, E.N.; Shimelis, H.; Laing, M.; Mathew, I.; Shayanowako, A. Genotype-by-environment interaction and stability analyses of grain yield in pigeonpea [Cajanus cajan (L.) Millspaugh]. Acta Agric. Scand. Sect. B Soil Plant Sci. 2021, 71, 145–155. [Google Scholar] [CrossRef]
- Bernardo, R. Reinventing quantitative genetics for plant breeding: Something old, something new, something borrowed, something BLUE. Heredity 2020, 125, 375–385. [Google Scholar] [CrossRef]
- Rukundo, P.; Shimelis, H.; Laing, M.; Mashilo, J. Genotype-by-environment interaction for dual-purpose traits in sweetpotato. J. Crop Improv. 2020, 34, 800–823. [Google Scholar] [CrossRef]
- Gujaria-Verma, N.; Ramsay, L.; Sharpe, A.G.; Sanderson, L.A.; Debouck, D.G.; Taran, K.E. Gene-based SNP discovery in tepary bean (Phaseolus acutifolius) and common bean (P. vulgaris) for diversity analysis and comparative mapping. BMC Genom. 2016, 17, 2. [Google Scholar] [CrossRef]
- Bocianowski, J.; Niemann, J.; Nowosad, K. Genotype-by environment interaction for seed quality traits in interspecific cross-derived Brassica lines using additive main effects and multiplicative interaction model. Euphytica 2019, 215, 7. [Google Scholar] [CrossRef]
- Balestre, M.; Von Pinho, R.G.; Souza, J.C.; Oliveira, R.L. Genotypic stability and adaptability in tropical maize based on AMMI and GGE biplot analysis. Genet. Mol. Res. 2009, 8, 1311–1322. [Google Scholar] [CrossRef]
- Tigabu, D.A.; Tadesse, Z.; Zegeye, H.; Assefa, A. Seasonal variability and genetic response of elite bread wheat lines in drought prone environments of Ethiopia. J. Plant Breed. Genet. 2017, 5, 15–21. [Google Scholar]
- White, J.W.; Singh, S.P. Sources and inheritance of earliness in tropically adapted indeterminate common bean. Euphytica 1991, 55, 15–19. [Google Scholar] [CrossRef]
- Beebe, S.; Rao, I.M.; Devi, M.; Polania, J. Common beans, biodiversity, and multiple stress: Challenges of drought resistance in tropical soils. Crop Pasture Sci. 2014, 65, 667–675. [Google Scholar] [CrossRef]


Disclaimer/Publisher’s Note: The statements, opinions and data contained in all publications are solely those of the individual author(s) and contributor(s) and not of MDPI and/or the editor(s). MDPI and/or the editor(s) disclaim responsibility for any injury to people or property resulting from any ideas, methods, instructions or products referred to in the content. |
© 2022 by the authors. Licensee MDPI, Basel, Switzerland. This article is an open access article distributed under the terms and conditions of the Creative Commons Attribution (CC BY) license (https://creativecommons.org/licenses/by/4.0/).