Abstract
Over the last three decades, a great investment effort has been made in the modernization of irrigation in the Valencian Community (Spain). The initial change from distribution networks to pressurized ones and the shift towards drip irrigation systems was followed by improvements in irrigation scheduling, based on agrometeorological data, soil water content sensors, and remote sensing. These improvements are considered adequate for increasing irrigation water use efficiency, but it is difficult to find systematic measurements to assess its impacts on irrigation adequacy along with irrigation productivity in fruit orchards. This work presents the results of a four year assessment of irrigation water and energy use efficiency along with water productivity of a recently established irrigation community in the province of Valencia (Spain). The study was carried out at the orchard level and focused on two fruit crops: persimmon and peach trees. Six irrigation performance indicators, relative water supply (RWS), relative irrigation supply (RIS), yield performance (Yp), global water productivity (WPoverall), output per unit irrigation water (OUI), and the percent of nitrogen fertilization obtained by irrigation water, were defined and calculated for years 2017 to 2020 in 104 persimmon and peach orchards. The results showed that most of the farmers irrigated below the crop water requirements, showing RWS and RIS values less than 1, and there was great variability among farmers, especially in WPoverall and OUI indicators.
1. Introduction
Irrigation has been the keystone of agricultural production and rural development in Spain. Nowadays, after three decades of irrigation schemes modernization, irrigated agriculture represents 14% of the serviceable agricultural area but provides 50% of the Spanish final plant production [1].
The modernization of irrigation schemes in Spain [2], and also in the Valencia region [3], has entailed changing from open channels networks for surface irrigation to pressurized pipes networks and drip irrigation systems. This modernization has allowed the reduction in irrigation water use [4,5] and improved the control of irrigation application by farmers [2,5] aided by irrigation management and information systems at the national level [6] and at the Valencian Community regional level [7].
Still, the assessment of irrigation performance under different points of view is key to detect and correct unfit irrigation practices and extract all the potential of irrigated agriculture in terms of agricultural production and food supply for a growing population but also farmer’s incomes and improvement of the rural economic system. Irrigation performance assessment is an essential tool for recording, comparing, and improving the water management of irrigation schemes [8,9,10,11]. Research in this field has typically used the performance indicators approach [10,12,13,14,15,16,17,18] that was initially designed to evaluate irrigation development projects [19]. Most of the research focused on the hydraulic management of large irrigated areas [20,21,22,23,24] and medium or small irrigation schemes [25,26,27,28,29,30,31].
Following this successful approach, a similar indicators methodology was developed to assess the energy use efficiency of pressurized irrigation schemes [32,33,34,35]. Córcoles et al. [36] used the performance indicators defined by IPTRID [10], and proposed new production and energy related indicators to a benchmarking exercise with seven irrigation communities in Castilla–La Mancha (Spain) during three irrigation seasons.
The hydraulic performance assessment of the irrigation system needs to be related to the agricultural productivity and economic performance of irrigated schemes. The assessment of agricultural performance is important because it links the indicators of hydraulic or conveyance performance with the wider agricultural economic and rural economic systems [15]. Some examples of this integration of agricultural indexes into the hydraulic assessment of irrigation communities in Spain are provided in [36,37,38,39] for [37,38,39] horticultural and field crops, and in [40,41] for greenhouse horticultural crops.
Results of irrigation performance and agricultural productivity in Spain can be found for woody crops such as vineyards, almonds, and olive [36] and citrus trees [42].
In the Valencia region, Parra et al. [43] assessed the factors that influence irrigation performance at plot level in another irrigation community finding that deficit irrigation was a common feature in citrus orchards and that the full-time or part-time dedication of growers had an effect on productive efficiency and economic efficiency for different citrus varieties. Assessing and ranking the global water use efficiency of citrus orchards has been also an application of performance indicators. Poveda-Bautista et al. [44] built a synthetic irrigation efficiency index using the analytic hierarchy process, AHP, with the aim to recognize best agricultural practices for the efficient use or water resources.
Through time, the application of the performance indicators methodology for irrigation assessment and improvement has followed a path from highly important field crops at irrigation districts scale to less represented crops at irrigation community or plot scale. In this passage, more indicators have been added to account for energy efficiency, agricultural productivity, and environmental factors.
This work proposes a set of irrigation performance indicators aimed at assessing the water use and productivity at plot level and describes a case study of their application to peach and persimmon orchards of an irrigation community in the province of Valencia, Valencian Community, Spain. The final purpose is to provide insight of individual and collective performance, for farmers and irrigation community managers, respectively, to improve their irrigation water use while conserving water resources and avoiding environmental N pollution.
2. Materials and Methods
2.1. Irrigated Area Description
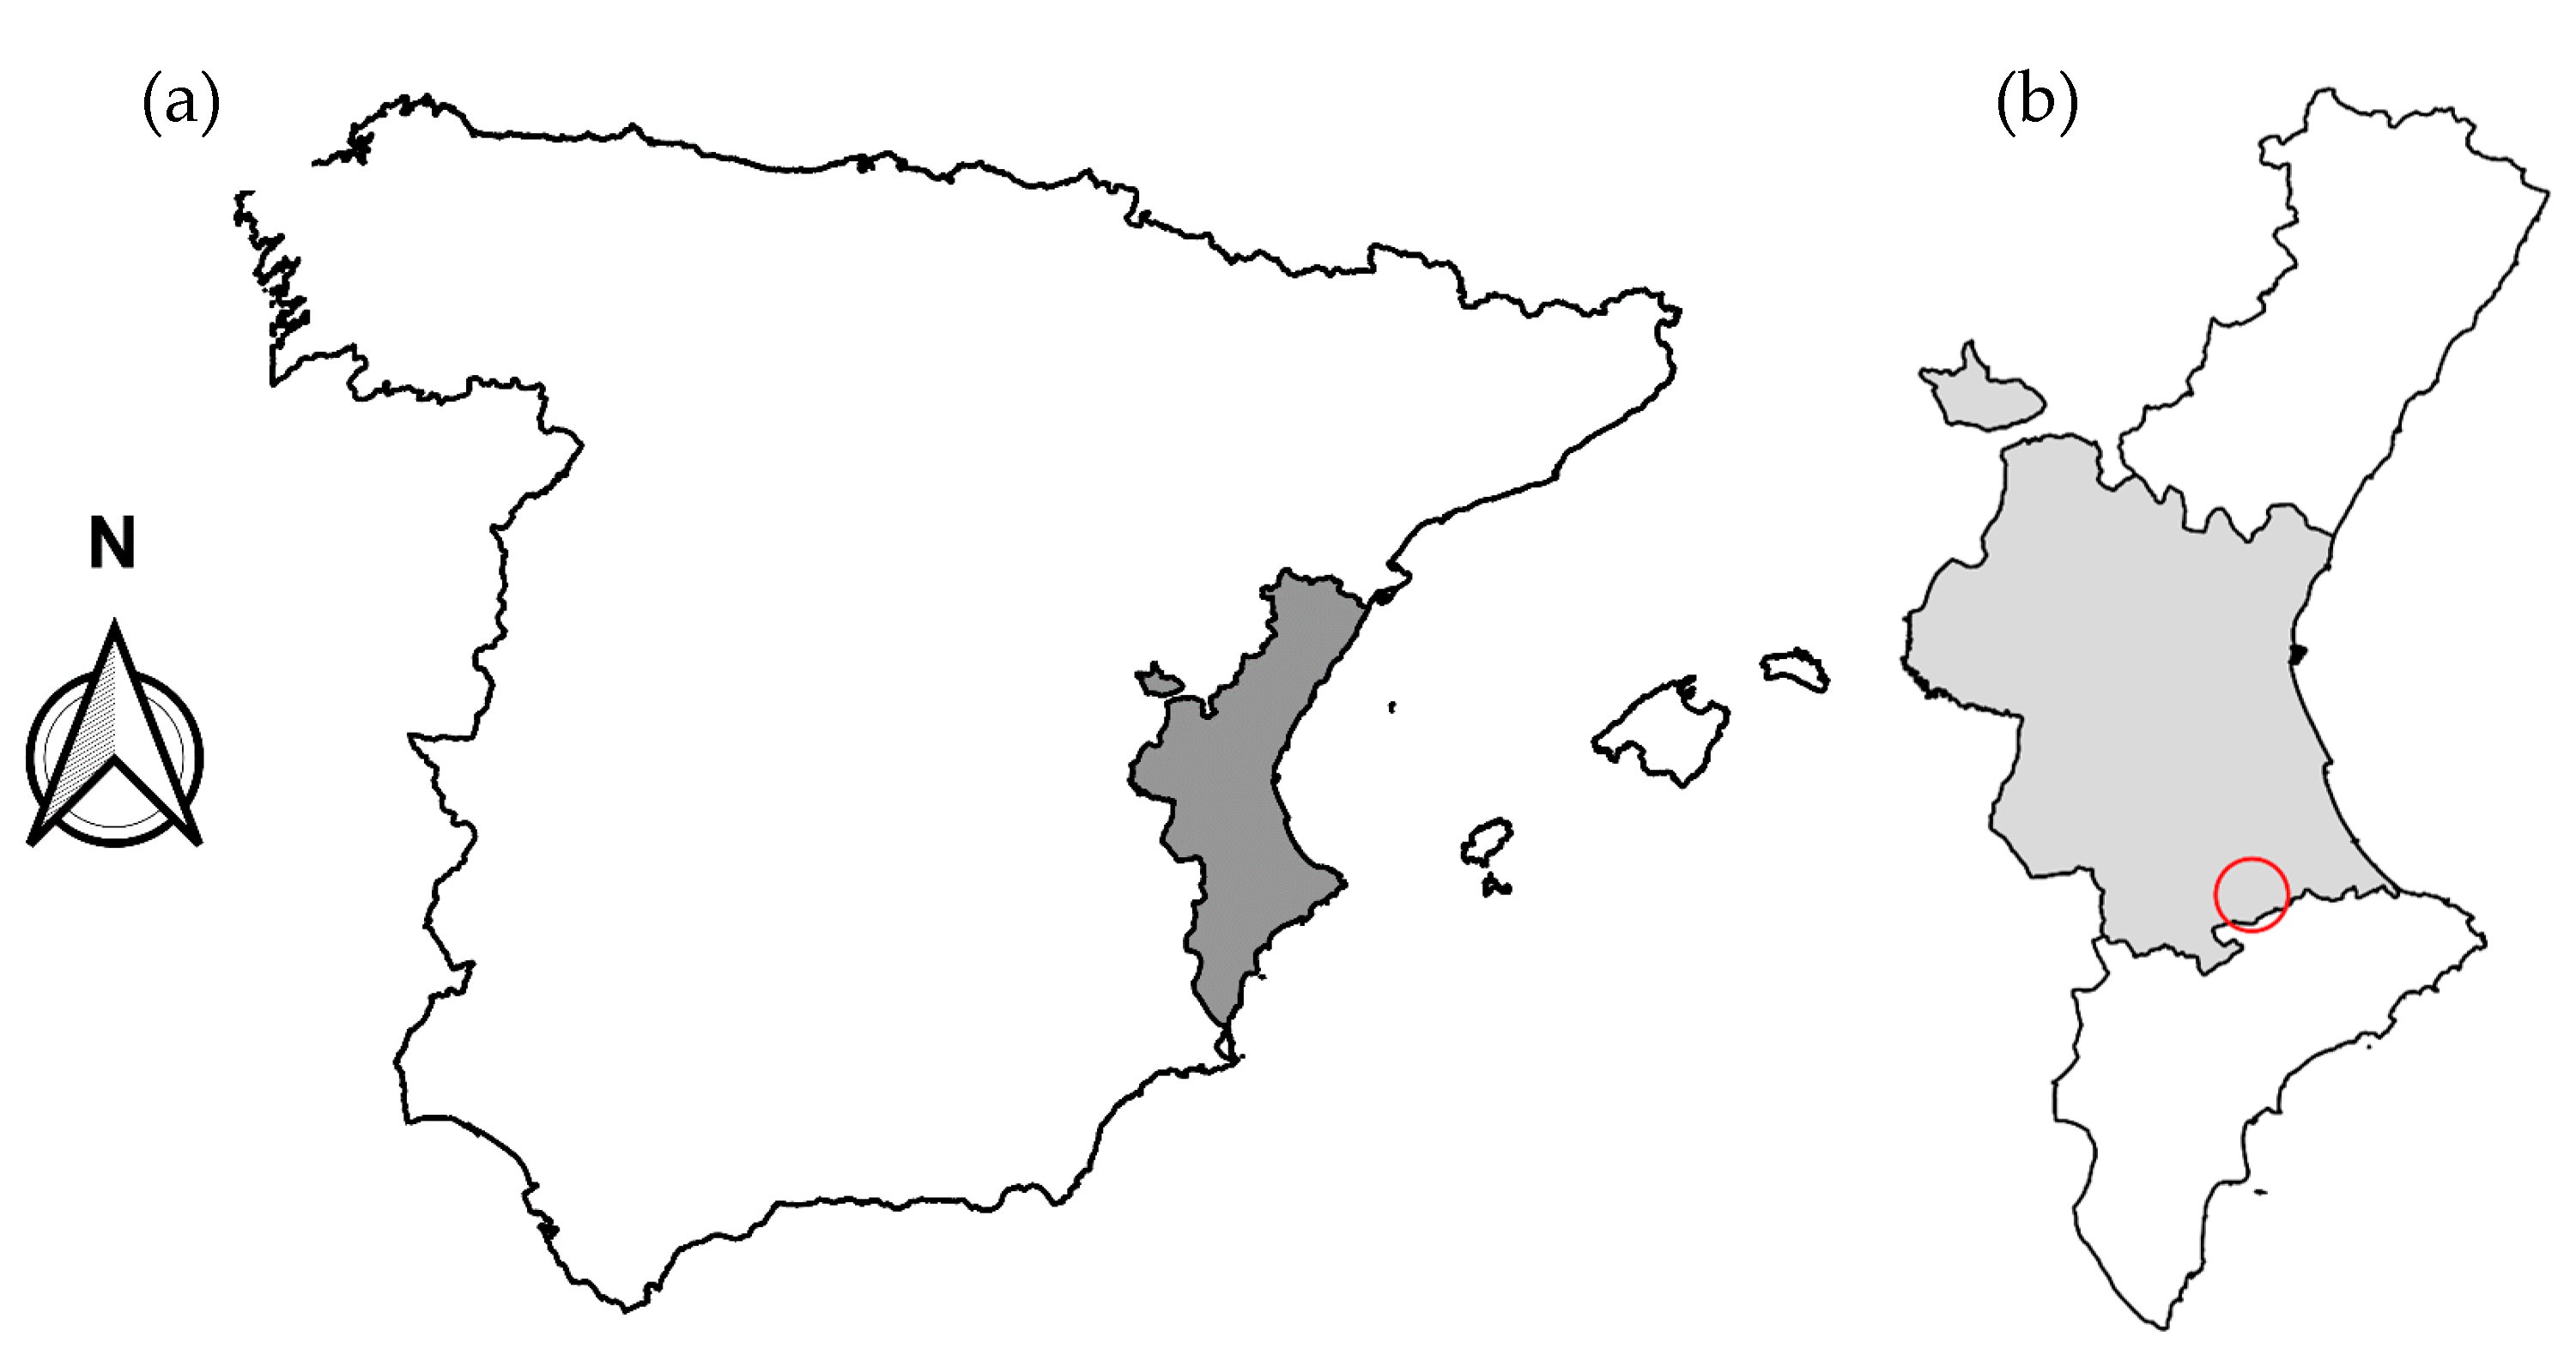
The irrigation community is located in the south of the Valencia province, Valencian Community (Spain), as shown in Figure 1. It encompasses agricultural plots from several municipal terms, serving an irrigated area of around 290 ha. The irrigation community was established in 2008 to exploit the effluents of a water treatment facility serving three municipalities to bring stable irrigation to former dryland crops. The irrigation community has a pumping station at the outlet point of the wastewater treatment plant, a booster station to pump water to an elevated reservoir of 170,000 m3, and another pumping station directly injecting to the irrigation network. The irrigation network is pressurized and fully automated. It is divided into four irrigation sectors serving 72 farmers. Further, 26 farmers with persimmon and peach orchards participated in this study with a total of 55 persimmon and 49 peach plots.
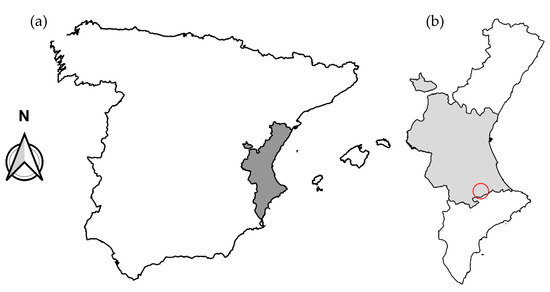
Figure 1.
Location of the Valencian Community in Spain (a) and location of the studied irrigation community at the southern limit of the Valencia province (b).
The climate in the irrigation district is a hot-summer Mediterranean climate in the Köppen climate classification, with a yearly average precipitation of 614 mm. The average air temperature is 17.4 °C on annual basis, and it ranges from a minimum of 10.0 °C in January to 26.3 °C in August [45].
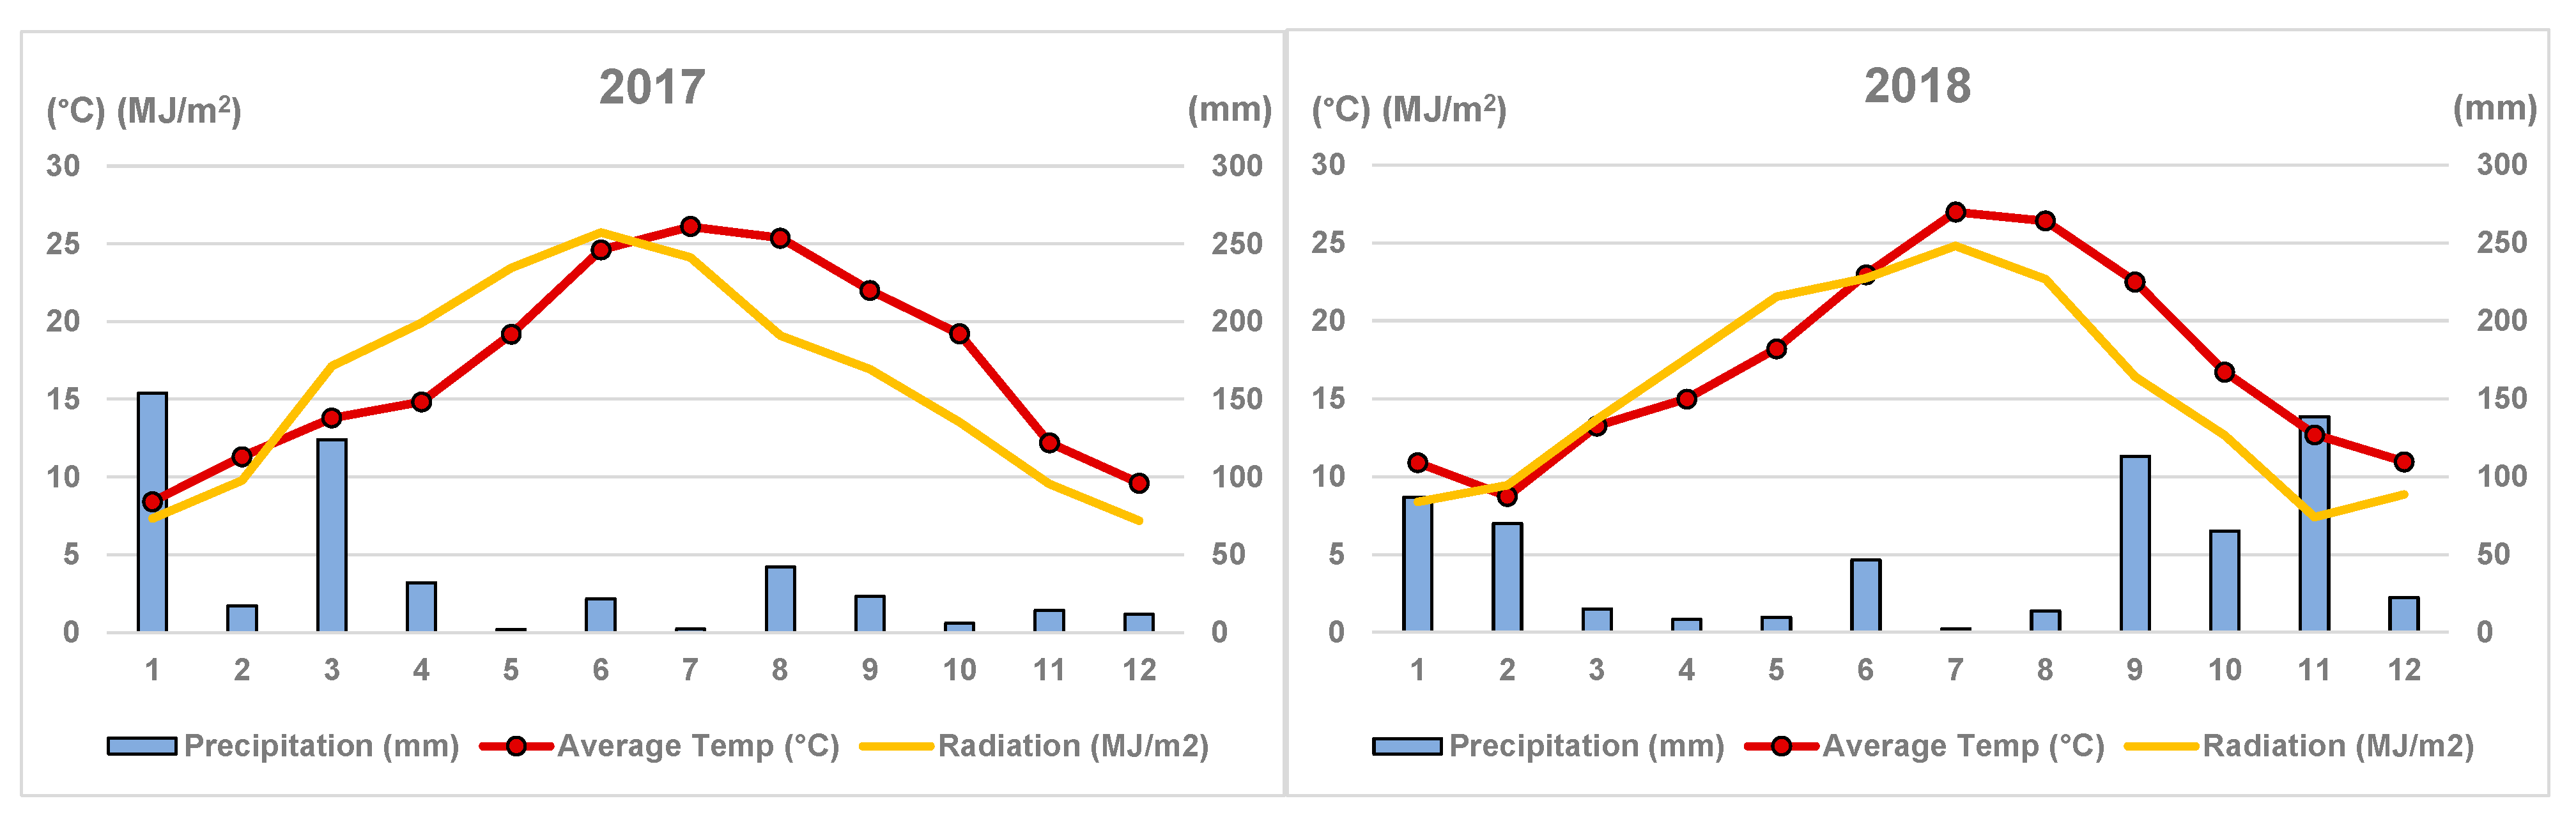
This work focuses on the performance of the irrigation community along years 2017 to 2020. Figure 2 describes the trend of environmental conditions—monthly average temperature in °C, global radiation in MJ/m2, and precipitation in mm—along the four years studied. Average monthly temperature and global radiation were very similar throughout the four years considered in this study. Annual rainfall was lower in 2017 than in the following three years, but in all cases, it attained values below the long-term rainfall average of the area of 614 mm. Typically, rainfall tended to accumulate during autumn and winter seasons. In 2017, the autumn rainfall was very low compared to the other years, and in 2019, the springtime rainfall accumulated mostly in April.
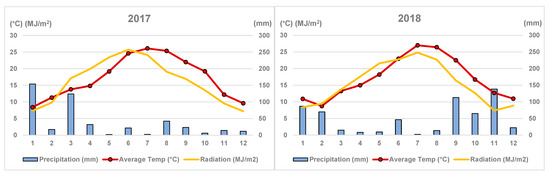

Figure 2.
Trend of environmental conditions between 2017 and 2020. Monthly average temperature, in °C, and global radiation, in MJ/m2, are shown in the left vertical axis, and precipitation, in mm, is referred to in the right vertical axis.
Table 1 summarizes the environmental conditions regarding evapotranspirative demand, ETo, in mm; total precipitation, P, in mm, throughout the years considered in this study; and precipitation along the cropping season spanning from March to October, P March–October, in mm. Annual ETo values remained quite constant, as well as P, except for in 2017, which had the lowest P value. Annual precipitation in the studied years stayed below the yearly average of the area (614 mm). Since crop water requirements calculations consider the precipitation occurred during the cropping season, we also calculated the sum of precipitation from March to October. There was a difference of 185 mm between year 2019 and the average of 2017, 2018 and 2020. This difference accumulated only in the month of April 2019. In all cases, summer and autumn months registered reduced amounts of rainfall, as is typical.

Table 1.
Reference evapotranspiration, ETo; yearly precipitation, P; and cropping season, P March–October, precipitation for years 2017 to 2020.
The cropping pattern in the irrigation community is very diverse, including fruit orchards, horticultural crops, olives, wine grapes, and nursery gardens. Persimmon (Diospyros kaki Thunb.) and peach (Prunus persica (L.) Batsch) are the main cultivated crops in terms of surface area and economic income. The varieties cultivated in this area are Rojo brillante for persimmon and 26 different peach varieties. Table 2 shows the names of the six main peach varieties in terms of cropped area and the most common characteristics of the studied plots. This study considered all the persimmon and peach orchards in the irrigation community; these orchards comprised 38.23 ha of persimmon and 23.57 ha of peach, which represent 13.2 % and 8.1 % of the irrigation community cropped area, respectively. The average size of the studied plots was 0.59 ha, with a maximum of 4.03 ha and a minimum of 0.05 ha. The average size of persimmon plots was bigger than that of the peach ones (Table 2).
Table 2.
Description of orchards and crops monitored.
Each plot’s planting date was provided by the owners, and orchards were classified according to tree age, as sapling, young, or adult. Peach is a rapid growth crop, and the final size of trees is smaller than that of persimmon. To take this fast or slow growth into account, peach trees aged 3 or less were classified as saplings, trees aged 6 or less were classified as young, and adults were those trees older than 6 years. In the case of persimmon, trees aged 4 years or less were classified as saplings, trees aged 8 or less were classified as young and adults were those older than 8 years. The number of plots considered under the three tree sizes, adult, young, and sapling, varied along the studied seasons, as shown in Table 3. There were two reasons for this number variation: firstly, since the irrigation community was starting its operation, an increasing number of plots were gaining access to the irrigation facility each year; and secondly, trees evolved from sapling to young and adult trees in time. The tendencies showed an increase in young persimmon orchards as saplings grew older and a more stable trend in the case of peach orchards. In this latter case, there was a tendency to abandon mid-season peach varieties for extra-early varieties, though the most abundant ones remained the early varieties. Table 3 also shows the number of plots that had dependable yield data and thus were considered for statistical analysis of productivity indicators. As can be seen in Table 3, higher planting densities are found through time in the young and sapling categories of both crops.
Table 3.
Number of plots under irrigation, number of plots with yield data, and planting densities for each crop and tree size, from 2017 to 2020 of the plots considered in the indicators analysis.
The average yield values for the Valencia province of the “Peaches and Nectarines” and “Persimmon” classes provided by the statistics office of the Agriculture Ministry [46] were: 11,704, 10,910, 13,158, and 9,015 kg/ha for “Peaches and Nectarines” in years 2017, 2018, 2019, and 2020, and 29,792; and 32,235, 30,774, and 29,112 kg/ha for “Persimmon” in years 2017, 2018, 2019, and 2020, respectively.
2.2. Definition of Performance Indicators
Performance indicators must be adapted to the purpose of the evaluation and the characteristics of the irrigation scheme [12]. So that the process of obtaining and comparing the indicators is effective, the data required for calculations must be recorded customarily by the irrigation community or the cooperative and there must not be added difficulties to the interoperability of the required data. In this case, the following five performance indicators were chosen to assess the results of irrigation practices in each of the studied plots:
Annual relative water supply, RWS, as defined in Bos et al. [12], relates the amount of water received by the crop from the effective precipitation and irrigation and the crop water requirements, ETc.
where ETc is the annual crop evapotranspiration calculated according to FAO-56, and Pe is the annual effective precipitation or rainfall, calculated using the USDA-SCS model.
Annual relative irrigation supply, RIS, as defined in Bos et al. [12], relates the amount of irrigation water applied to the crop, which depends on the farmer’s practice and the reliability of the irrigation system, and the crop’s irrigation requirements, calculated as ETc-Pe. In our case, we considered the theoretical gross volume of irrigation water required to avoid water stress to the crop, which depends on the kind of crop—peach or persimmon—the environmental variables, the irrigation interval, and the application uniformity.
As all indicators that deal with adequacy, RIS includes an estimation of irrigation requirements, the nature of which must be clearly specified [47]. We took the total annual volume of crop irrigation requirements as the raw irrigation requirement, Ir, which was calculated as:
where UC is the uniformity coefficient of the drip irrigation system. In this case, we considered a generic UC = 0.95 since the drip irrigation systems at plot level are recent and installed by qualified professionals.
The optimal RIS value is 100%, which is found when the irrigation applied matches the water requirements of the crop.
Yield performance (%) is the actual yield, stated as a % of target yield, as defined in Bos et al. [12] and Bos et al. [47].
This indicator is only calculated for adult trees, i.e., trees of six years or older for peach or eight years or older for persimmon. Young trees or saplings are excluded because they can have a fraction of adult yield depending on their size and not only as a response to irrigation dose. Developing the crop target yield can be done by a percentage increase over existing levels, a comparison to national targets or norms, or an empirical value, which represents the actual performance of the top ten or twenty percent of farmers in the system [47].
Overall water productivity of the irrigated crop (WPoverall), according to Bos et al. [12], is defined as the ratio between the total annual mass of crop production, including all grades, and the annual volume of irrigation water applied (kg/m3).
Output per unit irrigation delivery, OUI (EUR/m3), as defined in Bos et al. [12], measures the financial efficiency of the cropped plot:
The percentage of N fertilizer provided by irrigation water (N %) is calculated as the actual number of N fertilizer units applied, expressed as a % of N fertilizer units required under good management conditions.
This is an indicator developed for the particular condition of this irrigation community that uses reclaimed municipal waste water that has a certain concentration of N variable in the years studied. Our aim was to discover if there was an excess N fertilization that could hinder fruit production or cause environmental problems if leaching of irrigation water occurred. The values of the N fertilizer units required were obtained from locally developed recommendations for peach [48] and persimmon [49].
2.3. Measurements and Calculations
The values of the total annual volume of irrigation water applied to the crop, I (m3), were provided by the Irrigation community metering and control software for each of the considered plots for seasons 2017 to 2020.
Daily environmental data, reference evapotranspiration, ETo (mm), and precipitation, P (mm), were obtained for the period 2017 to 2020 from a nearby agrometeorological station of the Spanish Agriculture Ministry [6] (UTM X: 720841; UTM Y: 4306490; altitude: 233 m). Reference evapotranspiration (ETo) was calculated with the Penman-Monteith equation [50] from meteorological variables measured at this agrometeorological station.
Total annual volume of irrigation requirements was calculated with Cropwat 8.0 [51] using the single coefficient approach. Locally determined crop coefficients were obtained from the IVIA, the Valencian Institute of Agricultural Research irrigation advisory programme [7,52]. Peach and persimmon Kc were multiplied by a correction coefficient, Kd, accounting for the shaded area of adult, young, and sapling drip irrigated trees obtained from [53]. To estimate the percentage of shaded area, a tree crown diameter of 1.1, 1.9, and 3.1 m was considered for sapling, young, and adult peach trees; the tree spacing considered for the calculation was the average of all plots—5.6 m between rows and 3.6 m between trees in a row. For persimmon orchards, tree crown diameters considered were 1.4, 2.1 and 3.5, while the tree spacing was 5 m between rows and 3.5 m between trees.
The length of crop development periods as well as the rooting depth was estimated considering FAO-56 [50] recommendations, according to evidence found by [54] and [55] that active water uptake by roots takes place in the first 0.6 m of the soil profile. Rooting depth values of young trees were interpolated between adult and sapling rooting depths. The values of crop parameters employed for ETc calculations are shown in Table 4.
Table 4.
Crop data for Cropwat ETc calculations.
The values of total annual mass of crop yield and the average prices of fruit were provided by a commercialization cooperative where most of the farmers sell their produce.
As crop target yields for Yp calculations, we used the average yield values for the Valencia province of the “Peaches and Nectarines” and “Persimmon” classes provided by the statistics office of the Agriculture Ministry [46].
Nitrogen, as NO3−, concentrations were obtained from customary irrigation water analysis at the irrigation reservoir at the beginning of the four irrigation seasons. The reference values for N FU were obtained from [56] for peach and from [49] and [48] for persimmon.
2.4. Statistical Analysis
Statistical analysis was performed with R statistical software [57] under RStudio interface [58]. Data of annual irrigation doses, in m3/ha, and crop yields, in kg/ha, were tested for outliers and normality before performing the analysis of variance, ANOVA, for the calculated performance indicators. Out of the initial 104 orchards obtained from the irrigation community census, five plots were eliminated because they had not had irrigation in any of the years studied. No outliers were detected among the annual irrigation depths data. For the yield data, five yield data were deleted after checking that they corresponded to the same two persimmon orchards and were provided by the farmers in a telephone survey. Apparent peach yield outliers were examined but not removed, since there was a remarkable variability of varieties and planting densities among peach orchards that could explain high yields.
Analysis of variance was performed as a three-way ANOVA, in which the factors were: year (2017, 2018, 2019 and 2020), crop (peach or persimmon), and tree size (adult, young, or sapling). The model was additive and evaluated the interaction between the three factors grouped pairwise.
3. Results
Measured and Calculated Values of Environmental Parameters
Calculated raw irrigation requirements (Equation (3)) for both crops and tree sizes showed similar values for 2017, 2018, and 2020 (Table 5). The higher precipitation amount of 2019 did not result in a reduction in irrigation requirements, because its very concentrated occurrence in April did not increase the effective precipitation values.
Table 5.
Calculated raw irrigation requirements and averages of the annual irrigation depths applied to the different plots for persimmon and peach orchards for years 2017, 2018, 2019, and 2020.
Table 6 summarizes the average values of the six performance indicators along the four irrigation seasons. The analysis of variance identified a growing season effect that was significant (p < 0.05) for RWS and WPoverall, and very significant (p < 0.01) for OUI and N. The Crop factor had a significant or very significant effect for all the indicators except for N. The tree Size factor also had a significant or very significant effect on all the indices.
Table 6.
Average values for the six calculated performance indicators: annual relative water supply, RWS, annual relative irrigation supply, RIS, yield performance, Yp (%), overall water use efficiency, WPoverall (kg/m3), output per unit irrigation water, OUI (EUR/m3), and percentage of nitrogen fertilization requirement supplied by irrigation water, N (%).
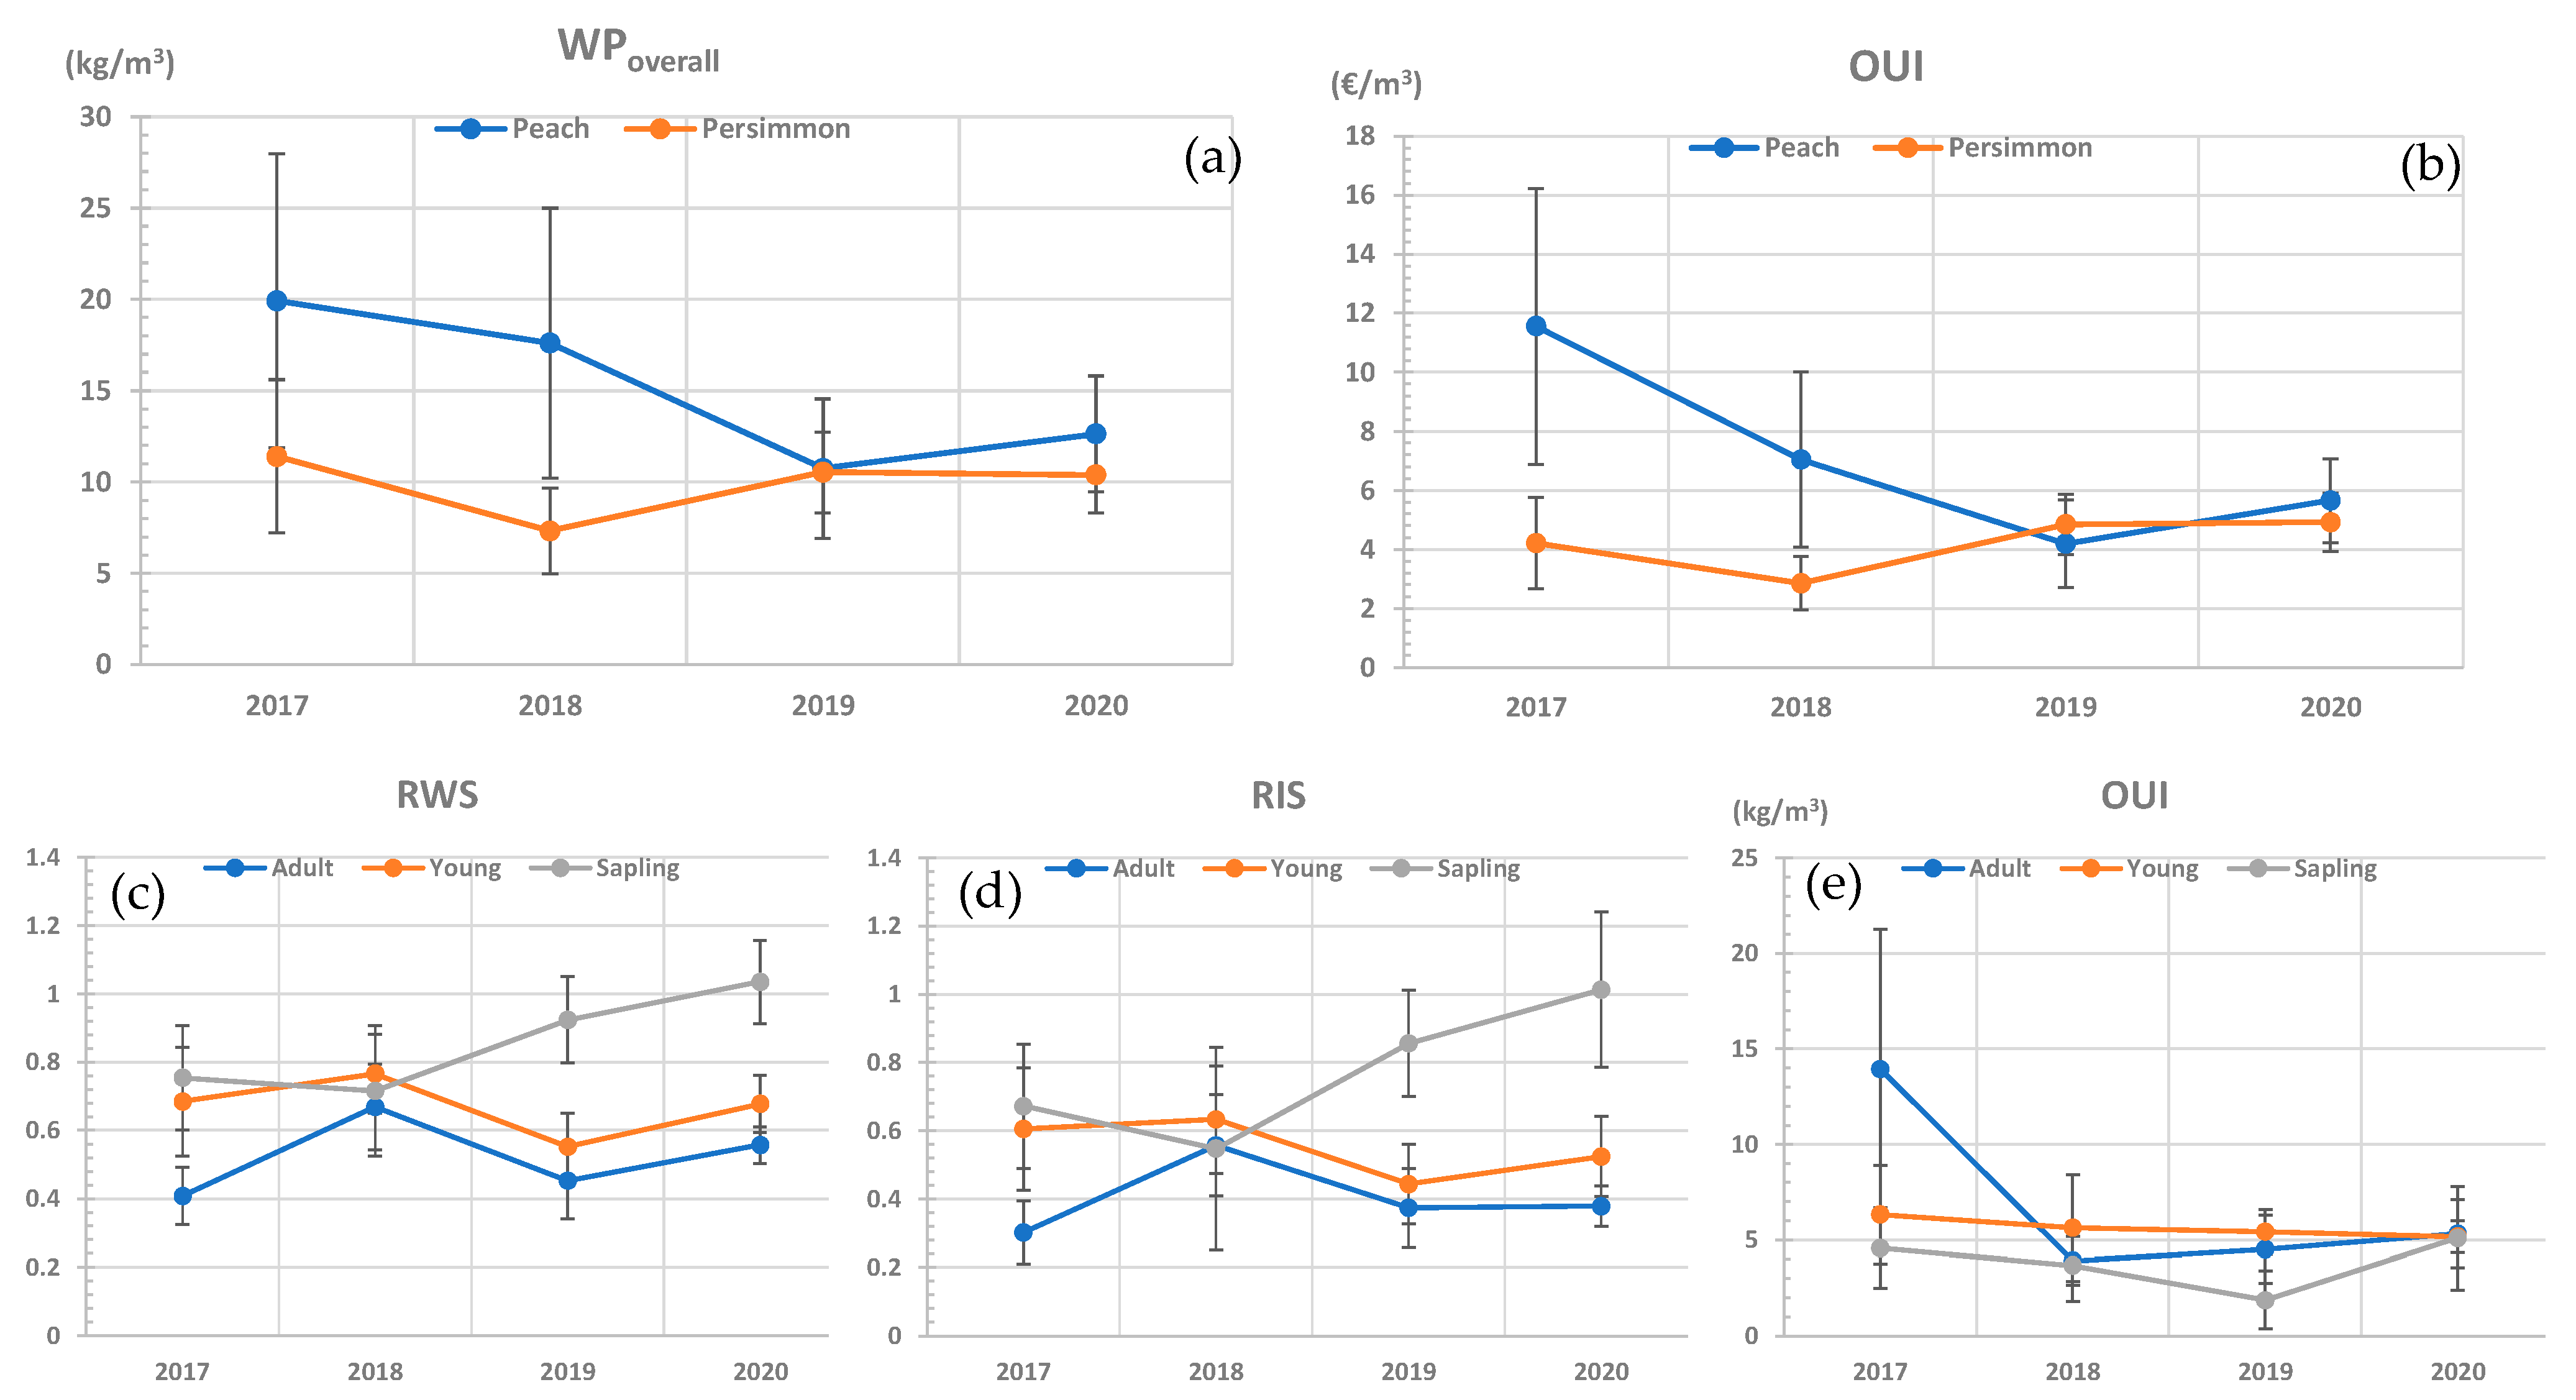
The values of RWS and RIS below one, except for peach saplings in 2020 (Figure 2), indicate that deficit irrigation is applied in all cases, the maximum evapotranspiration demand of the crops is not met, and reductions in productivity can be expected [37,39,43]. In our case, the interaction of year × size (graph (e)) of Figure 3 is due to the adult OUI value that is noticeably higher than the rest, because adult trees are the least irrigated in both crops.
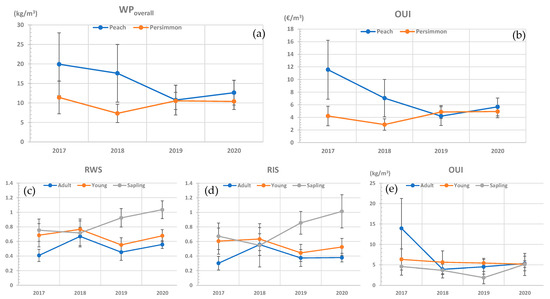
Figure 3.
Interactions of year × crop and year × size. The graphs (a,b) show the variation in WPoverall and OUI averages, respectively, in the years studied. The graphs (c–e) show the variation in RWS, RIS, and OUI averages, respectively, in the years studied. Error bars represent the 95% confidence interval of each value.
The Yp indicator shows the ratio of actual to target yield, which behaves differently in persimmon and peach crops. It is lower than 100% for persimmon and higher than 100% for peach. The values considered for target yield were the ones provided for “Persimmon” and for “Peaches and Nectarines” classes by the statistics office of the Agriculture Ministry for the Valencia province. In the case of Persimmon, the low values of Yp may be due to the low RWS and RIS values, though no correlation is noticeable, but it could also be caused by the choice of the target yield value. Persimmon is a specialty crop that is mainly cultivated in the Ribera del Júcar area, where the yields may be higher than in the study area. On the other hand, the study area is a traditional producer of stone fruits, which could explain the yields in line with or slightly higher than the average of the Valencia province.
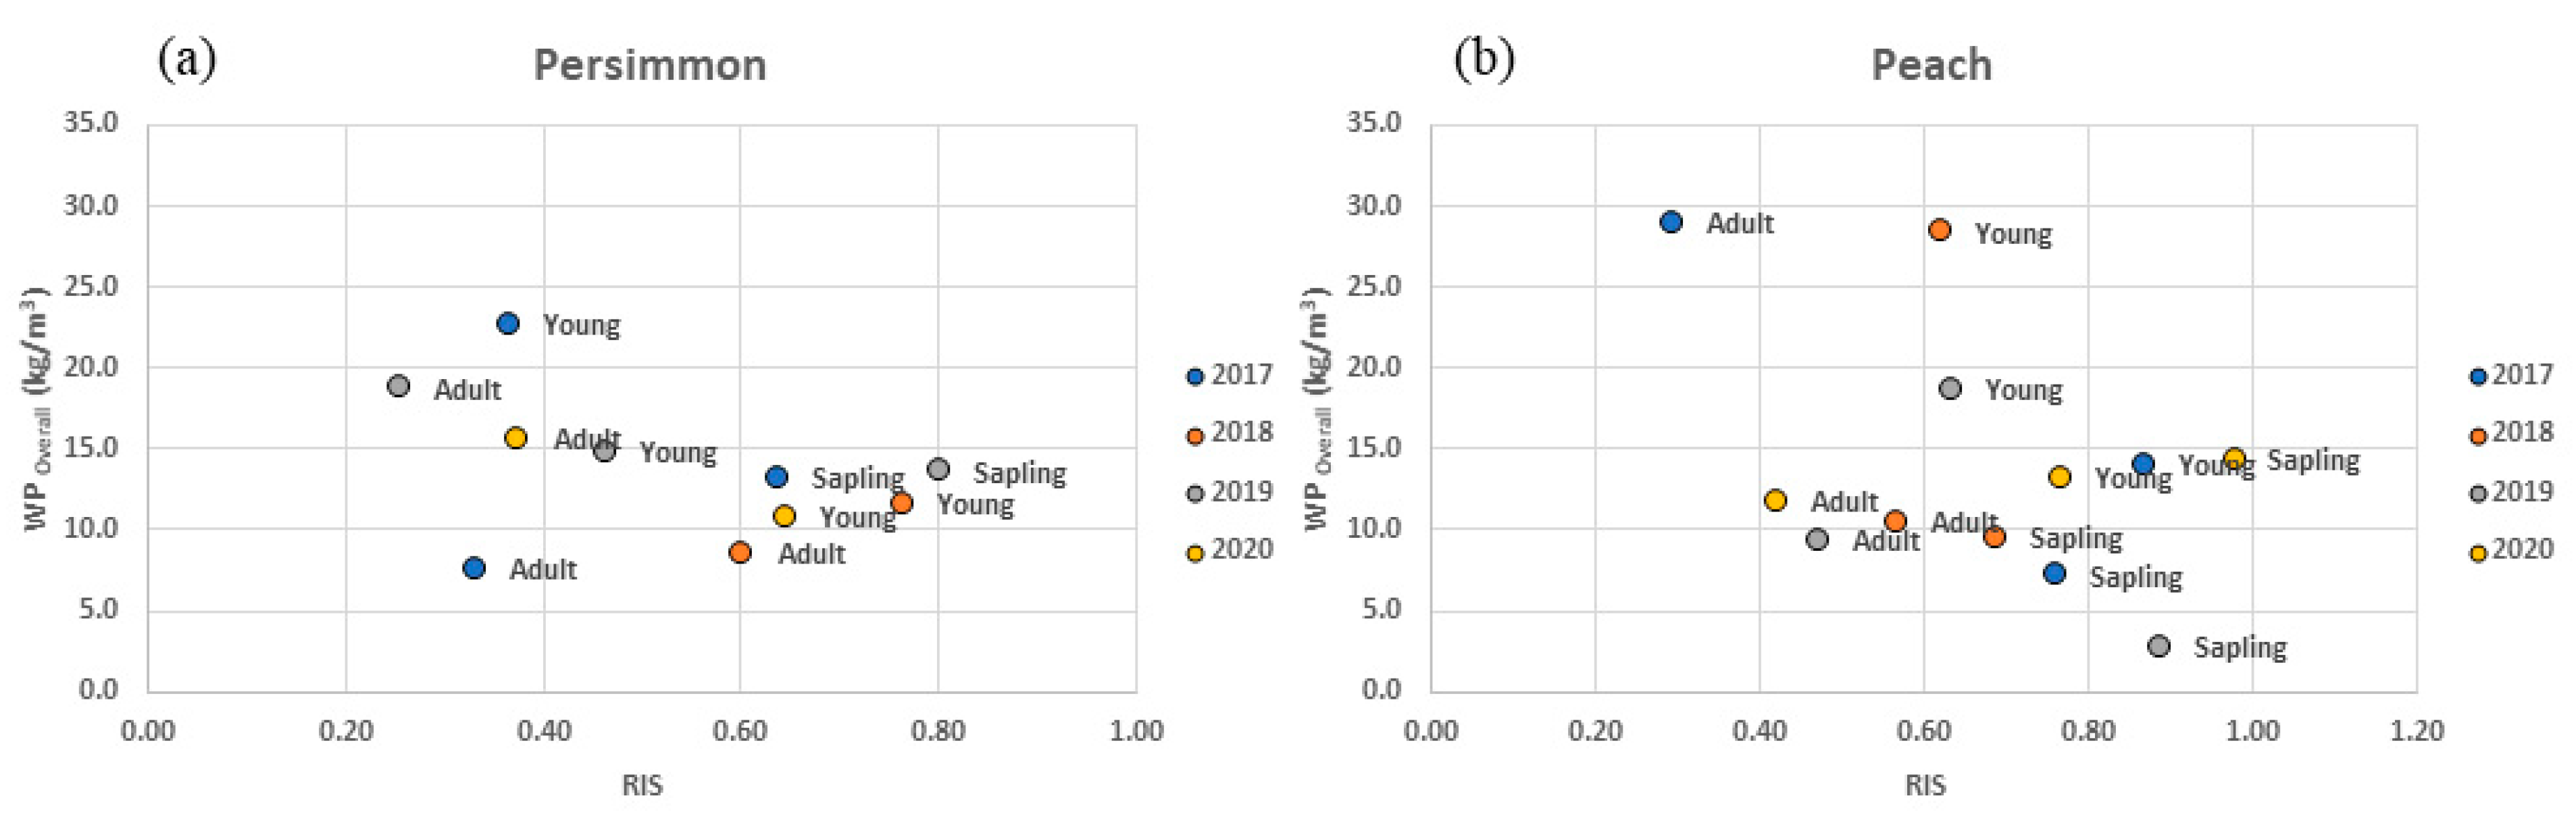
Overall water productivity, WPoverall, varied appreciably between years and crops. It showed no apparent relationship with the annual irrigation applied, nor with the RWS or RIS indices (Figure 4); this lack of correlation may be due to the higher planting densities of younger orchards that can offset the reduction in WPoverall caused by increased irrigation depths.
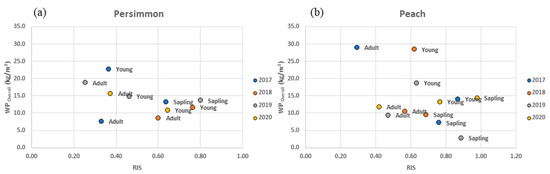
Figure 4.
WPoverall vs. RIS.: (a) persimmon; (b) peach. Each dot corresponds to a tree size for years 2017 to 2020.
Finally, as an environmental indicator, the percentage of N fertilizer units received with irrigation water showed remarkable variability among years. It decreased in 2019 due to the nitrate concentration in the irrigation water that was one third of the values attained the other three years. During 2019 and the first months of 2020, the irrigation community did not receive water from the municipal wastewater treatment plant for quality reasons. The highest values for %N are 35% and 32% for persimmon and peach, respectively. These values indicate N contributions of the irrigation water lower than the crop N requirements, so in the actual conditions, no pollution problems associated with nitrate leaching are to be expected due to both the low concentrations in the irrigation water and the low irrigation depths provided to the crops.
4. Discussion
The RWS and RIS values obtained indicate that irrigation practiced in this irrigation community does not balance the crop’s water requirements, and a reduction in yield is expected, caused by water stress. This finding is in line with other irrigation performance analysis performed for field crops and for citrus orchards in Spanish irrigation communities. Similar results were found in other irrigation schemes in Spain by Lorite et al. in Andalusia [39], and Dechmi et al. in Aragon [37] for field crops in both cases. Parra et al. [43], in citrus orchards, also report RWS and RIS values much lower than one.
Since ETc is a component in the RWS and RIS calculations, it is important to consider the effects that can be introduced by this parameter. In our case, the Kc values used for peach ETc calculations are lower than those recommended in FAO 56, while the persimmon Kc values we used are in line with those of deciduous fruit trees provided in FAO 56. In the case of peach, contradictory values can be found in the literature. For instance, Paço et al. [59] reported a mean Kcb of 0.5, which is less than that suggested by the FAO-56 for peach orchards (Kcb = 0.85), for orchards in similar conditions but with double planting density of the orchards analyzed in this work. The low Kc values employed for peach ETc calculations can be at the base of higher RWS and RIS results for peach and discerning if the differences in RWS and RIS values for peach and persimmon are real or a calculation artifact will require further inputs such as measures of water status or soil water or direct ETc monitoring with remote sensing techniques [60].
In the studied case, the small size of the orchards and the great variability of peach varieties contrasted with the more homogeneous characteristics of the persimmon orchards. A better adjustment of ETc calculations could be achieved, accounting for the different earliness of the cultivated varieties in the case of peach and tree spacing in both cases.
Lower values of RWS and RIS are consistently found for persimmon orchards rather than peach ones. This finding, along with a persimmon Yp value of 67%, suggest that an increase in irrigation doses along with sound irrigation schedules can improve yields for this crop in the local conditions. The peach growers of this irrigation community show a sound specialization in this crop, as indicated by a Yp value of 125%, and higher values of WPoverall and OUI than in persimmon. These Yp values are in the range of Yp values obtained by Sánchez et al. [41] for tomato and watermelon, though they used a different method for establishing the target yield, and their RIS reported values were considerably higher (RIS = 1.12).
WPoverall and OUI values for both crops are high compared to values obtained for other field crops and are similar to or slightly larger than those found for citrus [43]. Though OUI values for peach decreased in time, and those of persimmon show a slight increasing tendency, at the moment, it is not clear whether a crop shift can be expected in this irrigation community as compared to the case of farmers shifting to citrus cultivation in Andalusia due to higher profits [4].
The WPoverall vs. RIS relationship showed a decreasing trend at increasing values of RIS for peach, but not for persimmon. In the case of peach orchards, this decreasing trend indicates a lower marginal effect on the yield of each new unit of irrigation water applied. This decreasing trend was also observed by Sánchez et al. [41] in greenhouse pear tomato, cherry tomato, and watermelon crops. The shift to higher planting densities of newly established persimmon orchards masks this effect of increased RIS in younger orchards.
Modelling the productive response of fruit trees, such as peach and persimmon, to water requires a more refined approach, in which different cultural techniques, such as tree spacing, pruning and fruit thinning, can be considered. It is interesting to consider other effects of a sound irrigation practice in the yield of first quality fruits. For instance, large sized peaches are desirable commercial grades, but large persimmons are not a commercial target for production since smaller fruits are preferred by consumers. Applying a moderate early season water stress to persimmon orchards may be a good practice to reduce the fruit drop of persimmon [61] and obtain a higher number of fruits that are smaller in size and have a higher commercial value.
5. Conclusions
In this paper, we proposed and applied six simple irrigation performance indicators to assess the irrigation performance at orchard level of two fruit crops, peach and persimmon, in an irrigation community of the Valencia province in Spain, during four cropping seasons, years 2017 to 2020. The aim of this study was to gain insight in the irrigation management of farmers at orchard level and identify possible improvements to their irrigation practice.
This work allowed us to find differences in the irrigation water management of two different fruit crops in an irrigation community, but a comprehensive assessment of irrigation performance in fruit trees would require a higher consistency of crop irrigation requirements calculation, for instance using remote sensing for Kc determination trough vegetation indexes, a measure of actual soil water content with soil water content probes or using high resolution remote sensing, and a smaller time scale for water delivery recording, in order to obtain a better match of crop water requirements with the applied irrigation.
In the case of the irrigation community studied, the diversification of peach varieties, the variation of tree spacing, and other cultivation practices, such as pruning, along with the small size of the orchards increase the calculation effort to have adjusted values for the irrigation performance indicators presented.
Nitrogen contributions of the reclaimed irrigation water applied were lower than the crop N requirements. In the actual conditions, no environmental pollution problems associated with nitrate leaching are to be expected due to the low concentrations in the irrigation water and the low irrigation depths provided to the crops.
Author Contributions
Conceptualization, H.P., B.R.-M. and C.R.; methodology, B.R.-M. and C.R.; software, H.P.; validation, B.R.-M.; formal analysis, H.P., J.M.C.-Z., R.A.-S. and C.R.; investigation, H.P.; resources and data curation, M.M.; writing—original draft preparation, H.P., J.M.C.-Z., R.A.-S. and C.R.; writing—review and editing, H.P., M.M., B.R.-M., J.M.C.-Z., R.S., R.A.-S. and C.R.; supervision, C.R.; project administration, R.S.; funding acquisition, H.P., M.M., J.M.C.-Z. and R.S. All authors have read and agreed to the published version of the manuscript.
Funding
This research was funded by “Project 2019ES06RDEI7346 Improving the use of water and energy in modernized irrigation of fruit trees (GO INNOWATER)”, founded by the Spanish Rural Development Program (2014–2020): EAFRD and MAPA.
Data Availability Statement
The data presented in this study are available on request from the corresponding author. The disaggregated data are not publicly available because they belong to the irrigation community and the cooperative, not to the authors.
Acknowledgments
The authors want to thank Juan Emilio Sanz Vidal for supplying the information about plots and irrigations and the irrigation community and cooperative managers for providing the required permissions to access the data.
Conflicts of Interest
The authors declare no conflict of interest. Additionally, the funders had no role in the design of the study; in the collection, analyses, or interpretation of data; in the writing of the manuscript, or in the decision to publish the results.
References
- Ministerio de Agricultura Pesca y Alimentación. Gestión Sostenible de Regadíos. 2021. Available online: https://www.mapa.gob.es/es/desarrollo-rural/temas/gestion-sostenible-regadios/ (accessed on 27 August 2021).
- García-Mollá, M.; Sanchis-Ibor, C.; Avellà-Reus, L.; Albiac, J.; Isidoro, D.; Lecina, S. Irrigation in the Mediterranean. In Technologies, Institutions and Policies; Molle, F., Sanchis-Ibor, C., Avellà-Reus, L., Eds.; Springer: Cham, Switzerland, 2019; Volume 22, p. 320. [Google Scholar] [CrossRef]
- Sanchis-Ibor, C.; Ortega-Reig, M.; Guillem-García, A.; Carricondo, J.M.; Manzano-Juárez, J.; García-Mollá, M.; Royuela, Á. Irrigation post-modernization. Farmers envisioning irrigation policy in the region of valencia (Spain). Agriculture 2021, 11, 317. [Google Scholar] [CrossRef]
- García, I.F.; Díaz, J.A.R.; Poyato, E.C.; Montesinos, P.; Berbel, J. Effects of modernization and medium term perspectives on water and energy use in irrigation districts. Agric. Syst. 2014, 131, 56–63. [Google Scholar] [CrossRef]
- Berbel, J.; Expósito, A.; Gutiérrez-Martín, C.; Mateos, L. Effects of the Irrigation Modernization in Spain 2002–2015. Water Resour. Manag. 2019, 33, 1835–1849. [Google Scholar] [CrossRef]
- Ministerio de Agricultura Pesca y Alimentación. SIAR. Sistema de Información Agroclimática para el Regadío. Available online: https://eportal.mapa.gob.es/websiar/SeleccionParametrosMap.aspx?dst=1 (accessed on 9 June 2021).
- Instituto Valenciano de Investigaciones Agrarias. Riegos IVIA. 2011. Available online: http://riegos.ivia.es/ (accessed on 25 August 2021).
- Lankford, B.; Closas, A.; Dalton, J.; Gunn, E.L.; Hess, T.; Knox, J.W.; van der Kooij, S.; Lautze, J.; Molden, D.; Orr, S.; et al. A scale-based framework to understand the promises, pitfalls and paradoxes of irrigation efficiency to meet major water challenges. Glob. Environ. Chang. 2020, 65, 102182. [Google Scholar] [CrossRef]
- Benavides, J.; Hernández-Plaza, E.; Mateos, L.; Fereres, E. A global analysis of irrigation scheme water supplies in relation to requirements. Agric. Water Manag. 2021, 243, 106457. [Google Scholar] [CrossRef]
- Malano, H.; Burton, M. Guidelines for Benchmarking Performance in the Irrigation and Drainage Sector; IPTRID Secretariat Food and Agriculture Organization of the United Nations: Rome, Italy, 2001. [Google Scholar]
- Salgado, R.; Mateos, L. Evaluation of different methods of estimating ET for the performance assessment of irrigation schemes. Agric. Water Manag. 2021, 243, 106450. [Google Scholar] [CrossRef]
- Bos, M.G.; Burton, M.A.; Molden, D.J. Irrigation and Drainage Performance Assessment: Practical Guidelines; CABI Publishing: Oxford, UK, 2005. [Google Scholar] [CrossRef] [Green Version]
- Clemmens, A.J.; Molden, D.J. Water uses and productivity of irrigation systems. Irrig. Sci. 2007, 25, 247–261. [Google Scholar] [CrossRef]
- Clemmens, A.J.; Bos, M.G. Statistical methods for irrigation system water delivery performance evaluation. Irrig. Drain. Syst. 1990, 4, 345–365. [Google Scholar] [CrossRef]
- Small, L.E.; Svensen, M. A framework for assessing irrigation performance. Irrig. Drain. Syst. 1990, 4, 283–312. [Google Scholar] [CrossRef] [Green Version]
- Molden, D.J.; Gates, T.K. Performance Measures for Evaluation of Irrigation-Water-Delivery Systems. J. Irrig. Drain. Eng. 1990, 116, 804–823. [Google Scholar] [CrossRef]
- Bos, M.G. Performance indicators for irrigation and drainage. Irrig. Drain. Syst. 1997, 11, 119–137. [Google Scholar] [CrossRef]
- Burt, C.M.; Clemmens, A.J.; Strelkoff, T.S.; Solomon, K.H.; Bliesner, R.D.; Hardy, L.A.; Howell, T.A.; Eisenhauer, D.E. Irrigation Performance Measures: Efficiency and Uniformity. J. Irrig. Drain. Eng. 1997, 123, 423–442. [Google Scholar] [CrossRef] [Green Version]
- Murray-Rust, H.; Snellen, W.B. Irrigation System Performance Assessment and Diagnosi; International Irrigation Management Institute (IIMI): Colombo, Sri Lanka, 1993. [Google Scholar]
- Rath, A.; Swain, P.C. Evaluation of performance of irrigation canals using benchmarking techniques—A case study of Hirakud dam canal system, Odisha, India. ISH J. Hydraul. Eng. 2020, 26, 51–58. [Google Scholar] [CrossRef]
- Terefe, Y.; Singh, P. East-bank canal water delivery performance evaluation: Case study of Finchaa Sugar Estate, Ethiopia. ISH J. Hydraul. Eng. 2020, 1–9. [Google Scholar] [CrossRef]
- Kartal, S.; Değirmenci, H.; Arslan, F. Assessment of irrigation schemes with performance indicators in southeastern irrigation district of Turkey. J. Agric. Sci. 2020, 26, 138–146. [Google Scholar] [CrossRef]
- Nikam, B.R.; Garg, V.; Thakur, P.K.; Aggarwal, S.P. Application of Remote Sensing and GIS in Performance Evaluation of Irrigation Project at Disaggregated Level. J. Indian Soc. Remote Sens. 2020, 48, 979–997. [Google Scholar] [CrossRef]
- Shahrokhnia, M.A.; Olyan-Ghiasi, A. Determination of overall water delivery performance based on adequacy, efficiency, equity and dependability in the Doroodzan irrigation network. Irrig. Drain. 2019, 68, 637–645. [Google Scholar] [CrossRef]
- Jiménez-Bello, M.A.; Alzamora, F.M.; Carles, J.; Campos, A. Dynamic citrus orchards irrigation performance assessment by a surface energy balance method using Landsat imagery. In Proceedings of the EGU General Assembly Conference Abstracts, Vienna, Austria, 8–13 April 2018; Volume 20, p. 14557. [Google Scholar]
- Zema, D.A.; Nicotra, A.; Mateos, L.; Zimbone, S.M. Improvement of the irrigation performance in Water Users Associations integrating data envelopment analysis and multi-regression models. Agric. Water Manag. 2018, 205, 38–49. [Google Scholar] [CrossRef]
- Lamaddalena, N.; Fouial, A. Sensitivity Indicator for Pressurized Irrigation Distribution Systems. Water Resour. Manag. 2019, 33, 1985–1998. [Google Scholar] [CrossRef]
- Abera, A.; Verhoest, N.E.; Tilahun, S.A.; Alamirew, T.; Adgo, E.; Moges, M.M.; Nyssen, J. Performance of small-scale irrigation schemes in Lake Tana Basin of Ethiopia: Technical and socio-political attributes. Phys. Geogr. 2019, 40, 227–251. [Google Scholar] [CrossRef]
- Kassa, E.T.; Ayana, M. Hydraulic Performance Assessment of Mychew Small Scale Irrigation Scheme, North Ethiopia. Int. J. Environ. Clim. Chang. 2019, 9, 549–561. [Google Scholar] [CrossRef]
- Bettili, L.; Pek, E.; Salman, M. A decision support system for water resources management: The case study of Mubuku irrigation scheme, Uganda. Sustainability 2019, 11, 6260. [Google Scholar] [CrossRef] [Green Version]
- Zema, D.A.; Filianoti, P.; D’Agostino, D.; Labate, A.; Lucas-Borja, M.E.; Nicotra, A.; Zimbone, S.M. Analyzing the Performances of Water User Associations to Increase the Irrigation Sustainability: An Application of Multivariate Statistics to a Case Study in Italy. Sustainability 2020, 12, 6327. [Google Scholar] [CrossRef]
- Rocamora, C.; Vera, J.; Abadía, R. Strategy for Efficient Energy Management to solve energy problems in modernized irrigation: Analysis of the Spanish case. Irrig. Sci. 2013, 31, 1139–1158. [Google Scholar] [CrossRef]
- Abadia, R.; Rocamora, C.; Ruiz, A.; Puerto, H. Energy efficiency in irrigation distribution networks I: Theory. Biosyst. Eng. 2008, 101, 21–27. [Google Scholar] [CrossRef]
- Abadia, R.; Rocamora, M.C.; Corcoles, J.I.; Ruiz-Canales, A.; Martinez-Romero, A.; Moreno, M.A. Comparative analysis of energy efficiency in water users associations. Span. J. Agric. Res. 2010, 8, 134–142. [Google Scholar] [CrossRef] [Green Version]
- Abadía, R.; Vera, J.; Rocamora, C.; Puerto, H. Generalisation of supply energy efficiency in irrigation distribution networks. Biosyst. Eng. 2018, 175, 146–155. [Google Scholar] [CrossRef]
- Córcoles, J.I.; de Juan, J.A.; Ortega, J.F.; Tarjuelo, J.M.; Moreno, M.A. Management evaluation of Water Users Associations using benchmarking techniques. Agric. Water Manag. 2010, 98, 1–11. [Google Scholar] [CrossRef]
- Dechmi, F.; Playán, E.; Faci, J.M.; Tejero, M. Analysis of an irrigation district in northeastern Spain I. Characterisation and water use assessment. Agric. Water Manag. 2003, 61, 75–92. [Google Scholar] [CrossRef] [Green Version]
- Lorite, I.; Mateos, L.; Fereres, E. Evaluating irrigation performance in a Mediterranean environment: I. Model and general assessment of an irrigation scheme. Irrig. Sci. 2004, 23, 77–84. [Google Scholar] [CrossRef]
- Lorite, I.; Mateos, L.; Fereres, E. Evaluating irrigation performance in a Mediterranean environment: II. Variablility among crops and farmers. Irrig. Sci. 2004, 23, 85–92. [Google Scholar] [CrossRef]
- Sánchez, J.A.; Reca, J.; Martínez, J. Irrigation Water Management in a Mediterranean Greenhouse District: Irrigation Adequacy Assessment. Irrig. Drain. 2015, 64, 299–313. [Google Scholar] [CrossRef]
- Sánchez, J.A.; Reca, J.; Martínez, J. Water Productivity in a Mediterranean Semi-Arid Greenhouse District. Water Resour. Manag. 2015, 29, 5395–5411. [Google Scholar] [CrossRef] [Green Version]
- Díaz, J.A.R.; Poyato, E.C.; Luque, R.L. Applying benchmarking and data envelopment analysis (DEA) techniques to irrigation districts in Spain. Irrig. Drain. 2004, 53, 135–143. [Google Scholar] [CrossRef]
- Parra, L.; Botella-Campos, M.; Puerto, H.; Roig-Merino, B.; Lloret, J. Evaluating irrigation efficiency with performance indicators: A case study of citrus in the east of spain. Agronomy 2020, 10, 1359. [Google Scholar] [CrossRef]
- Poveda-Bautista, R.; Roig-Merino, B.; Puerto, H.; Buitrago-Vera, J. Assessment of Irrigation Water Use Efficiency in Citrus Orchards Using AHP. Int. J. Environ. Res. Public Health 2021, 18, 5667. [Google Scholar] [CrossRef]
- Atlas Climático. Available online: http://agroclimap.aemet.es/# (accessed on 7 June 2021).
- Ministerio de Agricultura Pesca y Alimentación. Subsecretaría de Agricultura Pesca y Alimentación. Encuesta sobre Superficies y Rendimientos Cultivos. Resultados Nacionales y Autonómicos. 2020. Available online: https://cpage.mpr.gob.es (accessed on 28 May 2021).
- Bos, M.G.; Murray-Rust, D.H.; Merrey, D.J.; Johnson, H.G.; Snellen, W.B. Methodologies for assessing performance of irrigation and drainage management. Irrig. Drain. Syst. 1994, 7, 231–261. [Google Scholar] [CrossRef]
- Pomares, F.; Gris, V. Fertlización en el Cultivo del Caqui: Necesidades Nutricionales; Agricola Vergel: Valencia, Spain, 2014; pp. 100–104. [Google Scholar]
- Intrigliolo, D.S.; de Paz, J.; Bonet, L.; Ballester, C. Cuantificación de la respuesta del caqui al riego y fertilización para el establecimiento de pautas de manejo eficientes y sostenibles. Phytoma España 2017, 286, 46–51. [Google Scholar]
- Allen, R.G.; Pruitt, W.O.; Raes, D.; Smith, M.; Pereira, L.S. Crop Evapotranspiration. Guidelines for Computing Crop Water Requirements; Irrigation and Drainage Paper No. 56; FAO: Rome, Italy, 1998. [Google Scholar]
- Smith, M.; Muñoz, G.; van Halsema, G.; Maraux, F.; Izzi, G.; Wahaj, R. CropWat 8.0. Cropwat 8.0. Land & Water|Food and Agriculture Organization of the United Nations; Food and Agriculture Organization of the United Nations: Rome, Italy, 2019. [Google Scholar]
- Intrigliolo, D.S.; Visconti, F.; Bonet, L.; Parra, M.; Besada, C.; Abrisqueta, I.; Rubio, J.S.; de Paz, J.M. Persimmon (Diospyros kaki) trees responses to restrictions in water amount and quality. In Water Scarcity and Sustainable Agriculture in Semiarid Environment; Academic Press: Cambridge, MA, USA, 2018; pp. 149–177. [Google Scholar]
- Fereres, E.; Goldhammer, D.A. Deciduous fruit and nut trees. In Irrigation of Agricultural Crops Monograph 30; Stewart, B.A., Nielsen, D.R., Eds.; ASA: Madison, WI, USA, 1990; pp. 987–1017. [Google Scholar]
- Andreu, L.; Hopmans, J.W.; Schwankl, L.J. Spatial and temporal distribution of soil water balance for a drip-irrigated almond tree. Agric. Water Manag. 1997, 35, 123–146. [Google Scholar] [CrossRef]
- Abrisqueta, J.M.; Mounzer, O.; Álvarez, S.; Conejero, W.; García-Orellana, Y.; Tapia, L.M.; Vera, J.; Abrisqueta, I.; Ruiz-Sánchez, M.C. Root dynamics of peach trees submitted to partial rootzone drying and continuous deficit irrigation. Agric. Water Manag. 2008, 95, 959–967. [Google Scholar] [CrossRef]
- Rincón, L. La práctica de la fertirrigación en el cultivo del melocotonero. In Vida Rural; EUMEDIA, S.A.: Madrid, Spain, 2010; pp. 68–72. [Google Scholar]
- R Core Team. R: A Language and Environment for Statistical Computing. R Foundation for Statistical Computing. Vienna, Austria. 2020. Available online: https://www.R-project.org/ (accessed on 15 July 2021).
- Rs. Team. RStudio: Integrated Development for R; RStudio, Inc.: Boston, MA, USA, 2019; Available online: https://www.rstudio.com/ (accessed on 15 July 2021).
- Paço, T.A.; Ferreira, M.I.; Conceiçã, N. Peach orchard evapotranspiration in a sandy soil: Comparison between eddy covariance measurements and estimates by the FAO 56 approach. Agric. Water Manag. 2006, 85, 305–3013. [Google Scholar] [CrossRef] [Green Version]
- Mateos, L.; González-Dugo, M.P.; Testi, L.; Villalobos, J.F. Monitoring evapotranspiration of irrigated crops using crop coefficients derived from time series of satellite images. I. Method validation. Agric. Water Manag. 2013, 125, 81–91. [Google Scholar] [CrossRef]
- Badal, E.; El-Mageed, T.A.A.; Buesa, I.; Guerra, D.; Bonet, L.; Intrigliolo, D.S. Moderate plant water stress reduces fruit drop of ‘Rojo Brillante’ persimmon (Diospyros kaki) in a Mediterranean climate. Agric. Water Manag. 2013, 119, 154–160. [Google Scholar] [CrossRef]
Publisher’s Note: MDPI stays neutral with regard to jurisdictional claims in published maps and institutional affiliations. |
© 2021 by the authors. Licensee MDPI, Basel, Switzerland. This article is an open access article distributed under the terms and conditions of the Creative Commons Attribution (CC BY) license (https://creativecommons.org/licenses/by/4.0/).