Abstract
A Wulff figure—the polar graph of the surface tension of a crystal—with a discontinuity was calculated by applying the density matrix renormalization group method to the p-RSOS model, a restricted solid-on-solid model with a point-contact-type step–step attraction. In the step droplet zone in this model, the surface tension is discontinuous around the (111) surface and continuous around the (001) surface. The vicinal surface of 4H-SiC crystal in a Si–Cr–C solution is thought to be in the step droplet zone. The dependence of the vicinal surface growth rate and the macrostep size on the driving force for a typical state in the step droplet zone in non-equilibrium steady state was calculated using the Monte Carlo method. In contrast to the known step bunching phenomenon, the size of the macrostep was found to decrease with increasing driving force. The detachment of elementary steps from a macrostep was investigated, and it was found that satisfies a scaling function. Moreover, kinetic roughening was observed for , where is the crossover driving force above which the macrostep disappears.
Keywords:
Monte Carlo simulation; crystal growth; surface and interface; density matrix renormalization group calculation; surface tension; kinetic roughening; surface free energy; step–step attraction PACS:
81.10.Aj; 68.35.Ct; 05.70.Np; 68.35.Md
1. Introduction
The faceted macrosteps on a crystal surface are known to degrade the grown crystal [1]. Although studies have investigated methods of dispersing faceted macrosteps, an effective method has not yet been established. For example, in the case of solution growth for 4H-SiC, the faceted macrosteps remain near equilibrium. This formation of faceted macrosteps near equilibrium has been considered to be due to the effects of anomalous surface tension. To control the dynamics of macrosteps, the fundamentals of the phenomena with macrosteps must be clarified.
The connection between the surface tension and the instability with respect to macrostep formation is also scientifically interesting. In 1963, Cabrera and Coleman [2] phenomenologically studied anomalous surface tension and studied its effect on a vicinal surface near equilibrium. They assumed several anomalous surface tensions, and then discussed the possible equilibrium crystal shapes (ECSs). They also declared the instability with respect to the macrostep formation to be the result of anomalous surface tension [3]. However, at that time, the microscopic model used to determine the anomalous surface tension was not provided.
Jayaprakash et al. [4] studied the faceting transition of the ECS using a terrace–step–kink (TSK) model with the long-range step–step interaction expressed by the equation [5,6,7], where is the coupling constant of the elastic repulsion, is the location of the ith step on a vicinal surface normal to the mean running direction of steps, and is the location along the steps. They showed that the step–step interaction affects the coefficient of the term in the surface free energy, which is given by
where ρ is the step density, γ is the step tension, and B is step interaction coefficient. This ρ-expanded form of the free energy excluding the quadratic term with respect to ρ is called the Gruber–Mullins–Pokrovsky–Talapov (GMPT) [8,9,10,11] universal form. It is well known that the ECS can be obtained using the Landau–Andreev method [12,13] or from the polar graph of the surface tension using the Wulff theorem [14,15,16,17]. When the long-range step–step interaction is attractive, B becomes negative at low temperatures, and the slope of the surface on the ECS has a jump at the facet edge. This jump in the surface slope is referred to as a first-order shape transition [4,18] after the fashion of a phase transition.
The step bunching for Si near equilibrium in ultrahigh vacuum has been studied for Si(111) [19,20,21,22,23,24] and Si(113) [25,26,27,28]. Williams et al. [19,20] have experimentally demonstrated that the step bunching of Si(111) is caused by the competition between the polymorphic surface free energies for the Si(111) (1 × 1) and (7 × 7) structures based on the GMPT surface free energy (Equation (1)). Additionally, Song et al. obtained the temperature–slope phase diagram for the step bunching on Si(113) by analyzing the results of X-ray diffraction, and have reported that an anomalous surface free energy caused by a step–step attraction may explain the step bunching phenomenon. Lössig [29] and Bhattacharjee [30] have stated that the TSK model with a short-range step–step attraction and with the long-range step–step repulsion can represent the step bunching phenomenon. By analyzing the scanning tunneling microscopy results on a vicinal surface of Si(113) tilted toward the direction, van Dijken et al. [27] demonstrated that there is a step–step attraction to condense steps and a large long-range step–step repulsion. Shenoy et al. [31,32] have shown that the TSK model with a short-range step–step attraction and with the long-range step–step repulsion causes the periodic array of the n-merged steps using a renormalization group method. Einstein et al. [33] introduced the idea of the random matrix to the terrace width distribution to assist in the determination of the strength of the long-range step–step repulsion.
Step bunching or step faceting near equilibrium occurs without long-range step–step repulsion [18,34,35,36,37,38,39,40,41,42,43,44,45]. Rottman and Wortis [18] studied an ECS using a three-dimensional ferromagnetic Ising model with both nearest-neighbor (NN) and next-nearest-neighbor (NNN) interactions. They calculated ECS using mean-field theory. When the NNN interaction is negative, they showed that the ECS has the first-order shape transition at the (001) facet edge at low temperatures. Using a lattice model with a point-contact-type step–step attraction [38,39,40,41,42,43,44,45], Akutsu showed that a faceted macrostep self-assembles at equilibrium in association with the morphological change resulting from the discontinuous surface tension. The lattice model was a restricted solid-on-solid (RSOS) model with point-contact-type step–step attraction (p-RSOS model, Figure 1). The term “restricted” means that the height difference between NN sites is restricted to . It was considered that the origin of the point-contact-type step–step attraction is the orbital overlap of the dangling bonds at the meeting point of the neighboring steps. The energy gained by forming the bonding state is regarded as the attractive energy between steps. The surface tension of the model was numerically calculated using the density matrix renormalization group (DMRG) method [46,47,48,49,50,51], and it was demonstrated that the surface tension of the vicinal surface tilted toward the direction is discontinuous at low temperatures because of the point-contact-type step–step attraction.
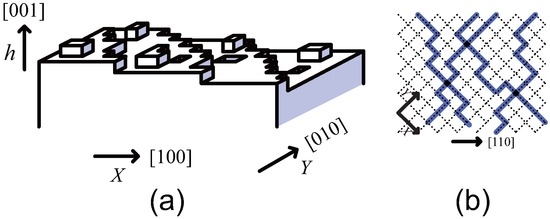
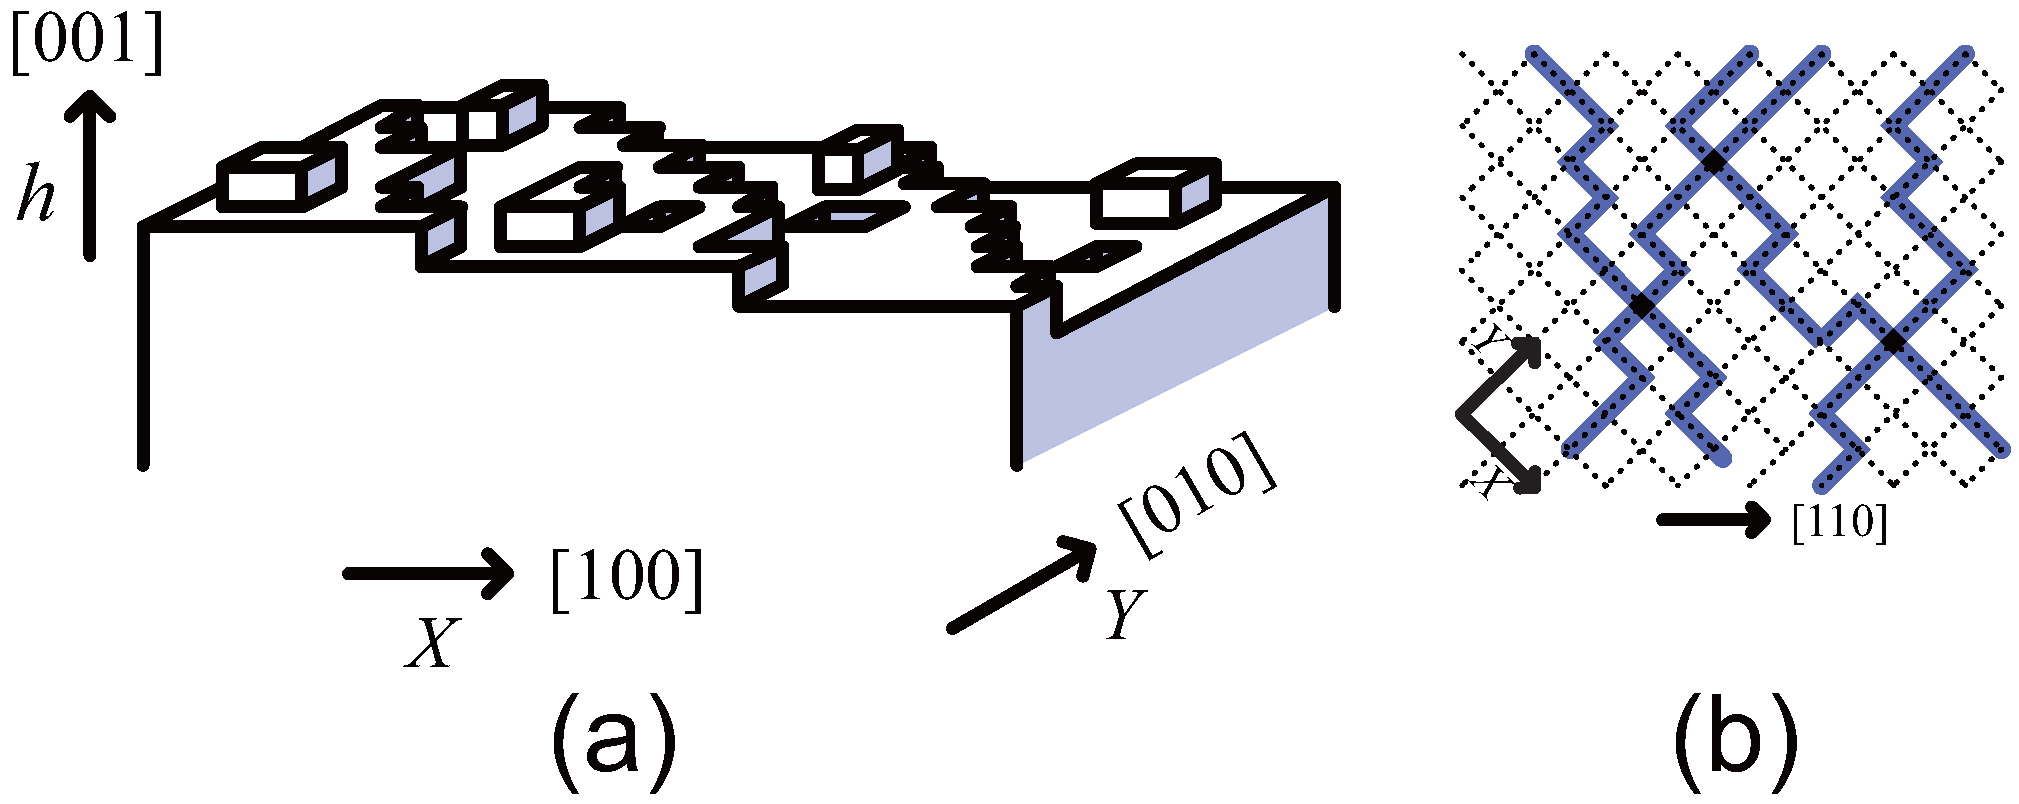
Figure 1.
(a) Perspective view of the restricted solid-on-solid (RSOS) model tilted toward the direction; (b) Top-down view of the RSOS model. Thick blue lines represent surface steps. This figure was reproduced from Akutsu [45].
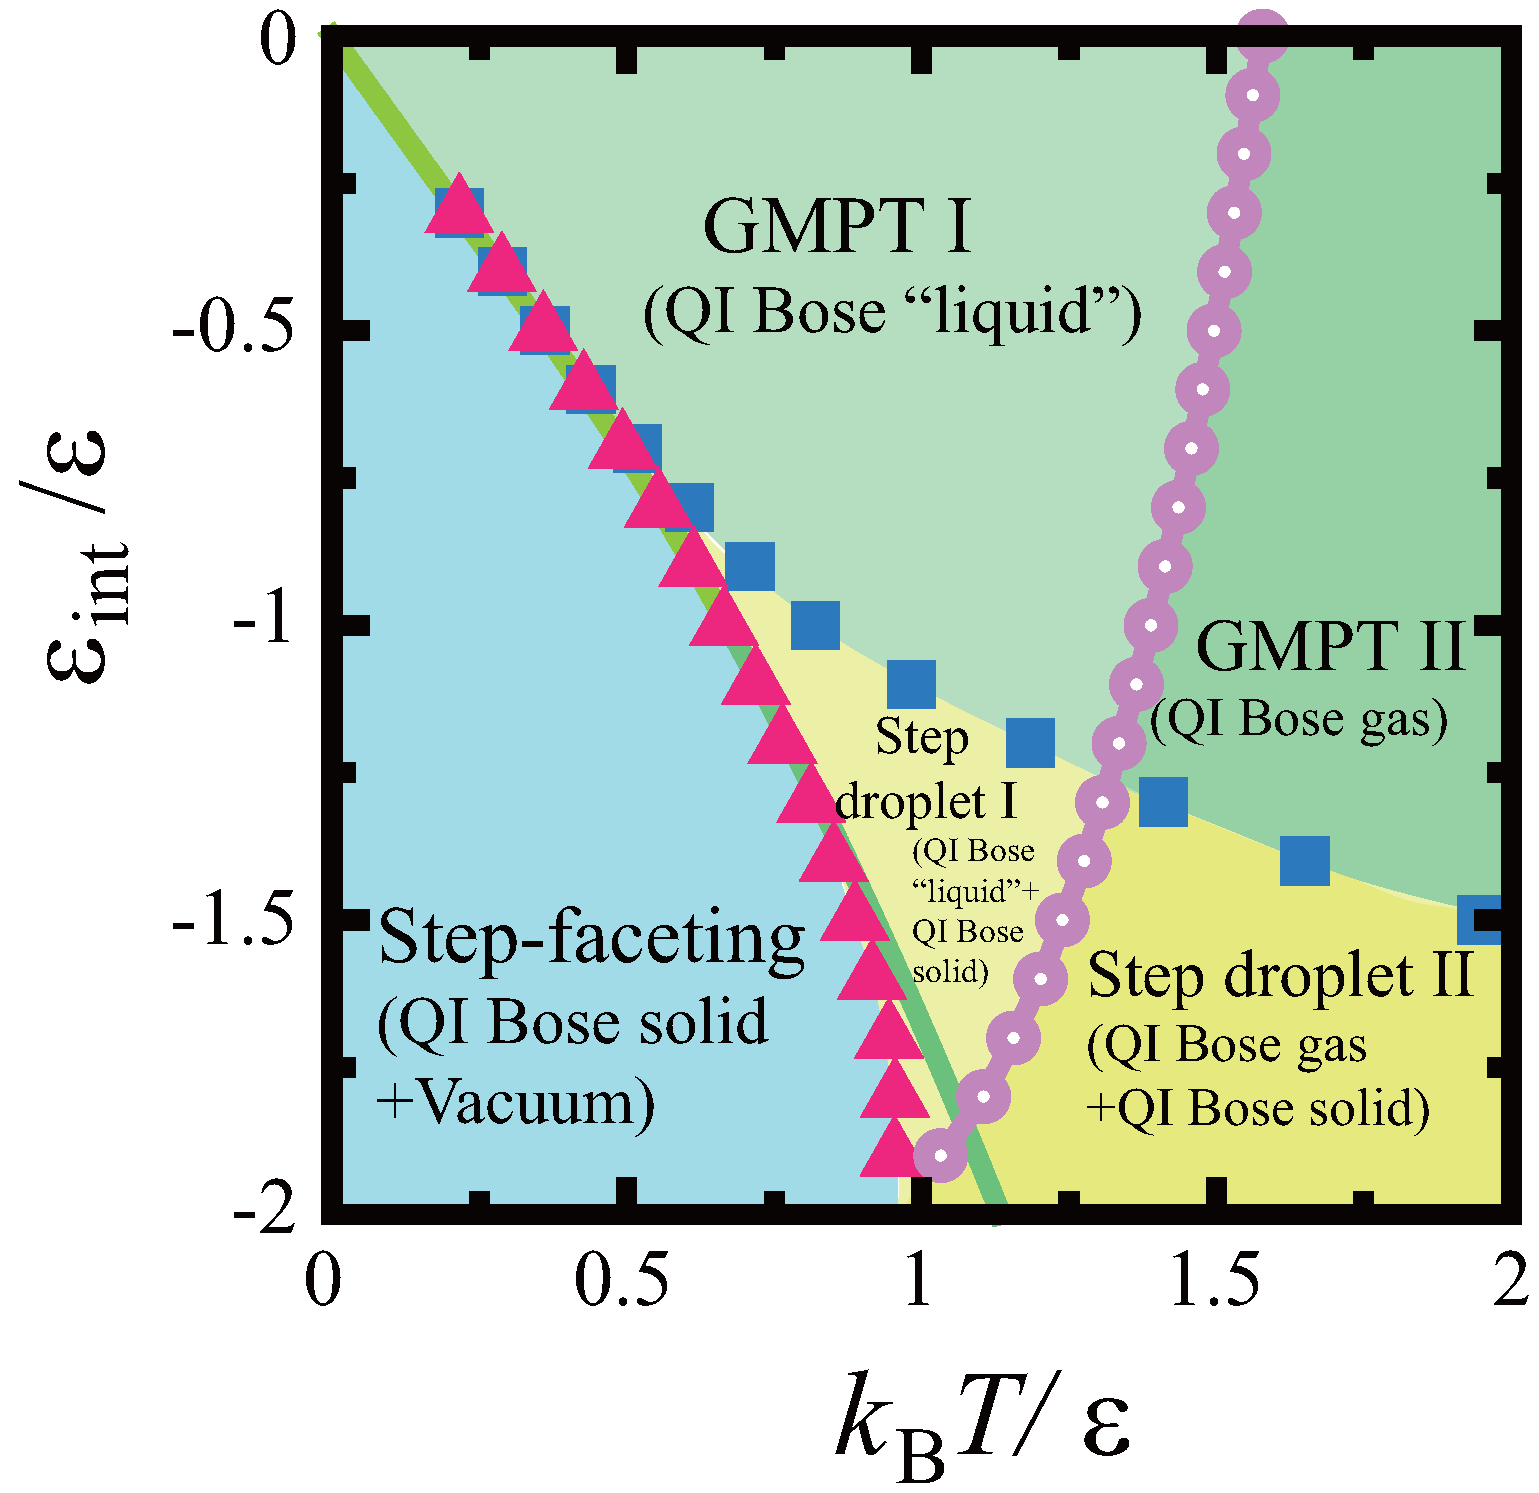
This connectivity of the surface tension for the p-RSOS model is directly linked to the faceting diagram (Figure 2). There are two transition temperatures in the p-RSOS model— and . At temperatures of , the surface tension around the (111) surface is discontinuous; for , the surface tension around the (001) surface is discontinuous. Based on the connectivity of the surface tension, the temperature region is called the step-faceting zone, the region is called the step droplet zone, and the region is called the GMPT [8,9] zone. Moreover, the plot of the roughening transition temperature of the (001) surface divides the step droplet and GMPT zones into step droplet zones I and II and GMPT zones I and II, respectively [43,44].
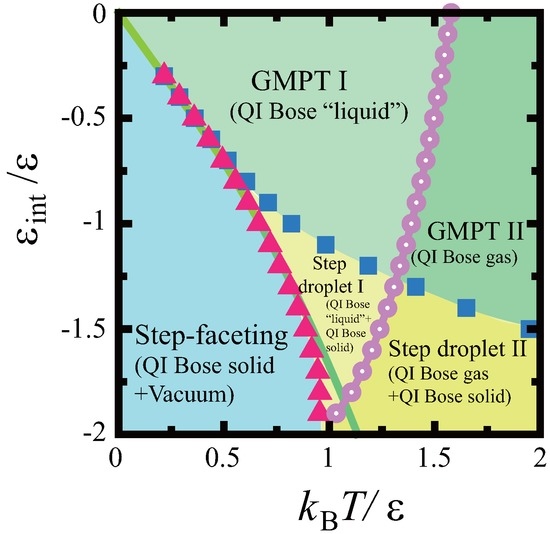
Figure 2.
Faceting diagram of the p-RSOS model (RSOS model with point-contact-type step–step attraction) for a vicinal surface obtained using the density matrix renormalization group (DMRG) method. Squares: calculated values of . Triangles: calculated values of . Open circles: calculated roughening transition temperatures of the (001) surface. Solid line: zone boundary line calculated using the two-dimensional Ising model. For the definitions of and details about the QI Bose solid, liquid, and gas, please refer to Akutsu [43]. This figure was reproduced from Akutsu [43]. GMPT: Gruber–Mullins–Pokrovsky–Talapov.
In our previous study [45], the height profile of a faceted macrostep at equilibrium was investigated on the p-RSOS model, and it was demonstrated that the characteristics of the height profile of a macrostep can be classified by the connectivity of the surface tension. The characteristics of the height profile of a macrostep are irrelevant to the details of the crystal structure. Hence, the height profile of a macrostep can be used to determine in which zone the surface exists. For example, the height profile of the macrostep in the case of 4H-SiC [1] is similar to the profile in the step droplet zone [45]. This suggests that the surface tension of 4H-SiC around the faceted side surface is discontinuous.
In the present work, under a driving force , the disassembly of the faceted macrostep in the step droplet zone to form a kinetically roughened homogeneous surface (Figure 3) in non-equilibrium steady state was studied using the Monte Carlo method on the p-RSOS model. Step droplet zone I was the focus of this study; the step-faceting zone will be studied in future work. To focus on the dynamics affected by the surface tension, surface diffusion [52,53,54,55], elastic effects [5,6,7,20,21], and polymorphic effects [19,20,28] were excluded.
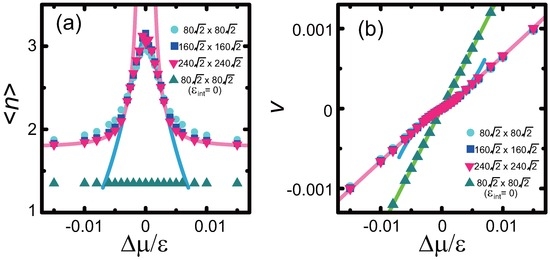
Figure 3.
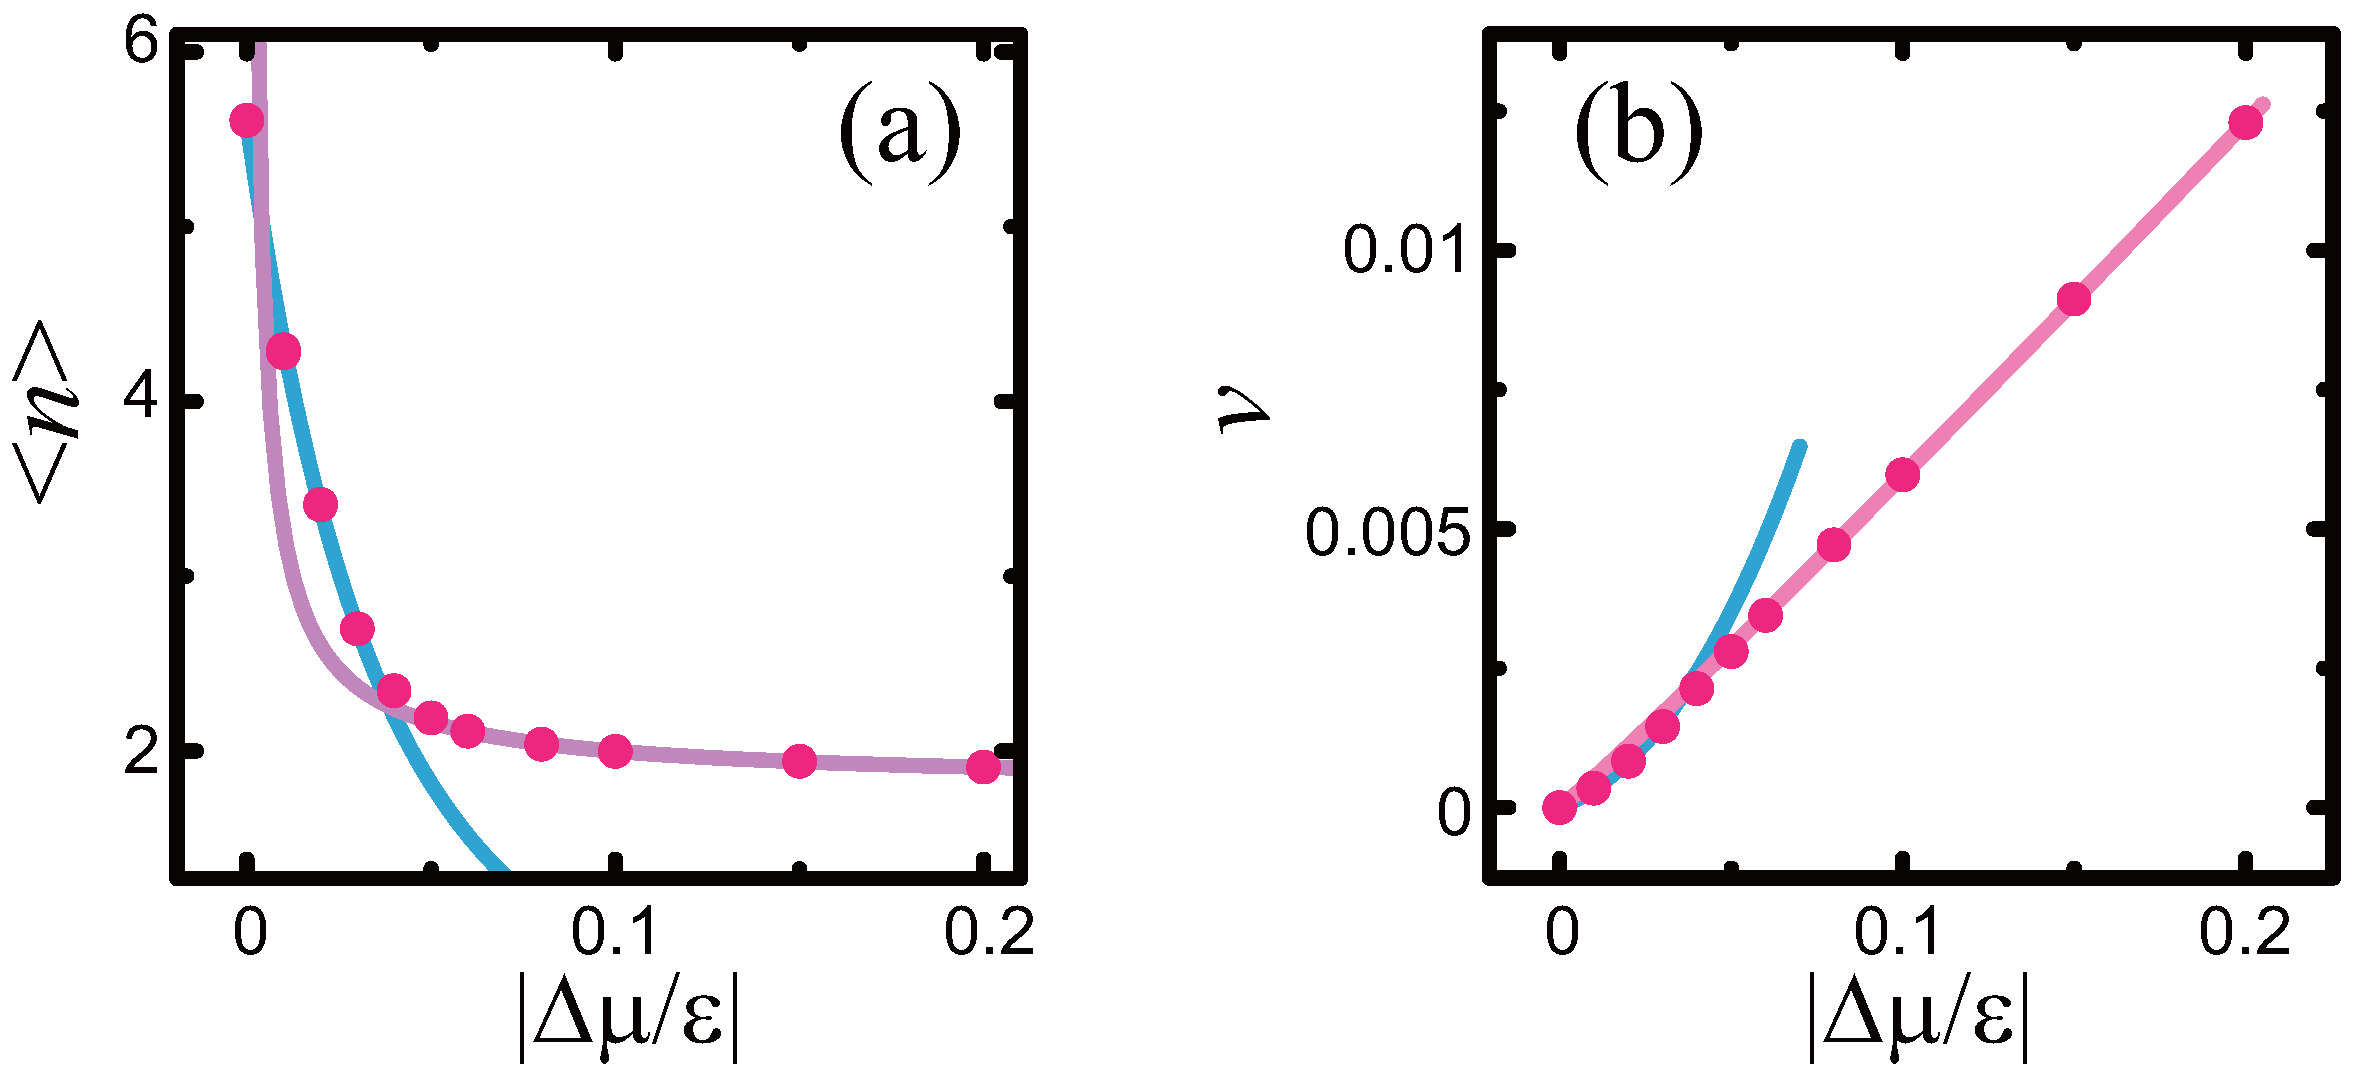
(a) Macrostep size. Blue line: with . Pink lines: ; (b) Vicinal surface growth rate. Pink line: , where , 0, and for , , and , respectively. Blue line: with . Green line: . and (step droplet zone I). The plotted values were obtained as averages over Monte Carlo steps per site (MCS/site).
This paper is organized as follows. In §2, the model and the discontinuous surface tension are briefly explained. In §3, the results obtained using the Monte Carlo method are presented. The process of detaching the steps from a macrostep is discussed in §4 through the analysis of the results in the case of small . In §5, the case of large is considered; for this case, the size of a macrostep is modeled using a scaling function, and a crossover point associated with kinetic roughening is introduced. The implications of the results are discussed in §6, and §7 concludes the paper.
2. Restricted Solid-on-Solid Model with Point-Contact-Type Step–Step Attraction
2.1. Restricted Solid-on-Solid Model with Point-Contact-Type Step–Step Attraction
The microscopic model considered in this study is the p-RSOS model (Figure 1). The Hamiltonian of the (001) surface can be written as
where is the total number of lattice points, is the surface energy per unit cell on the planar (001) surface, ϵ is the microscopic step energy, is the Kronecker delta, and is the microscopic step–step interaction energy. The summation with respect to is taken over all sites on the square lattice. The RSOS condition is required implicitly. When is negative, the step–step interaction becomes attractive (sticky steps).
It should be noted that the p-RSOS model (Equation (2)) automatically includes the “entropic step–step repulsion”. Since the p-RSOS model is an RSOS model, the overhang structures with respect to the height of the surface are inhibited by the geometrical restriction. This is the microscopic origin of the entropic step–step repulsion.
2.2. Discontinuous Surface Tension
The polar graphs of the surface tension and the surface free energy were calculated using the DMRG method [46,47,48,49,50,51], and are shown in Figure 4. In low-dimensional cases, more precision is required than can be provided by a mean field calculation of the partition function [56]. Hence, to obtain reliable results, the DMRG method—which was developed for one-dimensional (1D) quantum spin systems [46]—was adopted. The transfer matrix version of the DMRG method—known as the product wave function renormalization group (PWFRG) method [49,50,51]—was used in this study. Details of the calculation method for the surface tension and the surface free energy are given in Appendix A. In Figure 4, the angle θ is the tilt angle from the (001) surface toward the direction. The surface gradient p is related to θ as . The surface tension was calculated from the surface free energy as

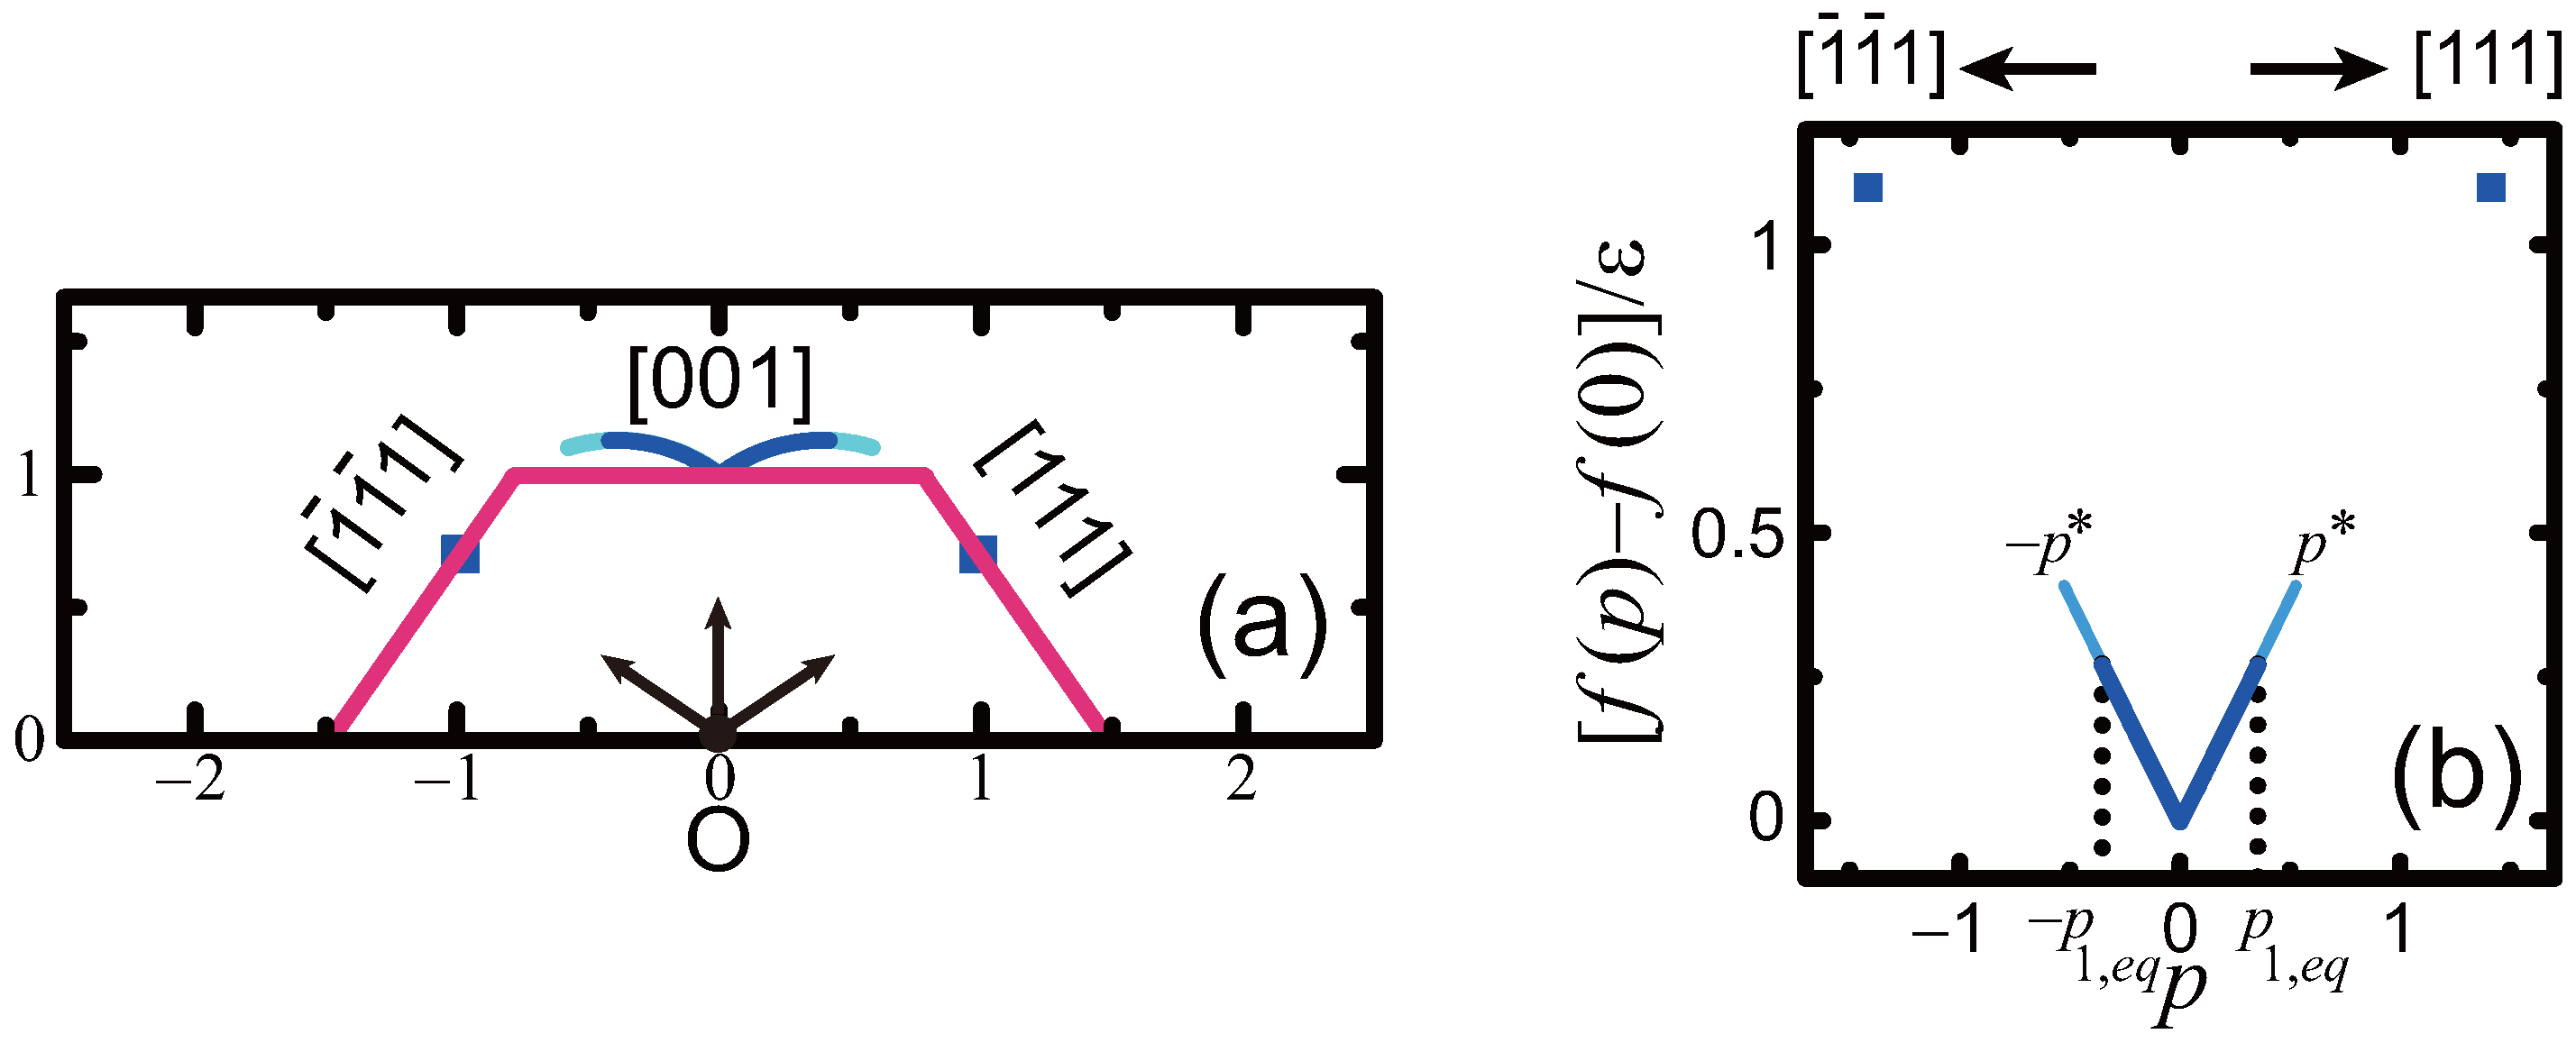
Figure 4.
(a) Polar graph of the surface tension (Wulff figure) and Andreev free energy (equilibrium crystal shape, ECS) calculated using the DMRG method. This figure was reproduced from Akutsu [45]; (b) Surface free energy. , (step droplet zone I). Red lines: calculated using the DMRG method. Blue lines and squares: polar plots of (a) the surface tension (), where θ is the tilt angle of the vicinal surface from the (001) surface toward the direction; and (b) the surface free energy. Pale blue lines: values for the metastable surfaces for (a) the surface tension; and (b) the surface free energy. End points of the pale blue lines ( and ): approximate spinodal points. Point O: Wulff point. was assumed to equal ϵ. An enlarged figure of the ECS near the facet edges is shown in Appendix A.
The calculated surface tension and the surface free energy at and are shown in Figure 4.
The surface tension contains discontinuities near the (001) and (111) surfaces in the case of , , and . At , the surface is in the step droplet zone (Figure 2), where the surface tension is continuous around the (001) surface but discontinuous around the (111) surface.
The ECS calculated using the DMRG method (Appendix A) is plotted in red in Figure 4a. This ECS result agrees well with the ECS obtained using the Wulff theorem [14,15,16,17]. In step droplet zone I, the (001) surface meets the curved area without a discontinuity in its slope point P in Figure A1) (The Gauss curvature, which is the determinant of the curvature tensor, jumps at the facet edge of the (001) surface), whereas the (111) surfaces meet the curved areas with a discontinuity in their slopes (point Q in Figure A1).
At the zone boundary lines in Figure 2, the following conditions are satisfied [40,43]:
where is the surface gradient on the vicinal surface near the (111) surface, is the surface free energy of the vicinal surface near the (111) surface, is the step tension of an n-merged (negative) step [43], and and are coefficients. In GMPT zones I and II, since , the surface free energy has a form similar to Equation (1). As the temperature decreases, decreases and increases. For , where the vicinal surface exists in the step droplet zone, becomes negative and the first-order transition occurs. Hence, the upper zone boundary line of is a critical curve.
The key points to obtain Equations (4) and (5) are the meeting of neighboring steps and the inhomogeneity of the vicinal surface [40,43]. For the vicinal surface tilting toward the direction, two neighboring steps can occupy one site at the same time, and no more than three steps can occupy one site at a time because of the geometrical restrictions of the RSOS model. Hence, the surface cannot be mapped to a 1D fermion model [57,58,59]. The double occupancy of a site gives rise to the point-contact-type step–step interaction. When the interaction is repulsive, the term is present [43,60,61], whereas in the case of attractive interaction, the vicinal surface becomes inhomogeneous and can be expressed as a mixture of the various n-merged steps (macrosteps) [40]. Since the population of the n-merged steps depends on the surface slope, is affected by the point-contact-type step–step attraction through the slope dependence of the size of the macrosteps.
3. Monte Carlo Results
3.1. Monte Carlo Method
To study the non-equilibrium steady state with macrosteps, the vicinal surface of the following Hamiltonian with a fixed number of steps was investigated using the Monte Carlo method with the Metropolis algorithm:
where is the driving force, is the chemical potential of the bulk crystal, and is the chemical potential of the ambient phase. The explicit form of is given in Markov [62]. When , the crystal grows because its chemical potential is lower than that of the ambient phase, whereas when , the crystal recedes (evaporate, dissociates, or melts).
The explicit procedure of the application of the Monte Carlo method in this study is as follows. At the initial time, the steps are positioned at equal distances. Then, the lattice site to be updated is randomly selected. The surface structure is updated non-conservatively using the Monte Carlo method with the Metropolis algorithm. With the RSOS restriction taken into consideration, the structure is updated with probability 1 when and with probability when , where , is the energy of the present configuration and is the energy of the updated configuration. The energy is calculated from the Hamiltonian (Equation (6)). A periodic boundary condition was imposed in the direction parallel to the steps. In the direction normal to the steps, the lowest side of the structure was connected to the uppermost side by adding a height with a number of steps.
Snapshots of the simulated surfaces after Monte Carlo steps per site (MCS/site) are shown in Figure 5. The height profiles of the surfaces for the cross section along the bottom of the top-down views are also shown as side views.
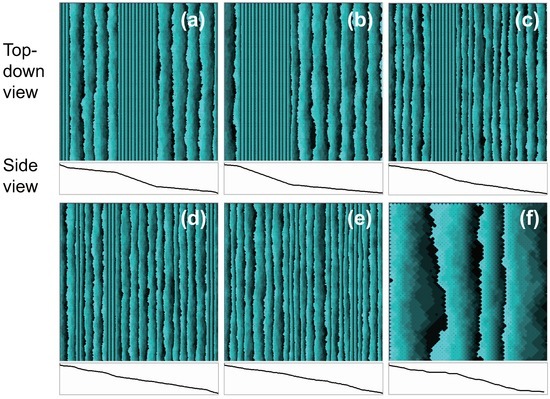
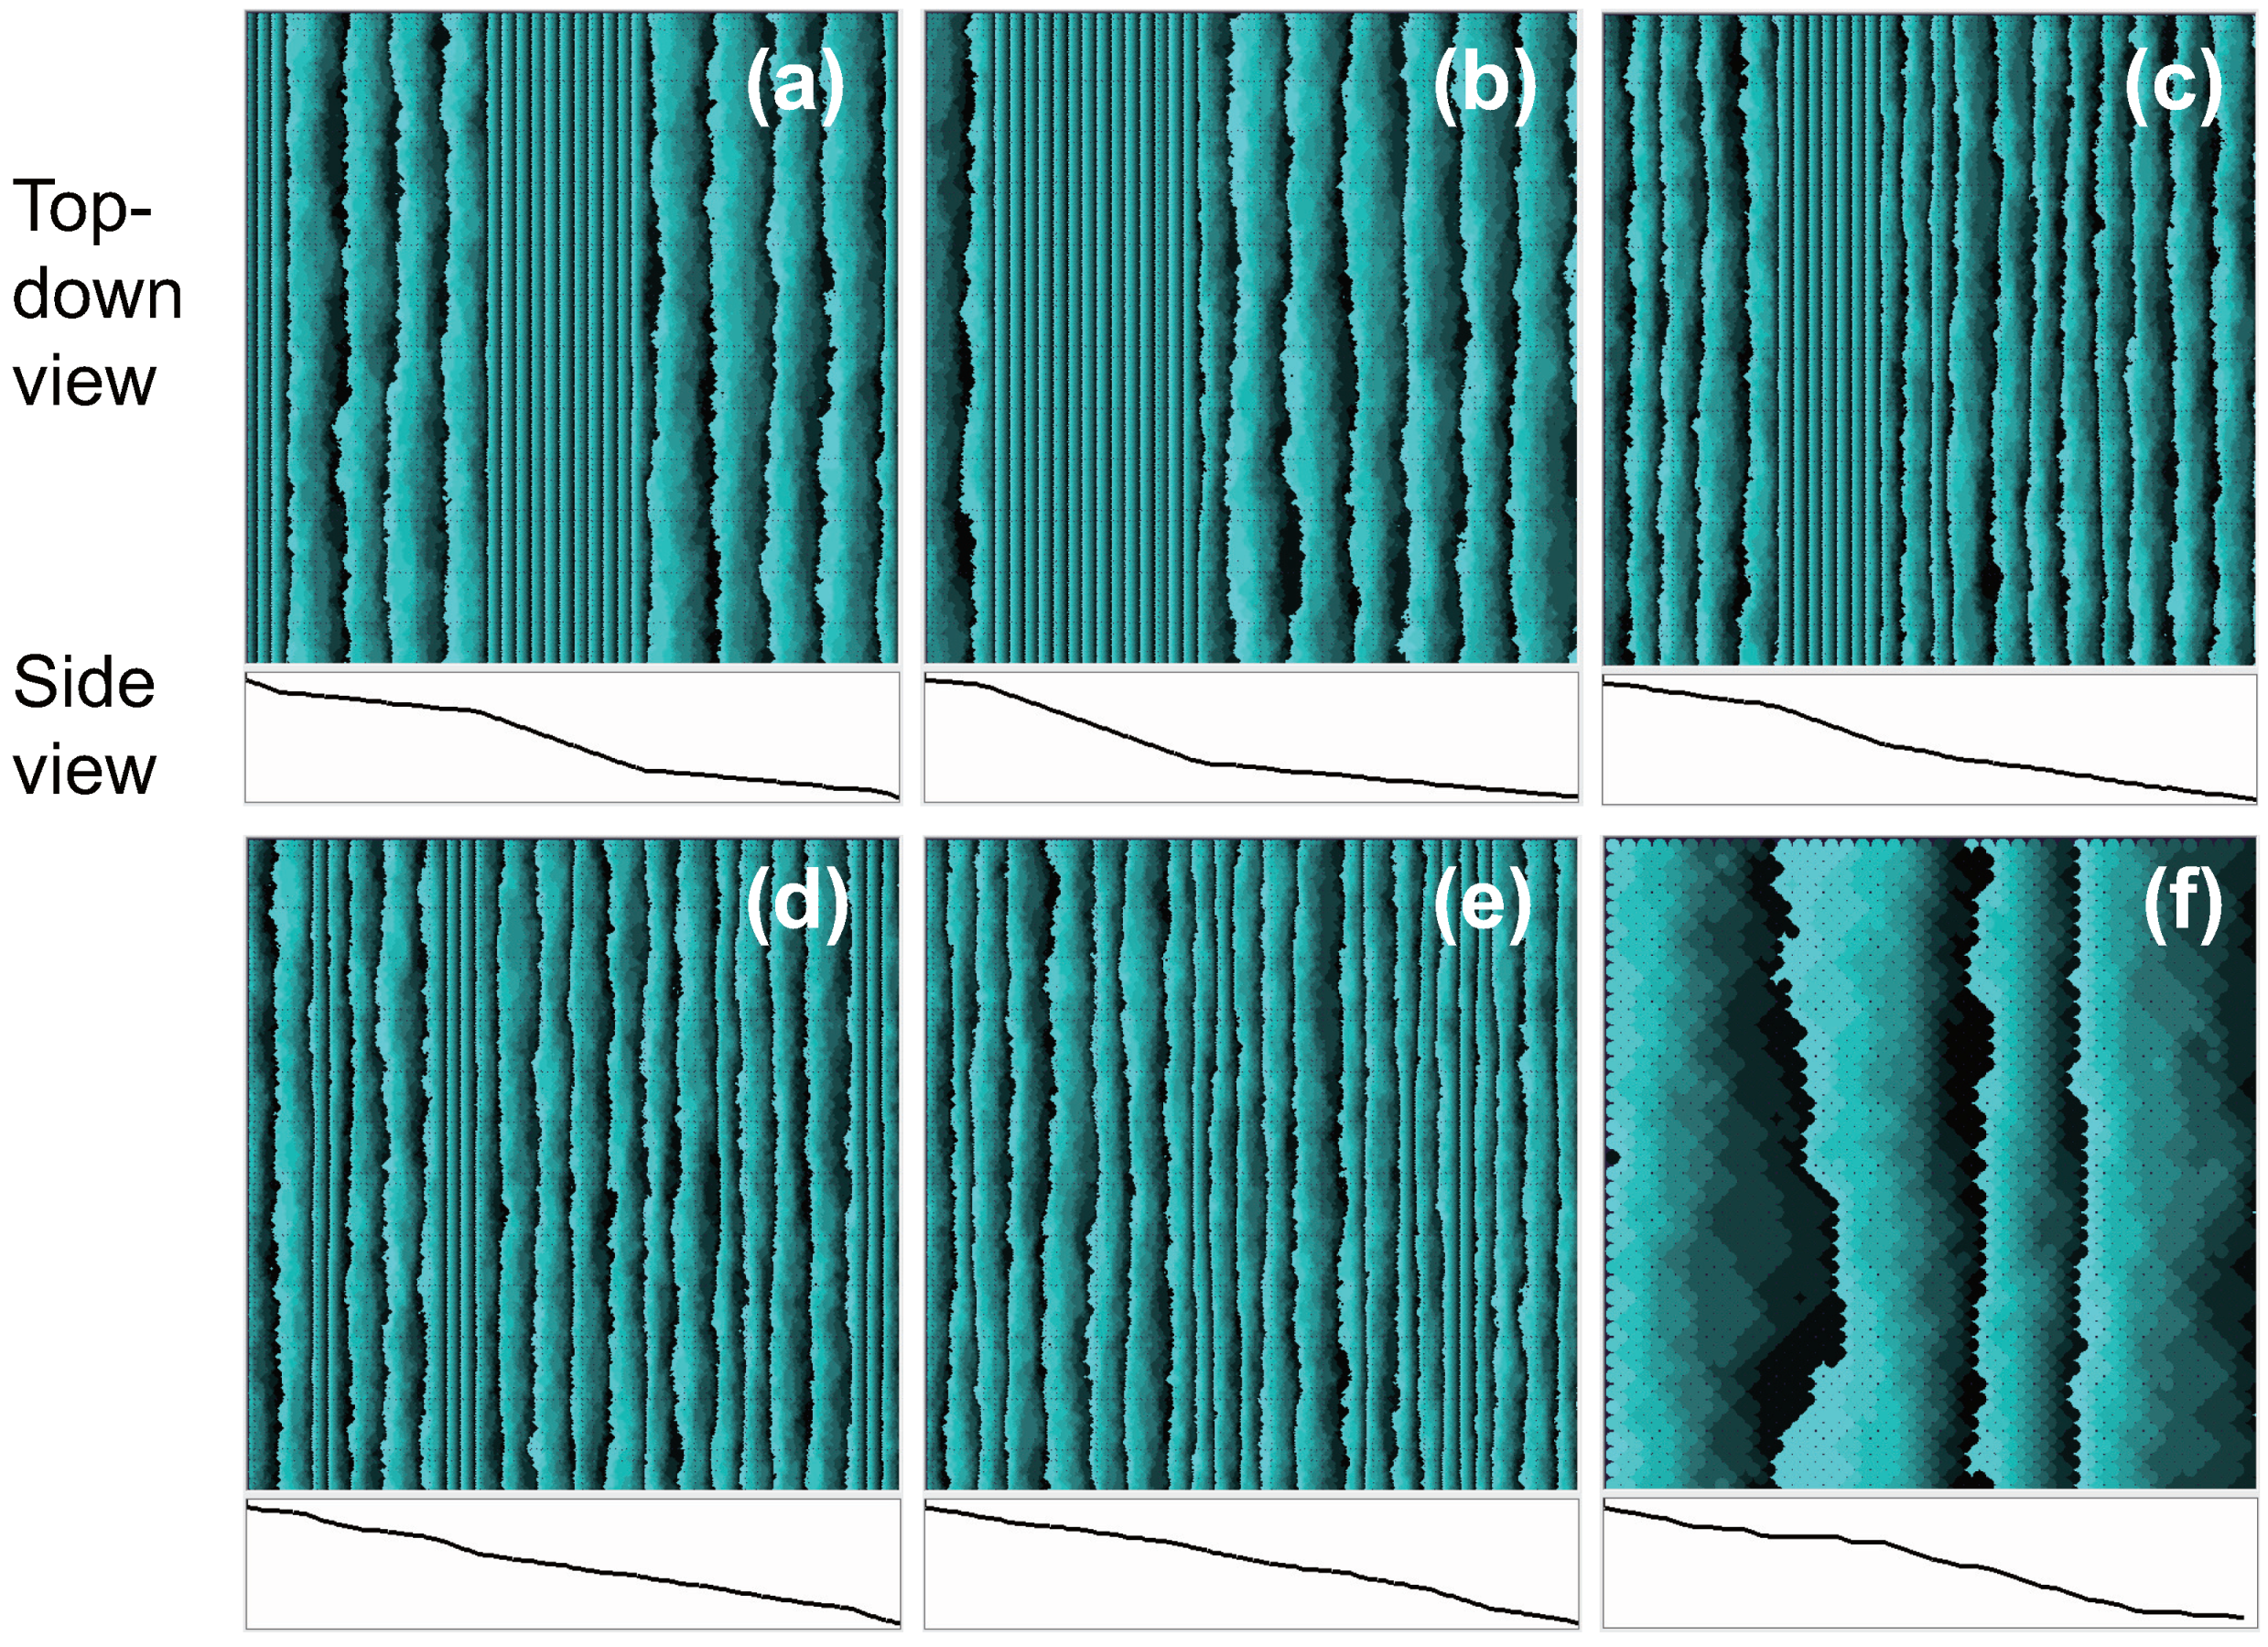
Figure 5.
Snapshots at MCS/site. (a) 0; (b) 0.0005; (c) 0.003; (d) 0.004; and (e) 0.006. , , system size: ; (f) , system size: , , . The surface height is represented by brightness with 10 gradations, with brighter regions indicating a larger height. The darkest areas next to the brightest ones represent terraces that are actually higher by a value of unity, because of the finite gradation. The height profiles for the cross section along the bottom of each surface map are shown below each map.
3.2. Macrostep Size and Surface Growth Rate
At equilibrium (), the vicinal surface showed a homogeneous stepped surface for a small mean surface slope (, Figure 4b) because the surface tension around the (001) surface is continuous in the step droplet zone. In contrast, when the mean surface slope satisfies , homogeneous stepped surfaces are thermodynamically unstable [40]. Then, the surface is realized through two-surface coexistence; the two surfaces are the surface with a slope equal to and the (111) surface [40,41,42,43,44,45]. This is illustrated in Figure 5a. Because the (111) surface is smooth (which means a small number of kinks exist on it), it hardly moves. From the time-dependent Ginzburg–Landau equation of the surface [63,64], the smooth surface does not move because the surface stiffness is divergent [65]. The reason the faceted macrosteps move at equilibrium is the finiteness of the system size [45].
For , the size of a single macrostep decreases as increases, as shown in Figure 5. Furthermore, for , the macrostep disassembles to form a homogeneous rough surface. Because the temperature was the same for all cases shown in Figure 5, the surfaces with roughen kinetically. Interestingly, the change in the size of macrostep is symmetric in the case of , where the steps are receding. The patterns obtained in the case of (e.g., ) is quite similar to the patterns obtained in the case of (e.g., ).
To study the characteristics of the vicinal surface on a mesoscopic scale (approximately 10 nm to 1 m) in detail, the size of the macrosteps and the growth rate of the surface were measured during the Monte Carlo simulation. To evaluate the size of a macrostep, the number n of elementary steps in a locally merged step [40] was introduced. The average size of the locally merged steps is obtained as
where is the number of n-merged steps on the vicinal surface.
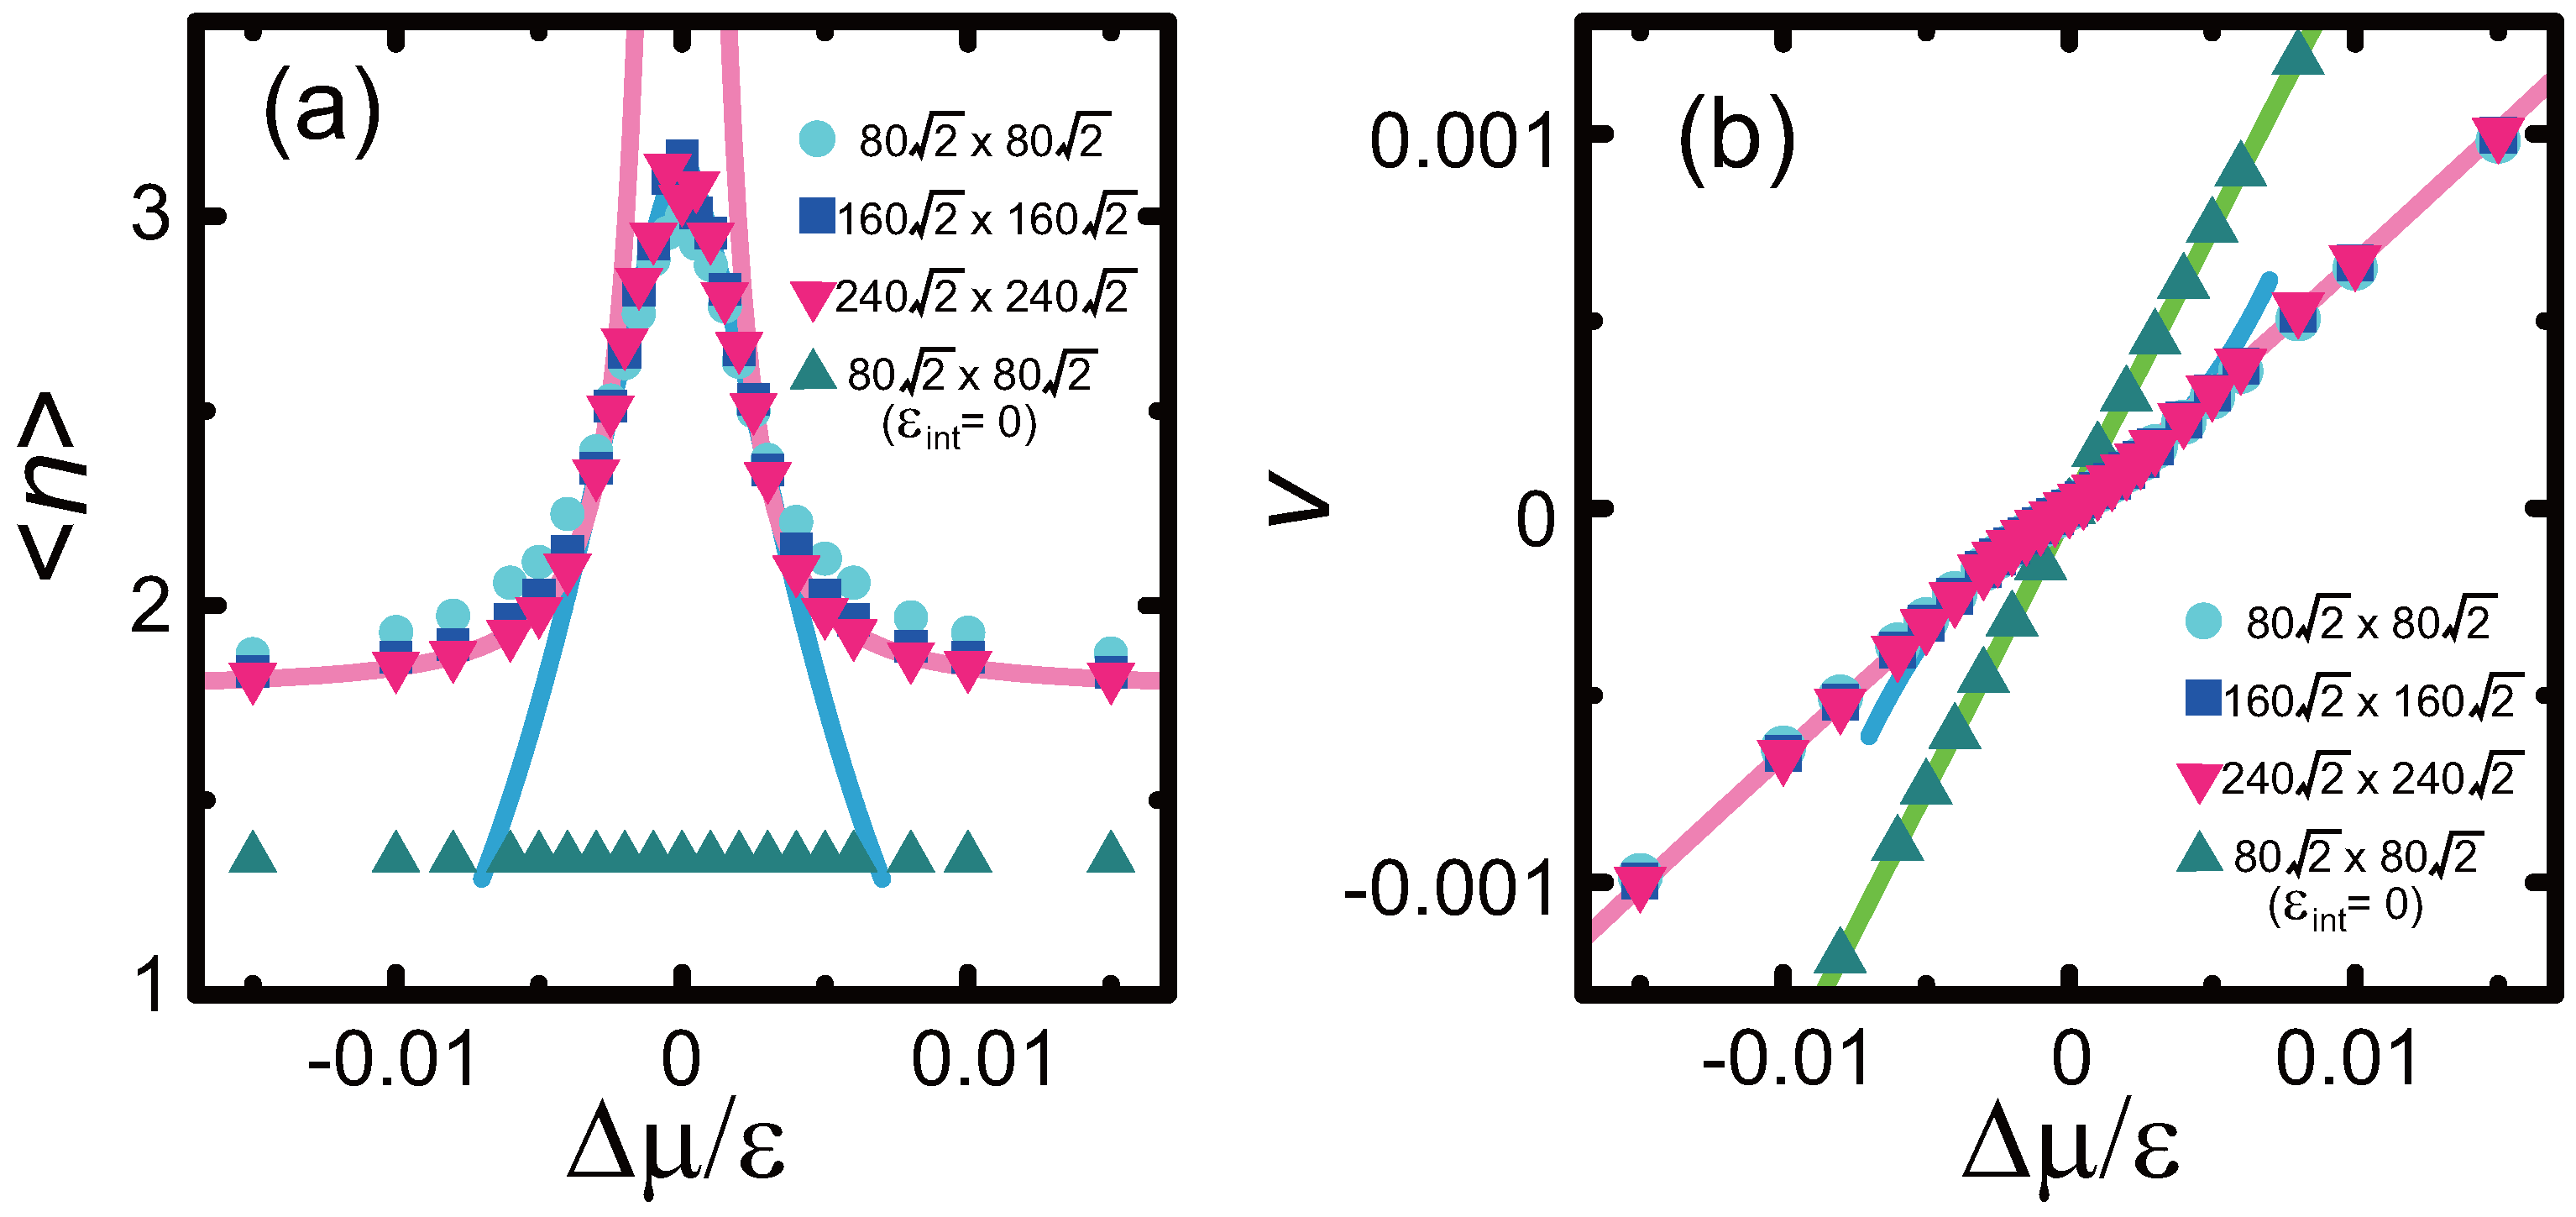
The time evolutions of at different values of are shown in Figure 6a. As shown in Figure 6a, for , is constant near MCS/site. Hence, surfaces with are in non-equilibrium steady state. The time evolutions of in non-equilibrium steady state were also obtained for and 0.002, the results of which are not shown in Figure 5. The -dependence of at MCS/site is shown in Figure 3a. For small , decreases linearly as increases.
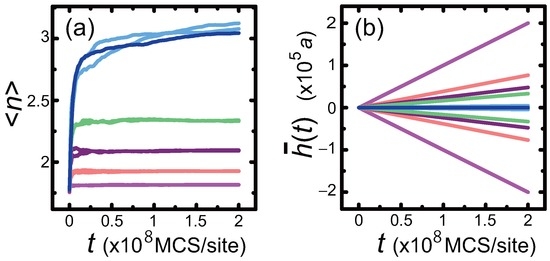
Figure 6.
(a) Time evolution of the average number of steps in a merged step; (b) Time evolution of the average surface height . . Dark blue lines: . Light blue lines: . Green lines . Purple lines: . Coral lines: . Pink lines: . System size: , , .
To estimate the growth rate v, the average surface height was calculated as . The time evolutions of at different values of are shown in Figure 6b. As shown in the figure, increases or decreases linearly with increasing t. Hence, v is defined as
The -dependence of v is shown in Figure 3b. increases as increases.
4. Detachment of Steps from Macrosteps
4.1. Size of a Macrostep
As shown in Figure 5b,c, for sufficiently small , can be approximated as
where is number of elementary steps contained in the most dominant size of the macrosteps, is the number of -merged steps, is the number of elementary steps outside of the macrostep, z is the ratio , and is the slope of the “terrace” surface that is in contact with the (111) surface. From the snapshots, it was assumed that .
From the definitions of z and Equation (9), z can be calculated from as
Thus, the curve of best fit was obtained as by applying the method of least squares to the values of z, which was estimated from using Equation (11) on a system of size . The values of reproduced by the best fit equations are plotted as blue lines in Figure 3a. The lines agree well with the values of for small . The best fit equation reveals the following. In the case of , 69.0% of all steps self-assemble to form a macrostep in the limit of . For small , decreases linearly as increases. This indicates that has a cusp singularity at , because the slope of the line in Figure 3 in the limit of (from the right-hand side) is different from the slope of the line in the limit of (from the left-hand side).
4.2. Growth Rate
Next, the growth rate was investigated. Here, the following model for the time evolution of was considered:
where is the rate at which elementary steps join the macrostep, and is the rate at which elementary steps detach from the macrostep. In the growth condition (), when , the macrostep dissociates. In this case, limits the surface growth rate. In contrast, when , increases up to , and limits the surface growth rate. When the surface is in steady state, .
Because a surface with a slope of shows step flow growth, is considered to be for small , where is the growth rate of a single step. Hence, the growth rate in steady state is expressed as
is obtained from Equation (10) as
At equilibrium, the terrace surface with a slope of , which was calculated using the DMRG method, coexists with the (111) surface, which forms the side surface of the macrostep. For , can be obtained from Equation (14) using the value of z. In the same manner as for z, the curve of best fit was obtained for on a system of size as . In this manner, it was found that increases linearly with for small . Equation (13) with is plotted in Figure 3b as blue lines.
Since = in steady state, the equation for may be used. To model the mechanism of the detachment of an elementary step from a macrostep, the two-dimensional (2D) nucleation mode was considered. In this case, v should be proportional to [66]. However, the Monte Carlo data could not be fit by this equation. The 2D multi-nucleation mode was also considered. In this case, v should be proportional to [62,66]. However, the Monte Carlo data could not be fit by this equation either. From this, the detachment of an elementary step from a macrostep was considered to be caused by the “noise” of the attachment and detachment of atoms (“Atoms” in the model correspond to unit cells) from the ambient phase in association with thermal fluctuations.
5. Kinetic Roughening
As shown in Figure 5, macrosteps do not form at large (). This means that the vicinal surface is kinetically roughened [67,68,69].
Analysis of the results obtained by the Monte Carlo calculations for yielded the scaling function for , and the power law behavior for v (Figure 7). The scaling function , where is at , is expressed as
where . is determined as the point of intersection of the blue and the pink lines in Figure 7b. The value of corresponds to . This yields
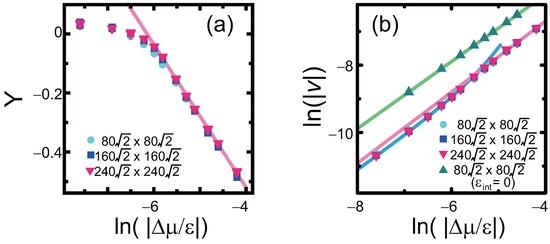
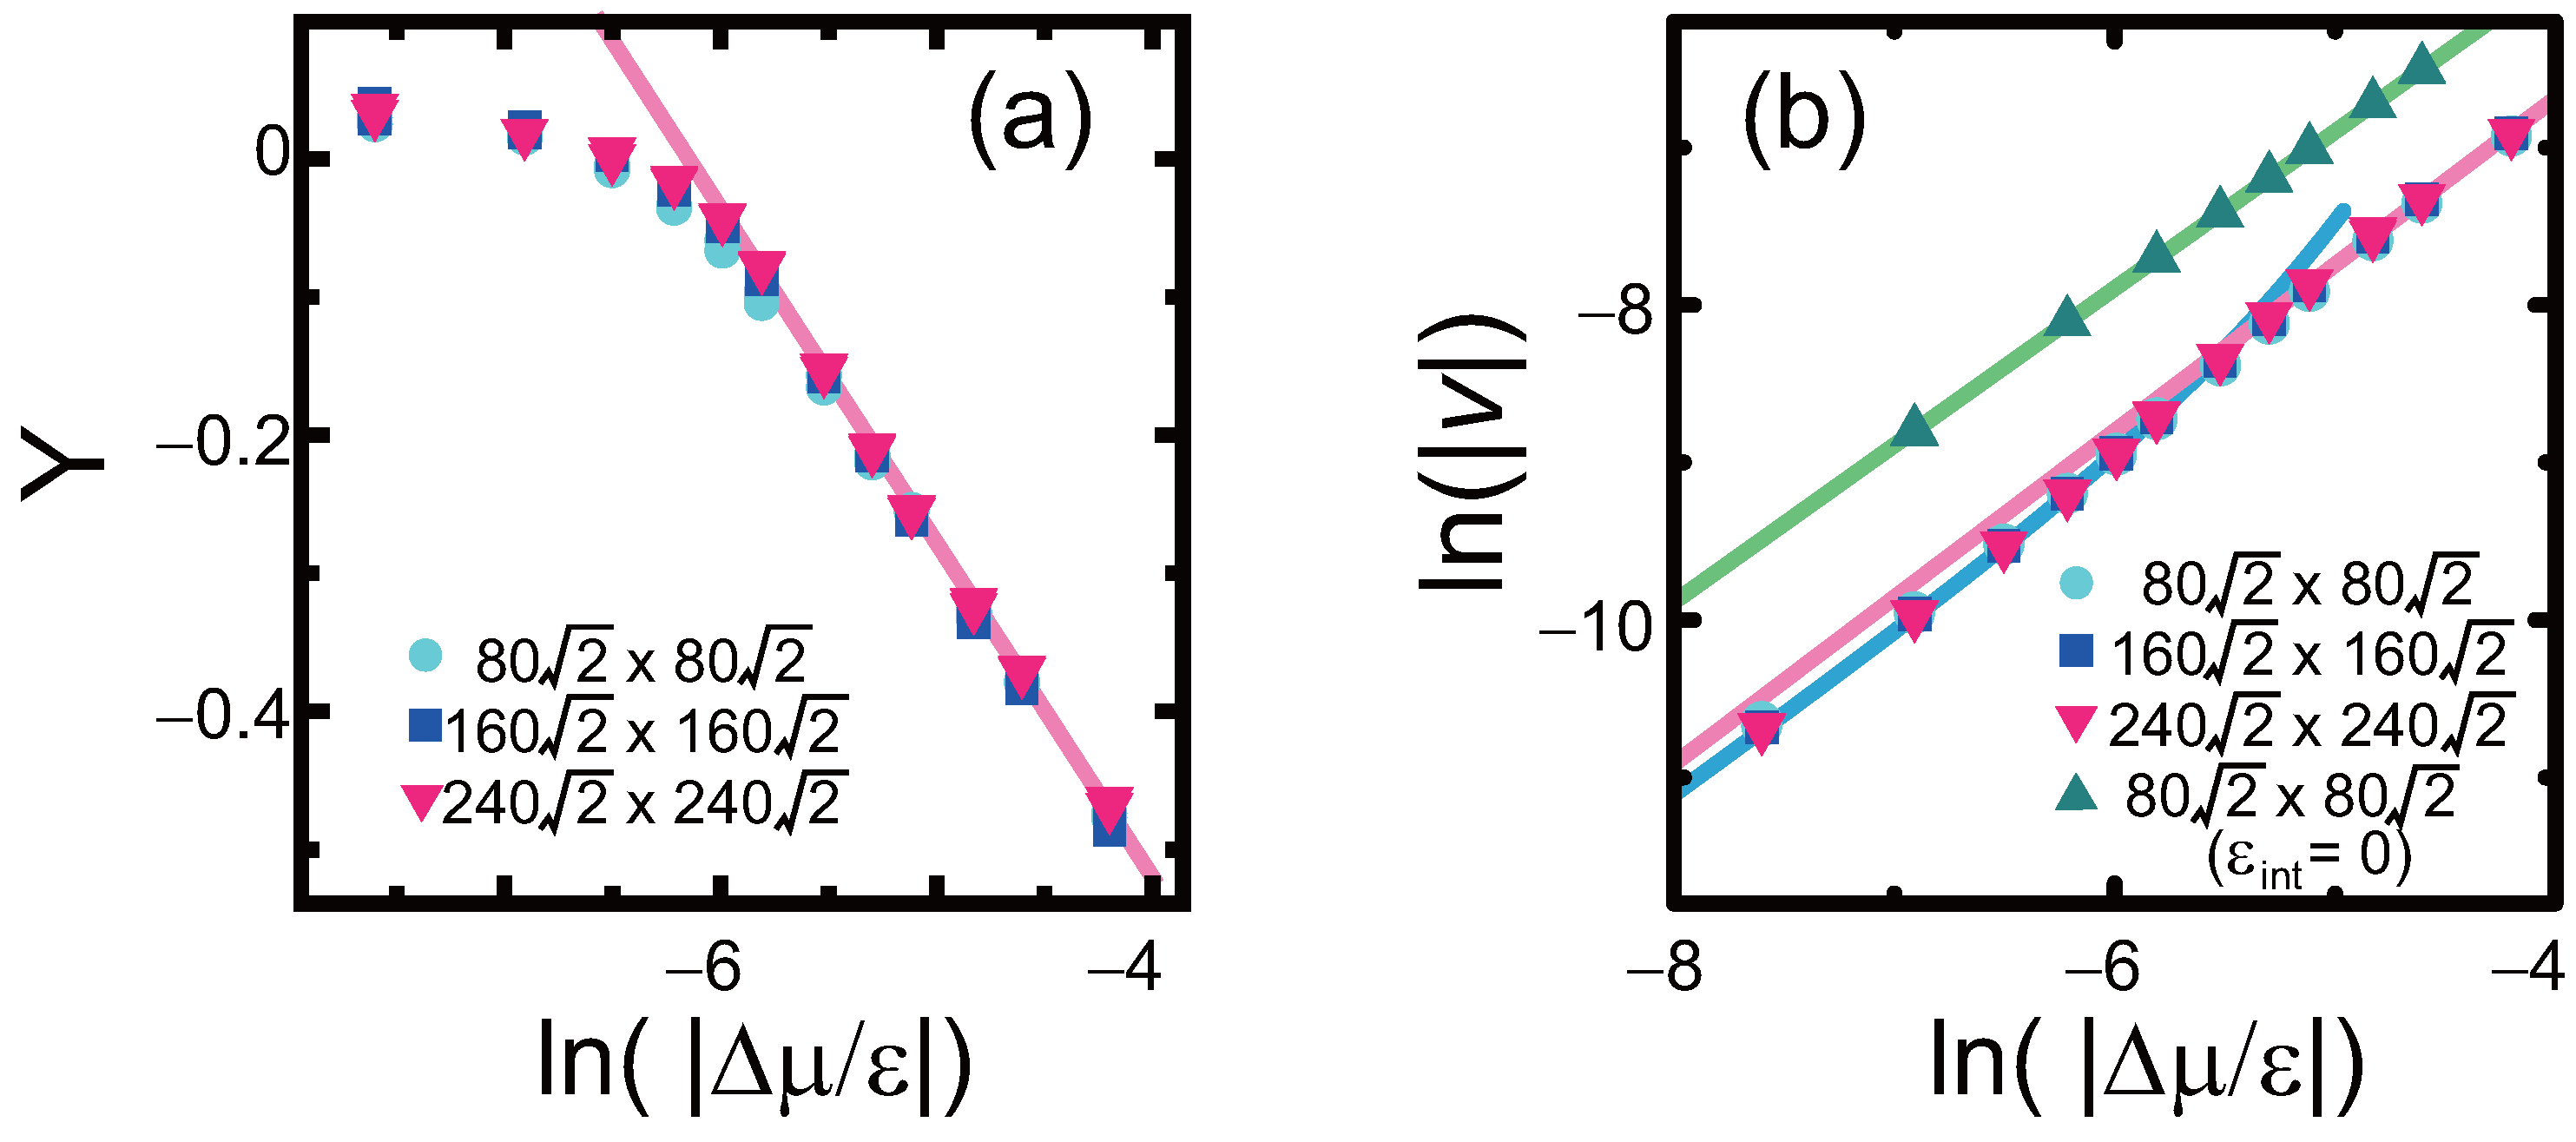
Figure 7.
(a) Scaling function for . . Pink line: ; (b) plotted against . Pink line: . Blue line: with . Green line: . All data are averaged over MCS/site.
This means that shows power law behavior, with the power depending on the system size. The lines based on the power law equation for a system size of are shown as pink lines in Figure 3a. The values obtained using the Monte Carlo method agree well with the power law functions for large .
v also shows power law behavior. (Figure 7b) increases linearly with increasing for . Thus, v can be expressed as
Here, the choice of β as the symbol for the exponent is in accordance with Reference [70]. The power law equation given by Equation (17) is plotted as pink lines in Figure 3b. The values obtained using the Monte Carlo method agree well with the lines for large .
As shown in Figure 7, is not a roughening transition point in the Kosterlitz–Thouless universality class [71,72,73,74], but a crossover point from the two-surface coexistence state to a homogeneous rough surface. To clearly observe this crossover, the case with and —which is also in step droplet zone I—was calculated (Figure 8). In this case, and v showed behaviors quite similar to the case of and . In the case of , was obtained. The shift from the power law behavior for v at small in the case of was more evident than in the case of .
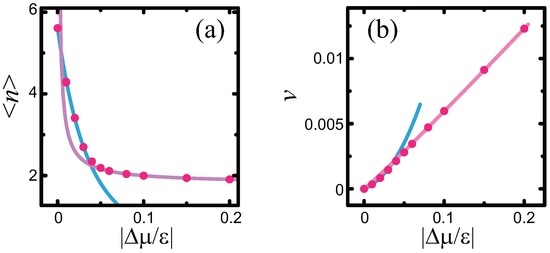
Figure 8.
(a) -dependence of . Light blue line: with . Pink line: ; (b) -dependence of v. Light blue line: with . Pink line: . . (step droplet zone I). Circles: system size of , averaged over MCS/site.
It should be noted that the surface structure contains locally merged steps to some extent, though the surface is homogeneous at the thermodynamic limit (). For , the power of v is similar to that in the case of the original RSOS model (, Figure 7). In spite of this, the growth rate remained lower than that in the original RSOS model at large (Figure 3b). To see the structure at a more microscopic scale, the surface was simulated with a small system size, as shown in Figure 5f. Though the surface appeared homogeneous for a system size of , several locally merged steps were observed at a system size of . These locally merged steps cause the kink density of the surface to decrease. Hence, the growth rate in this case was lower than that for the original RSOS model.
6. Discussion
At equilibrium, planar surfaces such as the (001) surface are smooth at temperatures less than the roughening transition temperature . The height–height correlation function of the planar surface is constant for any r on a smooth surface. In contrast, for , planar surfaces are rough, and is logarithmically divergent with respect to [11,71,72,73,74]. For the vicinal surface, is logarithmically divergent with respect to , though the terrace is smooth [71,72]. Hence, in the present case, the height–height correlation function of the surface with a slope of is logarithmically divergent, whereas that of the (111) surface—which is the side surface of the macrostep—is constant (non-divergent) at equilibrium.
For , the height–height correlation function for a surface with a slope of is considered to be logarithmically divergent with respect to . This is also supported by the exponent β introduced in §5. The growth rate of the rough surface is known to increase linearly as increases [66,75]. The exponent β being close to 1 is consistent with the results obtained through calculations using the discrete Gaussian model [75].
The kinetically roughened state for is somewhat different from the state in step droplet zone II [43,44]. In step droplet zone II, the (001) surface is rough because the temperature is higher than its roughening transition temperature. Hence, the correlation length ξ for on the (001) surface is divergent. Furthermore, depends on the surface slope p as in the limit , where and C are constants. In contrast, the correlation length ξ for the (001) surface in step droplet zone I is considered to be finite. varies with the surface slope p as in the limit . The locally merged steps remain to some extent (Figure 5f).
The relaxation time required to reach steady state increases as decreases (Figure 6a). The time to relax to steady state is associated with the power law behavior of the surface [55,69,76,77,78].
The focus of the present study was the dynamics affected by the surface tension. As indicated in the cases of 4H-SiC [1] and Si(113) [21,25,26,27,28,29,30,31,32,33], elastic step–step repulsion expressed by the formula [5,6,7] is important in real systems near equilibrium. The elastic effects are considered to weaken the step–step attraction in the present study. In the step droplet zone, the elastic step–step repulsion produces two effects: the shift of the zone boundary lines [43,45] and the formation of a regular array of n-merged macrosteps [31,32]. Since the elastic step–step repulsion causes (Equation (4)) and (Equation (5)) to increase, the zone boundary lines shift to lower temperatures. In the short range, the step–step attraction dominates and sticks steps together, whereas in the long range, the step–step repulsion dominates and separates -merged macrosteps, where is the size of the macrostep with the lowest surface free energy. Thus, the following guidelines were obtained to disperse macrosteps: (1) the temperature should be raised; (2) the elastic step–step repulsion should be increased; and (3) the absolute value of the driving force should be increased.
In real systems, other effects, such as surface diffusion [52,53,54,55] and polymorphic effects [19,20], should also be taken into consideration. The combination of these effects and the effect of the discontinuous surface tension will be considered in future work.
7. Conclusions
The effect of the driving force on the size of a faceted macrostep and the growth rate of the vicinal surface in non-equilibrium steady state were investigated using the Monte Carlo model. Step droplet zone I for the p-RSOS model was the focus of this study.
- As increases, the size of the macrostep decreases, whereas the growth rate increases.
- At small , the -dependence of and v can be explained by the attachment and detachment of elementary steps to and from the macrostep.
- When , the macrostep disassembles, and the surface roughens kinetically. is the crossover point from the two-surface coexistent state to the rough surface state.
- A scaling function was obtained with and .
- For , and both show power law behavior.
Acknowledgments
This work was supported by the Japan Society for Promotion of Science (JSPS) KAKENHI Grant Number JP25400413.
Conflicts of Interest
The authors declare no conflict of interest. The founding sponsors had no role in the design of the study; the collection, analysis, or interpretation of data; the writing of the manuscript; or the decision to publish the results.
Abbreviations
The following abbreviations are used in this manuscript:
| ECS | Equilibrium crystal shape |
| TSK | Terrace–step–kink |
| GMPT | Gruber–Mullins–Pokrovsky–Talapov |
| RSOS | Restricted solid-on-solid |
| p-RSOS | Restricted solid-on-solid with a point-contact-type step–step attraction |
| NN | Nearest-neighbor |
| NNN | Next-nearest-neighbor |
| DMRG | Density matrix renormalization group |
| 1D | One-dimensional |
| PWFRG | Product wave function renormalization group |
| MCS | Monte Carlo steps |
| 2D | Two-dimensional |
Appendix A. Anomalous Surface Tension: Density Matrix Renormalization Group Calculation
The surface tension is the amount of surface free energy per unit normal area. To evaluate the surface free energy of the vicinal surface, the terms related to the Andreev field [13] were added: . The Hamiltonian for the grand canonical ensemble with respect to the number of steps is [79].
The Andreev field behaves like a chemical potential with respect to a single step. The Legendre-transformed surface free energy introduced by Bhattacharjee [30] corresponds to the Andreev free energy [11,13].
From a statistical mechanics perspective, the grand partition function is calculated as , where . The summation with respect to is taken over all possible values of . The Andreev free energy [13] is the thermodynamic grand potential and is calculated from the grand partition function as [79]
where is the number of lattice points on the square lattice. The Andreev free energy calculated using the DMRG method is shown in Figure A1a as a function of for . It should be noted that the profile of the Andreev free energy is similar to the ECS , where , , and λ represents the Lagrange multiplier related to the crystal volume.
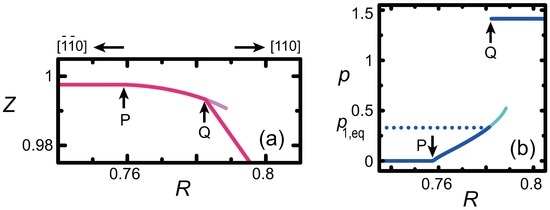
Figure A1.
(a) Profile of the Andreev free energy, which is equivalent to the profile of the ECS. This figure was reproduced from Akutsu [45]; (b) plotted against R. , where θ is the tilt angle of the vicinal surface toward the direction. . . , with and , where is the ECS and λ is the Lagrange multiplier related to the crystal volume. Pink lines: Andreev free energy calculated using the DMRG method. Blue lines: surface slope p calculated using the DMRG method. The pale pink line near point Q in (a) represents a metastable surface; The pale blue line in (b) represents the surface slope of the metastable surface. The end points of the pale lines show the approximate spinodal points. It is assumed that equals ϵ. Points P and Q indicate the (001) and (111) facet edges, respectively.
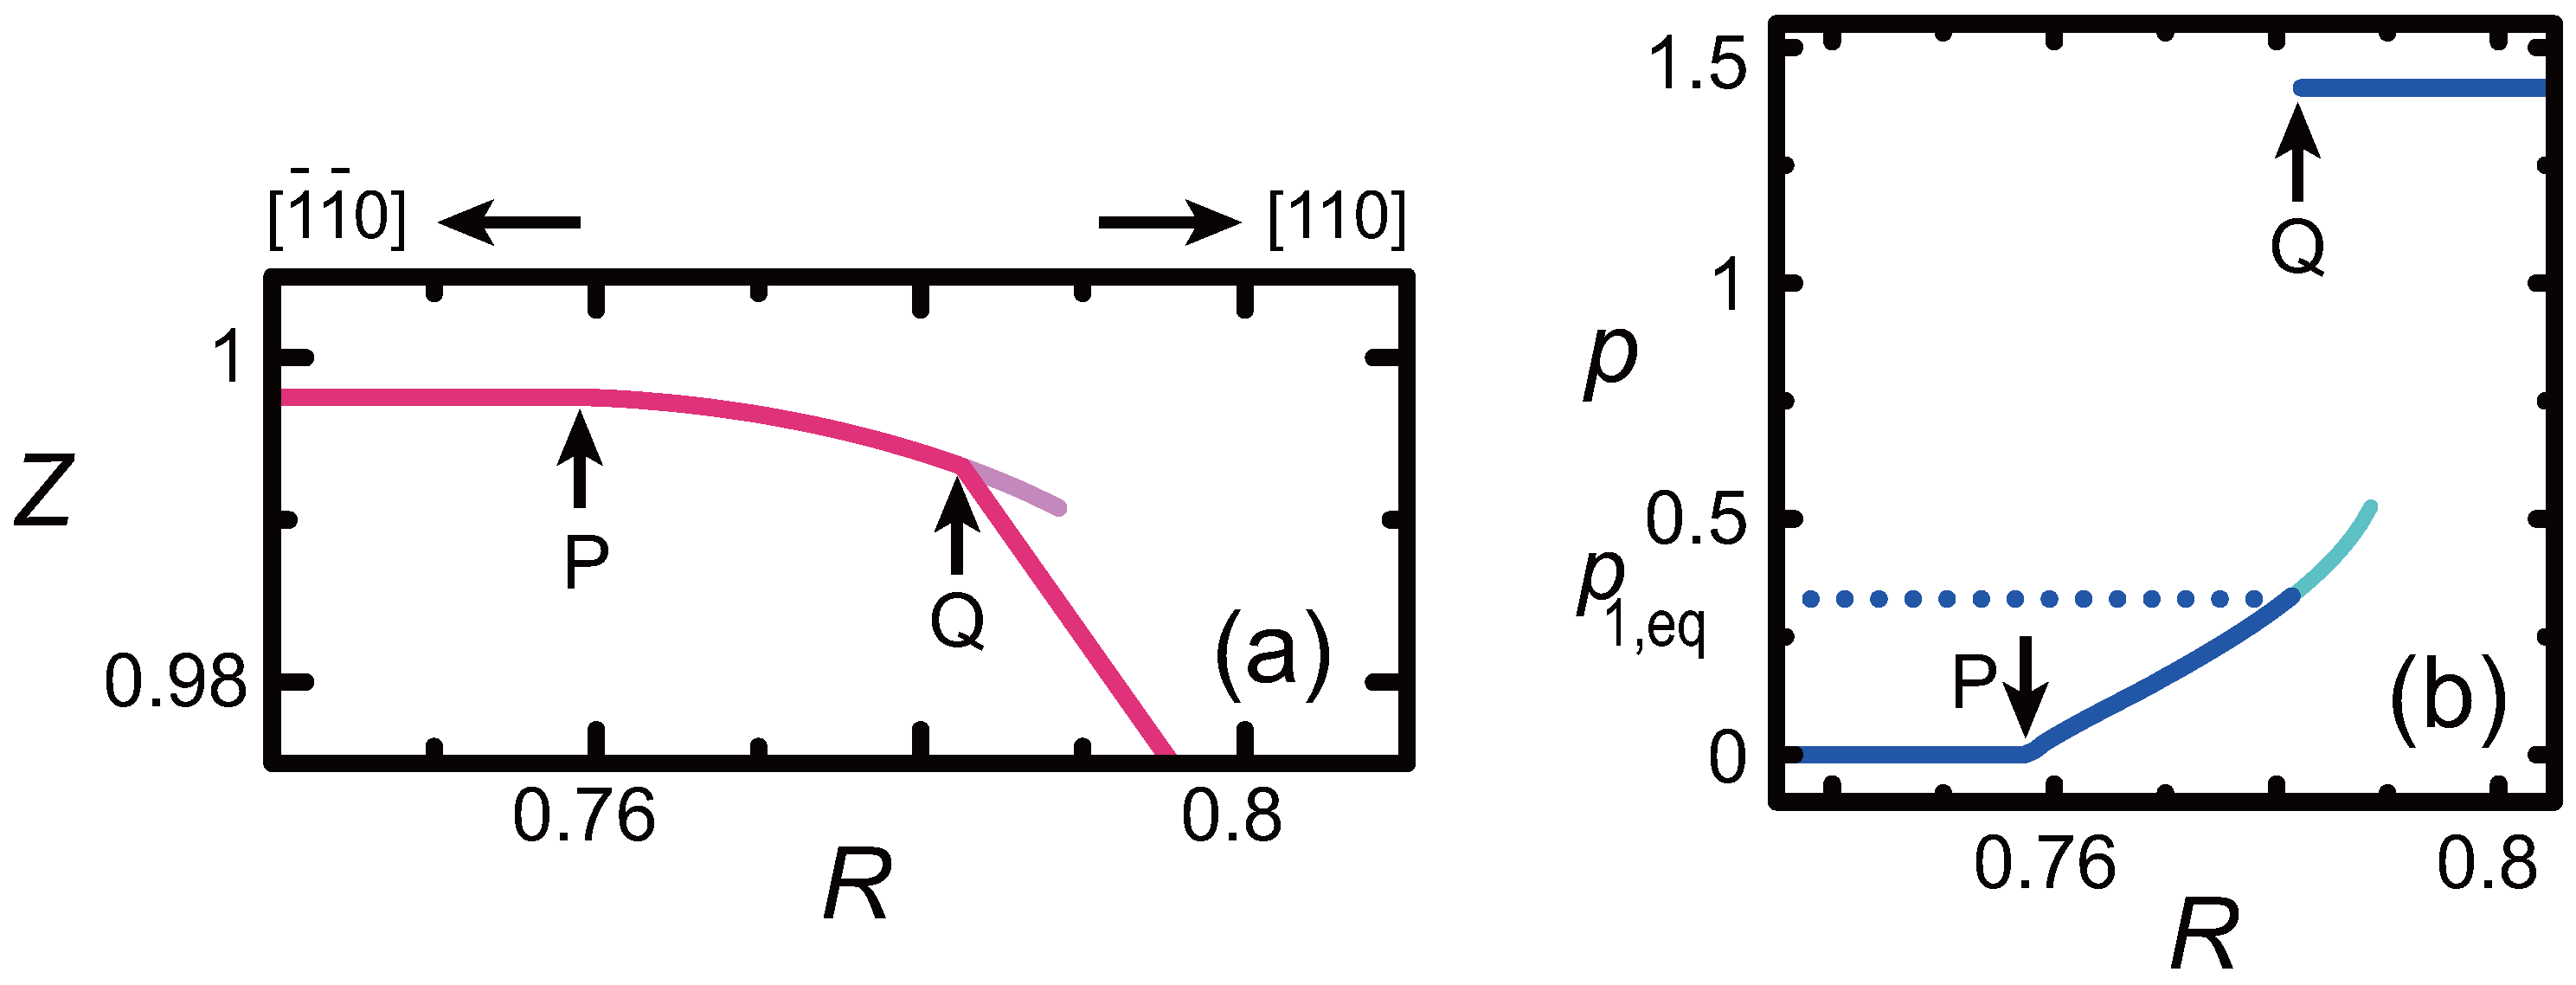
The surface gradient p was also calculated using the DMRG method as . The calculated p with is shown in Figure A1b.
Using the inverse Legendre transform with respect to ,
we obtained the surface free energy per unit area. A plot of is shown in Figure 4b.
References
- Mitani, T.; Komatsu, N.; Takahashi, T.; Kato, T.; Harada, S.; Ujihara, T.; Matsumoto, Y.; Kurashige, K.; Okumura, H. Effect of aluminum addition on the surface step morphology of 4H–SiC grown from Si–Cr–C solution. J. Cryst. Growth 2015, 423, 45–49. [Google Scholar] [CrossRef]
- Cabrera, N.; Coleman, R.V. The Art and Science of Growing Crystals; Gilman, J.J., Ed.; John Wiley & Sons: New York, NY, USA; London, UK, 1963. [Google Scholar]
- Cabrera, N. The equilibrium of crystal surfaces. Surf. Sci. 1964, 2, 320–345. [Google Scholar] [CrossRef]
- Jayaprakash, C.; Rottman, C.; Saam, W.F. Simple model for crystal shapes: Step-step interactions and facet edges. Phys. Rev. B 1984, 30, 6549–6554. [Google Scholar] [CrossRef]
- Calogero, F. Solution of a three—Body problem in one dimension. J. Math. Phys. 1969, 10, 2191–2196. [Google Scholar] [CrossRef]
- Sutherland, B. Quantum Many—Body Problem in One Dimension: Ground State. J. Math. Phys. 1971, 12, 246–250. [Google Scholar] [CrossRef]
- Alerhand, O.L.; Vanderbilt, D.; Meade, R.D.; Joannopoulos, J.D. Spontaneous formation of stress domains on crystal surfaces. Phys. Rev. Lett. 1988, 61, 1973–1976. [Google Scholar] [CrossRef] [PubMed]
- Gruber, E.E.; Mullins, W.W. On the theory of anisotropy of crystalline surface tension. J. Phys. Chem. Solids 1967, 28, 875–887. [Google Scholar] [CrossRef]
- Pokrovsky, V.L.; Talapov, A.L. Ground state, spectrum, and phase diagram of two-dimensional incommensurate crystals. Phys. Rev. Lett. 1979, 42, 65–67. [Google Scholar] [CrossRef]
- Einstein, T.L. Equilibrium Shape of Crystals. In Handbook of Crystal Growth; Nishinaga, T., Ed.; Elsevier: Amsterdam, The Netherlands; Boston, MA, USA; Heidelberg, Germany; London, UK; Paris, France; Singapore; Sydney, Australia; Tokyo, Japan, 2015; Volume I, p. 216. [Google Scholar]
- Akutsu, N.; Yamamoto, T. Rough-Smooth Transition of Step and Surface. Handbook of Crystal Growth; Nishinaga, T., Ed.; Elsevier: Amsterdam, The Netherlands; Boston, MA, USA; Heidelberg, Germany; London, UK; Paris, France; Singapore; Sydney, Australia; Tokyo, Japan, 2015; Volume I, p. 265. [Google Scholar]
- Landau, L.D.; Lifshitz, E.M. Statistical Physics, 2nd ed.; Pergamon: Oxford, UK, 1968. [Google Scholar]
- Andreev, A.F. Faceting phase transitions of crystals. Sov. Phys. JETP 1981, 53, 1063–1069. [Google Scholar]
- Von Laue, M. Der Wulffsche Satz für die Gleichgewichtsform von Kristallen. Z. Kristallogr. 1944, 105, 124–133. [Google Scholar]
- Herring, C. Some theorems on the free energies of crystal surfaces. Phys. Rev. 1951, 82, 87–93. [Google Scholar] [CrossRef]
- MacKenzie, J.K.; Moore, A.J.W.; Nicholas, J.F. Bonds broken at atomically flat crystal surfaces–I: Face-centred and body-centred cubic crystals. J. Chem. Phys. Solids 1962, 23, 185–196. [Google Scholar] [CrossRef]
- Toschev, S. Crystal Growth: An Introduction; Hartman, P., Ed.; North-Holland: Amsterdam, The Netherlands; Oxford, UK, 1973; p. 328. [Google Scholar]
- Rottman, C.; Wortis, M. Equilibrium crystal shapes for lattice models with nearest- and next-nearest-neighbor interactions. Phys. Rev. B 1984, 29, 328–339. [Google Scholar] [CrossRef]
- Williams, E.D.; Bartelt, N.C. Thermodynamics of surface morphology. Science 1991, 251, 393–401. [Google Scholar] [CrossRef] [PubMed]
- Williams, E.D.; Phaneuf, R.J.; Wei, J.; Bartelt, N.C.; Einstein, T.L. Thermodynamics and statistical mechanics of the faceting of stepped Si (111). Surf. Sci. 1993, 294, 219–242, Erratum in 1994, 310, 451. [Google Scholar] [CrossRef]
- Yamamoto, T.; Akutsu, Y.; Akutsu, N. Fluctuation of a single step on the vicinal surface-universal and non-universal behaviors. J. Phys. Soc. Jpn. 1994, 63, 915–925. [Google Scholar] [CrossRef]
- Akutsu, Y.; Akutsu, N.; Yamamoto, T. Logarithmic step fluctuations in vicinal surface: A Monte Carlo study. J. Phys. Soc. Jpn. 1994, 63, 2032–2036. [Google Scholar] [CrossRef]
- Hibino, H.; Ogino, T. Transient Step Bunching on a Vicinal Si(111) Surface. Phys. Rev. Lett. 1994, 72, 657–660. [Google Scholar] [CrossRef] [PubMed]
- Ogino, T.; Hibino, H.; Homma, Y. Kinetics and Thermodynamics of Surface Steps on Semiconductors. Crit. Rev. Solid State Mater. Sci. 1999, 24, 227–263. [Google Scholar] [CrossRef]
- Song, S.; Mochrie, S.G.J. Tricriticality in the orientational phase diagram of stepped Si (113) surfaces. Phys. Rev. Lett. 1994, 73, 995–998. [Google Scholar] [CrossRef] [PubMed]
- Song, S.; Mochrie, S.G.J. Attractive step-step interactions, tricriticality, and faceting in the orientational phase diagram of silicon surfaces between [113] and [114]. Phys. Rev. B 1995, 51, 10068–10084. [Google Scholar] [CrossRef]
- Van Dijken, S.; Zandvliet, H.J.W.; Poelsema, B. Anomalous strong repulsive step-step interaction on slightly misoriented Si (113). Phys. Rev. B 1997, 55, 7864–7867. [Google Scholar] [CrossRef]
- Jeong, H.C.; Williams, E.D. Steps on surfaces: Experiment and theory. Surf. Sci. Rep. 1999, 34, 171–294. [Google Scholar] [CrossRef]
- Lassig, M. Vicinal surfaces and the Calogero-Sutherland model. Phys. Rev. Lett. 1996, 77, 526–529. [Google Scholar] [CrossRef] [PubMed]
- Bhattacharjee, S.M. Theory of tricriticality for miscut surfaces. Phys. Rev. Lett. 1996, 76, 4568–4571. [Google Scholar] [CrossRef] [PubMed]
- Shenoy, V.B.; Zhang, S.; Saam, W.F. Bunching transitions on vicinal surfaces and quantum n-mers. Phys. Rev. Lett. 1998, 81, 3475–3478. [Google Scholar] [CrossRef]
- Shenoy, V.B.; Zhang, S.; Saam, W.F. Step-bunching transitions on vicinal surfaces with attractive step interactions. Surf. Sci. 2000, 467, 58–84. [Google Scholar] [CrossRef]
- Einstein, T.L.; Richards, H.L.; Cohen, S.D.; Pierre-Louis, O.; Giesen, M. Terrace-width distributions on vicinal surfaces: Generalized Wigner surmise and extraction of step–step repulsions. Appl. Surf. Sci. 2001, 175–176, 62–68. [Google Scholar] [CrossRef]
- Akutsu, N.; Akutsu, Y.; Yamamoto, T. Stiffening transition in vicinal surfaces with adsorption. Prog. Theory Phys. 2001, 105, 361–366. [Google Scholar] [CrossRef]
- Akutsu, N.; Akutsu, Y.; Yamamoto, T. Statistical mechanics of the vicinal surfaces with adsorption. Surf. Sci. 2001, 493, 475–479. [Google Scholar] [CrossRef]
- Akutsu, N.; Akutsu, Y.; Yamamoto, T. Thermal step bunching and interstep attraction on the vicinal surface with adsorption. Phys. Rev. B 2003, 67, 125407. [Google Scholar] [CrossRef]
- Akutsu, N.; Hibino, H.; Yamamoto, T. A Lattice Model for Thermal Decoration and Step Bunching in Vicinal Surface with Sub-Monolayer Adsorbates. e-J. Surf. Sci. Nanotechnol. 2009, 7, 39–44. [Google Scholar] [CrossRef]
- Akutsu, N. Thermal step bunching on the restricted solid-on-solid model with point contact inter-step attractions. Appl. Surf. Sci. 2009, 256, 1205–1209. [Google Scholar] [CrossRef]
- Akutsu, N. Zipping process on the step bunching in the vicinal surface of the restricted solid-on-solid model with the step attraction of the point contact type. J. Cryst. Growth 2011, 318, 10–13. [Google Scholar] [CrossRef]
- Akutsu, N. Non-universal equilibrium crystal shape results from sticky steps. J. Phys. Condens. Matter 2011, 23, 485004. [Google Scholar] [CrossRef] [PubMed]
- Akutsu, N. Sticky steps inhibit step motions near equilibrium. Phys. Rev. E 2012, 86, 061604. [Google Scholar] [CrossRef] [PubMed]
- Akutsu, N. Pinning of steps near equilibrium without impurities, adsorbates, or dislocations. J. Cryst. Growth 2014, 401, 72–77. [Google Scholar] [CrossRef]
- Akutsu, N. Faceting diagram for sticky steps. AIP Adv. 2016, 6, 035301. [Google Scholar] [CrossRef]
- Akutsu, N. Effect of the roughening transition on the vicinal surface in the step droplet zone. J. Cryst. Growth 2016. [Google Scholar] [CrossRef]
- Akutsu, N. Profile of a Faceted Macrostep Caused by Anomalous Surface Tension. Adv. Condens. Matter Phys. 2017, 2021510. [Google Scholar] [CrossRef]
- White, S.R. Density matrix formulation for quantum renormalization groups. Phys. Rev. Lett. 1992, 69, 2863–2866. [Google Scholar] [CrossRef] [PubMed]
- Nishino, T. Density matrix renormalization group method for 2D classical models. J. Phys. Soc. Jpn. 1995, 64, 3598–3601. [Google Scholar] [CrossRef]
- Schollwöck, U. The density-matrix renormalization group. Rev. Mod. Phys. 2005, 77, 259–315. [Google Scholar] [CrossRef]
- Nishino, T.; Okunishi, K. Product wave function renormalization group. J. Phys. Soc. Jpn. 1995, 64, 4084–4087. [Google Scholar] [CrossRef]
- Hieida, Y.; Okunishi, K.; Akutsu, Y. Magnetization process of a one-dimensional quantum antiferromagnet: The product-wave-function renormalization group approach. Phys. Lett. A 1997, 233, 464–470. [Google Scholar] [CrossRef]
- Hieida, Y.; Okunishi, K.; Akutsu, Y. Numerical renormalization approach to two-dimensional quantum antiferromagnets with valence-bond-solid type ground state. New J. Phys. 1999, 1, 7. [Google Scholar] [CrossRef]
- Ehrlich, G.; Hudda, F.G. Atomic view of surface self-diffusion: Tungsten on tungsten. J. Chem. Phys. 1966, 44, 1039–1049. [Google Scholar] [CrossRef]
- Schwoeble, R.L.; Shipsey, E.J. Step motion on crystal surfaces. J. Appl. Phys. 1966, 37, 3682–3686. [Google Scholar] [CrossRef]
- Pimpinelli, A.; Villain, J. Physics of Crystal Growth; Cambridge University Press: Cambridge, UK, 1998. [Google Scholar]
- Misbah, C.; Pierre-Louis, O.; Saito, Y. Crystal surfaces in and out of equilibrium: A modern view. Rev. Mod. Phys. 2010, 82, 981–1040. [Google Scholar] [CrossRef]
- Mermin, N.D.; Wagner, H. Absence of ferromagnetism or antiferromagnetism in one-or two-dimensional isotropic Heisenberg models. Phys. Rev. Lett. 1966, 17, 1133–1136, Erratum in 1966, 17, 1307. [Google Scholar] [CrossRef]
- Akutsu, Y.; Akutsu, N.; Yamamoto, T. Universal jump of Gaussian curvature at the facet edge of a crystal. Phys. Rev. Lett. 1988, 61, 424–427. [Google Scholar] [CrossRef] [PubMed]
- Yamamoto, T.; Akutsu, Y.; Akutsu, N. Universal Behavior of the Equilibrium Crystal Shape near the Facet Edge. I. A Generalized Terrace-Step-Kink Model. J. Phys. Soc. Jpn. 1988, 57, 453–460. [Google Scholar] [CrossRef]
- Mikheev, L.V.; Pokrovsky, V.L. Free-fermion solution for overall equilibrium crystal shape. J. Phys. 1991, 1, 373–382. [Google Scholar] [CrossRef]
- Akutsu, Y. Exact Landau Free-Energy of Solvable N-State Vertex Model. J. Phys. Soc. Jpn. 1989, 58, 2219–2222. [Google Scholar] [CrossRef]
- Okunishi, K.; Hieida, Y.; Akutsu, Y. δ-function Bose-gas picture of S = 1 antiferromagnetic quantum spin chains near critical fields. Phys. Rev. B 1999, 59, 6806–6812. [Google Scholar] [CrossRef]
- Markov, I.V. Crystal Growth for Beginners, 2nd ed.; World Scientific: Hackensack, NJ, USA; London, UK; Singapore; Hong Kong, China, 2003. [Google Scholar]
- Müller-Krumbhaar, H.; Burkhardt, T.W.; Kroll, D.M. A generalized kinetic equation for crystal growth. J. Cryst. Growth 1977, 38, 13–22. [Google Scholar] [CrossRef]
- Enomoto, Y.; Kawasaki, K.; Ohta, T.; Ohta, S. Interface dynamics under the anisotropic surface tension. Phys. Lett. 1985, 107, 319–323. [Google Scholar] [CrossRef]
- Akutsu, N.; Akutsu, Y. Roughening, faceting and equilibrium shape of two-dimensional anisotropic interface. I. Thermodynamics of interface fluctuations and geometry of equilibrium crystal shape. J. Phys. Soc. Jpn. 1987, 56, 1443–1453. [Google Scholar] [CrossRef]
- Burton, W.K.; Cabrera, N.; Frank, F.C. The growth of crystals and the equilibrium structure of their surfaces. Philos. Trans. R. Soc. Lond. A 1951, 243, 299–358. [Google Scholar] [CrossRef]
- Krug, J.; Meakin, P. Kinetic roughening of Laplacian fronts. Phys. Rev. Lett. 1991, 66, 703–706. [Google Scholar] [CrossRef] [PubMed]
- Uwaha, M.; Saito, Y. Kinetic smoothing and roughening of a step with surface diffusion. Phys. Rev. Lett. 1992, 68, 224–227. [Google Scholar] [CrossRef] [PubMed]
- Barabasi, A.L.; Stanley, H.E. Fractal Concepts in Surface Growth; Cambridge University Press: Cambridge, UK, 1995. [Google Scholar]
- Reichhardt, C.; Reichhardt, C.J.O. Depinning and nonequilibrium dynamic phases of particle assemblies driven over random and ordered substrates: A review. Rep. Prog. Phys. 2017, 80, 026501. [Google Scholar] [CrossRef] [PubMed]
- Jayaprakash, C.; Saam, W.F.; Teitel, S. Roughening and facet formation in crystals. Phys. Rev. Lett. 1983, 50, 2017–2020. [Google Scholar] [CrossRef]
- Cabrera, N.; Garcia, N. Roughening transition in the interface between superfluid and solid He 4. Phys. Rev. B 1982, 25, 6057–6059. [Google Scholar] [CrossRef]
- Saenz, J.; Garcia, N. Classical critical behaviour in crystal surfaces near smooth and sharp edges. Surf. Sci. 1985, 155, 24–30. [Google Scholar] [CrossRef]
- Van Beijeren, H.; Nolden, I. Structure and Dynamics of Surfaces; Schommers, W., von Blancken-Hagen, P., Eds.; Springer: Berlin/Heidelberg, Germany, 1987; Volume 2, p. 259. [Google Scholar]
- Saito, Y. Self-Consistent Calculation of Statics and Dynamics of the Roughening Transition. Z. Phys. B 1978, 32, 75–82. [Google Scholar] [CrossRef]
- Pimpinelli, A.; Tonchev, V.; Videcoq, A.; Vladimirova, M. Scaling and Universality of Self-Organized Patterns on Unstable Vicinal Surfaces. Phys. Rev. Lett. 2002, 88, 206103. [Google Scholar] [CrossRef] [PubMed]
- Krug, J.; Tonchev, V.; Stoyanov, S.; Pimpinelli, A. Scaling properties of step bunches induced by sublimation and related mechanisms. Phys. Rev. B 2005, 71, 045412. [Google Scholar] [CrossRef]
- Krasteva, A.; Popova, H.; Akutsu, N.; Tonchev, V. Time scaling relations for step bunches from models with step-step attractions (B1-type models). AIP Conf. Proc. 2016, 1722, 220015. [Google Scholar]
- Akutsu, N.; Akutsu, Y. Thermal evolution of step stiffness on the Si (001) surface: Temperature-rescaled Ising-model approach. Phys. Rev. B 1998, 57, R4233–R4236. [Google Scholar] [CrossRef]

© 2017 by the authors. Licensee MDPI, Basel, Switzerland. This article is an open access article distributed under the terms and conditions of the Creative Commons Attribution (CC BY) license ( http://creativecommons.org/licenses/by/4.0/).