Abstract
Aquamarine, a popular variety of blue beryl, faces challenges in market valuation due to its reliance on subjective color assessment. This study investigates the coloration mechanism and establish a quantitative framework for assessing its color based on spectral and chromaticity analysis. We utilized electron probe microanalysis, ultraviolet-visible-near-infrared spectroscopy, laser Raman spectroscopy, and fiber optic spectroscopy to examine Brazilian aquamarine samples with varying blue intensities. The results indicate that the samples have high alkali metal (Na, K) content and low V/Cr content, consistent with the characteristics of high-alkali beryl. Ultraviolet spectroscopy reveals that the Fe3+-Fe2+ interaction (absorption at 620 nm) is the primary cause of blue coloration, while in deep blue samples, absorption at 956 nm decreases. Raman shifts (317 cm−1, 392 cm−1 Al-O bonds) correlate with TFeO content and chromaticity b value higher TFeO content corresponds to smaller Al–O peak shifts, and larger shifts are associated with higher b values (yellow hue). Specifically, increasing TFeO content leads to a shift of the Al-O Raman peak towards higher wavenumbers, and the magnitude of this shift is negatively correlated with the TFeO level. Based on hue angle (H) and saturation (S), we propose a classification method: “Light Blue” (H: 140–170, S ≤ 15), “Sky Blue” (H: 170–200, 15 < S ≤ 25), “Ocean Blue” (H: 200–230, 25 < S ≤ 35), and “Deep Blue” (H > 230, S > 35). This system provides a scientific basis for the quality assessment and market valuation of aquamarine.
1. Introduction
As an important mineral resource possessing dual attributes of being both a strategically rare metal and a high-grade gemstone raw material, beryl exhibits distinct economic stratification: its industrial-grade ore serves as the primary source for extracting beryllium metal, while crystals reaching gem-quality can be cut and polished into precious gemstones such as emerald and aquamarine. Global beryl deposits are primarily distributed in Colombia, Brazil, Zambia, Russia, Zimbabwe, Madagascar, Pakistan, Afghanistan, Canada, and China. As a major producing region, Brazil hosts significant deposits including the Itabira-Nova Era mining district in Minas Gerais, along with the Belmont, Piteiras, and Capoeirana mines; the Socotó and Carnaíba mines in Bahia; the Santa Terezinha mine in Goiás; and the Paraná and Fazenda Bonfim mines in Rio Grande do Norte [1]. The ideal chemical formula of beryl is Be3Al2 [Si6O18]. Its crystal structure consists primarily of [BeO4]6− tetrahedra and [AlO6]9− octahedra linking [SiO4]4− tetrahedra. Six adjacent [SiO4]4− tetrahedra share oxygen atoms, forming [Si6O18]12− six-membered rings [2]. The [AlO6]9− octahedra and [BeO4]6− tetrahedra connect via shared edges, arranged around these rings. Parallel to the c-axis, the center of the silicon-oxygen ring forms a structural channel with relatively good connectivity. This channel can host water molecules, specifically two distinct types: Type I and Type II water [3]. Morphologically, beryl crystals often exhibit a long prismatic habit, while alkali-rich crystals tend to be short-prismatic. Common crystal forms are dominated by the hexagonal prism, followed by the hexagonal bipyramid. Prism faces typically display longitudinal striations, which are more pronounced in alkali-free crystals [4]. Beryl commonly exhibits various types of isomorphic substitution. Be2+ within the [BeO4]6− tetrahedra can be replaced by Li+. Similarly, Al3+ within the [AlO6]9− octahedra can be substituted by ions such as Fe3+, Sc3+, Cr3+, V3+, Fe2+, Mg2+, and Mn2+ [5]. The coloration mechanism stems from systematic isomorphic substitutions within the crystal lattice. Different substitution mechanisms produce different colors. Beryl varieties present in the market include green, blue, pink, colorless, red, and yellow, classified accordingly as emerald, aquamarine, morganite, goshenite, red beryl, and heliodor. Existing literature has analyzed aquamarine from the perspective of color formation, but research on its chromatics is lacking [6,7,8,9].
Therefore, this paper takes aquamarine as the subject, conducts further research on its chromatics and color-forming mechanism, and quantifies and grades its color based on the analysis of aquamarine chromatics data.
2. Materials and Methods
2.1. Materials
A total of 21 natural aquamarine samples were collected for this study, all sourced from Brazil. Figure 1 shows the photographic documentation of the specimens, with diameters ranging from 0.5 cm to 1.5 cm.
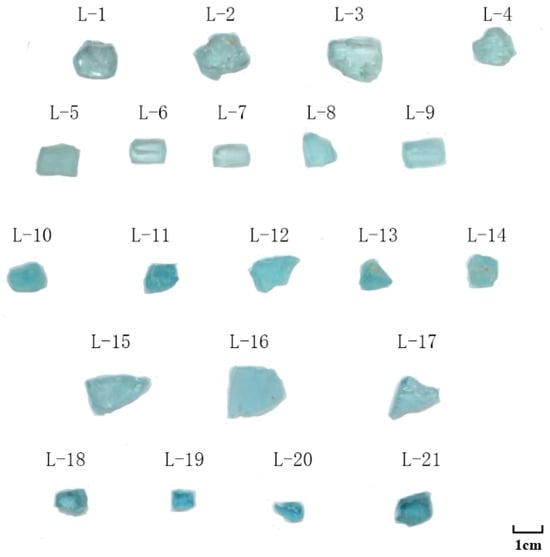
Figure 1.
Aquamrine samples.
2.2. Methods
Chemical composition analysis was conducted via electron probe microanalysis (EPMA) using a Shimadzu EPMA-1720H (Shimadzu Corporation, Kyoto, Japan) instrument at the Electron Microscopy Laboratory of Kunming University of Science and Technology Analysis and Testing Center. The analysis employed backscattered electron detection under operational parameters of 15 kV accelerating voltage, 10 μm beam diameter, and ×1000 magnification, with calibration performed using certified natural mineral and synthetic oxide reference standards.
UV-Vis spectra were measured using an FUV-007 ultraviolet-visible-near- infrared spectrophotometer (Fable, Shenzhen, China). The measurements were conducted over a wavelength range of 220–1000 nm under D65 illumination, with an integration time of 80 ms and 10 scans. All tests were performed in reflectance mode.
Raman spectroscopy was performed using a Lab RAM HR Evolution micro-confocal laser Raman spectrometer (HORIBA Scientific, Grabels, France). The parameters were: laser wavelength 785 nm, laser energy 30 mW, exposure time 3.0 s, wavenumber range 29–3300 cm−1, and spot size 50 × 400 μm. Use monocrystalline silicon for calibration at the beginning of each test.
Chromaticity analysis was conducted using an Ocean Optics USB2000+ fiber optic spectrometer (Ocean Optics, Dunedin, FL, USA) with an integrating sphere for collecting reflected signals from sample surfaces. Measurements covered the 380–1000 nm spectral range under CIE standard illuminant D65 with a 10° observer, employing 10-nm wavelength intervals and a 2500-μs integration time.
3. Results
3.1. Electron Probe Microanalysis (EPMA)
Samples were selected from 2–3 specimens per color grade (11 samples total), with triplicate measurements averaged per sample (Table 1). Specifically, FeO represents total iron content (Fe2+ + Fe3+) hereafter denoted as TFeO. Since EPMA cannot detect elements with atomic numbers below 5 (H, Be, and Li), the oxygen stoichiometry method was used to calculate BeO content in aquamarine based on its ideal chemical formula with O = 18. Be ion counts obtained via oxygen stoichiometry were used to estimate Li content through the empirical formula:
while water content was calculated using:
Li = 3 − Be
H2O (%) = 0.84959 × Na2O%.

Table 1.
Aquamrine EMPA analyses. Oxides are in wt.%, elemnts are in apfu (atoms per formula unit).
The calculated H2O values represent only the quantified component, excluding molecular water in fluid inclusions and structural water [10].
Test results are shown in Table 1. The composition of aquamarine is as follows: The main elements of aquamarine are Si, Al, and Be, with minor elements including Ca, Fe, Cr, Ti, V, and some alkali metal elements such as Na and K. The average chemical formula is Be2.867 (Li0.132) (Al2.195Fe0.116Mg0.071Ti0.014P0.029V0.002Cr0.005Ca0.007Zn0.018) Si5.69O18 (Na0.181K0.070). Results indicate high alkali metal content in all samples with low vanadium content, confirming a high-alkali low-vanadium beryl type.
3.2. UV-Vis Spectroscopy Analysis
Two to three measurement points in different orientations were tested per sample. The most representative spectrum was selected for final analysis, while spectra containing atypical peaks were retained for concurrent analysis. Experimental results are presented in Figure 2. Experimental analysis shows absorption peaks of aquamarine observed at 300 nm, 315 nm, 324 nm, 370 nm, 428 nm, 610 nm, 817 nm, and 956 nm, demonstrating typical Fe-related spectral absorption characteristics. The weak absorption bands at 324 nm and 315 nm are produced by charge transfer between Fe3+ and O2− [11]. The absorption at ~370 nm results from Fe3+ substitution for Al3+ at octahedral sites, corresponding to the 6A1→4F2 d-electron transitions in Fe3+ [12]. These three absorption bands (315 nm, 324 nm, 370 nm) occur in the UV region and do not affect aquamarine’s color. The absorption band at 428 nm originates from Fe3+ substitution for Al3+ at octahedral sites corresponding to 6A1→4A1 d-electron transitions in Fe3+ [12] or from Fe3+ in structural channels or interstitial sites. This absorption generates a yellow tint in aquamarine. These transitions are spin-forbidden [6,7,8], but exhibit weak absorption intensity, thus exerting minimal influence on color hue. The broad absorption band at 620 nm is generated by intervalence charge transfer within Fe3+-Fe2+ pairs. The absorption in this band and near 700 nm covers the orange, yellow, and red regions of visible light. By absorbing these wavelengths, blue light transmission is enhanced, constituting the fundamental mechanism for aquamarine’s blue coloration. The broad absorption band centered at 817 nm originates from Fe2+, Fe2+ substitution for Al3+ at octahedral sites, the spin-allowed 5A1 (5T2)→5E (5E) transition of Fe2+, and Fe2+ in structural channels, collectively determining the absorption bandwidth [8]. As this band lies in the NIR region, it contributes negligibly to aquamarine’s color. However, studies indicate [9] that when its intensity exceeds a critical threshold, the short-wavelength edge extends into the visible spectrum, potentially influencing beryl coloration. The absorption at 956 nm results from Fe2+ substitution for Al3+ at octahedral sites.
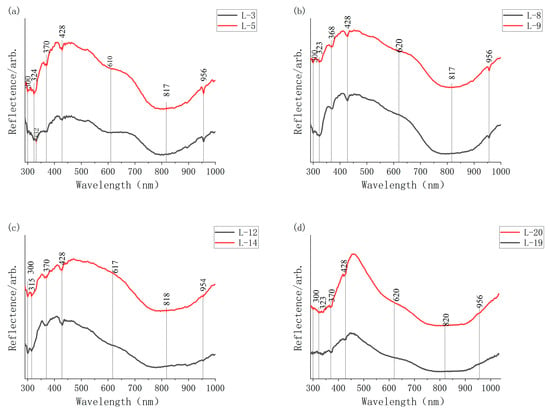
Figure 2.
UV-VIS-NIR spectroscopy. (a) samples L-3, L-5; (b) samples L-8, L-9; (c) samples L-12, L-14; (d) samples L-19, L-20.
3.3. Raman Spectroscopy Analysis
Raman measurements were performed at three points in different orientations for all 21 samples. The most representative spectrum from each sample was selected for analysis, while spectra exhibiting atypical peaks were retained for concurrent analysis. Typical results are presented in Figure 3.

Figure 3.
(a) 250–1500 cm−1 band diagram of Raman spectra of some samples. (b) Raman spectr Al-O peak in the frequency range from 250 to 500 cm−1.
Peaks near 316 cm−1 are assigned to Al-O bending external vibrations, while those at 389 cm−1 correspond to Al-O deformation external vibrations. Peaks around 439 cm−1 and 519 cm−1 arise from O-Be-O bending external vibrations. The 678 cm−1 peak originates from Si-O-Si deformation internal vibrations. Peaks near 1002 cm−1 and 1062 cm−1 are attributed to Be-O non-bridging oxygen stretching external vibrations and Si-O non-bridging oxygen stretching internal vibrations, respectively. A weak peak near 1128 cm−1 indicates water complex ions in beryl’s structural channels [13,14,15].
Comparative analysis of all spectra reveals significant shifts in Al-O peaks across aquamarine samples, with the magnitude of shift varying with color tone (Figure 3). The reason for the shift in the Al-O peak caused by the comparison with the standard peak positions of 321,396 cm−1 in aquamarine is due to the substitution of Al3+ by Fe3+ and Fe2+ in beryl. The ionic radius of Fe2+ (0.780 Å), and that of Fe3+ (0.645 Å), both of which are larger than the ionic radius of Al3+ (0.535 Å). When larger-radius cations substitute for Al3+, the Al-O bond length lengthens and bond strength decreases, resulting in Al-O peak migration toward lower wavenumbers—a spectroscopic red shift. Compared with previous research data [3,7,9,10,11,12,13,14,15] and in conjunction with the experimental analysis in this paper, samples with lighter hues exhibit a greater degree of red shift, while samples with darker hues show a smaller degree of red shift. The degree of shift tends to decrease as the color becomes darker.
3.4. Chromaticity Experiment Analysis
The HSV color space was employed, where H (Hue) represents the hue parameter ranging from 0°~360°. Red corresponds to 0°, with values increasing counterclockwise: green at 120°, blue at 240°. Complementary colors are: yellow at 60°, cyan at 180°, and purple at 300°. S (Saturation) represents color saturation ranging from 0~100%. Higher saturation corresponds to more intense colors, while lower saturation indicates paler colors. V (Value) denotes brightness, also ranging from 0%~100%. Higher brightness signifies lighter colors, with 0% brightness representing pure black. This color space provides excellent separation, enabling intuitive visualization of hue, color vividness, and lightness levels, thus facilitating efficient color grading.
For all 21 aquamarine specimens, three measurement points were tested per sample, with the final results representing the average of these triplicate measurements. Experimental data are listed in Table 2.

Table 2.
Aquamarine HSV chromaticity test results.
Experimental results show color parameters within the ranges: H ∈ (142.21, 210.77), S ∈ (8.18, 35.94), V ∈ (94.47, 100). Using H as θ and S as r, a radial scatter plot was generated (Figure 4). The color distribution spans pale blue-green to light blue tones, with higher S observed when H approaches true blue (240°). Under the D65 light source, aquamarine exhibits the highest luminosity, pure and vivid colors, and good color rendering, making it the optimal light source for grading aquamarine colors. The color of the sample is graded by simulating color blocks and combining hue angle H and saturation S for aquamarine. The color block simulation is done using qtccolor software, and by importing the chromaticity data of the test sample, the corresponding color swatch can be obtained.
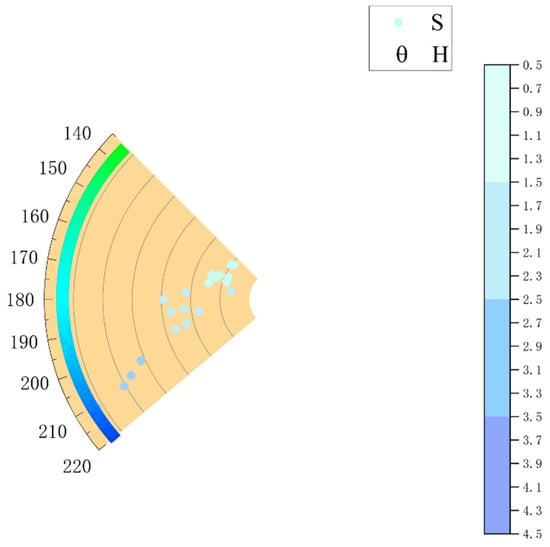
Figure 4.
Aquamarine chromaticity distribution.
Based on experimental data, aquamarines are graded as follows: Light Blue: H ∈ [140~170) and S ≤ 15 (Table 3), Sky Blue: H ∈ [170~200) and 15 < S ≤ 25 (Table 4), Ocean Blue: H ∈ [200~230) and 25 < S ≤ 35 (Table 5), Deep Blue: H > 230 and S > 35 (Table 6). Due to the rarity and high value of deep blue aquamarines, the collected samples did not meet the chromatic criteria for this grade (H > 230 and S > 35). Consequently, representative color block simulations were exclusively employed for this classification tier.

Table 3.
Light blue series.

Table 4.
Sky blue series.

Table 5.
Ocean blue series.

Table 6.
Deep blue series.
4. Discussion
Analysis of electron probe microanalysis (EPMA) data and chromaticity data revealed that as the color deepens, the total TFeO content increases, exhibiting a positive correlation trend (see Figure 5). Higher TFeO content corresponds to a higher hue angle H, shifting the color closer to pure blue. This confirms the close relationship between the color of aquamarine and its iron content.
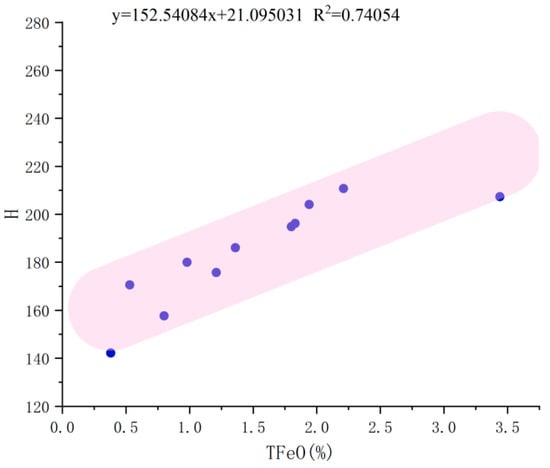
Figure 5.
Correlation plot of hue angle H with TFeO.
Additionally, analysis of UV-Vis-NIR spectroscopy and chromaticity data revealed that the absorption peak at 956 nm attenuated and eventually disappeared as the color deepened. This suggests a reduction in Fe2+ substitution for Al3+ within the crystal structure with increasing color saturation. These findings provide evidence suggesting that the color of aquamarine is correlated with the extent of Fe substitution.
Combining Raman data and electron probe data, it is further found that as aquamarine color deepens, the degree of Al-O peak shift shows a decreasing trend. This reasonably infers that when color is light, the probability of Al being replaced by Fe is higher; when color deepens, Fe content increases, but only a portion of Fe replaces Al. Most Fe more readily undergoes Fe3+-Fe2+ charge transfer, making greater contributions to its blue tone. The experimental methodology involved quantifying the Raman shift of the Al-O vibrational mode, observed at approximately 310 cm−1. A reference peak position of 321 cm−1 was used for comparison. The absolute shift, denoted as ΔH, was calculated by subtracting this reference value from the measured Al-O peak positions in samples with different colour tones (see Table 7). The ΔH parameter was then plotted against the TFeO content, as measured by electron probe microanalysis (Figure 6). The results showed a clear negative correlation, indicating that the magnitude of the Al-O peak shift decreases significantly with increasing TFeO content.

Table 7.
Absolute values of Aquamarine Raman Al-O peak shifts.
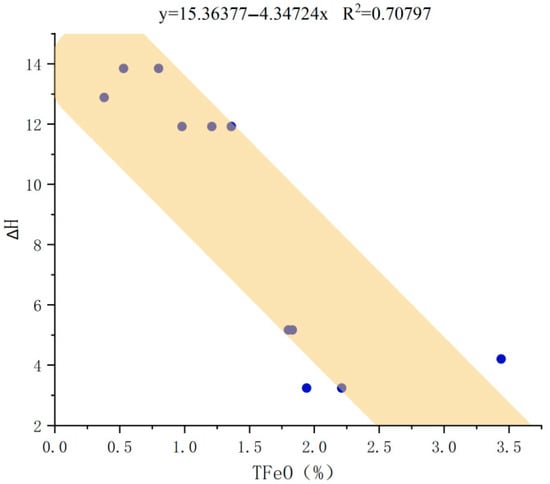
Figure 6.
Correlation plot between ∆H and TFeO.
To investigate the influence of Al-O bond substitution on color parameters further, an experiment was designed to examine its correlation with color variation. As the color intensification, the degree of Al-O bond substitution decreases. The absolute Raman shift value (∆H) was selected as the independent variable and plotted against the color parameters. In this study, the b-value in the CIE 1976 Lab color space was adopted as the primary color metric. In this system, L* represents lightness, ranging from 0 (black) to 100 (white). Meanwhile, a* and b* are chromaticity coordinates; positive a* indicates red, negative a* indicates green, positive b* indicates yellow, and negative b* indicates blue. HSV color data were programmatically converted into Lab values. The Lab color space was chosen for its perceptual uniformity and device independence, particularly the relevance of the b-axis to yellow-blue variation, which is critical for this study. Conversion results are reported in Table 8, and the final fitting results are shown in Figure 7.

Table 8.
Aquamarine HSV chroma to Lab chromaticity conversion results.
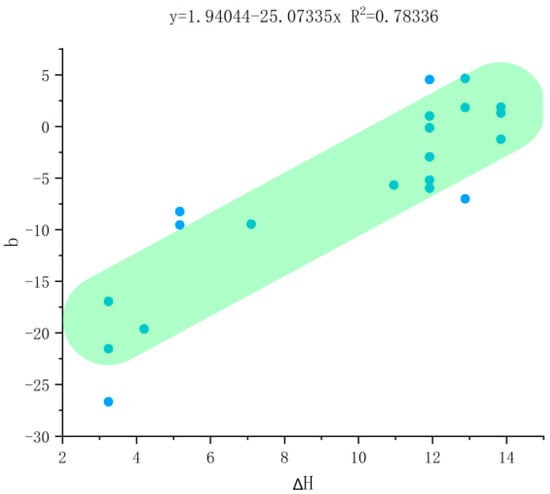
Figure 7.
Correlation plot between b values and ∆H.
Experimental results reveal a clear positive correlation between the shift amount of the Al-O peak and the b-value. A larger Al-O peak shift corresponds to a higher b-value, indicating a yellower color; conversely, a smaller shift correlates with a lower b-value, signifying a bluer hue. This suggests that in high-blue samples, where Fe partially substitutes for Al, the abundant remaining Fe preferentially forms Fe3+-Fe2+ electron pairs. A greater aggregation of these electron pairs occupies T3 sites [16] (an unoccupied tetrahedral site formed by one oxygen atom shared solely with Si4+ and three oxygen atoms shared with Si4+, Be2+, and Al3+) and other lattice interstices, ultimately rendering the aquamarine color bluer.
5. Conclusions
This study focuses on Brazilian aquamarine, systematically investigating its compositional characteristics, coloration mechanisms, and chromatic properties. Experimental results demonstrate that this batch of aquamarine exhibits sodium-rich, magnesium-rich, potassium-rich, and low-vanadium features, classifying as high-alkali low-vanadium beryl. Aquamarine with higher Fe content shows bluer coloration. Different substitution degrees of TFe for Al change the color of aquamarine. A small amount of TFe substituting for Al, and a large amount of TFe forming Fe3+-Fe2+, make the aquamarine color bluer. Based on color principles, aquamarine is classified into four series: Light Blue, Sky Blue, Sea Blue, and Deep Blue. These experimental results demonstrate that ionic substitution behavior affects the crystal lattice of aquamarine, thereby influencing its coloration mechanisms. This provides a novel method and research model for studying beryl coloration mechanisms, while also offering a color grading approach, it holds significant practical significance and application prospects for future value assessment of aquamarine.
6. Patents
This work resulted in a patent: Method for Aquamarine Color Grading.
Author Contributions
Conceptualization, S.Y. and E.Z.; methodology, S.Y.; software, Z.Z.; investigation, Z.Z., S.Y. and D.W.; resources, Z.W. and Y.W.; writing—original draft preparation, Z.Z., S.Y., Y.S. and E.Z.; writing—review and editing, Z.Z., Z.W. and S.Y.; supervision, E.Z. and S.Y.; funding acquisition, S.Y., X.H. and E.Z. All authors have read and agreed to the published version of the manuscript.
Funding
This research was funded by the National Natural Science Foundation of China (Grant No. 41963003), Scientific Research Fund of Yunnan Provincial Department of Education (No. 2025J0078) and Analysis and Testing Fund of Kunming University of Science and Technology (No. 2022T20160056).
Data Availability Statement
All data are included in the article; further inquiries can be made to the respective authors.
Acknowledgments
We sincerely thank all supervising professors for their academic guidance on this paper, express gratitude to Kunming Customs for providing experimental technical support, and deeply appreciate our fellow research group members for their invaluable assistance.
Conflicts of Interest
The authors declare no conflicts of interest.
References
- Zheng, Y.Y.; Yu, X.Y.; Xu, B.; Guo, H.S.; Yan, Y.; Zhang, Y.; Tang, J.; Zhao, S.Y. A review on origin identification of emeralds. Acta Mineral. Sin. 2024, 43, 525–561. [Google Scholar] [CrossRef]
- Gorshunov, B.P.; Zhukova, E.S.; Torgashev, V.I.; Lebedev, V.V.; Shakurov, G.S.; Kremer, R.K.; Pestrjakov, E.V.; Thomas, V.G.; Fursenko, D.A.; Dressel, M. Quantum Behavior of Water Molecules Confined to Nanocavities in Gemstones. J. Phys. Chem. Lett. 2013, 4, 2015–2020. [Google Scholar] [CrossRef] [PubMed]
- Wang, K.; Gan, F.X.; Zhao, H.X. Non-destructive analysis of chemical composition, structure, and phases in natural beryl gemstones. J. Chin. Ceram. Soc. 2015, 43, 10. [Google Scholar] [CrossRef]
- Wu, J.M.; Hu, X.K.; Li, Y.X. Research status and geological implications of beryl. Adv. Geosci. 2022, 12, 1427–1433. [Google Scholar] [CrossRef]
- Bakakin, V.V.; Rylov, G.M.; Belov, N.V. Crystal structure of lithium-bearing beryl. Dokl. Akad. Nauk SSSR 1969, 188, 659–662. [Google Scholar]
- Andersson, L.O. The yellow color center and trapped electrons in beryl. Can. Mineral. 2013, 51, 15–25. [Google Scholar] [CrossRef]
- Spinolo, G.; Fontana, I.; Galli, A. Optical absorption spectra of Fe2+ and Fe3+ in beryl crystals. Phys. Status Solidi B 2010, 244, 4360–4369. [Google Scholar] [CrossRef]
- Qi, L.J.; Ye, S.; Xiang, C.J.; Pei, J.C.; Luo, Y.A. Color centers and chromogenic mechanisms in irradiated beryl. Geol. Sci. Technol. Inf. 2001, 20, 25–28. [Google Scholar] [CrossRef]
- Wu, X.; Han, X.Z.; Feng, X.Q.; Guo, S.G. Lattice occupancy and chromogenic mechanism of iron ions in beryl. Acta Mineral. Sin. 2023, 42, 577–590. [Google Scholar] [CrossRef]
- Dong, J.Y.; Huang, F.; Wang, D.H. Geochemical characteristics and geological implications of beryl from different types of beryllium deposits. Acta Petrol. Sin. 2023, 39, 2153–2166. [Google Scholar] [CrossRef]
- Cui, S.Y.; Shen, J.Q.; Xu, B. Gem-mineralogical characteristics of aquamarine from three origins. China Gems Jades 2022, 32, 8. [Google Scholar]
- Ding, Z.L.; Jiang, Y.; Yu, L.; Yang, Y.M.; Zuo, Y.; Tang, Y.T. Study on the spectral characteristics of aquamarine from Renli, Hunan Province. World Nonferrous Met. 2022, 37, 152–155. [Google Scholar] [CrossRef]
- Qi, L.J.; Ye, S.; Xiang, C.J.; Pei, J.C.; Shi, G.H. Vibrational spectroscopy and irradiation cleavage of complexes in beryl channels. Geol. Sci. Technol. Inf. 2001, 20, 18–22. [Google Scholar] [CrossRef]
- Karampelas, S.; Al-Shaybani, B.; Mohamed, F.; Sangsawong, S.; Al-Alawi, A. Emeralds from the Most Important Occurrences: Chemical and spectroscopic data. Minerals 2019, 9, 561. [Google Scholar] [CrossRef]
- Gao, R.; Chen, Q.L.; Ren, Y.N.; Bao, P.J.; Huang, H.Z. Gemological and spectroscopic characteristics of Kagem emeralds from Zambia. Spectrosc. Spect. Anal. 2023, 43, 3186–3192. [Google Scholar]
- Andersson, L.O. Comments on beryl colors and on other observations regarding iron-containing beryls. Can. Mineral. 2019, 57, 551–566. [Google Scholar] [CrossRef]
Disclaimer/Publisher’s Note: The statements, opinions and data contained in all publications are solely those of the individual author(s) and contributor(s) and not of MDPI and/or the editor(s). MDPI and/or the editor(s) disclaim responsibility for any injury to people or property resulting from any ideas, methods, instructions or products referred to in the content. |
© 2025 by the authors. Licensee MDPI, Basel, Switzerland. This article is an open access article distributed under the terms and conditions of the Creative Commons Attribution (CC BY) license (https://creativecommons.org/licenses/by/4.0/).


