Abstract
Illitic clays are one of the most important materials used in the ceramic industry. Carbonates support the densification and the sintering of ceramics. Five mixtures of illitic clay with calcite were prepared aiming for the crystallization of anorthite ceramics. The stoichiometric ratio of anorthite crystallization was determined at 21.6 wt.% of calcite content. To reveal the effect of calcite on the crystallization processes, two more mixtures were prepared below the stoichiometric composition (17.6 wt.% and 19.6 wt.%) and two more mixtures above the ideal composition (23.6 wt.% and 25.6 wt.%). X-ray diffraction revealed that gehlenite and Ca-feldspar were formed, which are the intermediate phases in anorthite crystallization. However, due to the low purity of illitic clay and the low firing temperature, no anorthite formation was observed. The influence of calcite content on Young’s modulus was negligible. However, a clear effect on the open porosity was revealed.
1. Introduction
Illitic clays are one of the most abundant materials frequently used in the production of traditional ceramic products—pottery, tiles, etc. []. The dominant mineral phase is illite crystallizing in the monoclinic system with three repeating sheets—tetrahedral, octahedral, and tetrahedral. Between each layer, an interlayer cation is located (potassium ion in most cases) or remains vacant. The vacant interlayer places are then occupied by water molecules [,]. Illite has several polytypes with the most frequent being the M1. The general (theoretical) formula of the mineral illite can be expressed as []
However, the composition may vary depending on the origin of the clay. Due to the wide variety of elements in the illitic clay the high temperature crystallization processes can be tailored by addition of different admixtures. This allows the preparation of anorthite ceramics from illitic clays. Authors of [] used a mixture of illitic clay and wollastonite to prepare anorthite ceramics. The addition of wollastonite supported the anorthite crystallization at temperatures as low as 1115 °C. However, Lu et al. [] revealed, that if the SiO2/CaO+FeO ratio surpasses 1.1 and the amount of SiO2 is above 20 wt.%, no anorthite crystallization occurs in a mixture synthetic slag samples.
Anorthite ceramics were prepared from a mixture of illitic clay and calcite by the authors of []. The authors used a high-purity illitic clay mixed with laboratory grade calcite in the stoichiometric ratio of anorthite, which was subsequently heated to 1150 °C. In the final product, anorthite and gehlenite were identified as the dominant mineral phases. However, due to the potassium content of the illitic clay, crystallization of leucite was also observed. Authors of [] investigated the carbonate and silicate phase reactions during the firing process of ceramics. The authors revealed that the presence of carbonates supported the crystallization of various mineral phases (gehlenite, wollastonite, diopside, and anorthite) on the carbonate-silicate sites. The crystallization of the aforementioned mineral phases was supported by viscous flow combined with reaction-diffusion process. Anorthite based ceramics were prepared at 1150 °C from metallurgical waste and fly ash. The samples manifested a 80 MPa bending strength and 5% water absorption []. The preparation temperature of anorthite ceramics can reach as high as 1300–1400 °C if pressure-less sintering is applied [,]. However, if plasma synthesis and natural raw materials are used, the preparation temperature decreases as low as 950 °C [].
Ca-carbonates in ceramics act as flux agents supporting the sintering process and lowering the sintering temperature []. However, if the carbonate content surpasses a certain level, its presence limits the extent of vitrification due to the lower content of silicates []. The addition of an optimal amount of CaO improves the mechanical strength, lowers the firing shrinkage and firing temperature, and decreases the porosity [,,,]. The influence of different CaO sources on the preparation of anorthite-based ceramic was studied in []. The authors revealed that prior to anorthite crystallization at 1200 °C, a layered aluminosilicate phase (LAS) was formed. A similar observation was made in the mixture of kaolinite and CaCO3 []. In addition, anorthite exists in several polymorphs—(pseudo)hexagonal, (pseudo) orthorhombic, and stable triclinic. The transformation of polymorphs into the stable triclinic structure reportedly occurs up to 1250 °C [,].
Young’s modulus (E) represent the deformation induced by stress variations and serve as fundamental parameters for engineering structure design []. Young’s modulus is substantially influenced by the composition, as well as by the porosity of the materials. Asmani et al. [] reported a linear decrease in the value of E with a rising porosity in alumina ceramics. If the porosity was not present, the value of E reached 396 GPa. However, when the porosity reached 25% the value of the E dropped to 163 GPa, highlighting the significant influence of the porosity. The porosity dependence reportedly is governed by contact area. In addition, the pore sizes and shapes have a considerable effect on the final value of E []. Authors of [] proposed a model for a prediction of the Young’s modulus depending on porosity and temperature for porous ultra-high temperature ceramics. A characteristic temperature was proposed at which the grain boundary sliding started to significantly influence Young’s modulus. Generally, Young’s modulus of ceramics manifests a decreasing character with an increasing temperature [].
Illitic clays play a key role in the ceramic industry. The knowledge of their mixtures with various additives is, therefore, of particular importance. Calcite, in addition to its favorable effects listed above, also supports the crystallization of anorthite ceramics. The aim of this paper is, therefore, to examine the effect of the calcite amount added to the illitic clay on the phase transformations and the evolution of Young’s modulus after firing at various maximum temperatures. To provide a deep understanding of the processes running in the prepared mixtures, auxiliary thermal analyses—differential scanning calorimetry and thermogravimetry were performed.
2. Materials and Methods
The illitic clay (Fuzerradvany, Hungary, Table 1) was processed and prepared in three steps. Initially, the clay was crushed using a mechanical tool, followed by milling using the Retzsch PM100 planetary ball mill (Retsch GmbH, Haan, Germany). To obtain a fine powder, the milled illitic clay was sieved and only the fraction with particle sizes below 100 μm was used for sample preparation. Laboratory-grade CaCO3 was added to the illitic clay in 5 different weight percentages: 17.6, 19.6, 21.6, 23.6, and 25.6. The amount of CaCO3 addition was designed to lie in the vicinity of the stochiometric ratio for anorthite crystallization (21.6 wt.% of CaCO3 addition). To enhance the ductility of the samples and reduce brittleness, a 3% polyvinyl alcohol (PVA) solution was added at a concentration of 6 wt.% to the powder mixtures. Rectangular samples with dimensions of 7.5 × 8.5 × 100.5 mm3 were fabricated from the powder mixtures using a hydraulic press at a pressure of 21 MPa.

Table 1.
Chemical composition of the illitic clay (in wt.%).
Differential scanning calorimetry was performed on the Netzsch Pegasus 404 F3 (Netzsch-Gerätebau GmbH, Selb, Germany) facility up to 1200 °C with a heating rate of 5 °C/min in Ar atmosphere on powder samples (~50 mg).
The prepared samples were investigated in terms of Young’s modulus, bulk density, and porosity measurements. The samples were fired in steps of 100 °C up to 900 °C. Above this temperature the step size was decreased to 50 °C up to the highest firing temperature of 1200 °C. After cooling the samples, Young’s modulus, bulk density, and porosity were measured.
To determine the Young’s modulus, a custom-designed apparatus was employed []. The rectangular specimen (7.5 × 8.5 × 100.5 mm3) was positioned on two supports, strategically placed at the nodal points of the excited standing waves. A small steel ball was utilized to induce the formation of standing waves within the sample. A microphone, placed in proximity to the specimen, captured the acoustic signal emitted by the sample. The recorded signal was subsequently processed using specialized computer software to identify the resonant frequency. The Young’s modulus was then calculated (according to ASTM Standard C1259-15) from the following equation []:
where m is the weight of the sample, l is the length of the sample, b is the thickness of the sample, f is the resonant frequency, and T1 is a correction coefficient. The correction coefficient is influenced by the thickness-to-length ratio and Poisson’s ratio. However, the precise value of Poisson’s ratio was unknown, necessitating the use of an approximate value (0.2) for all measurements. Data was collected from five samples for each mixture, with each sample being gradually fired at the specified temperatures.
The density of the samples (7.5 × 8.5 × 20 mm3) was determined using the ATC Pycnomatic device (Thermo Scientific, Waltham, MA, USA) using He gas. From the measured values and calculated values of density (from the known dimensions and weight), the open porosity of the samples was calculated.
The microstructure of the samples was studied by a scanning electron microscope (SEM) Thermo Fisher Scientific Apreo 2 SEM (Waltham, MA, USA) equipped with EDAX energy-dispersive X-ray spectrometer (EDS, EDAX Inc., Mahwah, NJ, USA) with an accelerating voltage of 1 kV at a magnification of 500x in the Secondary Electron mode.
The phase composition of the prepared samples was analyzed using a PANalytical Aeris diffractometer (Malvern, UK) equipped with a CoKa tube, which operates at 40 kV and 7.5 mA. Measurements were conducted over an angular range of 5–85° with a step size of 0.0217°. Phase identification was carried out using the X’Pert HighScore software version 5.2 with access to the PDF-2 database of crystalline phases. Quantitative phase analysis was performed via Rietveld refinement in TOPAS V5, aiming to determine the weight percentages of all identified phases, following the methodology outlined in Refs. [,].
3. Results
Thermally activated processes running in the samples were monitored in terms of Differential Scanning Calorimetry (DSC), Figure 1. In the initial stages of heating (up to 200 °C) two distinct endothermic processes are visible on the DSC curves of the samples. The first peak, centered at ~70 °C was linked to the evaporation of the added water (contained in the PVA solution). The second peak, centered at 150 °C, represented the removal of the physically bound water from the sample. The next process observed during heating of the samples was the 2-step dehydroxylation of the illite, which was represented by two distinct endothermic peaks in the temperature interval from ~480 °C to 650 °C [,]. During this process, the chemically bound OH− groups are removed from the sample. After the dehydroxylation was finished, a significant endotherm represented the decomposition of CaCO3 according to the following reaction:
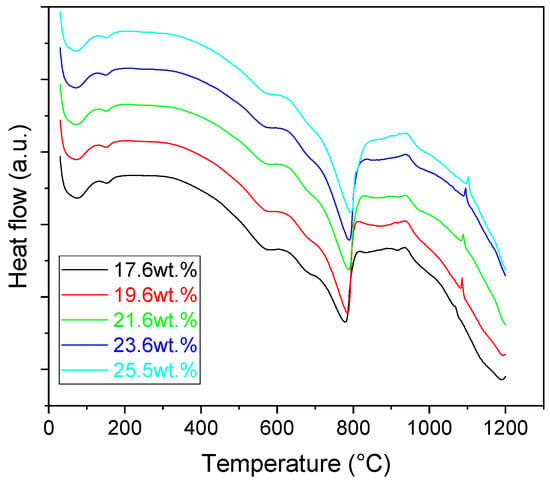
Figure 1.
DSC curves of the prepared mixtures.
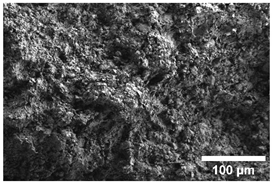
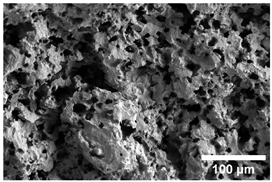
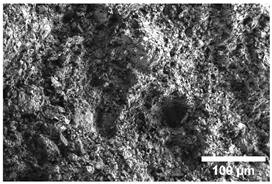
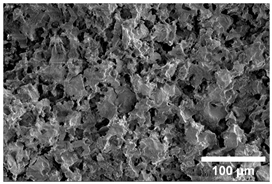
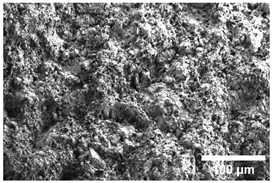
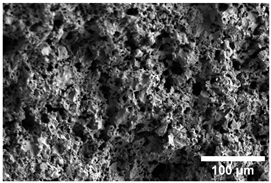
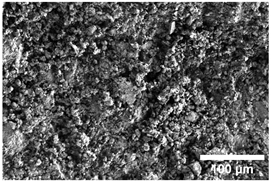
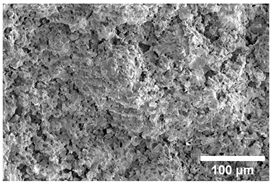
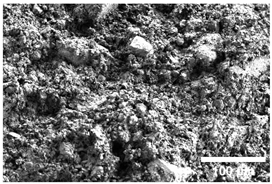
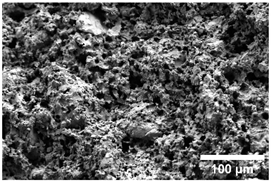
Once the decomposition was over crystallization processes started in the samples. The sample structure (Table 2) after the CaCO3 decomposition (830 °C) was compact without visible voids. Differences between the structures of the individual mixtures were not observed in this stage of firing. Samples fired at 830 °C consisted from muscovite as the dominant phase, with microcline, quartz, and portlandite as additional phases (Figure 2 and Table 3). Although portlandite decomposes at temperatures lower than the firing temperature (~420 °C portlandite decomposition temperature), its presence in the sample was expected. After decomposition of the calcite free lime was remaining in the samples structure. The free lime then upon cooling and during storage absorbed the atmospheric moisture, and, thus, portlandite was formed. A further increase in the temperature led to the appearance of an exothermic peak centered at ~940 °C, which was linked to the crystallization of new mineral phases. With increasing CaCO3, the peak broadened, suggesting that the CaO supported the crystallization process. In the Ca-rich regions, gehlenite tends to crystallize, while in the regions with moderate amount of Ca anorthite and/or Ca-feldspar was expected to form []. Indeed, XRD results after firing at 1000 °C revealed the presence of gehlenite and Ca-feldspar with amounts depending on the CaCO3 content in the samples. The lowest amount of gehlenite was manifested by the sample with the lowest initial CaCO3 content. The amount of gehlenite gradually increased with an increasing initial CaCO3 content reaching a maximum of 16 wt.% for the sample with 25.6 wt.% of added calcite. On the other hand, the evolution of the Ca-feldspar content did not follow a similar trend. The lowest amounts were observed in the samples prepared with 17.6 wt.%, 23.6 wt.%, and 25.6 wt.% of calcite. On the other hand, the highest amount of Ca-feldspar was manifested by the sample prepared with 19.6 wt.% of calcite. The Ca-feldspar phase is an intermediate phase of the anorthite. Their crystallographic lattices differ in the length of the c axis. In the case of calcite mixture with kaolin, the Ca-feldspar phase transformed into anorthite at higher temperatures []. In addition, a small amount of amorphous phase was identified in the samples fired at 1000 °C (Table 3). The increasing content of calcite supported the crystallization of C3S—the amount of C3S increased with an increasing calcite content. The exothermic peak at 1100 °C was linked to the crystallization process of wollastonite and leucite in the samples. Once the crystallization processes were finished, no other reactions were observed on the DSC curves. Previous studies reported the crystallization of gehlenite and anorthite in stochiometric mixtures of illite and CaCO3 [,,] and in the mixture of clay ceramics with waste calcite []. Indeed, the amount of gehlenite and Ca-feldspar increased with an increasing calcite content as well as with the rising firing temperature. Although the anorthite stoichiometry was calculated to be met with 21.6 wt.% of calcite addition, anorthite did not crystallize in the mixtures. Moreover, the sum of the gehlenite and Ca-feldspar contents varied only less significantly at all temperatures. However, the illitic clay used in this study was of lower purity, which resulted in the formation of various mineral phases. Therefore, the transformation of gehlenite and Ca-feldspar into anorthite was not observed, suggesting that higher sintering temperatures are needed to the reaction to run. In addition, the wide variety of elements contained in the initial illitic clay gave rise to the crystallization of wollastonite and leucite. The microstructure of the samples heated at 1200 °C (Table 2) manifested a porous character. Both macro- and micropores were observed on the SEM images. The samples exhibited a homogeneous structure, without any visible borders between the individual crystalline phases.

Table 2.
SEM images of the samples fired at 830 and 1200 °C.
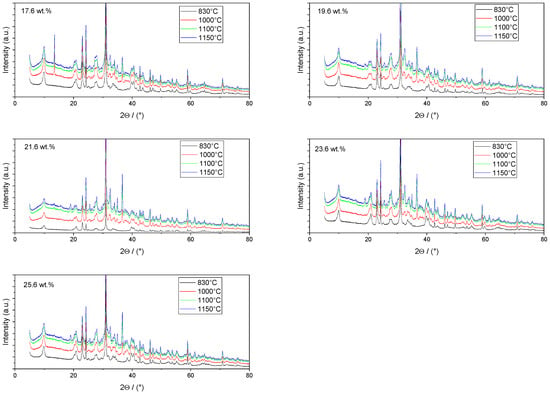
Figure 2.
XRD patterns of the prepared samples.

Table 3.
Phase composition of the fired samples (in wt.%).
Relative mass change (Figure 3) of the samples was measured after each firing temperature. In the initial stages (firing temperatures up to 200 °C), the removal of the physically bound water led to a decrease in the sample mass. The mass changes fell into a narrow interval between 1.1% (sample with 17.6 wt.% of CaCO3) to 1.9% (sample with 25.6 wt.% of CaCO3), with no significant influence of the CaCO3 content. Further firing up to 400 °C did not lead to a visible change in the samples mass. Above 400 °C, several processes ran in the samples starting with the dehydroxylation of portlandite followed with the dehydroxylation of illite. The corresponding mass losses ranged from 8 wt.% to 10 wt.% in the temperature interval from 400 °C to 800 °C. Further firing led to the decomposition of CaCO3, which led to a reduction in the samples mass being the highest for the sample with the highest amount of calcite addition. After these reactions ended, the samples mass did not manifest considerable changes. The total mass losses fell into the interval from 12.6 wt.% to 16.4 wt.% being the lowest for the sample with 17.6 wt.% of CaCO3 addition and the highest for the sample with 25.6 wt.% of calcite addition.
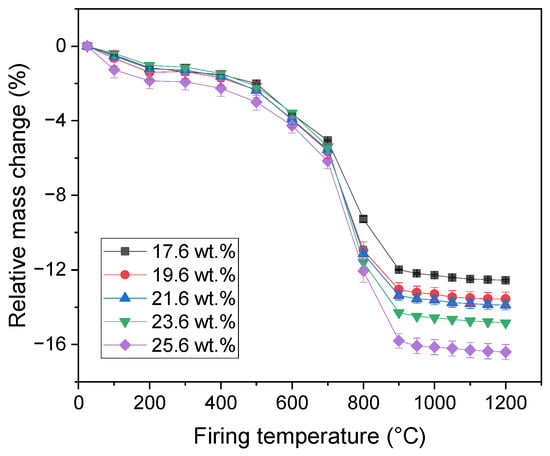
Figure 3.
Relative mass change in the samples.
The dimension of the samples manifested only a small contraction with increasing firing temperature up to the start of the illite dehydroxylation (Figure 4). In the temperature interval of the illite dehydroxylation (firing temperatures ranging from 400 °C to 800 °C), a significant expansion of the samples (up to 1.15%) was observed. Following the dehydroxylation, the decomposition of calcite led to a contraction of the samples. In the temperature interval from 900 °C to 1100 °C, only a less pronounced contraction of the samples was observed. Above 1100 °C, sintering of the samples started leading to a significant reduction in the samples dimensions. The highest overall length change was manifested by the sample with 19.6 wt.% of CaCO3, while the lowest was reached by the sample containing 25.6 wt.% of calcite, which was in agreement with previous results obtained on a ceramic body with calcite addition [].
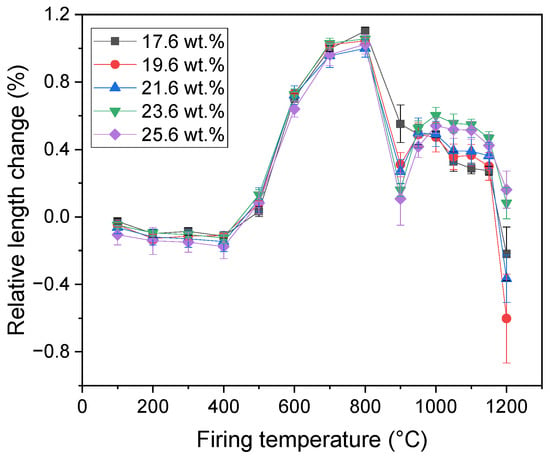
Figure 4.
Relative length change in the samples.
Matrix density of the samples (Figure 5) was measured after each firing temperature. The initial values of the raw samples ranged from 2.70 g/cm3 to 2.78 g/cm3. The increasing amount of CaCO3 did not influence the value of matrix density of the samples. However, after heating the samples at 100 °C and removing the adsorbed water from their structure, the matrix density of all samples increased. The highest value was manifested by the sample containing 23.6 wt.% of CaCO3 (3.02 g/cm3), while the lowest value was reached by the sample with the lowest amount of CaCO3 (2.82 g/cm3). Further firing the samples up to the start of the illite dehydroxylation had only a less significant increase in the bulk density of the samples. The dehydroxylation of illite resulted in a significant reduction in the bulk density up to 700 °C. Further increase in the firing temperature initially led to an increase in the matrix density at 800 °C, which was followed with a plateau region up to 900 °C. After the firing temperature exceeded this temperature, the sintering of the samples started, which led to a decrease in the observed matrix densities. Illitic clays are characterized by sintering assisted with viscous flow, which leads to an enhanced densification of the samples. However, if the diffusion of gaseous substances is slow, these molecules remain trapped in the glassy matrix forming closed porosity. The resulting matrix densities ranged from 2.67 g/cm3 to 2.82 g/cm3 for samples with 17.6 wt.% and 23.6 wt.%, respectively.
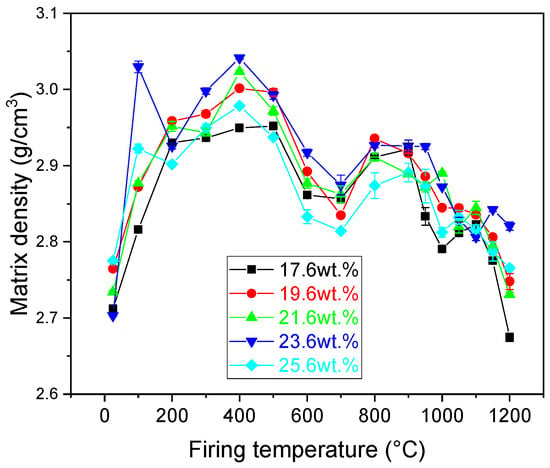
Figure 5.
Matrix density of the prepared samples.
Bulk density of the samples (Figure 6) was measured after each firing temperature. The highest values of the bulk density were manifested by the samples prior to heat treatment. The increasing amount of CaCO3 decreased the bulk density of the samples up to a CaCO3 content of 23.6 wt.%. Firing the samples up to the start of the illite dehydroxylation had only a less significant increase in the bulk density of the samples. A gradual decrease was observed. However, the dehydroxylation process resulted in a significant reduction in the bulk density up to 800 °C. Further increase in the firing temperature had only minor effects on the value of bulk density up to 1150 °C. At this temperature, the densification of the samples started resulting in an increase in the value of the bulk density. The values of the bulk density after heating at the highest temperature ranged from 1509 kg/m3 to 1653 kg/m3 for samples prepared with 25.6 wt.% and 19.6 wt.% of CaCO3, respectively.
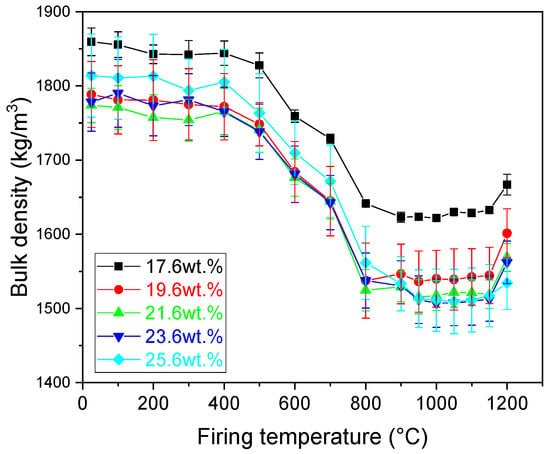
Figure 6.
Bulk density of the prepared samples.
Open porosity of the samples gradually increased with an increasing firing temperature. The pores were generated through the evaporation of the physically bound water as well as due to the dehydroxylation of illite in the samples. The rapid increase in the value of porosity between firing temperatures 700 °C and 900 °C was linked to the decomposition of CaCO3. A further increase in the firing temperature resulted in sintering of the samples, which in turn led to a decrease in the value of the open porosity. However, the open porosity of the samples remained relatively high, ranging from 38% to 44% (Figure 7).
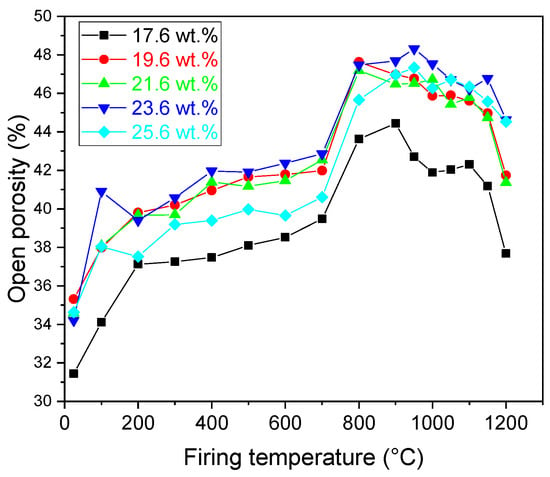
Figure 7.
Open porosity of the prepared samples.
Young’s modulus (E) of the samples manifested little changes upon firing up to 800 °C (Figure 8). Indeed, in this temperature region (apart from the illite dehydroxylation), no major changes were observed in the sample structure. Firing the samples at 900 °C led to a significant increase in the value of E. The values of E ranged from 9.3 (17.6 wt.% of CaCO3) to 11.2 (23.6 wt.% of CaCO3) GPa. Above 800 °C, the CaCO3 decomposed and the sintering of the sample started. During sintering assisted with viscous flow [], the interparticle bonding was enhanced, which resulted in the increase in the E. The increasing character of the E remained intact up to the firing temperature of 1000 °C, where a local maximum was reached. Further increase in the firing temperature led to a notable decrease in the values of E for all samples, which lasted up to 1100 °C. To recall, a considerable amount of amorphous phase was only identified in the samples fired at 1000 °C (Table 3), suggesting that at this temperature the glass-forming materials were trapped in the melt. Mechanical properties of amorphous phase are lower than that of the crystalline phases, thus leading to the observed decrease in the value of E. Above ~1000 °C, new mineral phases emerged and due to the high temperature, sintering assisted with viscous flow continued resulting in a stronger interparticle bonding. In turn, E started to increase with an increasing firing temperature (starting from 1100 °C) and as the Si and Ca ions reacted with other compounds to form crystalline phases. The values of E after firing at 1200 °C ranged from 13.8 to 17.4 GPa for the samples prepared with 25.6 and 17.6 wt.% of CaCO3, respectively.
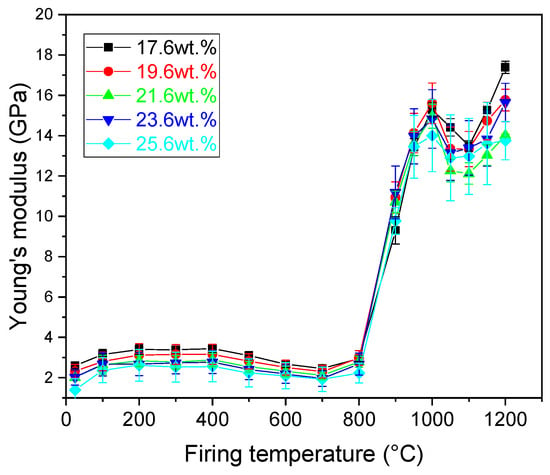
Figure 8.
Young’s modulus of the prepared samples.
Varying the amount of added CaCO3 did not have a significant effect on the E. All samples manifested similar behavior to that prepared with the stochiometric amount of CaCO3 for anorthite crystallization. Sample composition varied moderately/little with respect to the increasing amounts of CaCO3. One reason for this is the mixture of elements contained in the illite-smectite clay. Although the stochiometric amount of CaCO3 for anorthite crystallization was added, the crystallization of Ca-feldspar, a metastable phase that transforms to anorthite upon further heating, was observed. In places where excess CaO was present gehlenite formation arose, which gradually, with an increasing temperature, transformed to Ca-feldspar. Due to the potassium content of illite at temperatures around 1150 °C, leucite crystallizes, which generally leads to a small expansion of the sample. Moreover, a considerable amount of liquid phase was formed upon heating, which supported the sintering via viscous flow.
4. Conclusions
Mixtures of illitic clay with various amounts of calcite were studied. The mixtures were designed to lie in the stoichiometric composition of anorthite (21.6 wt.% of calcite added) with two compositions lying below this ratio (17.6 wt.% and 19.6 wt.%) and above this ratio (23.6 wt.% and 25.6 wt.%), thus allowing us to assess the effect of calcite content on the crystallization behavior, as well as on the Young’s modulus of the prepared ceramics after firing at various temperatures. The crystallization of anorthite was not observed in the mixtures. Instead, gehlenite, leucite, and Ca-feldspar emerged during firing due to the low purity of the applied illitic clay and a low sintering temperature (1150 °C). The potassium content of the illite supported the crystallization of leucite at high temperatures. Young’s modulus of the prepared ceramic (measured after firing at different temperatures varying from 100 °C to 1200 °C) did not exhibi a well-pronounced dependence on the calcite content. However, the influence of the different calcite additions was more significant on the open porosity and bulk density of the samples. The lowest porosity was manifested by the sample with the lowest calcite content (17.6 wt.%).
Author Contributions
Conceptualization, A.T. and Š.C.; methodology, A.T.; validation, Š.C., A.T., M.K. (Michal Knapek), P.M. and F.L.; formal analysis, Š.C. and A.T.; investigation, T.K., M.K. (Michal Knapek), P.M. and V.P.; data curation, T.K., M.K. (Martin Keppert), F.L. and V.P.; writing—original draft preparation, Š.C. and T.K.; writing—review and editing, Š.C. and A.T.; visualization, Š.C.; supervision, A.T.; project administration, T.K.; funding acquisition, T.K. All authors have read and agreed to the published version of the manuscript.
Funding
This research was supported by the Constantine the Philosopher University in Nitra, Grant No. VII/3/2024.
Data Availability Statement
The original contributions presented in the study are included in the article, further inquiries can be directed to the corresponding author.
Conflicts of Interest
The authors declare no conflicts of interest.
References
- Ferrari, S.; Gualtieri, A.F. The Use of Illitic Clays in the Production of Stoneware Tile Ceramics. Appl. Clay Sci. 2006, 32, 73–81. [Google Scholar] [CrossRef]
- Gualtieri, A.F.; Ferrari, S.; Leoni, M.; Grathoff, G.; Hugo, R.; Shatnawi, M.; Paglia, G.; Billinge, S. Structural Characterization of the Clay Mineral Illite-1M. J. Appl. Crystallogr. 2008, 41, 402–415. [Google Scholar] [CrossRef]
- Drits, V.A.; McCarty, D.K. The Nature of Structure-Bonded H2O in Illite and Leucophyllite from Dehydration and Dehydroxylation Experiments. Clays Clay Miner. 2007, 55, 45–58. [Google Scholar] [CrossRef]
- Viczián, I. Hungarian Investigation on the “Zempleni” Illite. Clays Clay Miner. 1997, 45, 114–115. [Google Scholar] [CrossRef]
- Sokolar, R.; Nguyen, M.; Vsiansky, D.; Pavelka, O.; Trník, A. The Effect of Wollastonite on Sintering of Anorthite Ceramic Body Based on Illite-Smectite Clay and Kaolin. Appl. Clay Sci. 2025, 270, 107774. [Google Scholar] [CrossRef]
- Lu, H.; Bai, J.; Vassilev, S.V.; Kong, L.; Li, H.; Bai, Z.; Li, W. The Crystallization Behavior of Anorthite in Coal Ash Slag under Gasification Condition. Chem. Eng. J. 2022, 445, 136683. [Google Scholar] [CrossRef]
- Csáki, Š.; Húlan, T.; Ondruška, J.; Štubňa, I.; Trnovcová, V.; Lukáč, F.; Dobroň, P. Electrical Conductivity and Thermal Analyses Studies of Phase Evolution in the Illite—CaCO3 System. Appl. Clay Sci. 2019, 178, 105140. [Google Scholar] [CrossRef]
- Cultrone, G.; Rodriguez-Navarro, C.; Sebastian, E.; Cazalla, O.; De La Torre, M.J. Carbonate and Silicate Phase Reactions during Ceramic Firing. Eur. J. Mineral. 2001, 13, 621–634. [Google Scholar] [CrossRef]
- Shen, C.; Huang, Y.; Zhang, Y.; Wu, X.; Tao, T.; Min, X.; Huang, Z.; Fang, M.; Liu, Y.; Mi, R. Preparation and Properties of Anorthite-based Ceramics by Using Metallurgical Solid Waste and Fly Ash. Int. J. Appl. Ceram. Technol. 2023, 20, 2301–2308. [Google Scholar] [CrossRef]
- Drewry, S.M.; Eccles, L.E.; Sickafus, K.E.; Wetteland, C.J.; Page, K. Preparation of High-Density Anorthite (CaAl2Si2O8) through Solid-State Synthesis and Uniaxial Hot-Pressing. J. Mater. Sci. 2024, 59, 1184–1195. [Google Scholar] [CrossRef]
- Li, X.; Wan, Y.; Tao, M.; Ma, C. Controllable Preparation and Multifunctional Application of High-Strength Porous Anorthite Ceramics. Ceram. Int. 2025, 51, 1566–1573. [Google Scholar] [CrossRef]
- Semenovykh, M.A.; Skripnikova, N.K.; Shekhovtsov, V.V.; Volokitin, O.G. Plasma Synthesis of Anorthite Using Natural Raw Materials. High Energy Chem. 2024, 58, S404–S409. [Google Scholar] [CrossRef]
- Heimann, R.B. Classic and Advanced Ceramics: From Fundamentals to Applications; Wiley-VCH Verlag GmbH & Co. KGaA: Weinheim, Germany, 2010; ISBN 978-3-527-63017-2. [Google Scholar]
- Monteiro, S.N.; Vieira, C.M.F. Solid State Sintering of Red Ceramics at Lower Temperatures. Ceram. Int. 2004, 30, 381–387. [Google Scholar] [CrossRef]
- Sokolař, R.; Vodová, L.; Šveda, M. Limestone Sludge in the Brick Body. Adv. Mater. Res. 2014, 1000, 158–161. [Google Scholar] [CrossRef]
- Vodova, L.; Sokolar, R.; Hroudova, J. The Effect of CaO Addition on Mechanical Properties of Ceramic Tiles. Int. J. Civ. Environ. Struct. Constr. Archit. Eng. 2014, 8, 717–720. [Google Scholar]
- Vieira, C.M.F.; Soares, T.M.; Sánchez, R.; Monteiro, S.N. Incorporation of Granite Waste in Red Ceramics. Mater. Sci. Eng. A 2004, 373, 115–121. [Google Scholar] [CrossRef]
- Kurama, S.; Ozel, E. The Influence of Different CaO Source in the Production of Anorthite Ceramics. Ceram. Int. 2009, 35, 827–830. [Google Scholar] [CrossRef]
- Csáki, Š.; Lukáč, F.; Húlan, T.; Veverka, J.; Knapek, M. Preparation of Anorthite Ceramics Using SPS. J. Eur. Ceram. Soc. 2021, 41, 4618–4624. [Google Scholar] [CrossRef]
- Abe, T.; Tsukamoto, K.; Sunagawa, I. Nucleation, Growth and Stability of CaAl2Si2O8 Polymorphs. Phys. Chem. Miner. 1991, 17, 473–484. [Google Scholar] [CrossRef]
- Abe, T.; Sunagawa, I. Hexagonal CaAl2Si2O8 in a High Temperature Solution; Metastable Crystallization and Transformation to Anorthite. Mineral. J. 1995, 17, 257–281. [Google Scholar] [CrossRef]
- Xu, P.; Wang, H.; Ren, L.; Tu, B.; Wang, W.; Fu, Z. Theoretical Study on Composition-dependent Properties of ZnO·nAl2O3 Spinels. Part II: Mechanical and Thermophysical. J. Am. Ceram. Soc. 2021, 104, 6455–6466. [Google Scholar] [CrossRef]
- Asmani, M.; Kermel, C.; Leriche, A.; Ourak, M. Influence of Porosity on Young’s Modulus and Poisson’s Ratio in Alumina Ceramics. J. Eur. Ceram. Soc. 2001, 21, 1081–1086. [Google Scholar] [CrossRef]
- Munro, R.G. Elastic Moduli Data for Polycrystalline Oxide Ceramics; National Institute of Standards and Technology: Gaithersburg, MD, USA, 2002; p. 6853. [Google Scholar]
- Zhang, X.; Li, W.; Kou, H.; Shao, J.; Deng, Y.; Ma, J. Modeling the Temperature and Porosity Dependent Young’s Modulus of Porous Ceramics. Mater. Res. Express 2018, 5, 15204. [Google Scholar] [CrossRef]
- Štubňa, I.; Húlan, T.; Trník, A.; Vozár, L. Uncertainty in the Determination of Young’s Modulus of Ceramics Using the Impulse Excitation Technique at Elevated Temperatures. Acta Acust. United Acust. 2018, 104, 269–276. [Google Scholar] [CrossRef]
- C1259-15; Standard Test Method for Dynamic Young’s Modulus, Shear Modulus and Poisson’s Ratio for Advanced Ceramics by Impulse Excitation of Vibration. ASTM International: West Conshohocken, PA, USA, 2015.
- Rietveld, H.M. Line Profiles of Neutron Powder-Diffraction Peaks for Structure Refinement. Acta Crystallogr. 1967, 22, 151–152. [Google Scholar] [CrossRef]
- Hill, R.J.; Howard, C.J. Quantitative Phase Analysis from Neutron Powder Diffraction Data Using the Rietveld Method. J. Appl. Crystallogr. 1987, 20, 467–474. [Google Scholar] [CrossRef]
- Gualtieri, A.F.; Ferrari, S. Kinetics of Illite Dehydroxylation. Phys. Chem. Miner. 2006, 33, 490–501. [Google Scholar] [CrossRef]
- Sokolar, R.; Nguyen, M. Sintering of Anorthite Ceramic Body Based on Interstratified Illite-Smectite Clay. Ceram. Int. 2022, 48, 31783–31789. [Google Scholar] [CrossRef]
- Traoré, K.; Kabré, T.S.; Blanchart, P. Gehlenite and Anorthite Crystallisation from Kaolinite and Calcite Mix. Ceram. Int. 2003, 29, 377–383. [Google Scholar] [CrossRef]
- Štubňa, I.; Trník, A.; Podoba, R.; Sokolař, R.; Bačík, P. Elastic Properties of Waste Calcite-Clay Ceramics during Firing. J. Ceram. Soc. Jpn. 2012, 120, 351–354. [Google Scholar] [CrossRef]
- Kováč, J.; Trník, A.; Medveď, I.; Vozár, L. Influence of Calcite in a Ceramic Body on Its Thermophysical Properties. J. Therm. Anal. Calorim. 2013, 114, 963–970. [Google Scholar] [CrossRef]
Disclaimer/Publisher’s Note: The statements, opinions and data contained in all publications are solely those of the individual author(s) and contributor(s) and not of MDPI and/or the editor(s). MDPI and/or the editor(s) disclaim responsibility for any injury to people or property resulting from any ideas, methods, instructions or products referred to in the content. |
© 2025 by the authors. Licensee MDPI, Basel, Switzerland. This article is an open access article distributed under the terms and conditions of the Creative Commons Attribution (CC BY) license (https://creativecommons.org/licenses/by/4.0/).
