Abstract
The Mapeng pluton in the central Taihang Mountains hosts significant gold mineralization; however, the magmatic processes controlling its emplacement, crystallization, and potential role in ore genesis remain debated. Previous petrological and geochemical studies have identified three internal lithofacies zones and suggested magma mixing. However, it remains uncertain whether these zones formed through in situ fractional crystallization or multiple intrusive pulses, and how magmatic dynamics contributed to gold enrichment. To address these questions, we applied quantitative crystal size distribution (CSD) analysis to constrain the intrusion history and evaluate its implications for mineralization. The CSD curves of quartz in the Mapeng granite are typically concave, with characteristic lengths (CLs) ranging from 0.78 to 1.43 mm, slopes from −1.29 to −0.70, and intercepts from −2.10 to 0.95. These variations indicate strong fluctuations in crystal growth and nucleation rates, suggesting a major influence of magma mixing. For plagioclase, the CL values range from 0.56 to 2.50 mm, slopes from −4.40 to −1.33, and intercepts from −1.21 to 3.48, further supporting the idea of multistage magma injection and crystal coarsening. Regarding crystal spatial distribution and alignment, the crystal aggregation degree (R value) ranges from 0.79 to 1.14, and the alignment factor (AF value) ranges from 0.01 to 0.19. These values suggest that the crystals tend to aggregate spatially, with their alignment degree being extremely weak, which indicates rapid magma flow disturbed by mixing processes. Notably, the R value and AF value show a negative correlation (R2 > 0.6) in the central facies and a positive correlation in the transitional facies, revealing differences in crystal accumulation mechanisms among different lithofacies zones. By synthesizing the covariance of CSD parameters and texture indices, this study infers that the Mapeng pluton experienced multiple batches of magma injection during its emplacement and consolidation. These injection events accelerated crystal dissolution and regrowth, thereby promoting crystal coarsening and textural reorganization. This study provides new quantitative mineral–textural evidence.
1. Introduction
Magma emplacement and crystallization kinetics govern not only the architecture of an intrusion but also the timing and extent of volatile saturation, both of which are critical for gold precipitation. Transient thermal fluctuations induced by multi-pulse magma injections or mixing events can trigger fluid exsolution and repeatedly flush the wall rocks with metal-bearing brines, thereby enhancing ore grades. In the Taihang gold belt, integrated petrological (modal, textural, and mineral-inclusion), geochemical (whole-rock major and trace elements, Sr–Nd–Pb–Hf isotopes), and geochronological (zircon U–Pb, mica Ar–Ar) analyses have been employed to constrain the magma source, oxidation state, and emplacement depth. However, these conventional approaches cannot determine whether the three internal lithofacies of the Mapeng pluton formed through in situ fractional crystallization or by discrete intrusive pulses, leaving the link between magmatic dynamics and gold endowment unresolved.
Quantitative textural analysis of igneous textures (or magmatic crystallization textures) provides a theoretical framework independent of traditional geochemical methods. By quantitatively characterizing the crystal size distribution (CSD) and spatial arrangement of minerals in rocks, this approach places robust constraints on the kinetics of crystal nucleation and growth during magmatic processes. It can resolve variations in nucleation and growth rates, magma mixing, emplacement mechanisms, multistage cooling histories, and mineral coarsening [1,2,3,4,5,6,7]. Furthermore, it facilitates investigations of crystal compaction, deformation, and recrystallization [8], as well as the effects of fluid infiltration on igneous textures and magmatic differentiation [9].
Cashman and Marsh [10], for instance, applied CSD analysis to lava samples from Kilauea Volcano, Hawaii, to examine the crystallization dynamics of extrusive rocks. Their work elucidated the relationship between crystal growth and melt viscosity, documenting crystal redistribution both before and after eruption. They also demonstrated that olivine and pyroxene crystals exhibit composition-dependent CSD characteristics.
Similarly, Wang et al. [11] investigated the ~820 Ma Jiuling composite granite batholith in South China, integrating zircon CSD analysis with an oxygen isotope diffusion model to constrain the residence time of the granite magma. This study provided a novel approach for estimating the longevity of magma reservoirs. Peng N. [12] combined dynamic crystallization experiments with CSD analysis to study the crystallization kinetics of K-rich basalt from the Wudalianchi Laoheishan volcano, revealing how cooling rate regulates CSD characteristics and crystallization mechanisms. Furthermore, Cheng Zhongmei [13] applied CSD techniques to provide definitive evidence of gravitational differentiation crystallization at Laoshangou.
Although crystal size distribution (CSD) analysis has been widely applied in geological research with substantial success, its scope remains inherently constrained. Effective grain statistics in CSD studies require particles that satisfy fundamental criteria of integrity, representativeness, and well-defined boundaries to ensure accurate reconstruction of crystal growth characteristics within magma chambers [11]. When mineral crystals within a rock are intimately mixed and cannot be physically separated, crystal size data cannot be reliably extracted—this undermines the interpretive precision of CSD [14].
In complex magmatic systems—e.g., those involving multi-stage magma mixing or rapid cooling—crystal growth is affected by multiple dynamic factors. Consequently, CSD datasets can become intricate and challenging to interpret, often insufficient to discriminate among discrete crystallization stages [15]. Size extremes of crystals also present practical challenges: when crystals are excessively small or large, both measurement and statistical analysis become less reliable, thus undermining the robustness of CSD applications [16]. Finally, significant compositional variation in crystals or long-term instability of the magmatic environment can distort CSD signals, preventing accurate reconstruction of magma chamber evolution [17].
Therefore, when applying the Crystal Size Distribution (CSD) technique to the study of specific plutons, all the aforementioned limitations must be considered, and the resulting data should only be interpreted cautiously after incorporating the regional geological setting and petrological characteristics. The Mapeng pluton exemplifies how this integrated interpretation strategy works in practice. The Mapeng pluton is located in the Fuping area of the central Taihang Mountains (Figure 1), within the central segment of the Paleoproterozoic Trans-North China Orogen in the interior of the North China Craton [18]. Previous studies have identified three concentric lithofacies—central quartz monzonite, transitional monzogranite, and marginal quartz diorite—with consistent zircon U–Pb ages of 129–131 Ma. However, two competing hypotheses remain: (1) the zonation reflects in situ fractional crystallization within a single magma chamber; or (2) each lithofacies represents a separate intrusive pulse characterized by distinct degrees of magma mixing. Resolving these scenarios is critical, as multi-pulse emplacement would repeatedly recharge the magmatic system and enhance fluid flux, whereas closed-system fractional crystallization would generate only gradual compositional gradients and limited volatile release. This region hosts numerous intermediate–felsic intrusive bodies and various dikes, including the Dahanhe, Wang’anzhen, Chiwawu, Mapeng, and Guanyintang plutons. Several of these plutons are closely associated with gold mineralization [19]. Among the numerous intrusions in the belt, the Mapeng pluton (exposed area ≈ 65 km2) is the largest and most closely associated with gold mineralization. As a widespread felsic magmatic rock in the continental crust, granite preserves a valuable record of tectono-magmatic events as well as crustal evolution and growth processes.
Previous studies have investigated the Mapeng pluton from petrological, geochemical, and isotopic geochronological perspectives, preliminarily defining its genetic characteristics and recognizing clear zoning features [19,20,21,22,23]. In terms of chronology, Liu [24] constrained the emplacement age of the Mapeng pluton to 125 Ma using zircon U-Pb dating, which provides robust support for the recognition of extensive magmatic activity during the Yanshanian period. Regarding its genetic mechanism, Men [25] and Zhang [26] proposed a magma mixing hypothesis based on enclave analysis and isotopic data, whereas Cheng [27] emphasized the combined effects of metamorphic basement melting and mantle-derived material input. Although previous studies have constrained the emplacement age (~125 Ma) and suggested magma mixing based on enclave geochemistry, two key questions remain: (1) do the three mapped lithofacies represent a single, progressively differentiating magma chamber or multiple intrusive pulses? and (2) how are the inferred magmatic dynamics linked to the widespread gold mineralization hosted by the pluton?
Some researchers have proposed that certain high-K calc-alkaline intermediate–acidic rocks exposed in eastern China during the Mesozoic were primarily generated by partial melting of the lower crust, with minimal mantle input [28,29,30]. However, significant debate remains regarding whether magma mixing occurred during the formation of the Mapeng pluton, and, to date, no quantitative structural studies have been conducted on this intrusion. CSD analysis can provide quantitative evidence for the crystal dynamic response during the magma mixing process by examining the grain size and spatial distribution characteristics of minerals (as illustrated in similar applications by Cashman and Marsh [10] and Peng Nian [12]). This capability precisely addresses the deficiency of current research on the Mapeng intrusion, where there is an overreliance on qualitative inferences and a lack of quantitative constraints.
In this study, we employ quantitative fabric analysis to investigate the Mapeng pluton, systematically characterizing the size distributions, spatial arrangements, and orientations of mineral grains. This approach aims to reconstruct the dynamic mechanisms governing the pluton’s formation, constrain its solidification processes, and provide mineralogical evidence for granite emplacement mechanisms, thereby offering mineral-scale constraints on granite petrogenesis. Additionally, it provides new micro-scale data to support investigations into the dynamic mechanisms of Yanshanian magmatic activity in the NCC.

Figure 1.
(a) Regional geological map and zircon U-Pb age map of the Mapeng–Chiwa Wu rock mass; (b) Simplified geological map of the North China Craton (NCC) (after Liu et al. [24]; Davis et al. [31]; Li et al. [32]).
2. Geological Background and Petrography
2.1. Geological Background
The Mapeng pluton is situated along the southern margin of the North China Craton (NCC). The regional stratigraphy is dominated by an Archean crystalline basement, consisting of medium- to high-grade metamorphic sequences, including intermediate–mafic volcanic rocks, argillaceous clastic rocks, and magnesian carbonates. The pluton intruded Neoarchean gneiss and supracrustal rocks, with its emplacement dated to the Late Jurassic–Early Cretaceous, corresponding to the Yanshanian magmatic event. During the Luliang orogeny, NWW-trending diabase dikes were emplaced in the region, while the Yanshanian period was dominated by intermediate–felsic intrusive rocks. The Mapeng pluton covers an exposed area of approximately 65 km2 and exhibits distinct internal zoning, though the boundaries between different facies are gradational rather than sharply defined. Dark dioritic enclaves, ranging in diameter from several centimeters to tens of centimeters, are widely distributed within each facies [25,26], while intermediate–felsic dikes and minor diabase dikes are developed along the periphery of the pluton [33].
The formation of the Mapeng pluton is closely linked to the complex tectonic evolution of the North China Craton (NCC). In the early Mesozoic, the craton underwent compressional orogeny. During the Yanshanian orogeny, a series of tectonic events—including orogenesis, uplift, and associated magmatism—took place [34]. The magmatic activity and emplacement of the Mapeng pluton occurred during this period, as magma ascended along fault systems within the tectonic belt, ultimately crystallizing to form the present intrusion [26].
2.2. Petrographic Features
The Mapeng rock mass is a composite pluton consisting of quartz diorite, granodiorite, quartz monzonite, and monzogranite. Its primary mineral composition includes plagioclase, potassium feldspar, quartz, hornblende, and biotite. From the margin to the center of the pluton, the content of dark minerals such as hornblende gradually decreases, while the content of potassium feldspar, plagioclase, and quartz increases. This study focuses primarily on the central and transitional facies.
To ensure representativeness, six samples were selected based on detailed field mapping, petrographic observations, and the internal structural zoning of the Mapeng pluton. Although the boundaries between different lithofacies are gradational, the selected samples capture key textural and mineralogical variations, ranging from the central porphyritic granite to the medium-grained transitional facies. Each sampling site was chosen within a homogeneous lithological domain, where mineral assemblages and grain sizes remained stable and unaffected by later alteration or hybridization (Figure 2). As a result, these samples represent the primary crystallization environments within the pluton, providing reliable material for quantitative crystal size distribution (CSD) analysis and subsequent petrogenetic interpretation.
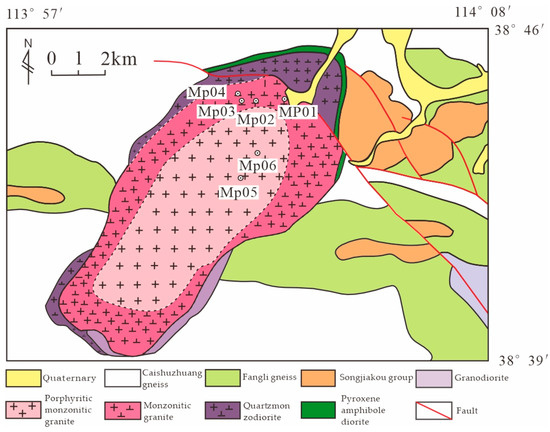
Figure 2.
Regional geological map of sample collection sites (after Li et al. [35]): Dashed lines indicate gradual transitions between lithofacies.
By identifying and plotting the minerals in the samples, the central facies is determined to be quartz monzonite and granodiorite, while the transitional facies consists of monzogranite and granodiorite (Table 1; Figure 3).

Table 1.
Lithological characteristics of the Mapeng pluton: Fsp—Feldspar.
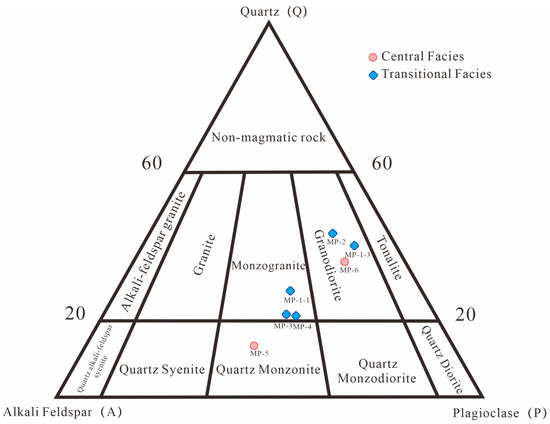
Figure 3.
Classification of MaPeng rock mass samples (after Streckeisen [36]).
- (1)
- Central Facies
The central facies consists of porphyritic granite, characterized by large phenocrysts of flesh-red potassium feldspar, approximately 10 mm in diameter. The weathered surface of the potassium feldspar appears protruding, while the matrix is primarily composed of fine-grained plagioclase and quartz, with a grain size of about 3 mm, making up approximately 35% of the rock. The plagioclase is grayish-white and exhibits subhedral to euhedral prismatic forms, constituting around 20%. Quartz is colorless and occurs in anhedral granular form, comprising about 35% of the rock.
In sample MP-5, quartz appears as an anhedral granular phase, constituting around 20%, while plagioclase, in subhedral tabular forms, occupies approximately 65%. Hornblende is present in less than 3%, and plagioclase shows banding and poikilitic textures (Figure 4b,c). In sample MP-6, quartz is anhedral and accounts for about 25%, while plagioclase is subhedral and tabular, making up approximately 60%, with some plagioclase exhibiting banded structures (Figure 4e). The accessory mineral apatite is slender and prismatic, characteristic of quenching, indicating a sharp shift in physicochemical conditions during magmatic evolution (Figure 4f) [37].
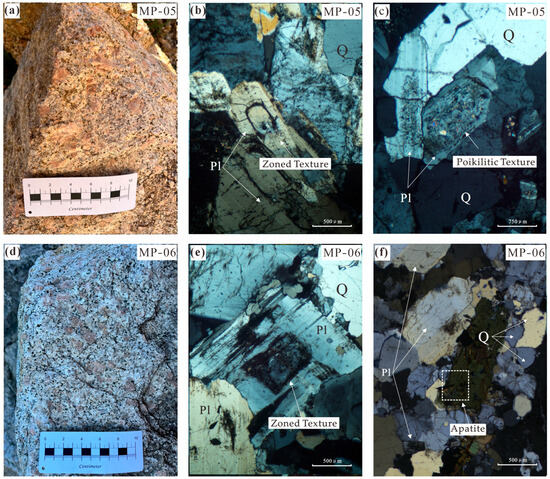
Figure 4.
Hand specimen of MP-5 and MP-6 samples and photos under orthogonal polarizer. (a,d). Hand specimen photographs; (b,c,e,f). Photographs under cross-polarized light.; (c) a plagioclase phenocryst with hornblende inclusions; Q: Quartz; Pl: Plagioclase.
- (2)
- Transitional Facies
The transitional facies consists of grayish-white to flesh-red medium-grained granite, locally containing chlorite. The orthoclase exhibits subhedral to euhedral prismatic forms and develops Carlsbad twinning, constituting approximately 15% of the rock. Plagioclase is also subhedral to euhedral in tabular form, making up about 40%, while quartz is anhedral and granular, with a grain size ranging from 1 to 3 mm, comprising approximately 25%. Biotite and hornblende are the primary mafic minerals, together constituting about 15% of the rock, with hornblende being slightly more abundant than biotite. Hornblende occurs in subhedral prismatic forms, while biotite is subhedral and flaky.
The rock body contains numerous dark inclusions, which are clumpy in shape and exhibit micro- to fine-grained structures (Figure 5a,c,e,g). These dark spots are interpreted as enclaves—fragments of the surrounding rock that were incorporated into the magma during ascent. Enclaves consist of unmelted or partially melted material entrained by the magma, typically without undergoing significant chemical modification. In contrast, xenoliths (foreign rock fragments) are pieces derived from distinct geological sources that are transported by the magma and may experience more extensive melting or alteration. Although both enclaves and xenoliths differ compositionally from the host magma, enclaves generally retain more of their original features, exhibiting only partial modification through magma assimilation.
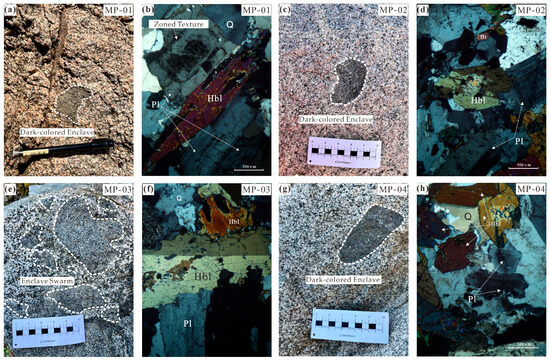
Figure 5.
MP-1, MP-2, MP-3, MP-4 field and orthogonal polarizer photos: (a,c,e,g). Hand specimen photographs; (b,d,f,h). Thin-section photographs under cross-polarized light; Q: Quartz; Pl: Plagioclase; Bt: Biotite; Hbl: Hornblende.
In the Mapeng pluton, the morphology, spatial distribution, and limited interaction of the dark spots with the surrounding magma indicate that they are enclaves rather than xenoliths. These features differ from xenoliths in that the dark spots show no evidence of complete melting or extensive alteration and retain textural characteristics typical of their source rock. The compositional contrast between the dark spots and the host magma further supports their interpretation as enclaves, providing insights into magma ascent dynamics and the interaction between the magma and its wall rocks.
In sample MP-1-1, quartz is anhedral, with a grain size of 1–2 mm, constituting about 25%; plagioclase is subhedral and tabular, with some crystals exhibiting banded structures (Figure 5b), comprising approximately 50%. Hornblende makes up about 10%, and biotite accounts for around 5%. In sample MP-1-3, quartz is anhedral, with a grain size of 1–2 mm, constituting about 20%; plagioclase is subhedral to euhedral and tabular, with a grain size of 1–4 mm, comprising around 55%. Some plagioclase crystals exhibit ore-rim structures and irregular tabular shapes of varying sizes, with some containing poikilitic hornblende inclusions. Hornblende is subhedral to euhedral, constituting about 10%, while biotite is subhedral and flaky, with a grain size of 1–2 mm, making up about 3%.
In MP-2, quartz is anhedral, with a grain size of 1–3 mm, constituting about 25%; plagioclase is subhedral and tabular, comprising approximately 55%; hornblende accounts for about 15%; and biotite makes up around 3%, with some broken plagioclase and quartz crystals present. In MP-3, quartz is anhedral, with a fine- to medium-grained texture, making up about 20%; plagioclase is subhedral, comprising about 55%. In MP-4, quartz is anhedral with a coarse-grained texture, constituting around 20%; some plagioclase crystals have undergone alteration, with plagioclase making up about 50%, and hornblende constituting around 10%.
- (3)
- Marginal Facies
No samples were collected from this facies in the present study. However, based on a literature review, it is known that this facies is characterized by a medium-grained, subhedral structure with a blocky texture. The primary mineral composition consists of plagioclase (55% ±), quartz (10% ±), hornblende (20% ±), potassium feldspar (5% ±), and biotite (5% ±), with accessory minerals including zircon, apatite, and rutile. The visible thickness of this facies ranges from 0 to 150 m [23,26].
3. Materials and Methods
3.1. Crystal Grain Size Distribution Theory
Marsh [38] identified the nucleation and growth processes of crystals in open and closed systems based on the characteristics of the CSD (Crystal Size Distribution) slope, intercept, and the maximum grain size (the average size of the largest four grains). CSD analysis provides a quantitative explanation of the rock structures observed in petrography and allows for the derivation of the formation processes of igneous rocks based on the structural variations between minerals in the magma [39].
By analyzing the CSD characteristics, the mineral in the rock can be expressed as a semi-logarithmic linear relationship between the natural logarithm of the number density of grains (ln(n)) and their size (L). The slope of the semi-logarithmic curve, s(−1/Gt), is related to the growth rate (G) and crystallization time (t). The intercept is represented by ln(n0), where n0 is the final nucleation density. The 1σ values of the slope and intercept represent the uncertainties of the parameters in the ln(n)–L linear fitting, corresponding to the standard errors obtained from least-squares regression. A negative correlation between the crystal slope and intercept indicates that as the number of nuclei increases, the growth rate of the crystals decreases. This phenomenon suggests that nucleation and crystallization predominantly occur in a relatively closed system. Conversely, a positive correlation would indicate that as the number of nuclei increases, the growth rate accelerates, likely occurring in a relatively open system [40].
When the magma system is influenced by other factors, such as magma mixing, crystal accumulation, fractionation, or coarsening, the semi-logarithmic CSD curve may exhibit bends or twists. By carefully analyzing these CSD plots, relevant information regarding magma crystallization dynamics can be derived [9,38,41].
Specific procedures:
- To investigate the mineralogical characteristics and textures of the Mapeng pluton, thin sections were prepared from rock samples collected at multiple locations (Figure 2). The sampling sites were carefully chosen to capture the lithological heterogeneity of the pluton. To account for the observed textural variability, thin sections were cut in two orientations—parallel to the dominant foliation and perpendicular to the main layering—ensuring that mineralogical and textural variations across the pluton were adequately represented. Preparing thin sections in different orientations provided a more representative view of the overall rock composition and texture, reflecting the natural heterogeneity of the Mapeng pluton.
- CorelDRAW 2024 (v25) software was used to outline the crystals of quartz and plagioclase. Figure 6 shows the full scan image of the sample thin section and the outlined crystal profiles.
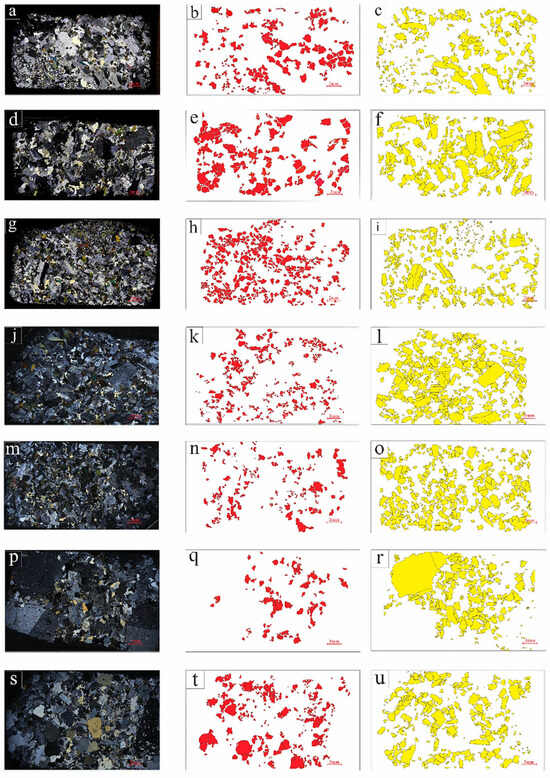 Figure 6. Thin-section full scan images and mineral crystal contour tracing images. (a,d,g,j,m,p,s): full-scan images of thin sections of samples MP-1-1, MP-1-3, MP-2, MP-3, MP-4, MP-5, and MP-6; (b,e,h,k,n,q,t): the outline tracing of quartz in the corresponding samples (filled in red); (c,f,i,l,o,r,u): the outline tracing of plagioclase in the corresponding samples (filled in yellow); White areas represent regions not identified as either hornblende or plagioclase.
 - ImageJ (1.54g) software was used to acquire quantitative parameters, allowing for the analysis of area, centroid, circularity, long axis, and short axis (the long and short axes of an ellipse with the same area as the phenocrysts) of each particle in the two-dimensional plane, thereby obtaining magma crystallization dynamics. The 2D thin-section method is a well-established technique that provides crystal orientation, spatial distribution, and grain size distribution characteristics.
- The CSD data exported from ImageJ were imported into CSDCorrections (1.5) to obtain the three-dimensional parameters of the crystals. Its working principle is similar to that of the SEM-based automated mineralogy workflow; both achieve unbiased estimation of crystal size distribution through high-resolution mineral boundary identification and three-dimensional stereology conversion [42].
In CSD techniques, effective particles used for statistical analysis must meet basic requirements such as integrity, representativeness, and clear boundaries to accurately reflect the growth characteristics in the magma chamber. Integrity ensures that the crystals have not been damaged by mechanical breakage, dissolution, recrystallization, or alteration [10].
Representativeness refers to the ability of crystals to reflect the characteristics of the magma chamber or rock unit being studied, ensuring that crystals of abnormal size are excluded. Clear boundaries are essential for the accurate measurement of crystal size. A sufficient number of crystal particles must be statistically considered to ensure data reliability, typically at least a few hundred. Crystals exhibiting secondary coarsening are generally excluded from statistical analysis, as their sizes are influenced by later geological processes. These processes interfere with the original growth information and add complexity to the data, making it difficult to distinguish between different growth stages [38]. However, when the study specifically aims to investigate the secondary coarsening process, crystals affected by this phenomenon may be included in the statistics, under specific conditions and with appropriate explanation, while ensuring that the different growth stages of the crystals are distinguished and treated separately.
It is important to note that many crystals exhibiting secondary coarsening phenomena have been observed in the samples. In CSD analysis, however, crystals showing secondary coarsening are typically not counted as valid particles. This is because secondary coarsening occurs after the crystal’s initial formation, influenced by post-formation geological processes such as hydrothermal activity or fluid alteration. These secondary growth phenomena do not accurately reflect the initial crystallization process in the magma chamber [43]. Such post-formation coarsening complicates the crystal size distribution, making it difficult to differentiate between crystals from the original growth phase and those from the secondary coarsening phase. As a result, this increases the complexity of the CSD data and hinders interpretation, affecting the accurate reconstruction of the magma chamber’s evolutionary history.
3.2. Crystal Spatial Distribution Theory
Jerram et al. [44] adapted a method originally developed in horticulture to calculate the two-dimensional spatial distribution of plants for use in petrology. This method analyzes the spatial distribution characteristics of crystals in rocks, known as the Spatial Distribution Pattern (SDP). It calculates the crystal aggregation degree, R, using the following Formula (1):
In the formula, the symbols represent the following: : The average shortest adjacent distance between crystals. : The predicted shortest adjacent distance when the same number of crystals are randomly distributed within the same area. : The number of measured crystals. : The particle distribution density in the observed area, which is the number of crystals divided by the observation area. : The shortest adjacent distance between crystals. By calculating the crystal aggregation degree, this method quantifies the degree of crystal aggregation or random distribution, revealing the crystallization characteristics of igneous rocks. A value of R = 1 indicates a random distribution, while R = 0 represents maximum aggregation (where all points are located at the same center). If R < 1, it suggests that crystals tend to cluster, while if R > 1, it indicates an ordered arrangement. This method can also be used to detect phenomena such as mechanical compression, sorting, and overgrowth in the rock.
3.3. Crystal Orientation Degree Theory
Boorman et al. [16] and Williams et al. [45] suggested that when calculating the degree of orientation alignment factor (AF), the largest 40 crystals should be selected as the statistical objects. This is because larger crystals typically crystallize first and are more effective at recording the physical processes of magma. By decomposing the crystal’s long-axis direction θ into vertical unit vectors, x = cos θ and y = sin θ, the matrix T can be constructed, and its eigenvalues E1 and E2 can be calculated as shown in Equation (2).
In this context, N represents the total number of measured crystals. The eigenvalue E1 typically ranges from 0.5 to 1. Subsequently, the AF value is calculated using Equation (3).
If AF = 1, it indicates that the crystals are perfectly oriented; if AF = 0, it implies that the crystals are randomly distributed, with no preferred orientation.
4. Results and Discussion
After obtaining the three-dimensional parameters of the crystals using CSDCorrections software, parameters such as roundness, structural characteristics, and grain size intervals can be adjusted, enabling the calculation of crystal size distribution (CSD) characteristics. To minimize errors in stereographic conversion and improve the quality of the linear fitting (QL), the CSD should be calculated multiple times across different grain size intervals. If the QL values do not meet expectations, a segmented calculation approach can be employed to reduce potential human error. Finally, by analyzing the characteristic length (CL), slope, and intercept obtained from the crystal size distribution plot, a covariance diagram between different parameters can be constructed. This analysis helps to study the nucleation and growth processes of particles, thereby providing further insights into the dynamic mechanisms of magmatic processes [38].
4.1. Quantitative Structural Features
Quantitative analysis of the samples from the Mapeng rock body, including quartz and plagioclase, yields the CSD data shown in Table 2 and Table 3. The crystal size distribution (CSDs) of quartz and plagioclase are illustrated in Figure 7, with crystal size L/mm and the natural logarithm of the population density ln(n)/mm−4 [38,46].
Table 2.
Quartz texture parameters in granite samples of Mapeng pluton. AF: Alignment factor; R (Ratio of orientation ellipse axes): Spatial distribution value; Lmax: Maximum mineral grain size (the average value of the long axes of the four crystals with the longest long axes measured in a single thin section for each sample.); CL: Characteristic length; QL: Linear fitting degree; 1σ: standard deviation.
Table 3.
Structural parameters of orthoclase in granite samples of MaPeng pluton: The significance is the same as above.
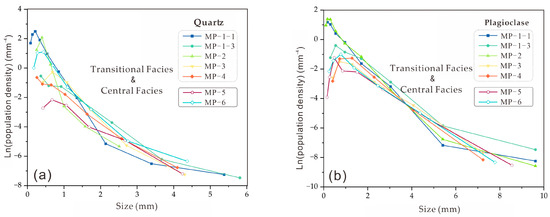
Figure 7.
CSD diagram of granite quartz, orthoclase and hornblende of Ma Pen pluton: (a). CSD diagrams of quartz in the samples; (b). CSD diagrams of plagioclase in the samples; Ln(n) (natural logarithm of the final crystal nucleation density).
Crystal size distribution (CSD) curves in magmatic systems are generally classified into three types: loglinear, bimodal, and lognorma [47]. The loglinear type reflects continuous nucleation and crystal growth under steady-state cooling conditions [48]. The bimodal type is characterized by two linear segments or distinct crystal-size populations, representing episodic crystallization processes associated with magma recharge or mixing. The lognormal type, typically displaying a concave-down curvature at the coarse-grained end, suggests that the crystal population experienced late-stage dissolution, recrystallization, or thermal re-equilibration.
In a stable magmatic system, CSDs usually appear as straight lines corresponding to loglinear crystallization [49]. When two magmas of different compositions or temperatures mix, their crystal-size distributions diverge, and a curved transition develops across the overlapping grain-size range. This curvature primarily reflects variations in nucleation density (i.e., the natural logarithm of crystal number density) along the vertical axis, while the small- and large-crystal ends retain their respective CSD slopes. The overall trend remains downward, forming a bimodal pattern [48]. The degree of curvature in the mixed curve depends on the CSD slope and the mixing ratio of the two magmas [2].
Moreover, lognormal-type CSDs typically develop when the crystallization system departs from steady-state cooling. During the middle to late stages of magmatic crystallization, processes such as localized reheating, dissolution–regrowth, or residual melt percolation disturb the balance between nucleation and growth rates, leading to a rapid decline in the abundance of large crystals. Consequently, the CSD curve displays a distinct concave-down curvature in the ln(n)–L coordinate system. This morphology reflects partial re-equilibration of the crystal population during late-stage crystallization and represents a non-steady-state crystallization process. Compared with the loglinear type, the lognormal type not only records the progressive crystallization history but also preserves evidence of thermal perturbations and structural adjustments within the magma chamber, which are critical for understanding late-stage magmatic evolution [47].
In all samples, the CSDs of quartz exhibit maximum occupancy density in the 0.2–0.8 mm grain size range (Figure 7a). For samples MP-1-1, MP-2, MP-3, MP-5, and MP-6, the occupancy density decreases to varying degrees in the grain size range larger than the maximum value, forming a concave CSD curve. Similarly, the CSDs of plagioclase reach their maximum occupancy density in the 0.5–1.5 mm grain size range, forming a concave curve as well. Samples MP-1-1, MP-2, MP-3, MP-5, and MP-6 exhibit bimodal CSD patterns characterized by two linear segments with a distinct break in slope near the medium grain-size range. This feature indicates that magma recharge or mixing occurred during crystallization, when newly injected, high-temperature mafic magma interacted with pre-existing felsic magma. The interaction produced a coexistence of newly formed fine crystals and inherited coarse crystals, resulting in temporary disequilibrium within the system. Such magma rejuvenation promoted crystal resorption and enhanced fluid activity, facilitating the diffusion and re-enrichment of volatiles and gold. Therefore, the bimodal CSDs in these samples likely record local magma-recharge zones that played a key role in ore redistribution and gold enrichment.
Both quartz and plagioclase lack small crystals, suggesting that samples MP-1-1, MP-2, MP-3, MP-5, and MP-6 may have formed in a relatively closed environment.
The slopes and intercepts of the CSDs of quartz and plagioclase in the Mapeng pluton show a strong negative correlation (Figure 8), indicating that higher crystal growth rates are associated with lower nucleation rates, while slower crystal growth corresponds to enhanced nucleation activity within the system. This suggests that nucleation and crystallization in the rock mass primarily occurred in a relatively closed system. In such an environment, the magma’s temperature and chemical conditions were relatively stable, and nucleation and growth were primarily regulated by internal dynamic factors. When the nucleation rate is high (large intercept), the chemical elements in the melt (such as silicate components) are consumed by numerous small nuclei, which decreases the growth rate of each nucleus. This results in a smaller slope of the CSD curve, reflecting the dynamic equilibrium of nucleation and growth in a closed system [50].
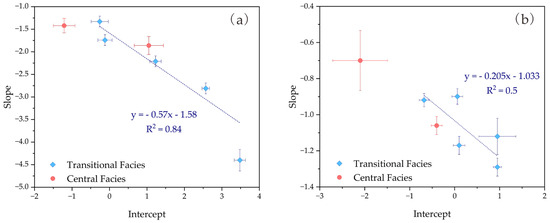
Figure 8.
Diagram of slope and intercept of CSD curve of granite quartz, orthoclase and hornblende of MaPeng pluton: (a). Diagram of slope and intercept for quartz in the samples; (b). Diagram of slope and intercept for plagioclase in the samples.
In summary, samples MP-1-1, MP-2, MP-3, MP-5, and MP-6 are likely to have formed in a relatively closed environment with low undercooling, prone to coarsening, and are considered to represent the pulse magma center. In contrast, samples MP-1-3 and MP-4 likely formed in a relatively open environment with higher undercooling, possibly representing the location where two pulses of magma meet.
The significant differences between MP-1-1 and MP-1-3 suggest that the sampling point lies at the boundary between the edge and transitional facies. This difference may have resulted from magma mixing, during which crystals were re-melted, recrystallized, or underwent compositional and structural adjustments to adapt to new environmental conditions. This rebalancing process may have led to differing crystal structures within the same sample, with some crystals retaining characteristics of the original closed environment, while others were influenced by the open environment.
4.2. Crystal Spatial Distribution Characteristics and Orientation Degree Analysis
The spatial distribution of crystals in the rock structure can be illustrated by the spatial distribution value (R) and porosity diagram (Figure 9). The RSDL line represents the random distribution of spheres. Points above the RSDL line indicate a more ordered distribution, while those below the line suggest a higher degree of crystal aggregation. The dashed oblique line and the RSDL line further divide the distribution into three regions: the contact aggregation distribution region, the non-contact distribution region (the transition area between contact distribution and random distribution), and the non-contact distribution region (the transition area between random distribution and ordered distribution) [51].
In the contact aggregation distribution region, magma interacts with the surrounding rock or other magma bodies during intrusion, causing crystals to aggregate near the contact zone. This phenomenon may be induced by factors such as temperature gradients, chemical reactions, or physical compression [52]. The transition region between contact distribution and random distribution records the gradual cooling and solidification process of magma. Initially, due to contact with the surrounding rock, crystals are enriched by temperature and compositional differences, but as cooling continues, the distribution of crystals becomes more random. For both the random distribution and ordered distribution regions, specific analysis is required. Random distribution typically suggests crystallization in a more open environment with minimal external influence, possibly related to rapid cooling or complex dynamic processes [53]. Ordered distribution indicates crystallization in a relatively closed or stable environment [54].
During crystal growth, both porosity and R values can change due to mechanical compression or deformation. Thus, by analyzing the diagram (Figure 9), one can assess whether the rock body has undergone compression, growth, or sorting, and further infer the specific process of magma evolution. From the relationship between R and porosity (Figure 9), it is observed that part of the plagioclase feldspar is located in the contact aggregation distribution region, suggesting its crystallization environment was relatively closed. During magma mixing, if one magma body is inadequately mixed with another or if the mixing rate is slow, crystals may grow in a relatively closed magma chamber. In such an environment, the interaction between crystals is stronger, increasing the likelihood of contact aggregation distributions. This supports the earlier conclusion that samples MP-1-1, MP-2, MP-3, MP-5, and MP-6 likely formed in a relatively closed environment.
Figure 8 shows that quartz in the Mapeng pluton exhibits some degree of mechanical compression, while the plagioclase feldspar curve is more inclined towards transitional growth. When new magma is injected into an existing crystal mush reservoir, it disrupts the original framework, causing crystals to experience external stress. This stress results in elastic or plastic deformation, reducing the distance between crystals and exhibiting characteristics similar to mechanical compression [55]. The newly injected magma may also be enriched with certain components that provide material for crystal growth, leading to recrystallization or continued growth, thus displaying overgrowth characteristics. The complex zoning structures in plagioclase feldspar crystals suggest they crystallized in a dynamic magma environment. Based on the spatial distribution characteristics of mineral crystals in the Mapeng pluton, it is inferred that the rock has undergone magma mixing.

Figure 9.
Relationship diagram between R and porosity (modified after [44,56]): RSDL—Randomly distributed line of spheres generated by calculation; ① The left-inclined thick dashed line area represents the contact aggregation distribution area; ② The vertical straight line area represents the non-contact distribution area (transition area between contact distribution and random distribution); ③ The blank area represents the non-contact distribution area (transition area between random distribution and ordered distribution); The four arrow directions in the upper right corner indicate several common processes affecting the change in R value: a: Mechanical compaction; b: Transitional growth; c: Deformational compaction; d: Enhanced sorting.
According to the R (spatial distribution value)–AF (orientation degree value) diagram (Figure 10), it can be observed that quartz and plagioclase feldspar in the central facies show an overall negative correlation. This suggests that the crystals are unevenly distributed in space, with a relatively high degree of orientation, indicating some level of aggregation in their distribution. Based on the spatial distribution characteristics of quartz and plagioclase feldspar crystals, it is inferred that this aggregation may be caused by the rapid movement of magma, which leads to the alignment and aggregation of crystals during flow. In rapidly flowing magma, crystals may not have sufficient time for random nucleation and growth. Instead, they are transported and accumulated along the flow direction, leading to uneven spatial distribution and an increased degree of orientation.
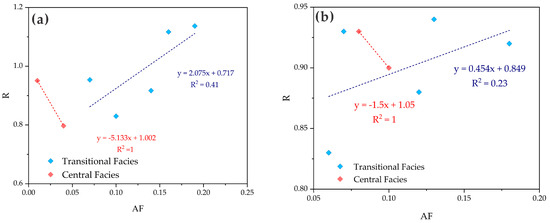
Figure 10.
Relation diagram of quartz, orthoclase, hornblende R and AF: (a). R vs. AF diagram of quartz in the samples; (b). R vs. AF diagram of plagioclase in the samples.
On the other hand, quartz and plagioclase feldspar in the transitional facies exhibit a positive correlation between spatial distribution and orientation degree. This may be the result of magma mixing. During magma mixing, magmas of different origins and compositions interact, generating strong convection and diffusion. This disrupts the original crystal distribution pattern, causing crystals to redistribute in space and become more uniformly distributed, thereby reducing the degree of crystal orientation.
When AF (Anisotropy Factor) is 0, it indicates that crystals are randomly distributed with no orientation; when AF is 1, it means crystals are directionally distributed [43,44]. Through quantitative analysis of quartz and plagioclase in the granite of the Mapeng rock mass in the study area, the quantitative structural parameters of these two minerals were obtained. The orientation degree (AF value) of quartz ranges from 0.01 to 0.19, and that of plagioclase ranges from 0.06 to 0.18 (Table 2 and Table 3). Therefore, the crystals show a more random distribution state.
4.3. Dynamics of Magma Consolidation
The formation of rock structures often undergoes a series of complex dynamic processes. The CSD curves of quartz and plagioclase in the Mapeng rock mass show a concave shape, reflecting a state where both large and small grain crystals coexist. This indicates that the growth rate and nucleation rate of crystals changed during their formation, and such changes were caused by temperature variations, possibly resulting from magma mixing [57]. In a magma system, an increase in temperature promotes crystal growth, while a decrease in temperature may lead to an increase in nucleation rate [53]. When magmas from different sources mix, the injection of high-temperature basic magma into relatively low-temperature felsic magma can cause drastic temperature changes, and such temperature fluctuations affect the crystal growth and nucleation processes [58].
Some studies have pointed out that the concave CSD curve, which shows a log-normal distribution, is a manifestation of the magma approaching an equilibrium system. This phenomenon is called coarsening, which can significantly change the shape of the CSD curve [38]. Structural coarsening typically occurs in a relatively closed system, an environment conducive to maintaining stable temperatures, reducing supercooling, and keeping the magma system near a certain crystal liquidus for extended period [59]. In this phase, the growth rate of crystals larger than the critical grain size increases significantly, the slope of the CSD curve becomes gentler, and the nucleation rate in the system approaches zero (with a small intercept) [60]. This behavior indicates that both growth and nucleation rates changed during crystal formation. The research emphasizes the influence of temperature changes, suggesting that the granite in the study area underwent a temperature fluctuation, first decreasing and then increasing during its formation. This evidence implies that crystal coarsening in the Mapeng pluton did not occur under static conditions but rather developed within a dynamically recharged magmatic system, driven by multiple episodes of magma replenishment. During the early cooling stage, quartz and plagioclase crystallized at relatively low temperatures, resulting in coarse-grained textures. Subsequent injections of hotter magma locally increased the temperature, promoting the dissolution of smaller crystals and accelerating the coarsening of larger ones [61]. Each new magma injection likely dissolved crystals smaller than the critical size, reducing the proportion of fine grains and flattening the CSD slopes. This alternating cycle of cooling and reheating generated periodic fluctuations in crystal growth rates, a pattern also reflected by the negative correlation between the slopes and intercepts of the CSD curves.
The concentric lithologic zoning of the Mapeng pluton—from central quartz monzonite to marginal quartz diorite—indicates that later-stage magma injections were relatively more mafic and volatile-rich, while the early-stage magma was more felsic in composition. This pattern suggests a pronounced compositional contrast between successive magma batches. The replenishing magma, enriched in Fe, Mg, and volatiles, supplied additional heat to the system and disrupted the crystallization front, triggering coupled processes of crystal re-equilibration, dissolution, and regrowth. These interactions further intensified the dynamic behavior of the magmatic system, as revealed by the CSD results.
The alternation between open- and closed-system magmatic conditions indicated by the CSD results suggests a cyclic evolution of the magma chamber during cooling and replenishment. During the closed-system stage, the thermal state of the magma remained stable, favoring continuous crystal growth and coarsening. In contrast, the injection of new magma reopened the system, and the influx of heat and volatiles disrupted the crystallization front, promoting volatile exsolution and the formation of hydrothermal fluids. Such thermal perturbations not only affected the kinetics of crystallization but also established the physicochemical conditions necessary for subsequent hydrothermal activity and gold mineralization.
5. Conclusions
- (1)
- Quantitative analysis of crystal size distributions (CSDs) and spatial structural parameters demonstrates that the crystallization of the Mapeng pluton occurred under a non-steady-state magmatic system. The concave-upward CSD curves of quartz and plagioclase reflect cyclic fluctuations in nucleation and growth rates. The scarcity of small crystals and the dominance of coarse grains suggest that, during certain stages, the magma evolved in a relatively closed environment characterized by low undercooling, where crystal growth prevailed and nucleation was significantly suppressed.
- (2)
- The strong negative correlation between the slopes and intercepts of the CSD curves reveals a kinetic coupling between crystal growth and nucleation. During the early cooling phase, crystallization was dominated by nucleation, whereas in the later stage, as the system approached thermal stability, nucleation progressively ceased and crystal growth accelerated, shifting the system toward a growth-dominated regime. This negative correlation quantitatively reflects a coarsening process in which larger crystals grew at the expense of smaller ones, marking a transition toward near-equilibrium crystallization conditions.
- (3)
- The lithologic zoning, grain-size heterogeneity, and R–AF spatial distribution characteristics indicate that the magma chamber underwent cyclic alternations between open- and closed-system behavior. During closed-system stages, the magma cooled slowly under stable thermal conditions, promoting continuous crystal growth and coarsening. In contrast, during open-system stages, injections of hotter magma disrupted pre-existing crystallization equilibria, causing local temperature increases and chemical disequilibrium. These perturbations led to the dissolution of small crystals, accelerated growth of larger ones, and a progressive flattening of the CSD slopes.
- (4)
- The lithologic transition from central quartz monzonite to marginal quartz diorite indicates significant chemical zoning within the pluton. Later magma batches were relatively more mafic and enriched in Fe, Mg, and volatiles, supplying additional heat and material to the system. This multistage replenishment triggered repeated cycles of dissolution, recrystallization, and chemical re-equilibration, producing complex zoning and resorption textures that record the dynamic nature of magma mixing and recharge within the chamber.
- (5)
- From a kinetic perspective, crystal coarsening, compositional differentiation, and magma replenishment acted synergistically to control the solidification dynamics of the Mapeng pluton. Closed-system stages facilitated crystal growth and volatile concentration, whereas magma recharge reopened the system, promoting volatile exsolution and the generation of Au–As–S-bearing hydrothermal fluids. These fluids migrated along structural conduits and precipitated gold through wall-rock reactions, indicating that the crystallization of the Mapeng pluton not only recorded the physicochemical evolution of multistage magmatic activity but also directly influenced subsequent hydrothermal mineralization.
- (6)
- In summary, the solidification of the Mapeng pluton was governed by the coupled effects of crystal coarsening, magma compositional contrast, and multistage replenishment. The integrated evidence from CSDs and spatial distribution parameters documents a dynamic transition from closed-system equilibrium to open-system recharge. This evolutionary pattern highlights the intricate feedbacks among thermal, compositional, and kinetic processes in the magma chamber, providing quantitative insights into the coupling between crystallization dynamics and mineralization in granitic systems.
Author Contributions
All authors contributed to the experiments, data analysis, writing, and revision of the manuscript. J.H. and Z.Y. collected the samples. H.R. conducted petrographic observations and carried out crystal size distribution (CSD) analysis of minerals. S.Z. participated in mineral outline delineation and structural quantification analysis. Z.L. and W.X. provided constructive suggestions on the research methods used in this study and the manuscript text. All authors have read and agreed to the published version of the manuscript.
Funding
This research was funded by Langfang Science and Technology Support Program (2022011035), and Innovation and Entrepreneurship Training Program for College Students of Institute of Disaster Prevention(No. 202311775001).
Data Availability Statement
The data presented in this study are available on request from the corresponding author. The data are not publicly available due to ethical and legal concerns.
Acknowledgments
Thanks to Xinguo Liu and Yanliang Liu for their help in the collection of samples in Fuping, Hebei.
Conflicts of Interest
There are no conflicts to declare.
References
- Marsh, B.D. Crystal size distribution (CSD) in rocks and the kinetics and dynamics of crystallization. Contrib. Mineral. Petrol. 1988, 99, 277–291. [Google Scholar] [CrossRef]
- Higgins, M.D. Origin of anorthosite by textural coarsening: Quantitative measurements of a natural sequence of textural development. J. Petrol. 1998, 39, 1307–1323. [Google Scholar] [CrossRef]
- Higgins, M.D. Origin of megacrysts in granitoids by textural coarsening: A crystal size distribution (CSD) study of microcline in the Cathedral Peak Granodiorite, Sierra Nevada, California. Geol. Soc. Lond. Spec. Publ. 1999, 168, 207–219. [Google Scholar] [CrossRef]
- Higgins, M.D.; Roberge, J. Crystal size distribution of plagioclase and amphibole from Soufrière Hills volcano, Montserrat: Evidence for dynamic crystallization–textural coarsening cycles. J. Petrol. 2003, 44, 1401–1411. [Google Scholar] [CrossRef]
- Mills, R.D.; Ratner, J.J.; Glazner, A.F. Experimental evidence for crystal coarsening and fabric development during temperature cycling. Geology 2011, 39, 1139–1142. [Google Scholar] [CrossRef]
- Mills, R.D.; Glazner, A.F. Experimental study on the effects of temperature cycling on coarsening of plagioclase and olivine in an alkali basalt. Contrib. Mineral. Petrol. 2013, 166, 97–111. [Google Scholar] [CrossRef]
- Boorman, S.; Boudreau, A.; Kruger, F.J. The lower zone–critical zone transition of the Bushveld Complex: A quantitative textural study. J. Petrol. 2004, 45, 1209–1235. [Google Scholar] [CrossRef]
- Yang, Z. Combining quantitative textural and geochemical studies to understand the solidification processes of a granite porphyry: Shanggusi, East Qinling, China. J. Petrol. 2012, 53, 1807–1835. [Google Scholar] [CrossRef]
- Higgins, M.D. Quantitative Textural Measurements in Igneous and Metamorphic Petrology; Cambridge University Press: Cambridge, UK, 2006; pp. 1–276. [Google Scholar]
- Cashman, K.V.; Marsh, B.D. Crystal size distribution (CSD) in rocks and the kinetics and dynamics of crystallization II: Makaopuhi lava lake. Contrib. Mineral. Petrol. 1988, 99, 292–305. [Google Scholar] [CrossRef]
- Wang, D.; Wang, X.; Bindeman, I.N.; Du, D.; Li, J.; Jiang, C. Ephemeral magma reservoirs during the incremental growth of the Neoproterozoic Jiuling composite batholith in South China. J. Geophys. Res. Solid Earth 2021, 126, e2021JB022758. [Google Scholar] [CrossRef]
- Peng, N.; Cui, Y.; Liu, Y.; Qiao, X.; Zhu, X.; Nie, B.; Hu, Y. Study on crystallization dynamics of potassic basaltic lava of Laoheishan volcano in Wudalianchi area, NE China. Acta Petrol. Sin. 2020, 36, 2035–2046, (Chinese with English Abstract). [Google Scholar]
- Cheng, Z.; Lu, F. Crystal size distribution of volcanic rocks in the Laoshangou of junggar basin and significance of crystallization kinetics. Geoscience 1997, 11, 20–27, (Chinese with English Abstract). [Google Scholar]
- Alves, A.; de Souza Pereira, G.; de Assis Janasi, V.; Higgins, M.D.; Polo, L.A.; Juriáans, O.S.; Ribeiro, B.V. The origin of felsic microgranitoid enclaves: Insights from plagioclase crystal size distributions and thermodynamic models. Lithos 2015, 239, 33–44. [Google Scholar] [CrossRef]
- Bergantz, G.W.; Schleicher, J.M.; Burgisser, A. Open-system dynamics and mixing in magma mushes. Nat. Geosci. 2015, 8, 793–796. [Google Scholar] [CrossRef]
- Morgan, D.J.; Jerram, D.A. On estimating crystal shape for crystal size distribution analysis. J. Volcanol. Geotherm. Res. 2006, 154, 1–7. [Google Scholar] [CrossRef]
- Gualda, G.A.R.; Ghiorso, M.S. The Bishop Tuff giant magma body: An alternative to the Standard Model. Contrib. Mineral. Petrol. 2013, 166, 755–775. [Google Scholar] [CrossRef]
- Zhao, G.; Wilde, S.A.; Cawood, P.A.; Lu, L. Petrology and P–T path of the Fuping mafic granulites: Implications for tectonic evolution of the central zone of the North China Craton. Metamorph. Geol. 2000, 18, 375–391. [Google Scholar] [CrossRef]
- Yang, J.; Wu, F.; Wilde, S.A.; Zhao, J. A review of the geodynamic setting of large-scale Late Mesozoic gold mineralization in the North China Craton: An association with lithospheric thinning. Ore Geol. Rev. 2003, 23, 125–152. [Google Scholar]
- Wang, Q.; He, P.; Wang, X. Study on Geological Characteristics and Geology Practical Value about MiddleTaihang Mountains, Hebei Province, China. Hebei GEO Univ. 2019, 42, 12–19, (Chinese with English Abstract). [Google Scholar]
- Liu, X. Genetic Mineralogy Study of Accessory Minerals of Granitoid Rocks of Mapeng Rock Mass in Mid-Taihang Mountain. Ph.D. Thesis, China University of Geosciences (Beijing), Beijing, China, 2009. (Chinese with English Abstract). [Google Scholar]
- Wang, T.; Guo, L.; Zheng, Y.; Donskaya, T.; Gladkochub, D.; Zeng, L.; Li, J.; Wang, Y.; Mazukabzov, A. Timing and processes of late Mesozoic mid-lower-crustal extension in continental NE Asia and implications for the tectonic setting of the destruction of the North China Craton: Mainly constrained by zircon U–Pb ages from metamorphic core complexes. Lithos 2012, 154, 315–345. [Google Scholar] [CrossRef]
- Cheng, H.; Wang, X.; Zhang, Y. Geochemistry, zircon U–Pb age and Hf isotope of the high Ba–Sr Mapeng granitoids in the Taihang Mountains and their geological significance. Int. Geol. Rev. 2024, in press. [Google Scholar]
- Liu, Y.; Li, C.; Zheng, J.; Huang, F.; Sun, H.; Tang, Y.; Xu, B. Zircon SHRIMP U–Pb age of Mapeng granite complex and its implication in Northern Taihang Mountains. Geol. Explor. 2010, 46, 622–627, (Chinese with English Abstract). [Google Scholar]
- Men, W.; Liu, J.; Zhang, H.; Zhang, S.; Wang, J.; Wu, J. LA-ICP-MS Zircon U-Pb Geochronology and Genesis of Dark Diorite Enclaves in the Mapeng Batholith, Shihu Gold Field. Acta Miner. Sin. 2014, 34, 487–495, (Chinese with English Abstract). [Google Scholar]
- Zhang, M. Petrogenesis and Solidification Condition of Early Cretaceous Mapeng Pluton in the North Taihang Mountain. Ph.D. Thesis, China University of Geosciences (Beijing), Beijing, China, 2020. (Chinese with English Abstract). [Google Scholar]
- Cheng, H.; Du, L.; Yang, C.; Su, R.; Meng, Q.; Liu, G.; Wang, M.; Zhang, Z.; Jing, J.; Wang, X. Geochemistry, zircon U-Pb age and Hf isotope characteristies of high-Ba-Srgranites in Mapeng area, Taihang Mountains and their geological significance. Acta Petrol. Miner. 2024, 43, 719–736, (Chinese with English Abstract). [Google Scholar]
- Gao, S.; Rudnick, R.L.; Yuan, H.; Liu, X.; Liu, Y.; Xu, W.; Ling, W.; Ayers, J.; Wang, X.; Wang, Q. Recycling lower continental crust in the North China craton. Nature 2004, 432, 892–897. [Google Scholar] [CrossRef]
- Jiang, N.; Liu, Y.; Zhou, W.; Yang, J.; Zhang, S. Derivation of Mesozoic adakitic magmas from ancient lower crust in the North China craton. Geochim. Cosmochim. Acta 2007, 71, 2591–2608. [Google Scholar] [CrossRef]
- Xiao, L.; Rapp, R.P.; Xu, J. The role of deep processes controls on variation of compositions of adakitic rocks. Acta Petrol. Sin. 2004, 20, 219–228, (Chinese with English Abstract). [Google Scholar]
- Davis, G.; Zheng, Y.; Wang, C.; Darby, B.J.; Zhang, C.; Gehrels, G. Geometry and geochronology of Yanshan Belt tectonics. In Collected Works of International Symposium on Geological Science; Seismological Press: Beijing, China, 1998; pp. 275–292. [Google Scholar]
- Li, L.; Han, B.; Miao, G.; Shu, G.; Chen, J.; Yang, J.; Yang, Y.; Zhang, Y. The age, emplacement depth, and tectonic significance of the Mapeng-Chiwawu pluton in the Fuping region of the Taihang Mountains. Acta Petrol. Sin. 2012, 31, 289–306. [Google Scholar]
- Li, Z. Petrology, Geochemistry, Zircon Genetic Mineralogy, U-Pb Geochronology of the dykes around Shihu gold mine, Hebei Province and Its Implication on Gold Mineralization. Master’s Thesis, China University of Geosciences (Beijing), Beijing, China, 2009. (Chinese with English Abstract). [Google Scholar]
- Zhang, Y.; Hu, X. Research on the characteristics of Mapeng granitic intrusion and its contribution to the gold ore metallogeny. Cent. South Inst. Min. Metall. 1994, 25, 275–281. [Google Scholar]
- Li, Q.; Santosh, M.; Li, S.; Zhang, J. Petrology, geochemistry and zircon U–Pb and Lu–Hf isotopes of the Cretaceous dykes in the central North China Craton: Implications for magma genesis and gold metallogeny. Ore Geol. Rev. 2015, 67, 57–77. [Google Scholar] [CrossRef]
- Streckeisen, A.L. To each plutonic rock its proper name. Earth-Sci. Rev. 1976, 12, 1–33. [Google Scholar] [CrossRef]
- Xia, S.; Qi, Y.; Yu, S.; Jiang, X.; Gao, X.; Wang, Y.; Li, C.; Wang, Q.; Wang, L.; Peng, Y. Magma Mixing Origin for the Menyuan Granodioritic Pluton in the North Qilian Orogenic Belt, China. Minerals 2025, 15, 391. [Google Scholar] [CrossRef]
- Marsh, B.D. On the interpretation of crystal size distributions in magmatic systems. J. Petrol. 1998, 39, 553–599. [Google Scholar] [CrossRef]
- Marsh, B.D. Crystallization of silicate magmas deciphered using crystal size distributions. J. Am. Ceram. Soc. 2007, 90, 746–757. [Google Scholar] [CrossRef]
- Xu, Z.; Yang, Z.; An, X.; Xu, R.; Qi, J. Relationship between the texture and composition of titanomagnetite and its implications for magma dynamics in the Hannuoba basalt. Minerals 2022, 12, 1412. [Google Scholar] [CrossRef]
- Yang, Z.; Luo, Z.; Lu, X. Quantitative textural analysis of igneous rocks and the kinetics and dynamics of magma solidification processes. Earth Sci. Front. 2010, 17, 246–266, (Chinese with English Abstract). [Google Scholar]
- Schulz, B.; Sandmann, D.; Gilbricht, S. SEM-based automated mineralogy and its application in geo- and material sciences. Minerals 2020, 10, 1004. [Google Scholar] [CrossRef]
- Bindeman, I.N.; Davis, A.M. Trace element partitioning between plagioclase and melt: Investigation of dopant influence on partition coefficients. Geochim. Cosmochim. Acta 2000, 64, 2863–2878. [Google Scholar] [CrossRef]
- Jerram, D.A.; Cheadle, M.J.; Hunter, R.H.; Elliott, M.T. The spatial distribution of grains and crystals in rocks. Contrib. Mineral. Petrol. 1996, 125, 60–74. [Google Scholar] [CrossRef]
- Williams, E.; Boudreau, A. Textures of orthopyroxenites from the Burgersfort bulge of the eastern Bushveld Complex, Republic of South Africa. Contrib. Mineral. Petrol. 2006, 151, 480–492. [Google Scholar] [CrossRef]
- Higgins, M.D. Measurement of crystal size distributions. Am. Mineral. 2000, 85, 1105–1116. [Google Scholar] [CrossRef]
- Sobolev, S.N.; Ariskin, A.A.; Nikolaev, G.S.; Pshenitsyn, I.V. Three types of olivine crystal size distribution in dunites from the Yoko-Dovyren layered massif as signals of their different crystallization history. Petrology 2024, 32, 534–550. [Google Scholar] [CrossRef]
- Ariskin, A.; Danyushevsky, L.; Nikolaev, G.; Kislov, E.; Fiorentini, M.; Mcneill, A.; Kostitsyn, Y.; Goemann, K.; Feig, S.T.; Malyshev, A. The Dovyren Intrusive Complex (Southern Siberia, Russia): Insights into dynamics of an open magma chamber with implications for parental magma origin, composition, and Cu–Ni–PGE fertility. Lithos 2018, 302–303, 242–262. [Google Scholar] [CrossRef]
- Barnes, S.J. The effect of trapped liquid crystallization on cumulus mineral compositions in layered intrusions. Contrib. Mineral. Petrol. 1986, 93, 524–531. [Google Scholar] [CrossRef]
- Suhendro, I.; Yuliawan, E.; Zen, R.; Rahmawati, Z.Y.; Priyana, P.E.; Diwijaya, S.; Suhartono, M.A.T.S.P.; Jonathan, A.; Latief, A.E.Z. Petrology, geochemistry, and crystal size distribution of the basaltic andesite–dacite association at Mt. Sumbing, Central Java, Indonesia: Insights to magma reservoir dynamics and petrogenesis. Acta Geochim. 2024, 43, 838–855. [Google Scholar] [CrossRef]
- Jerram, D.A.; Cheadle, M.J.; Philpotts, A.R. Quantifying the building blocks of igneous rocks: Are clustered crystal frameworks the foundation. J. Petrol. 2003, 44, 2033–2051. [Google Scholar] [CrossRef]
- Higgins, M.D. Origin of anorthosite by textural coarsening: Quantitative CSD evidence from the Laramie anorthosite. Contrib. Mineral. Petrol. 1998, 131, 231–244. [Google Scholar]
- Jerram, D.A.; Dobson, K.J.; Morgan, D.J.; Pankhurst, M.J. The petrogenesis of magmatic systems: Using igneous textures to understand magmatic processes. In Volcanic and Igneous Plumbing Systems; Burchardt, S., Ed.; Elsevier: Amsterdam, The Netherlands, 2018; pp. 191–229. [Google Scholar]
- Holness, M.B.; Anderson, A.T.; Martin, V.M.; Maclennan, J.; Passmore, E.; Schwindinger, K. Textures in partially solidified crystalline nodules: A window into the pore structure of slowly cooled mafic intrusions. J. Petrol. 2007, 48, 1243–1264. [Google Scholar] [CrossRef]
- Zhao, Z.; Wang, C.; Dou, J.; Wei, B. A mush-facilitated magma mixing process revealed by complex zoning of plagioclase in mafic magmatic enclaves of the early Cretaceous Sanguliu granitic pluton, East China. J. Petrol. 2023, 64, egad048. [Google Scholar] [CrossRef]
- Higgins, M.D. Closure in crystal size distributions (CSD), verification of CSD calculations, and the significance of CSD fans. Am. Miner. 2002, 87, 171–175. [Google Scholar] [CrossRef]
- Yuguchi, T.; Ogita, Y.; Kato, T.; Yokota, R.; Sasao, E.; Nishiyama, T. Crystallization processes of quartz in a granitic magma: Cathodoluminescence zonation pattern controlled by temperature and titanium diffusivity. J. Asian Earth Sci. 2020, 192, 104289. [Google Scholar] [CrossRef]
- Perugini, D.; Poli, G. The mixing of magmas in plutonic and volcanic environments: Analogies and differences between outcrop and experimental evidence. Lithos 2012, 153, 142–164. [Google Scholar] [CrossRef]
- Sparks, R.S.J.; Marshall, L.A. Thermal and mechanical constraints on mixing between mafic and silicic magmas. J. Volcanol. Geotherm. Res. 1986, 29, 99–124. [Google Scholar] [CrossRef]
- Billon, M.; Auwera, J.V.; Namur, O.; Faure, F.; Holness, M.B.; Charlier, B. Plagioclase crystal size distributions, growth and nucleation rates in an anhydrous arc basaltic andesite. Contrib. Mineral. Petrol. 2025, 180, 26. [Google Scholar] [CrossRef]
- Wark, D.A.; Watson, E.B. TitaniQ: A titanium-in-quartz geothermometer. Contrib. Mineral. Petrol. 2006, 152, 743–754. [Google Scholar] [CrossRef]
Disclaimer/Publisher’s Note: The statements, opinions and data contained in all publications are solely those of the individual author(s) and contributor(s) and not of MDPI and/or the editor(s). MDPI and/or the editor(s) disclaim responsibility for any injury to people or property resulting from any ideas, methods, instructions or products referred to in the content. |
© 2025 by the authors. Licensee MDPI, Basel, Switzerland. This article is an open access article distributed under the terms and conditions of the Creative Commons Attribution (CC BY) license (https://creativecommons.org/licenses/by/4.0/).