Abstract
This work investigates the influence of chemical composition, grain boundary (GB) type, and atomic distribution on the thermal conductivity of Hf–Nb–Ta–Zr refractory high-entropy alloys (RHEAs) via atomistic simulations. Three compositions—equiatomic HfNbTaZr (M1), Hf10Nb40Ta10Zr40 (M2), and Hf40Nb10Ta40Zr10 (M3)—were studied in single-crystalline and bicrystalline models containing Σ3 or Σ5 GBs. The effect of chemical short-range order (SRO) and GB segregation was probed by comparing results for non-relaxed structures with those obtained for corresponding materials relaxed using combined Monte Carlo/molecular dynamics (MC/MD) simulation. Material relaxation is accompanied by the formation of coherent nanoclusters (NbTa in M1, Nb or Zr in M2, Hf or Ta in M3) and Hf/Zr segregation to GBs. In single crystals, SRO reduces thermal conductivity by up to ~2.7% (e.g., from 3.66 to 3.56 W/m·K in M1), which is explained by the phonon scattering effect from matrix–cluster interfaces, densely distributed in the structures. In contrast, in certain bicrystals, the combined effects of GB healing and intragranular cluster coarsening lead to a 6.9% increase in thermal conductivity (from 4.59 to 4.93 W/m·K), despite the presence of high-energy Σ5 GBs. These results demonstrate that the interplay between SRO, GB segregation, and microstructural evolution governs phonon transport in RHEAs, revealing a counterintuitive pathway to enhance thermal conductivity through controlled atomic redistribution.
1. Introduction
High-entropy alloys (HEAs) are a class of materials formed by combining multiple principal elements in near-equiatomic ratios, leading to high configurational entropy and complex chemical environments [1,2,3]. Their unique atomic structure, often characterized by severe lattice distortion and sluggish diffusion, provides a platform for exceptional mechanical and functional properties, such as high strength, hardness, corrosion resistance, and thermal stability [4,5,6]. Among these, refractory HEAs (RHEAs) based on early transition metals, particularly those with body-centered cubic (bcc) structures, have gained attention due to their excellent performance at elevated temperatures [7,8,9,10].
In HEAs, the intrinsic lattice disorder caused by varying atomic sizes and bonding characteristics strongly affects phonon transport, making thermal conductivity a particularly interesting and complex property to study [9,11]. Unlike conventional metals, where heat is predominantly carried by electrons, in HEAs, the electronic contribution can be significantly suppressed due to scattering on the disordered potential field [12]. As a result, the phononic component of thermal conductivity becomes dominant, especially at low and intermediate temperatures [13,14,15]. Recent studies have demonstrated that the thermal conductivity of HEAs can be lower than that of their constituent elements, offering the potential for applications such as thermal barriers and thermoelectric devices [16,17,18].
The atomic-scale structure and chemical short-range order (SRO) in HEAs are now recognized as key factors influencing their mechanical and thermal properties [19,20,21]. It has been shown that local chemical ordering can arise even in nominally random alloys, giving rise to nm-sized clusters or modulations in atomic distribution [22,23]. These structural features not only affect dislocation behavior and phase stability but also act as phonon scattering centers, thereby reducing the mean free path and thermal conductivity [24,25,26,27]. The role of SRO is particularly critical in bcc refractory HEAs, where subtle changes in local bonding can result in significant changes in lattice dynamics and energy transport mechanisms [28].
Despite the growing interest in the thermal properties of HEAs, experimental investigations remain limited due to the challenges in synthesizing well-controlled, defect-free samples and the difficulties in isolating phonon contributions from electronic ones [29,30]. In this context, atomistic simulations serve as an essential tool, allowing researchers to explore how alloy composition, atomic ordering, and microstructural features such as grain boundaries influence thermal transport [31,32]. Molecular dynamics (MD) simulations are widely used due to their ability to simulate large systems and capture anharmonic lattice dynamics, while Monte Carlo (MC) techniques can efficiently model atomic exchanges and mimic chemical ordering during diffusion [33,34,35].
Several studies have employed MD to calculate phonon thermal conductivity in model HEAs and assess the influence of compositional disorder, mass fluctuation, and strain fields on phonon scattering [36,37,38]. For example, MD studies of fcc CrFeCoNiCu alloys have demonstrated a strong temperature dependence of phonon transport, diverging significantly from predictions based on pure element behavior [39]. In addition, coupling MC simulations with MD has proven effective in capturing the effects of SRO and its impact on thermophysical behavior [40,41,42].
Another important factor is the presence of grain boundaries (GBs), which introduce additional phonon scattering mechanisms that can further reduce thermal conductivity [43,44]. The interaction between GBs and SRO in RHEAs is still not fully understood, yet it holds key implications for tailoring thermal performance through microstructural engineering. Theoretical studies have shown that GB structures, including their character distribution and chemical composition, can significantly influence vibrational properties and energy dissipation [45,46,47,48].
Given the limitations of analytical models and the complexity of HEAs, computational approaches offer a viable pathway for understanding and predicting thermal transport in these alloys [49]. Therefore, in the current work, we employ large-scale atomistic simulations to systematically investigate the influence of chemical composition, GB structure, and SRO on phonon-mediated thermal conductivity in Hf–Nb–Ta–Zr RHEAs. Considerable attention has been paid to the mechanical properties of alloys in this system, but questions remain regarding the influence of defect structures and particles on thermal conductivity. By combining MC and MD (MC/MD) methods, we aim to reveal the influence of coherent nanoparticles and GB segregation on thermal conductivity in three different RHEAs.
This study identified the conditions under which microstructural relaxation can increase thermal conductivity, which is important to consider when designing heat-conducting refractory materials. The main hypothesis of this study is that material relaxation (through SRO and GB segregation) can either decrease or increase thermal conductivity. This is determined by the contribution of lattice distortions and defects, such as coherent interfaces and GBs, to phonon scattering as well as the involvement of segregation in reducing phonon scattering at GBs.
Although MC/MD methods have been previously applied to HEAs, most of these studies have focused on single crystals or only mechanical properties [40,41,42]. To our knowledge, the combined effect of solute segregation to Σ3 and Σ5 GBs and intragranular clustering on heat transfer in RHEAs has not yet been investigated.
It has been demonstrated for the first time that, due to the solute segregation, high-energy symmetric GBs can transform into boundaries with lower resistance to phonon transport. This opens up new possibilities for prediction in the design of RHEAs with tunable thermal characteristics.
2. Materials and Methods
2.1. Material of Study and Considered Models
In this work, thermal conductivity is calculated for RHEAs of three different compositions, namely, equiatomic one HfNbTaZr, Hf10Nb40Ta10Zr40, and Hf40Nb10Ta40Zr10, which are denoted in the text as M1, M2, and M3, respectively. The interaction between atoms in these RHEAs is described by the modified embedded atom method potential [21]. A total of ~30,000 atoms of each alloy fill three different simulation cells having the form of orthogonal parallelepiped with dimensions 5 nm × 22 nm × 5 nm. At the initial state, the atoms of M1, M2, and M3 are distributed randomly within their structures (Figure 1a). The first model is single crystal of bcc lattice and, obviously, does not have any GBs; the second one contains two bcc crystals separated by low-energy symmetric tilt GBs Σ3()[110]; while in the third one, they are separated by GBs Σ5(210)[001] (Figure 1b). In each bicrystal, one of the GBs is located in the middle of the constructed cell, with the GB plane oriented perpendicular to the y-axis, and the second boundary is formed by the right and left edges of the bicrystal as a result of using periodic boundary conditions along the y-axis upon subsequent simulations.
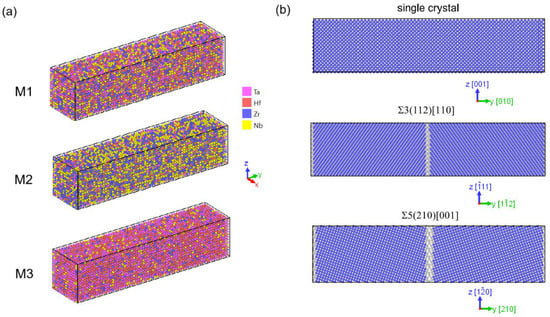
Figure 1.
RHEAs of three considered compositions M1, M2, and M3 (a); three different computational cells filled with atoms of M1, M2, or M3 (b).
2.2. MC/MD Relaxation Procedure
As was mentioned earlier, at the initial state, the atoms in the RHEAs are distributed randomly (Figure 1a). Obviously, such solid solutions have non-relaxed structures and represent materials before diffusion-mediated relaxation. Despite the absence of thermodynamic equilibrium, such configurations are widely used in atomistic modeling of HEAs to eliminate the effects of chemical ordering [36,40,42]. By comparing relaxed and non-relaxed states under identical modeling conditions, it can be confirmed that the observed differences in thermal conductivity arise precisely as a result of structural features that occur during material relaxation.
Combined MC/MD simulation is performed to reduce the initial energy of the materials and obtain more relaxed structures. This method allows for consideration of the diffusion process, while MD modelling itself cannot take it into account. It should be noted that material relaxation using such a hybrid approach is quite time consuming, especially when we deal with multicomponent alloys.
Prior to the MC/MD relaxation simulation, three single crystalline and six bicrystalline samples (three models for each composition) are subjected to an energy minimization using the conjugate gradient method. After this process, the alloys are equilibrated at 600 K within 20 ps in the isobaric–isothermal ensemble. All the pressure components during the MD equilibration are maintained at 0 Pa. The periodic boundary conditions are imposed along the x-, y-, and z-axis, and a timestep is set as 1 fs.
Subsequent material relaxation is realized through the hybrid MC/MD modelling when MC-based atomic swapping and a simultaneous MD thermalization process at 600 K and zero stresses take place. The former is based on a widely used Metropolis criterion, which determines the probability of atom exchange. The latter happens when the energy of a system E after the exchange (i + 1) is less than the energy before it (i). In the opposite situation, the atomic exchange can be accepted with a probability P that can be found as follows [50]:
where k is the Boltzmann constant and T is temperature. Only one atom exchange is realized within one timestep, and the kinetic energy of the system remains unchanged after each swap. For each atomic pair of considered RHEAs, a total of 200,000 swaps within 100 MC/MD relaxation cycles are performed. The simultaneous MD equilibration during the MC atom exchange provides an additional structure stabilization and decrease in system energy.
2.3. MD Modelling of Heat Transfer
The thermal conductivity is calculated for 18 different structure configurations, which can differ by chemical compositions (M1, M2, or M3), considered MD model (without GBs, with Σ3 or Σ5 GBs), or atomic distribution (i.e., the states before or after the MC/MD relaxation). Figure 2a shows a schematic representation of the computational cells used for modelling of heat transfer. Note that, due to replication of the initial computational cells along the y-axis, the length of the samples for the thermal conductivity calculation along this direction is twice as big as the length of the samples used earlier for the MC/MD relaxation.
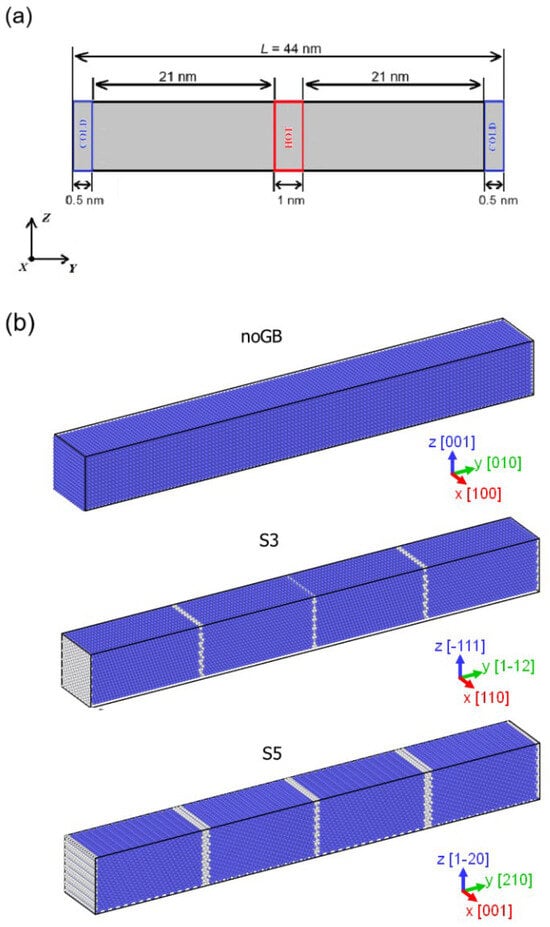
Figure 2.
Schematic illustration of computational cell used for MD modelling of heat transfer in the alloys with the hot block in the middle and cold blocks at the edges of the cell (a); MD models obtained by replication of the initial bicrystal (see Figure 1b) along the y-axis (b).
First, the considered 18 samples are subjected to energy minimization and thermalization at 300 K. To initiate the heat transfer in the materials, a block of atoms in the middle part of the cells along the y-axis is heated up to 350 K, while two blocks of atoms at their edges are cooled down to 250 K (see Figure 2a). After that, the obtained structures are equilibrated within 25 ps in the NVE ensemble. The Langevin thermostat is adopted to maintain the blocks at the desired temperature during the equilibration and upon subsequent heat transfer modelling within 250 ps.
To ensure convergence of the calculated thermal conductivity, we monitored the temperature profile evolution over time, where all systems reach smooth, quasi-parabolic profiles by 20 ps, beyond which no significant changes occur up to 250 ps of simulation. Furthermore, the energy flux dQ stabilizes within the first 50 ps and remains constant thereafter, confirming steady-state heat flow. Regarding system size, the sample length along the heat flux direction (the y-axis) is ~44 nm after replication (see Figure 2), which exceeds typical phonon mean free paths in disordered alloys (~1–10 nm) [36]. Additional test simulations with doubled length (88 nm) showed less than 3% variation in κ, consistent with convergence benchmarks reported in similar MD studies of HEAs [40].
The phonon thermal conductivity coefficient of the composites is calculated using the following expressions:
where k represents the phonon thermal conductivity coefficient, dQ is the energy flux, and dT/dY corresponds to the temperature gradient along the y-axis.
In this equation, N denotes the total number of atoms, and (Q1 − Q2)/2 is the average energy per atom, derived from the difference between the input energy Q1 and output energy Q2 across the two regions. Here, n is the number of simulation steps, τ is the timestep, S is the cross-sectional area in the xz-plane, dT is the average temperature difference between the two regions, and dY is the distance separating the hot and cold blocks.
For convenience, abbreviated notations for the 18 considered structures are introduced. If “M1”, “M2”, or “M3” defines the alloy composition, then “noGB”, “S3”, or “S5” indicates single crystal models with four Σ3 or Σ5 GBs, respectively (Figure 2b). To differentiate materials before and after the MC/MD relaxation, shortened “noR” and “R” are introduced, respectively. For example, if we deal with RHEA Hf10Nb40Ta10Zr40, then the sample of this composition having Σ3 GBs that is not subjected to the MC/MD relaxation is referred to as “M2_S3_noR” in the text.
3. Results
3.1. SRO and GB Segregation
Figure 3 demonstrates how fast energy of the systems considered decreases with the MC/MD relaxation cycles. It is seen that, for all three compositions, regardless of the presence of GBs, the energies drop abruptly within the first ~20 cycles. With further relaxation, they decrease more gradually, and after 100 cycles, the materials reach more or less steady-state conditions with reduced energy. The energies of the models with GBs Σ5(210)[001] (S5), however, are higher than the corresponding values for the other samples (Figure 3a–c), even after all the relaxation cycles. This indicates that the GB energy of Σ5 is higher than that of GB Σ3. It is important to note that, in the case of composition M2, after the MC/MD relaxation procedure, the energy of the sample with GBs Σ3 is even lower than that of the corresponding single crystal (Figure 3b). For the other compositions, they are very close (Figure 3a,c).

Figure 3.
Decrease in average energy per atom with the MC/MD relaxation of (a) M1; (b) M2; and (c) M3.
The atomic structures of the samples after the MC/MD relaxation are given in Figure 4. It can be seen that, in the case of the equiatomic composition, nanocoherent clusters of NbTa having the B2 structure [51] can easily be observed in sample M1_noGB_R (Figure 4a), while in M1_S3_R (Figure 4b) and M1_S5_R (Figure 4c), they are not so visible. During MC/MD relaxation, coherent nanoclusters form—locally ordered domains (e.g., B2-type NbTa in M1) that retain crystallographic alignment with the surrounding bcc matrix but, due to differences in composition, lead to the appearance of local elastic strains at the cluster–matrix interface. In addition, some segregation of Zr or Hf can be found in the structures. Unlike the single crystal, in materials with GBs, the areas formed solely by Nb atoms can be detected. It is important to note that some atoms of Hf and Zr segregate to GBs, especially clearly seen for sample S5. It is noticeable that Hf, having a bigger atomic radius than that of Zr, first occupies atomic positions in the GBs with the highest free volume (see Figure 4b,c). In the case of the second considered composition (M2), the NbTa cluster formation does not take place. Instead, relatively large conglomerates of Nb or Zr can be seen. It is important to note that, for S3 and S5, GB regions are occupied by atoms of Hf or Zr, similar to M1_S3_R and M1_S5_R. When we deal with the third composition (M3), the areas formed solely by Hf or Ta atoms can be observed. Along with such areas, some clusters of NbTa can be found in the structures. Like in the previous cases, Hf and Zr segregate to GBs.
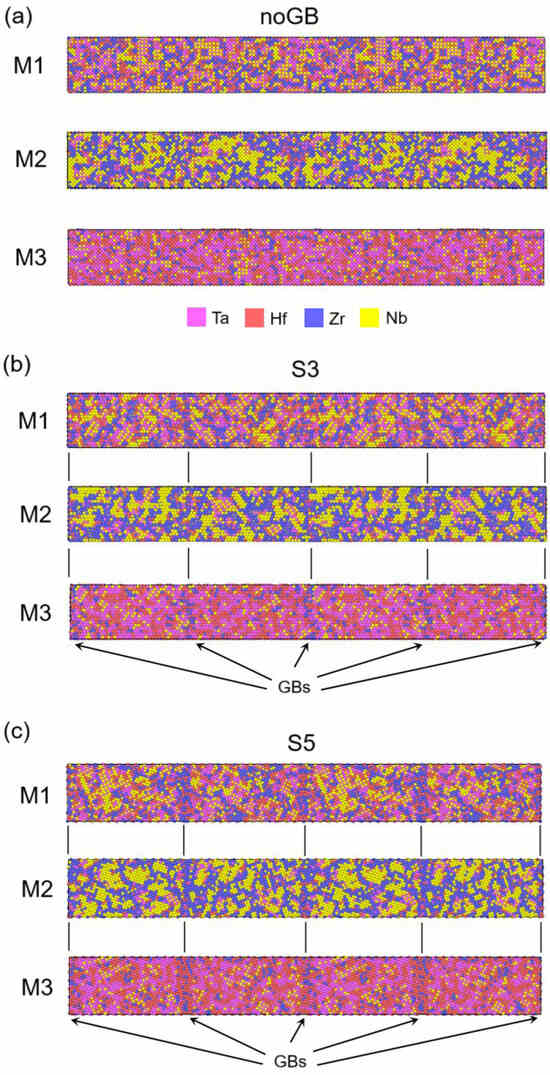
Figure 4.
Atomic structures of the alloys after the MC/MD relaxation in the considered models: (a) noGB; (b) S3; and (c) S5.
The segregation of atoms to GBs is more pronounced in the samples S5 having GBs Σ5(210)[001] than in S3 with GBs Σ3()[110]. The latter is mainly due to the difference in the GB energy. According to [52], the GB energy of Σ5 is much higher than that of Σ3 (1.61 J/m2 over 0.43 J/m2). The segregation of atoms to GB reduces its energy, leading to relaxation of the entire system.
Quantitatively, SRO is usually estimated by calculating the Warren–Cowley parameter (α), also known as the SRO parameter, for various atomic pairs of the material under consideration [40]. If the calculated α is negative, then the two atoms tend to form a chemical bond, while a positive value indicates that they are far apart from each other.
The diagrams of order parameter α for possible atomic pairs in the considered RHEAs are given in Figure 5. The calculated values agree well with the atomic structures described earlier (Figure 4). For all three compositions, HfNbTaZr (M1), Hf10Nb40Ta10Zr40 (M2), and Hf40Nb10Ta40Zr10 (M3), the atomic pairs Zr–Ta, Zr–Nb, Hf–Ta, and Hf–Nb do not form chemical bonds with each other since α > 0. At the same time, Ta, Zr, and Nb strive to form bonds with atoms of the same type of element (α < 0). For the equiatomic alloy, this tendency is not so strong. However, for the alloys with less content of Ta (M2) or Zr (M3), it becomes more pronounced. For Ta–Ta in M2 (Figure 5b) and Zr–Zr in M3 (Figure 5c), the α values are more negative compared to the values for M1 (Figure 5a). This finding is consistent with the results obtained earlier by Jarlov et al. [28]. Two atoms form interatomic bonds more easily when their content in the material is lower. Only for two different element pairs, namely for Hf–Zr and Nb–Ta, the order parameter α can be negative, indicating the possibility for chemical bond formation. However, it is difficult to find Nb–Ta clusters in M2 (Figure 4), and the corresponding order parameters α are even positive (Figure 5b). This can be explained by the very low α for the Ta–Ta atomic pair, which indicates a low contribution of Ta atoms to the formation of Nb–Ta bonds.
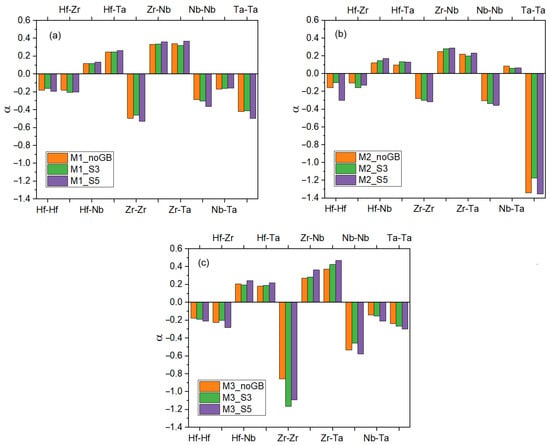
Figure 5.
SRO parameter α for different atomic pairs in RHEAs M1 (a), M2 (b), and M3 (c).
3.2. Thermal Conductivity
To evaluate the impact of chemical composition, SRO, and GB structure on thermal transport in RHEAs, we calculated the lattice thermal conductivity (κ) for all 18 studied samples. Recall that they can differ by alloy composition, defect structure (without or with GBs Σ5 or GBs Σ5), or by level of material relaxation. The results show a strong dependence of thermal conductivity on material composition as well as a complex relationship between atomic structure and phonon transport in the RHEA under consideration. Table 1 lists the calculated κ values.

Table 1.
Thermal conductivity of RHEAs (W/(m·K)). The values of κ that increased after MC/MD relaxation are underlined.
It is seen that the thermal conductivity increases in the sequence M1 -> M2 -> M3. Accordingly, the equiatomic alloy exhibits the lowest κ value (first column). For all compositions, in the absence of GBs, SRO leads to a decrease in κ (see the first two columns). In the presence of GBs, κ is determined not only by the alloy composition but also by the GB structure. As a result, after MC/MD relaxation of the material, κ decreases in some cases and increases in others (highlighted in yellow). The latter effect is particularly pronounced for the M3 alloy (bottom row), which is rather unusual, since it is generally believed that GBs reduce κ by hindering phonon transport.
4. Discussion
The highest κ value is observed for M3 (4.90 W/m·K), followed by M2 (3.81 W/m·K) and M1 (3.66 W/m·K). The lowest κ value for M1_noGB compared to M2_noGB and M3_noGB (Table 1) is obvious because equiatomic HEAs have the highest entropy and can be characterized by strong lattice distortion initiated by elements of different sizes contained in the material in equal proportions. As suggested by previous studies [21,28], a more uniform distribution of atomic masses and reduced configurational entropy may facilitate longer phonon mean free paths. According to [53], the covalent atomic radii of Ta, Hf, Nb, and Zr are 217, 212, 207, and 186 pm, respectively. The content of Zr and Nb in M2 and Hf and Ta in M3 is much higher. The atomic size difference between Zr and Nb is bigger than that between Hf and Ta. Therefore, unlike M3, atoms of M2 can cause strong distortion of its lattice. The latter explains the higher thermal conductivity for M3 compared to the other compositions.
These observations align with the Hume–Rothery rules for solid solution formation, which emphasize compatibility in atomic size, crystal structure, electronegativity, and valence electron concentration [54]. All four elements (Hf, Nb, Ta, Zr) have the bcc structure at high temperatures and exhibit similar electronegativities (Pauling scale: Hf 1.3, Nb 1.6, Ta 1.5, Zr 1.3) and VEC (~4–5 electrons/atom), favoring complete solubility. However, deviations arise due to atomic size mismatch: Zr (160 pm metallic radius) differs significantly from Nb (147 pm), whereas Hf (159 pm) and Ta (146 pm) are closely matched. This explains why M3 exhibits weaker lattice distortion and higher κ compared to M2, despite similar levels of SRO.
Figure 6 shows that temperature fluctuation inside the grains (σ_Grain) varies significantly across the considered structures. The relaxed samples of M1 tend to exhibit slightly lower σ_Grain values, which is consistent with the structural changes observed after the MC/MD equilibration. SRO inside grains of the equiatomic alloy leads to the formation of relatively big clusters of NbTa having the B2 superstructure (Figure 4) that reduce the average temperature fluctuation. However, for the single crystals of M2 and M3, one can observe the opposite situation; after the relaxation, the level of temperature fluctuation increases. The latter in M2 can be explained by the difference in SRO parameter α of constituent elements. The positive value of α for Zr–Nb (Figure 5) results in the formation of small single-element (Zr or Nb) ordered clusters, with Hf located inside or at interfaces of Zr clusters. Disperse distribution of Hf atoms within crystal M2 and positive α for Hf–Nb inhibit cluster growth (compare Figure 4a–c for M2), leading to significant temperature fluctuation. In the case of single crystal M3, Zr behaves similar to Hf in M2, since the order parameter for the Zr–Ta atomic pair is positive; Zr atoms retard growth of single-element (Ta or Hf) clusters (Figure 4a–c).
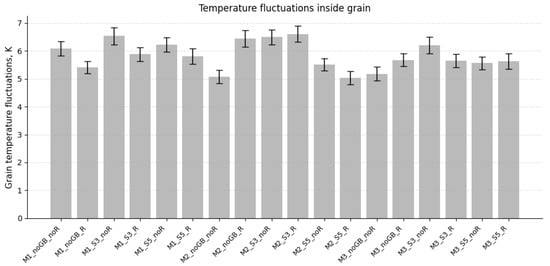
Figure 6.
Temperature fluctuations inside the grains of the structures under consideration.
However, in the presence of GBs, the temperature fluctuation level before and after the MC/MD relaxation is relatively close for both M2 and M3, which is associated with the formation of GB segregations of Hf and Zr and a decrease in their content inside the grains. The latter contributes to the growth of clusters and a decrease in the length of coherent boundaries between them (Figure 4). As for M1_S3 and M1_S5, the GB segregation of Hf and Zr increases the Nb and Ta content inside the grains. The latter reduces the tendency for chemical bond formation between Nb and Ta atoms [28], thus decreasing the size of clusters. Therefore, for these cases, the fluctuation is slightly higher than that for the single crystal (Figure 6).
Overall, subjecting the materials to the MC/MD relaxation leads to a moderate decrease in thermal conductivity in single crystals of M1, M2, and M3. This may be explained by the formation of nanoclusters with an ordered structure during relaxation as well as the emergence of coherent interfaces between the clusters and the surrounding matrix. These regions introduce local structural distortions, thereby impeding phonon propagation. For instance, after the relaxation, κ for M1_noGB decreases from 3.66 W/m·K to 3.56 W/m·K.
The reduction in thermal conductivity upon MC/MD relaxation in single crystals aligns with expectations based on increased phonon scattering due to mass and strain fluctuations induced by SRO. According to the Callaway formalism, the lattice thermal conductivity κL is inversely related to the total phonon scattering rate , where accounts for point defect scattering arising from mass variance and bond disorder [11,27]. In the equiatomic M1 alloy, the formation of ordered B2 NbTa nanoclusters introduces high-density coherent interfaces with the matrix, creating localized strain fields and vibrational mismatches that effectively shorten the phonon mean free path. This explains the ~2.7% decrease in κ from 3.66 to 3.56 W/m·K. Similarly, in M2 and M3, the emergence of Zr/Nb- or Ta/Hf-rich domains increases local compositional heterogeneity at interfaces, contributing to enhanced phonon scattering.
To gain insight into phonon scattering in SRO structures, it is desirable to compare the vibrational density of states (VDOS) for alloys before and after MC/MD relaxation. Recently, Mora-Barzaga et al. [55] compared the VDOS for unrelaxed and SRO RHEA HfNbTaTiZr as well as the VDOS of the corresponding ordered binary alloys. The authors concluded that the ordered B2 structure increases the phonon thermal conductivity of the alloy, and as its proportion in the material increases, the thermal conductivity increases even more. This proves that a slight decrease in thermal conductivity in relaxed samples in our case (Table 1) may be associated with the dispersed distribution of B2 nanoclusters and the high density of formed interfaces in the corresponding structures. Moreover, the significant difference in VDOS between binary alloys and RHEA observed in [55] suggests strong phonon reflection at coherent interfaces.
In general, in the non-relaxed samples, GBs are expected to reduce κ, which is indeed observed when comparing columns 1 with 3 and 5 (Table 1). However, unlike single crystals, the SRO process in defective samples can lead to either a decrease or an increase in thermal conductivity. The observed “exceptions,” when κ increases after the MC/MD relaxation, are most likely explained by a reduction in structural distortion at the GBs due to segregation of Hf and Zr atoms, which facilitates phonon transport. Caused by segregation of Hf and Zr atoms to GBs having high energy and free volume, the VDOS for such regions could become smoother and more homogeneous, implying improved vibrational continuity and reduced scattering strength. Moreover, the coherent interfaces between Ta and Hf clusters within the grains of the M3 alloy, unlike the Zr and Nb clusters in M2, do not introduce significant elastic strain, as the atomic radii of Ta and Hf are very similar. As a result, κ increases after relaxation in both M3 samples containing GBs. It is also worth noting that, in the case of M2, the Zr and Nb clusters in S5 are slightly larger than those in S3 (Figure 4b,c). The latter reduces the total length of the interphase boundary acting as a barrier to phonon motion and, therefore, may also contribute to the increase in κ observed for M2_S5 (Table 1).
Understanding the temperature distribution inside grains and GB regions can help reveal the role of chemical composition and local structural features, such as GB structure, in governing phonon scattering efficiency. For example, Figure 7 shows the spatial temperature distributions in samples M3_S5_noR and M2_S3_noR.
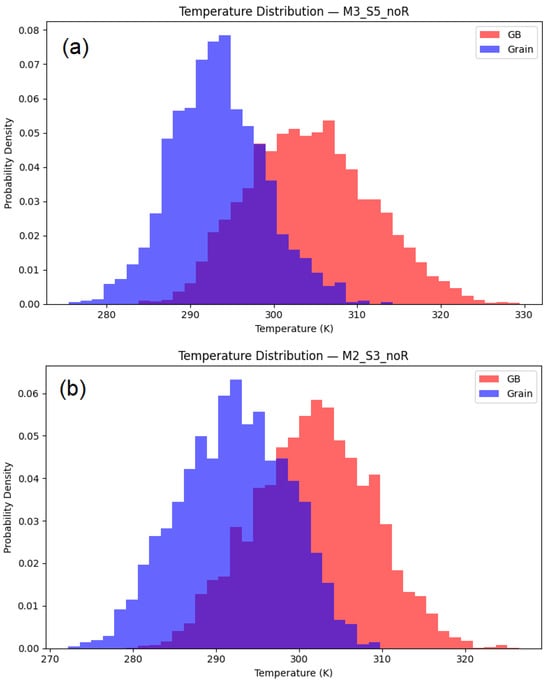
Figure 7.
Temperature distribution in GBs and grains of (a) M3_S5_noR and (b) M2_S3_noR.
It is seen that GB regions in M3_S5_noR exhibit a significant spread of temperatures compared to grain interior (Figure 7a), indicating strong scattering effects from the GBs in the non-relaxed structure. Meanwhile, in M2_S3_noR, the situation is slightly different: the corresponding temperature histogram for the GB regions is narrower (Figure 7b). This indicates a more uniform heat flow and less scattering effect from the GBs S3 compared to the GBs S5. At the same time, the temperature spread within the grains in material M2 becomes more significant than in M3. This proves that a high proportion of elements that vary greatly in atomic size, as in the case of Zr and Nb in M2, leads to significant lattice distortion, a broader histogram (Figure 7b), and a decrease in thermal conductivity (Table 1).
Figure 8 further quantifies the thermal inhomogeneity in the structures by assessing the standard deviation difference between the temperature in GBs and inside grains (Δσ). It is seen that, due to significant phonon scattering at the GBs, M3_S5_noR demonstrates the highest Δσ values (~1.8 K). In contrast, some relaxed samples (e.g., M1_S3_R and M2_S3_R) exhibit much smaller Δσ (~0.25–0.45 K), suggesting that the formation of GB segregations and clusters during material relaxation can effectively mitigate the GB-induced scattering. However, the results also demonstrate a strong dependence on composition.
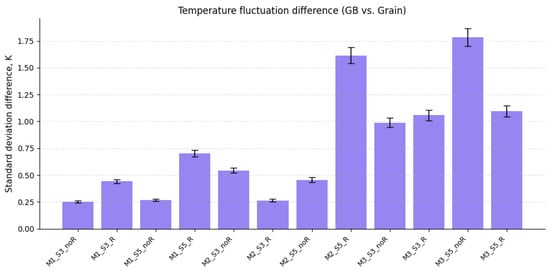
Figure 8.
Difference in temperature fluctuation in GB areas and inside grains (Δσ = σ_GB − σ_Grain) for the considered defect structures.
This reduction in Δσ—particularly pronounced in systems like M3_S5_R—indicates a significant mitigation of phonon scattering at GBs. To understand the underlying mechanisms, we analyzed the structural and chemical characteristics of Σ3 and Σ5 GBs. Using Voronoi tessellation, we calculated the average excess volume per atom at the interfaces, finding ~0.8 Å3/atom for Σ5 GBs versus ~0.3 Å3/atom for Σ3, consistent with their higher intrinsic energies (~1.61 J/m2 vs. ~0.43 J/m2) [52]. This larger free volume in Σ5 boundaries provides preferential sites for oversized atoms such as Hf (covalent radius: 212 pm) and Zr (186 pm) to segregate. Radial distribution function (RDF) analysis near GB cores reveals that Hf concentration increases by ~35–40% after relaxation in Σ5 models compared to only ~15–20% in Σ3. This pronounced segregation lowers interfacial energy and stabilizes the boundary structure, weakening its efficiency as a phonon scatterer—a process analogous to “defect healing”.
Concurrently, depletion of Hf and Zr from the grain interior promotes coarsening of intragranular Ta/Hf-rich clusters in M3, thereby reducing the total area of coherent phase boundaries that act as secondary scattering centers. As a result, the net increase in thermal conductivity observed in M3_S5_R (from 4.59 to 4.93 W/m·K) does not stem solely from reduced scattering intensity but rather from a microstructurally driven redistribution and consolidation of scattering sites—a phenomenon conceptually analogous to precipitate coarsening or dislocation starvation in mechanical strengthening mechanisms. This finding highlights a non-trivial design principle: controlled segregation can enhance phonon transport by minimizing the density of active scattering interfaces, even in defective polycrystalline materials.
Next, to understand the effect of GB on heat flow, the temperature profile along the y-axis is analyzed for selected samples after simulation for 2 ps, 5 ps, 10 ps, and 20 ps (Figure 9a–d). Each profile represents a set of averaged temperatures for 50 slices of the sample along the y-axis.
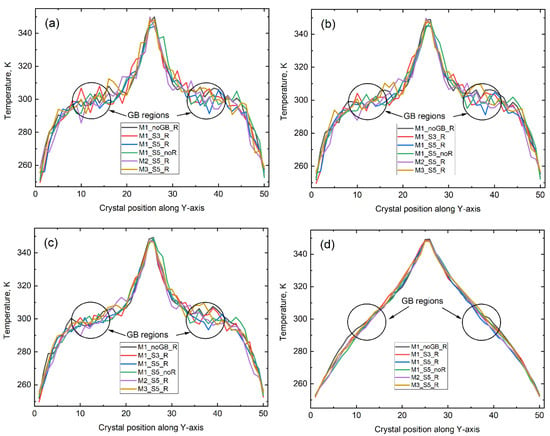
Figure 9.
Temperature profiles for selected structures after modeling of the heat transfer within (a) 2 ps, (b) 5 ps, (c) 10 ps, and (d) 20 ps. The length of the sample along the y-axis is conditionally divided into 50 segments of 9 Å thickness, the positions of which are shown on the abscissa by corresponding numbers. Positions of GBs located between the hot and cold blocks are shown by circles and arrows.
At an early stage (Figure 9a), heat diffusion is still limited, and temperature gradients are mainly localized near the hot and cold blocks. After 2 ps, a small disturbance is observed in samples with GBs, especially in M1_S5_noR and M1_S3_R, since the boundaries act as phonon scattering centers. It is also noticeable that the profile in the GB region for M1_S5_R is smoother than that for the corresponding non-relaxed material. By 5 ps (Figure 9b), the temperature oscillation between the blocks in the samples subjected to the MC/MD relaxation indicates a positive effect of GB segregation on the heat flux. It is also noticeable that the profiles are slightly asymmetrical due to a decrease in thermal diffusion on the hot block side, apparently caused by atomic vibrations and/or local differences in composition after relaxation of the materials. In another 5 ps (Figure 9c), most samples exhibit a nearly linear or smoothly curved profile line; however, the temperature plateau still remains in between the hot and cold blocks. At 20 ps (Figure 9d), all the temperature profiles have smooth, quasi-parabolic shapes, typical for near-steady-state heat flow. Further analysis confirms that, beyond 20 ps, the spatial temperature distributions for the considered structures remain unchanged.
It is important to mention that temperature profiles at 10 ps still display some curvature in all systems, including those without grain boundaries. However, by 20 ps, all the curves become nearly linear, regardless of GB presence or relaxation state. This suggests that the influence of GBs and coherent clusters on heat flow is largely transient and diminishes over time when the system approaches the steady state. We assume that, although GBs initially impede the flow of phonons due to local lattice mismatch and scattering of vibrational modes, ongoing interactions between phonons allow equilibrium to be achieved throughout the entire region, effectively smoothing out spatial disturbances within 20 ps of the heat transfer modelling [56,57].
The combination of statistical data on the non-uniform distribution of heat across the structure (Figure 6, Figure 7 and Figure 8) and the dynamics of the temperature profile over time (Figure 9) provides a comprehensive understanding of the heat transfer mechanisms in RHEAs and highlights the importance of assessing thermal diffusion in alloys with defects and local chemical heterogeneity.
Our predicted thermal conductivity values (3.5–4.9 W/m·K at 300 K) are indeed lower than those of pure refractory metals (e.g., Ta: ~57 W/m·K, Nb: ~54 W/m·K) but align well with reported data for complex solid solution and HEAs. For example, Zhang et al. [36] reported κ ≈ 2.5 W/m·K for NbMoTaW using machine-learning potentials, while Lu et al. [38] found ~5.3 W/m·K for AlCoCrNiFe. The suppression arises primarily from mass and strain fluctuations inherent to multicomponent lattices. Additionally, finite-size effects in MD simulations may slightly reduce κ due to artificial phonon confinement, though our system size (~44 nm) minimizes this. Overall, the absolute values are consistent with the expected trend for disordered bcc alloys, and the relative trends across compositions and microstructures remain robust and physically meaningful.
5. Conclusions
In the current study, the effects of chemical composition, GB type, and atomic distribution on thermal conductivity in Hf–Nb–Ta–Zr RHEAs were analyzed based on atomistic simulation. Three compositions, namely, M1 (HfNbTaZr), M2 (Hf10Nb40Ta10Zr40), and M3 (Hf40Nb10Ta40Zr10), were examined for single-crystalline and two bicrystalline models containing either Σ3 GBs (S3) or Σ5 GBs (S5). The atomic distribution effect was examined for the structures subjected to the MC/MD relaxation in comparison with the corresponding non-relaxed samples.
Structural analysis revealed that, during the MC/MD relaxation, the formation of coherent clusters and GB segregations take place. As a result of SRO, the NbTa clusters in M1, Nb or Zr conglomerates in M2, and areas enriched with Hf or Ta atoms in M3 were observed in the relaxed materials. For all the compositions, the segregation of Hf and Zr to GBs is observed in the defected samples (S2 and S3).
Both SRO and GB segregation significantly affect the phonon scattering and local thermal fluctuation. Analysis of thermal fluctuations inside the structures shows that GBs serve as scattering centers for phonon motion. However, phonon scattering at interfaces is transient and decreases with time under steady-state conditions.
In materials without GBs, due to the increased atomic disorder arising at the coherent boundaries between clusters and the matrix, the thermal conductivity of the materials decreases after MC/MD relaxation. However, in some samples with GBs, the segregation of Hf and Zr at the GBs and the decrease in the density of boundaries inside the grains due to the formation of relatively large clusters can promote phonon motion and increase the thermal conductivity compared to the corresponding non-relaxed materials.
These results highlight the important role of microstructural design considering both SRO and lattice defects for tailoring thermal transport in RHEAs used for high-temperature applications.
Author Contributions
Conceptualization, E.A.K.; methodology, E.A.K., R.I.B., and A.M.K.; software, R.I.B. and A.M.K.; investigation, R.I.B. and A.M.K.; writing—original draft preparation, R.I.B. and A.M.K.; writing—review and editing, E.A.K.; visualization, R.I.B. and A.M.K.; supervision, E.A.K. All authors have read and agreed to the published version of the manuscript.
Funding
The research was carried out with the support of the Ministry of Science and Higher Education of the Russian Federation within the framework of the State assignment “Study of physical and mechanical processes in the formation and strengthening of parts for aerospace and transport equipment” No. FEUE-2023-0006.
Data Availability Statement
The data presented in this study are available on request from the corresponding author due to privacy.
Conflicts of Interest
The authors declare no conflicts of interest.
References
- Miracle, D.B.; Senkov, O.N. A critical review of high entropy alloys and related concepts. Acta Mater. 2017, 122, 448–511. [Google Scholar] [CrossRef]
- Yeh, J.W.; Chen, S.K.; Lin, S.J.; Gan, J.Y.; Chin, T.S.; Shun, T.T.; Tsau, S.H.; Chang, S.Y. Nanostructured high-entropy alloys with multiple principal elements: Novel alloy design concepts and outcomes. Adv. Eng. Mater. 2004, 6, 299–303. [Google Scholar] [CrossRef]
- Cantor, B.; Chang, I.T.H.; Knight, P.; Vincent, A.J.B. Microstructural development in equiatomic multicomponent alloys. Mater. Sci. Eng. A 2004, 375–377, 213–218. [Google Scholar] [CrossRef]
- Zhang, Y.; Zuo, T.T.; Tang, Z.; Gao, M.C.; Dahmen, K.A.; Liaw, P.K.; Lu, Z.P. Microstructures and properties of high-entropy alloys. Prog. Mater. Sci. 2014, 61, 1–93. [Google Scholar] [CrossRef]
- Senkov, O.N.; Wilks, G.B.; Miracle, D.B.; Chuang, C.P.; Liaw, P.K. Refractory high-entropy alloys. Intermetallics 2010, 18, 1758–1765. [Google Scholar] [CrossRef]
- Yao, H.W.; Qiao, J.W.; Gao, M.C.; Hawk, J.A.; Ma, S.G.; Zhou, H.F.; Zhang, Y. NbTaV-(Ti,W) refractory high-entropy alloys: Experiments and modeling. Mater. Sci. Eng. A 2016, 674, 271–279. [Google Scholar] [CrossRef]
- Senkov, O.N.; Miller, J.D.; Miracle, D.B.; Woodward, C. Accelerated exploration of multi-principal element alloys with solid solution phases. Nat. Commun. 2015, 6, 6529. [Google Scholar] [CrossRef]
- Gludovatz, B.; Hohenwarter, A.; Catoor, D.; Chang, E.H.; George, E.P.; Ritchie, R.O. A fracture-resistant high-entropy alloy for cryogenic applications. Science 2014, 345, 1153–1158. [Google Scholar] [CrossRef]
- Wang, S.; Wu, M.; Shu, D.; Zhu, G.; Wang, D.; Sun, B. Mechanical instability and tensile properties of TiZrHfNbTa high entropy alloy at cryogenic temperatures. Acta Mater. 2020, 201, 517–527. [Google Scholar] [CrossRef]
- Jia, Y.; Zhang, L.; Li, P.; Ma, X.; Xu, L.; Wu, S.; Jia, Y.; Wang, G. Microstructure and Mechanical Properties of Nb–Ti–V–Zr Refractory Medium-Entropy Alloys. Front. Mater. 2020, 7, 172. [Google Scholar] [CrossRef]
- Körmann, F.; Ikeda, Y.; Grabowski, B.; Sluiter, M.H.F. Phonon broadening in high entropy alloys. npj Comput. Mater. 2017, 3, 36. [Google Scholar] [CrossRef]
- Wang, Y.; Zacherl, C.L.; Shang, S.; Chen, L.-Q.; Liu, Z.-K. Phonon dispersions in random alloys: A method based on special quasi-random structure force constants. J. Phys. Condens. Matter 2011, 23, 485403. [Google Scholar] [CrossRef]
- Zhang, Y.; Stocks, G.; Jin, K.; Lu, C.; Bei, H.; Sales, B.C.; Wang, L.; Béland, L.K.; Stoller, R.E.; Samolyuk, G.D.; et al. Influence of chemical disorder on energy dissipation and defect evolution in concentrated solid solution alloys. Nat. Commun. 2015, 6, 8736. [Google Scholar] [CrossRef]
- Dutta, B.; Bisht, K.; Ghosh, S. Ab initio calculation of phonon dispersions in size-mismatched disordered alloys. Phys. Rev. B 2010, 82, 134207. [Google Scholar] [CrossRef]
- Alam, A.; Ghosh, S.; Mookerjee, A. Phonons in disordered alloys: Comparison between augmented-space-based approximations for configuration averaging to integration from first principles. Phys. Rev. B 2007, 75, 134202. [Google Scholar] [CrossRef][Green Version]
- Sun, Z.; Shi, C.; Gao, L.; Lin, S.; Li, W. Thermal physical properties of high entropy alloy Al0.3CoCrFeNi at elevated temperatures. J. Alloys Compd. 2022, 901, 163554. [Google Scholar] [CrossRef]
- Laplanche, G.; Gadaud, P.; Horst, O.M.; Otto, F.; Eggeler, G.; George, E.P. Temperature dependencies of the elastic moduli and thermal expansion coefficient of an equiatomic, single-phase CoCrFeMnNi high-entropy alloy. J. Alloys Compd. 2015, 623, 348–353. [Google Scholar] [CrossRef]
- Wang, H.; Ma, S.; Zhao, W.; He, Q.; Liu, Y.; Zhao, S.; Yang, Y. Exceptionally low thermal conductivity in distorted high entropy alloy. Mater. Res. Lett. 2024, 13, 24–34. [Google Scholar] [CrossRef]
- Chen, S.; Aitken, Z.H.; Pattamatta, S.; Wu, Z.; Yu, Z.G.; Banerjee, R.; Srolovitz, D.J.; Liaw, P.K.; Zhang, Y.-W. Chemical-Affinity Disparity and Exclusivity Drive Atomic Segregation, Short-Range Ordering, and Cluster Formation in High-Entropy Alloys. Acta Mater. 2021, 206, 116638. [Google Scholar] [CrossRef]
- Huang, X.; Liu, L.; Liao, W.; Huang, J.; Sun, H.; Yu, C. Characterization of Nucleation Behavior in Temperature-Induced BCC-to-HCP Phase Transformation for High Entropy Alloy. Acta Metall. Sin. (Engl. Lett.) 2021, 34, 1546–1556. [Google Scholar] [CrossRef]
- Huang, X.; Liu, L.; Duan, X.; Liao, W.; Huang, J.; Sun, H.; Yu, C. Atomistic simulation of chemical short-range order in HfNbTaZr high entropy alloy based on a newly-developed interatomic potential. Mater. Des. 2021, 202, 109560. [Google Scholar] [CrossRef]
- Ferrari, A.; Körmann, F.; Asta, M.; Neugebauer, J. Simulating short-range order in compositionally complex materials. Nat. Comput. Sci. 2023, 3, 221–229. [Google Scholar] [CrossRef] [PubMed]
- Antillon, E.; Woodward, C.; Rao, S.I.; Akdim, B. Chemical short range order strengthening in BCC complex concentrated alloys. Acta Mater. 2021, 215, 117012. [Google Scholar] [CrossRef]
- Tsai, M.-H. Physical Properties of High Entropy Alloys. Entropy 2013, 15, 5338–5345. [Google Scholar] [CrossRef]
- Li, Z.; Li, L.; Luo, L. Thermal Conductivity Properties of Ti–V–Cr–Fe–M (M = Mn, Co, Sc and Ni) High Entropy Alloys. Nano 2025, 2550025. [Google Scholar] [CrossRef]
- Yang, X.; Tiwari, J.; Feng, T. Reduced anharmonic phonon scattering cross-section slows the decrease of thermal conductivity with temperature. Mater. Today Phys. 2022, 24, 100689. [Google Scholar] [CrossRef]
- Seyf, H.R.; Yates, L.; Bougher, T.L.; Graham, S.; Cola, B.A.; Detchprohm, T.; Ji, M.-H.; Kim, J.; Dupuis, R.; Lv, W.; et al. Rethinking phonons: The issue of disorder. npj Comput. Mater. 2017, 3, 49. [Google Scholar] [CrossRef]
- Jarlöv, A.; Ji, W.; Babicheva, R.; Tian, Y.; Hu, Z.; Seet, H.L.; Tan, L.; Liu, F.; Liu, Y.; Nai, M.L.S.; et al. Tailoring short-range order and dislocation evolution in Cr–Co–Ni medium-entropy alloys: A molecular dynamics study. Mater. Des. 2024, 240, 112840. [Google Scholar] [CrossRef]
- Ye, Y.F.; Wang, Q.; Lu, J.; Liu, C.T.; Yang, Y. High-entropy alloy: Challenges and prospects. Mater. Today 2016, 19, 349–362. [Google Scholar] [CrossRef]
- Hu, Y.; Zeng, L.; Minnich, A.; Dresselhaus, M.S.; Chen, G. Spectral mapping of thermal conductivity through nanoscale ballistic transport. Nat. Nanotechnol. 2015, 10, 701–706. [Google Scholar] [CrossRef]
- Qian, X.; Zhou, J.; Chen, G. Phonon-engineered extreme thermal conductivity materials. Nat. Mater. 2021, 20, 1188–1202. [Google Scholar] [CrossRef]
- Li, Y.; Qiang, W. Defect properties of a body-centered cubic equiatomic TiVZrTa high-entropy alloy from atomistic simulations. J. Phys. Condens. Matter 2023, 35, 345701. [Google Scholar] [CrossRef]
- Jamil, I.R.; Mustaquim, A.M.; Islam, M.; Hasan, M.N. Molecular dynamics perspective of the effects of laser thermal configurations on the dislocation and mechanical characteristics of FeNiCrCoCu HEA through powder bed fusion process. Mater. Today Commun. 2022, 33, 104998. [Google Scholar] [CrossRef]
- Babicheva, R.I.; Evazzade, I.; Korznikova, E.A.; Shepelev, I.A.; Zhou, K.; Dmitriev, S.V. Low-energy channel for mass transfer in Pt crystal initiated by molecule impact. Comput. Mater. Sci. 2019, 163, 248–255. [Google Scholar] [CrossRef]
- Fey, L.T.W.; Beyerlein, I.J. Random Generation of Lattice Structures with Short-Range Order. Integr. Mater. Manuf. Innov. 2022, 11, 382–390. [Google Scholar] [CrossRef]
- Zhang, J.; Zhang, H.; Xiong, J.; Chen, S.; Zhang, G. Tuning lattice thermal conductivity in NbMoTaW refractory high-entropy alloys: Insights from molecular dynamics using machine learning potential. J. Appl. Phys. 2024, 136, 155106. [Google Scholar] [CrossRef]
- Liu, F.; Liu, Y.; Jiang, X.Z.; Xia, J. Exploring thermophysical properties of CoCrFeNiCu high entropy alloy via molecular dynamics simulations. Heliyon 2024, 10, e36064. [Google Scholar] [CrossRef] [PubMed]
- Lu, J.; Huang, X.; Yue, Y. Estimating the lattice thermal conductivity of AlCoCrNiFe high-entropy alloy using machine learning. J. Appl. Phys. 2024, 135, 135104. [Google Scholar] [CrossRef]
- Cheng, C.; Ma, S.; Wang, S. The role of phonon anharmonicity on the structural stability and phonon heat transport of CrFeCoNiCuₓ high-entropy alloys at finite temperatures. J. Alloys Compd. 2023, 935, 168003. [Google Scholar] [CrossRef]
- Babicheva, R.; Jarlöv, A.; Zheng, H.; Dmitriev, S.; Korznikova, E.; Nai, M.L.S.; Ramamurty, U.; Zhou, K. Effect of short-range ordering and grain boundary segregation on shear deformation of CoCrFeNi high-entropy alloys with Al addition. Comput. Mater. Sci. 2022, 215, 111762. [Google Scholar] [CrossRef]
- Chen, S.; Aitken, Z.H.; Pattamatta, S.; Wu, Z.; Yu, Z.G.; Srolovitz, D.J.; Liaw, P.K.; Zhang, Y.-W. Simultaneously enhancing the ultimate strength and ductility of high-entropy alloys via short-range ordering. Nat. Commun. 2021, 12, 4953. [Google Scholar] [CrossRef]
- Li, G.; Yuan, L.; Li, J.; Zhang, M.; Li, D. Effect of Al related chemical short-range order on the irradiation resistance of Al0.5CoCrFeNi multi-principal element alloy: A molecular dynamics simulation. Mater. Today Commun. 2024, 38, 108302. [Google Scholar] [CrossRef]
- Wang, L.; Zhao, Y.; Dou, Y.; He, X.; Zhang, Z.; Chen, M.; Deng, H.; Yang, W. Atomistic Study on Defect—Grain Boundary Interactions in TiVTa Concentrated Solid—Solution Alloys. Crystals 2024, 14, 166. [Google Scholar] [CrossRef]
- Ji, W.; Wu, M.S. Inhibiting the inverse Hall-Petch behavior in CoCuFeNiPd high-entropy alloys with short-range ordering and grain boundary segregation. Scr. Mater. 2022, 221, 114950. [Google Scholar] [CrossRef]
- Zhang, H.; Lee, G.; Gong, C.; Colombo, L.; Cho, K. Grain Boundary Effect on Electrical Transport Properties of Graphene. J. Phys. Chem. C 2014, 118, 2338–2343. [Google Scholar] [CrossRef]
- Hajjiah, A. Modeling the heat conductivity across bulk grain and grain boundaries in perovskite solar cells. Opt. Quantum Electron. 2025, 57, 215. [Google Scholar] [CrossRef]
- Farkas, D. Grain boundary structure in high-entropy alloys. J. Mater. Sci. 2020, 55, 9173–9183. [Google Scholar] [CrossRef]
- Korznikova, E.A.; Shcherbinin, S.A.; Ryabov, D.S.; Chechin, G.M.; Ekomasov, E.G.; Barani, E.; Zhou, K.; Dmitriev, S.V. Delocalized Nonlinear Vibrational Modes in Graphene: Second Harmonic Generation and Negative Pressure. Phys. Status Solidi B 2019, 256, 1800061. [Google Scholar] [CrossRef]
- Giri, A.; Braun, J.L.; Hopkins, P.E. Reduced dependence of thermal conductivity on temperature and pressure of multi-atom component crystalline solid solutions. J. Appl. Phys. 2018, 123, 015106. [Google Scholar] [CrossRef]
- Metropolis, N.; Rosenbluth, A.W.; Rosenbluth, M.N.; Teller, A.H.; Teller, E. Equation of State Calculations by Fast Computing Machines. J. Chem. Phys. 1953, 21, 1087–1092. [Google Scholar] [CrossRef]
- Babicheva, R.I.; Semenov, A.S.; Izosimov, A.A.; Korznikova, E.A. Analysis of Short-Range Ordering Effect on Tensile Deformation Behavior of Equiatomic High-Entropy Alloys TiNbZrV, TiNbZrTa and TiNbZrHf Based on Atomistic Simulations. Modelling 2024, 5, 1853–1864. [Google Scholar] [CrossRef]
- Xu, J.; Jiang, Y.; Yang, L.; Li, J. Assessment of the CSL and SU models for bcc-Fe grain boundaries from first principles. Comput. Mater. Sci. 2016, 122, 22–29. [Google Scholar] [CrossRef]
- National Center for Biotechnology Information. Atomic Radius in the Periodic Table of Elements. Available online: https://pubchem.ncbi.nlm.nih.gov/periodic-table/atomic-radius (accessed on 4 August 2025).
- Hume-Rothery, W. Research on the Nature, Properties and Conditions of Formation of Intermetallic Compounds, with Special Reference to Certain Compounds of Tin. J. Inst. Met. 1926, 35, 295–299. [Google Scholar]
- Mora-Barzaga, G.; Urbassek, H.M.; Deluigi, O.R.; Pasinetti, P.M.; Bringa, E.M. Chemical short-range order increases the phonon heat conductivity in a refractory high-entropy alloy. Sci. Rep. 2024, 14, 20628. [Google Scholar] [CrossRef] [PubMed]
- Lin, C.; Chen, X.; Zou, X. Phonon–Grain-Boundary-Interaction-Mediated Thermal Transport in Two-Dimensional Polycrystalline MoS2. ACS Appl. Mater. Interfaces 2019, 11, 25547–25555. [Google Scholar] [CrossRef]
- Klemens, P.G. Phonon scattering and thermal resistance due to grain boundaries. Int. J. Thermophys. 1994, 15, 1345–1351. [Google Scholar] [CrossRef]
Disclaimer/Publisher’s Note: The statements, opinions and data contained in all publications are solely those of the individual author(s) and contributor(s) and not of MDPI and/or the editor(s). MDPI and/or the editor(s) disclaim responsibility for any injury to people or property resulting from any ideas, methods, instructions or products referred to in the content. |
© 2025 by the authors. Licensee MDPI, Basel, Switzerland. This article is an open access article distributed under the terms and conditions of the Creative Commons Attribution (CC BY) license (https://creativecommons.org/licenses/by/4.0/).