Abstract
In the past decade, two-dimensional (2D) transition metal dichalcogenides (TMDs) have attracted increasing attention because of their striking physical properties and extensive applicability. Meanwhile, Raman spectroscopy has been demonstrated to be a feasible tool and is extensively employed in research on 2D TMDs. In recent years, the deployment of Raman spectroscopy under extreme conditions has elucidated the physical properties of TMDs. In this review, we focus on the extreme-condition Raman spectroscopy of typical group-VI TMDs, which are classified and discussed under the three extreme conditions of low temperature, high pressure and high magnetic field. The conclusion presents the most pressing challenges and attractive future opportunities in this rapidly developing research field.
1. Introduction
Raman spectroscopy, based on Raman scattering, an inelastic light scattering process, has been recognized as a fast, convenient, and non-destructive sample-characterization tool, extensively employed in the material sciences [1,2]. Extreme conditions, such as low temperature, high pressure, and high magnetic field, can force condensed matter into new phases in which novel phenomena may be found, introducing new and exciting physics. Combined with extreme conditions, Raman spectroscopy’s capabilities as a research tool are greatly enhanced, enabling us to trace the evolution of the excitations in condensed matter and their coupling and, hence, uncover the underling physics of condensed matter [3,4].
Two-dimensional (2D) transition metal dichalcogenides (TMDs) mostly exist as MX2 compounds with a trilayer structure, consisting of a central layer of metallic atoms (M = Mo, W, Nb, Ta) sandwiched between two chalcogen atom layers (X = S, Se, Te) [5,6]. In the past decade, 2D TMDs have attracted increasing attention because of their striking physical properties and significant potential for applications in electronics and optoelectronics devices [5,7,8]. With continued research on 2D TMDs, Raman spectroscopy has been demonstrated to be a routine tool to study the doping, layer numbers, defects, disorder, and strain in 2D TMDs [9,10,11]. For example, compared with AFM, Raman spectroscopy is more feasible for determining the number of layers of TMDs [10]. In addition to its use in characterizing the crystalline structure of TMDs, Raman spectroscopy has been employed to investigate the phase transitions in TMDs, such as superconducting, topological, semimetallic, and charge-density-wave (CDW) phases. It is noteworthy that, in most of the reports, extreme conditions are essential for these striking phase transitions to occur [12,13,14,15]. However, to our knowledge, Raman studies on 2D TMDs under extreme conditions have not yet been summarized.
In this review, we aim to provide an overview of the recent progresses in extreme-condition Raman studies of 2D group-VI TMDs, focusing on the Mo- and W-based TMDs (MX2, M = Mo, W; X = S, Se, Te), which are the TMDs that have been most investigated in recent years. These previous extreme-condition Raman results are discussed in terms of three aspects: low temperature, high magnetic field, and high pressure. Finally, we summarize the current challenges and emerging trends with our viewpoint on the near future.
2. Raman Study of 2D Group-VI TMDs under Extreme Conditions
2.1. Low-Temperature Raman Study of 2D TMDs
Although 2D TMDs have been frequently investigated using low-temperature Raman spectroscopy, the lowest temperature used has been that of liquid nitrogen temperature (77 K) [16,17,18]. Raman studies on TMDs using temperatures as low as that of liquid helium temperature (4.2 K), for example, are few. Li et al. measured the Raman spectra of MoS2 in the temperature range of 10–300 K, observing a very small change in the and modes [19]. Using their Raman results, Grüneisen parameters were obtained, which decreased in magnitude from bulk to quadrilayer MoS2.
TMDs have various structural phases, including the 2H (hexagonal, space group P63/mmc), 1T′ (monoclinic, space group P21/m), and Td (orthorhombic, space group Pnm21) crystal phases, exhibiting different electronic properties [6,20,21,22,23]. Intercalation of alkali metal into MoS2 can induce structural phase transitions in MoS2, which has been proved as an effective way to modulate the electrical and catalytic properties of MoS2 [24,25]. In 2018, Tan et al. studied the evolution of the Raman modes in Li-intercalated 1T′-MoS2 (LixMoS2) as a function of 1T′-2H composition [26]. Figure 1a shows that with increasing Li ion concentration, MoS2 transformed from the 2H phase to the pure 1T′ phase in Li1.5MoS2. The first-order temperature coefficients of the 1T′ phonon mode varied linearly with increasing 1T′ composition. As temperature increased, all Raman peaks shifted toward the lower frequencies, and the redshift was more pronounced for the 1T′ Raman modes than for the 2H Raman modes. This is because of the related increase in electron-phonon and strain−phonon coupling.
MoTe2 is a type-II Weyl semimetal [27,28], in which distinct topological phases and possible transitions have been detected [29]. In 2016, the vibration modes for 1T′-MoTe2 and Td-MoTe2 were comprehensively identified. The structural phase of MoTe2 transferred from the 1T′ phase to the Td phase at low temperature down to 10 K [30]. Raman spectra of 1T′- and Td-MoTe2 look slightly different, while some similarity exists because of the structural inheritance between these two phases. The anharmonic contributions to the optical phonon modes in bulk Td-MoTe2 have been examined using temperature-dependent Raman spectroscopy [31]. As illustrated in Figure 1b, different from peaks 1 and 2, the intensity and linewidth of the high-frequency peaks 3 and 4 exhibited large changes in slope and an increase in frequency at T ≈ 250 K, which can be attributed to the structural phase transition from Td to 1T′.
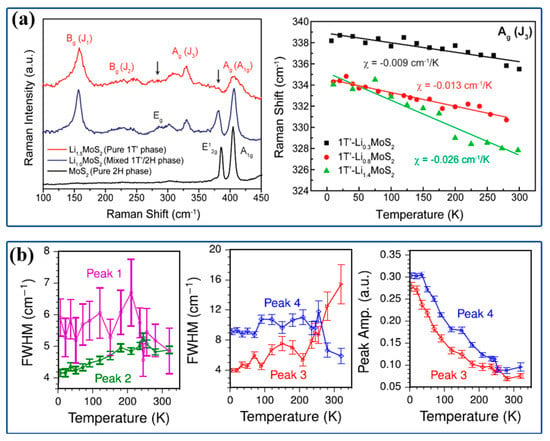
Figure 1.
(a) Background-subtracted Raman spectra of LixMoS2 with increasing lithium content (x). Temperature dependence of the frequencies of Raman active Ag (J3) mode of LixMoS2. Reproduced with permission from [26]. (b) Temperature-dependent Raman spectra for peaks 2, 3, and 4. In both panels, the spectra have been normalized using the intensity of peak 2. FWHM of peaks 1 and 2 extracted from the fits versus temperature. FWHM of peaks 3 and 4 extracted from the fits versus temperature. Amplitudes of peaks 3 and 4 extracted from the fits versus temperature. Reproduced with permission from [31].
In 2019, Zhang et al. studied the phase transition in MoTe2 by comparing the temperature dependences of MoTe2 grown with chemical vapor transport (CVT) and flux methods [32]. As shown in Figure 2, the 2A1 mode exhibited an unusual softening in frequency and broadening in width with decreasing temperature. This was due to the anharmonic phonon coupling and the electron–phonon coupling (EPC). Notably, flux-MoTe2 followed a softening tendency at high temperatures but exhibited a dramatic upturn at low temperature, e.g., at ~70 K; however, CVT-MoTe2 did not exhibit similar behavior. These anomalies in Raman spectra, accompanied by the transport measurements and EPC calculations, demonstrate clear sample-dependent topological characters in electronic structure and an intriguing phase transition in flux-MoTe2 between distinct Weyl semimetal states.
In addition to Mo-based TMDs, W-based TMDs were also investigated using low-temperature Raman spectroscopy. WTe2 has been demonstrated as a candidate for type II Weyl semimetal [33,34]. Oliver et al. used low-temperature Raman measurements to track the alloy-induced transition in WSe2(1−x)Te2x, which transferred from the semiconducting 1H phase of WSe2 to the semimetallic 1Td phase of WTe2 [12]. Polarized Raman scattering measurements were performed on WTe2 at low temperature, in which an decrease with decreasing temperature was observed for one A1 phonon [35]. The symmetric Lorentzian lineshapes of Raman peaks at all temperatures indicated that neither strong electron–phonon nor spin–phonon coupling existed in WTe2.
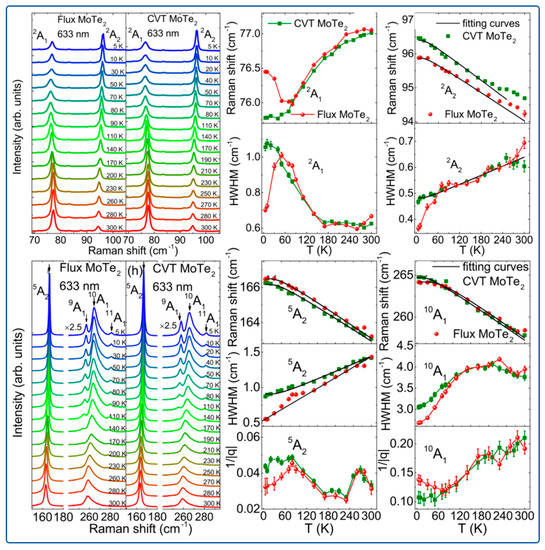
Figure 2.
Temperature evolution of the 2A1, 2A2, 5A2, and 10A1 modes in flux and CVT MoTe2. Temperature dependence of peak positions, linewidths, and asymmetry factor q of these phonon modes. Reproduced with permission from [32].
Due to the semiconducting properties of TMDs, resonant Raman spectroscopy, which uses a laser excitation wavelength close to the bandgap of TMDs, was employed in this study, revealing many interesting phenomena [36,37,38,39,40,41,42]. For example, double resonance Raman modes, second-order Raman peaks, and Davydov-split pairs have been observed using resonant Raman scattering [43,44,45,46,47].
Grzeszczyk et al. studied the bulk-inactive mode at ~291 cm−1 in 2–5 layers MoTe2 using resonant Raman spectroscopy under laser phonon energies of 1.96 and 1.91 eV [48]. As shown in Figure 3a, the peak comprised two components at low temperature, which was more distinguished under the laser phonon energy of 1.91 eV. Moreover, the intensity of the lower-energy component of the doublet significantly increased with decreasing temperature. A resonance of the laser light with a singularity of the electronic density of states at the M point of the MoTe2 Brillouin zone was responsible for the observed effects.
A “b” band that appeared at ~430 cm−1 was observed at the laser phonon energies higher than 1.9592 eV, which was defined as a two phonon peak. rising from combination of the acoustic LA′ and TA′ phonons at the K points of BZ [49,50]. Girzycka et al. studied the resonant Raman responses in monolayer MoS2 as a function of laser energy and temperature [41]. Figure 3b shows that the ‘b’ mode appeared at T~80 K and gradually increased in intensity with further increasing the temperature. The absence of the ‘b’ mode below 80 K was attributed to the energy of the A exciton exceeding the incident photon energy. Under different laser energies, the ‘b’ mode shifted almost linearly to lower frequencies at a rate of −83 and −71 cm−1/eV at T = 7 and 295 K, respectively. This is a rate about two times than those reported in the previous studies of monolayer MoS2, but very close to the rate recorded for bulk MoS2. This phenomenon was associated with the different concentrations of two-dimensional electron gas.
In 2022, temperature-dependent resonant Raman scattering was performed on bilayer 2H-MoS2 at temperatures down to T = 5 K [40]. Employing a 633 nm laser (EL = 1.96 eV) as an excitation source, which is close to the A excitonic resonance of MoS2, the first- and second-order Raman modes can be clearly observed in a broad temperature range, from 5 to 320 K, as shown in Figure 3c. To elucidate the temperature evolution of the observed Raman modes, the specific peaks were fitted with Gaussian functions. Notably, the intensity of the A1g(Γ) mode was about five times that of the B1u(Γ) mode at T = 5 K. However, it shrunk to one third of the B1u(Γ) mode intensity at T = 320 K. This suggested that, at low temperature, the main contribution for the Davydov pair originated from the Raman-active A1g(Γ) peak, while at room temperature the corresponding peak was dominated by the infrared-active B1u(Γ) mode. In addition, two temperature points (150 and 180 K) were observed in the temperature evolution of second-order Raman modes. This suggested that the effect of temperature on resonant Raman scattering is very complex.
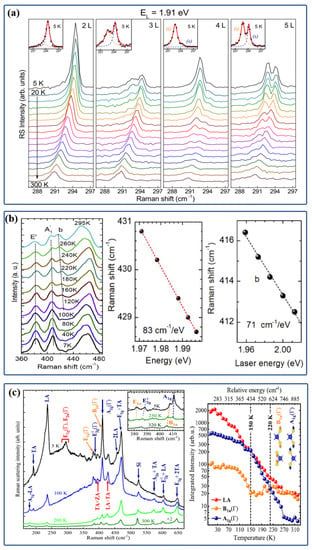
Figure 3.
(a) Temperature evolution of the high-energy part of the Raman scattering spectra for 2–5 L MoTe2 with the out-of-plane A1g/ modes corresponding to the bulk inactive mode, under laser excitation energies of 1.91 eV. Reproduced with permission from [48]. (b) Raman scattering spectra of monolayer MoS2 recorded at T = 7–295 K in vacuum. Temperature dependence of observed Raman peak positions. Examples of the Raman scattering spectra of monolayer MoS2 recorded for various incident photon energies at T = 7 K and 295 K and the corresponding evolution of the ‘b’ mode as a function of incident photon energy. Reproduced with permission from [41]. (c) Temperature evolution of the Raman spectra measured under the resonant condition of excitation (1.96 eV). Raman spectra at T = 5 K, T = 250 K, and T = 320 K revealing Davydov splitting of the in-plane and out-of-plane modes (inset). Integrated intensity profile of lattice vibrations extracted from temperature-dependent resonant Raman scattering. Reproduced with permission from [40].
2.2. High-Pressure Raman Study of 2D TMDs
As previously discussed, many striking physical properties in 2D TMDs can be induced under high pressure. Similarly, many interesting physical properties in group-VI TMDs can be produced under high pressure, which can be probed using Raman spectroscopy.
In addition to low-temperature conditions, resonant Raman scattering has been employed in high-pressure conditions as well. In 2010, the pressure dependence of the resonant Stokes and anti-Stokes Raman spectra of a single crystal of 2H-MoS2 was studied using a 632.8 nm laser [51]. As presented in Figure 4a, a new band, assigned as the “d” band, emerged on the higher-frequency side of the band above ~19 GPa, which was attributed to the presence of the 2Ha phase [52,53]. Moreover, a peak known as the “b” band appeared on the right side of the mode at low pressure associated with a two-phonon Raman process, as shown in Figure 4b. The appearance of new peaks were also observed in monolayer and few-layer MoS2 [54,55]. In addition to the new peaks, the splitting of the and modes in MoS2 were also observed. Although some researchers have claimed that peak splitting takes place in only monolayer MoS2 [54,55], peak splitting of has been detected in bulk MoS2 [56,57,58].
In the above reports, most of the pressure-dependent Raman studies focused on the and modes of MoS2. Because Raman modes in the low-frequency range are directly related to the interlayer interaction, the ultra-low-frequency Raman modes of few-layer and bulk MoS2 have been used to investigate the changes in TMDs layers [54,55,56]. As illustrated in Figure 4c, in contrast to the mode in a trilayer MoS2, the splitting of the mode in a quadlayer MoS2 have signified the change in the stacking configuration under high pressure, demonstrating a 2Hc–2Ha transition via the pressure-induced layer sliding [55]. It is remarkable that the appearance of two new peaks located at 200 and 240 cm−1 was observed in the monolayer MoS2, attributed to the distorted unit cell with slide S atoms [54].
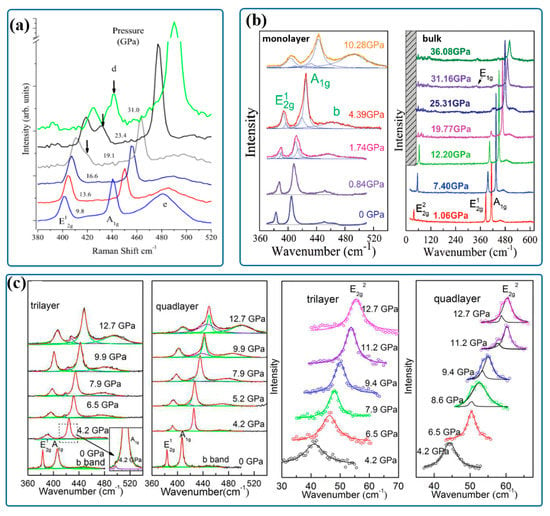
Figure 4.
(a) Stokes Raman spectra of bulk 2H-MoS2 for pressures up to 31 GPa and ambient temperatures. Reproduced with permission from [51]. (b) Raman spectra of CVD-grown monolayer MoS2 and a bulk MoS2 at different pressures. Reproduced with permission from [54]. (c) Raman spectra of trilayer and quadlayer MoS2 under high pressure. Reproduced with permission from [55].
Although the pressure-induced appearance of additional peaks has been reported in some works, it is not always observed [13,59]. The Raman frequency shift and full-width at half-maximum (FWHM) can also be employed in studying pressure-induced phase transitions of MoS2. Zhuang et al. investigated the effect of pressure media (PM) on the critical pressure of MoS2. Metallization occurred at 17 GPa and 20 GPa under non-hydrostatic and hydrostatic conditions, respectively [59]. Using Ar as the PM, the metallization pressure was ~35 GPa, lower than the ~41 GPa observed under non-hydrostatic pressure conditions [57]. In addition to the peak position and bandwidth, the spacing between the A1g and E2g modes is another index that can be used to investigate the structural changes in TMDs [13]. As presented in Figure 5a, the frequency spacing evolution flattened out in the intermediate state (IS) state and increased with a smaller slope in the metallic region. Abrupt changes in the peak spacing demonstrated a transition from semiconducting (SC) to IS and metallic states, suggesting that the lattice structure was distorted. While the most research has been carried out on 2H-MoS2, the pressure effects on 1T′-MoS2 have also been investigated using Raman spectroscopy [60]. As presented in Figure 5b, the J3 mode becomes indistinguishable from the E2g mode at ~10 GPa, whereas the J1 and J2 modes are still clearly distinguishable at higher pressures. In contrast with 2H-MoS2, 1T′-MoS2 remains in its metallic state under high pressure.
Pressure-dependent Raman spectroscopy has also been performed on WS2, but no clear changes in its spectral parameters would indicate a pressure-induced phase transition [61,62,63]. In 2021, Thomas et al. observed a phase transition from 1H to 1T′ at low pressure in the supported monolayer WS2 [14]. The polymethyl methacrylate (PMMA)-supported monolayer WS2 was used for high-pressure Raman measurements. Four new modes at 187, 248, 282, and 317 cm−1 appeared above 8 GPa, indicating a mixed phase of 1T′ and 1H. Kim et al. investigated the behaviors of M0.5W0.5S2 under pressures up to 40 GPa [64]. Figure 5c shows that a Raman peak at 470 cm−1 emerged at ~8 GPa, originated from the disorder-activated pressure-induced out-of-plane Raman mode, which only observed in the ternary compound under high pressure. In addition, a Raman peak at approximately 340 cm−1 was observed at pressures above ~30 GPa, signifying additional disorder-activated vibration mode. This demonstrated that the enhanced interactions in the structural and vibrational behavior of the MoS2 and WS2 domains in the M0.5W0.5S2 compound under hydrostatic pressure. Raman spectra of WS2/MoS2 heterobilayers were collected under high pressures [65]. Using a weakly coupled harmonic oscillator model to interpret the physical mechanism behind the experimental data, it was demonstrated that the vibrational spectra of a MoS2 monolayer and a WS2 monolayer could be renormalized when the interaction between them was artificially modulated.
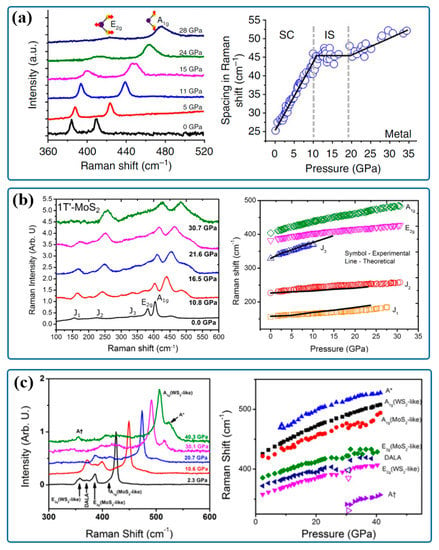
Figure 5.
(a) Raman spectra at representative pressure points. The difference in Raman frequencies between the A1g and E2g modes as a function of pressure. The solid black line is a visual guide. Reproduced with permission from [13]. (b) Raman active modes for the restacked monolayer 1T′-MoS2 and monolayer and bulk 2H-MoS2. Pressure-dependent Raman frequencies for five Raman active modes. Reproduced with permission from [60]. (c) Representative Raman spectra with increasing pressure. The evolution of the Raman frequency shifts reveals the comprehensive pressure-effect on Mo0.5W0.5S2. Reproduced with permission from [64].
Except for the high-pressure studies carried out at room temperature, much work has been conducted under the simultaneous conditions of both high pressure and temperature. A Raman spectroscopic study of natural MoS2 powder was performed under high pressures, up to 18.5 GPa, and high temperatures, up to 600 K [53]. The coupling coefficients of temperature and pressure to the Raman shift were obtained, indicating that the effect of temperature on Raman shift weakened with increasing pressure.
Employing resonant Raman scattering, Livneh et al. studied the effect of low temperature (6–300 K) and high pressure (up to 6 GPa) on MoS2 [66]. Figure 6a showed the I/I intensity ratios for the complete set of measured spectra, in which the observed maximum in the PA1g peak took place between 1 and 2 GPa at 55 K. The contribution of the pressure-tuned outgoing resonance relative to that of the incoming channel changed with temperature.
Low-temperature and high-pressure Raman spectroscopy was performed on MoS2, and a nontrivial metallic state was detected [67]. Temperature-dependent Raman spectra were recorded at 20.9, 34.8, and 47.6 GPa, referred to as semiconducting 2Hc and mixed 2Hc and 2Ha phases, respectively. A E′ mode at 174 cm−1 appeared in the 2Hc + 2Ha mixed phase at 34.8 GPa at low temperature, becoming prominent at 47.6 GPa, as shown in Figure 6b. This E′ mode remained almost constant below approximately 60 K, and then dropped down. The mode nearly vanished above 140–170 K. The presence of the E′ mode indicated the presence of the 2Ha phase. These behaviors suggested that an additional order took place at low temperature, which induced a modification of the electronic structure (gapping of the Fermi surface) and structural instabilities.
Besides the blue shift and broadening of Raman peaks, no anomaly was observed in the Raman spectra of MoSe2 under pressures [68,69]. As illustrated in Figure 7a, abrupt changes in the pressure behavior of the linewidth of the Raman modes were observed, indicating the metallization transition in MoSe2 [68]. Similarly, there is no obvious pressure-induced change in the Raman spectra of WSe2 for both ultra-low-frequency and regular-frequency ranges [15]. In this case, the phase transition can just be revealed from the changes in the linewidth of Raman peaks.
Bhatt et al. used a 632.8 nm laser to study the effects of pressure on the lattice dynamics of MX2 (M = Mo, W; X = S, Se) under resonance conditions [70]. With the help of temperature-dependent Raman spectroscopy, the isobaric and isothermal mode Grüneisen parameters were determined. Using resonance Raman spectroscopy with a 488 nm laser as the excitation source, the exfoliated few-layered MoSe2 was investigated under high pressure [71]. As presented in Figure 7b, the modes M1 and M2 at 103 and 190 cm−1 emerged at around 13 GPa, while another mode M3 at 317 cm−1 appeared at around 33 GPa. The integrated intensity of the A1g mode was found to show a maximum at about 13 GPa. The FWHM of the A1g mode had a sudden drop at about 34 GPa for silicone oil PTM and 39 GPa for methanol–ethanol mixture PTM. The FWHM of the mode had a minimum in the range of 10–12 GPa, followed by a sudden jump at ~33 GPa. Bera et al. demonstrated a layer-sliding isostructural transition from the 2Hc structure to a mixed-phase structure of 2Ha + 2Hc in MoSSe at around 10.8 GPa, as shown in Figure 7c [72]. Compared with MoS2, the transition pressure of MoSSe is low. This is because of the chemical ordering of S and Se atoms on the anionic sublattice. Moreover, differing from MoS2, a lower-pressure transition at ~3 GPa was observed, which was attributed to the changes in the c/a ratio.
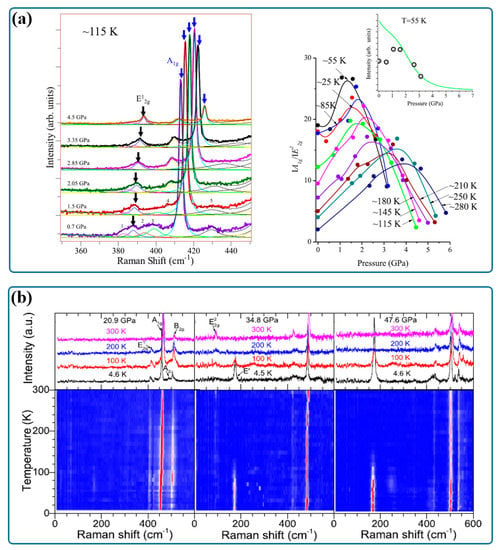
Figure 6.
(a) Lorentzian lineshape analysis of spectra taken at ~115 K at different pressures. Summary of the I/I intensity ratios for the complete set of measured spectra at the indicated temperatures. Reproduced with permission from [66]. (b) Raman data of MoS2 at various temperatures and at 20.9 GPa, 34.8 GPa, and 47.6 GPa. The upper panels are the spectra at various temperatures and the bottom panel is the 2D presentation in Raman frequency–temperature coordinates. The color in the bottom panels represents the intensity of Raman modes. Reproduced with permission from [67].
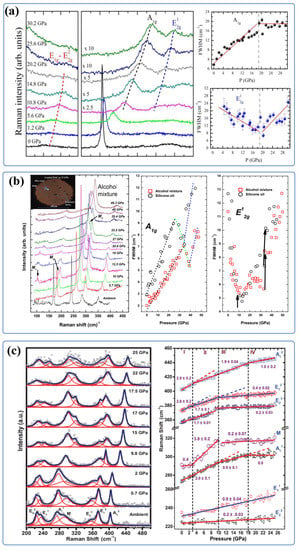
Figure 7.
(a) Raman spectra of MoSe2 crystal powder at selected pressures. Pressure dependence of the FWHM of the A1g and phonons. Reproduced with permission from [68]. (b) Raman spectra of few-layer MoSe2 at selected pressures. Ratio of normalized intensity of the A1g mode with respect to that of the -mode with pressure. Pressure evolution of FWHM of the A1g and modes. Reproduced with permission from [71]. (c) Frequency of the Raman mode as a function of pressure. Solid lines are linear fits [ωp = ω0 + (dω/dP)P] to the observed frequencies, and the values of the slopes are given. Vertical dashed lines mark the transitions. Reproduced with permission from [72].
MoTe2 has a smaller direct energy band gap (∼1.1 eV) at the K point than MoS2 [73]. MoTe2 is a suitable candidate for nanoelectronics devices because its band gap is similar to the indirect bandgap (~1.1 eV) of silicon [74]. Bera et al. carried out Raman spectroscopy on 2H-MoTe2 under high pressures of up to ∼29 GPa [75]. As shown in Figure 8a, a new mode (N1) at ~175 cm−1 appeared at around ∼6.5 GPa. For the integrated area ratio of the A1g mode to the mode, two abrupt changes were observed around 6 GPa and 16.5 GPa, attributed to the semiconductor–semimetal transition and Lifshitz transition, respectively. Zhao et al. detected no new peaks in the pressure-induced Raman evolution of 2H-MoTe2 [76]. A combination of synchrotron X-ray diffraction, electrical conductivity, and the Hall coefficient and density functional theory calculations demonstrated that the semiconductor–semimetal transition occurred at around 10 GPa, attributed to the gradual tunability of the electric structure and band gap rather than the structural transition.
Lu et al. observed the disappearance of the P3 band and the appearance of the P4 band with a higher frequency at around 11 GPa, suggesting the occurrence of a Td-1T′ phase transition in WTe2 [77]. Additionally, as presented in Figure 8b, abrupt changes in the pressure dependence of the FWHM of the Raman bands P6 and P7 were attributed to the appearance of the 1T′ phase. In Zhou et al.’s work, only two strong peaks were observed, and the mode exhibited a splitting above ~7.1 GPa, indicating a structural transition [78]. In 2017, the plane-parallel and plane-vertical anisotropies of WTe2 were studied using Raman spectroscopy under high pressure. The ab-plane of bulk Td-WTe2 was parallel (P-type) or vertical (V-type) to the diamond anvil surface [79]. As shown in Figure 8c, all the Raman peaks blue-shifted gradually with no discontinuities for the P-type, whereas red-shifting of Raman peaks was observed with increasing pressure for the V-type. A new peak appeared at around 120 cm−1 for the V-type and almost disappeared above 10.9 GPa, indicating the structural instability of the orthorhombic Td phase. Moreover, the vanishing of Raman peaks for V-type at ~8 GPa suggested that WTe2 underwent a phase transition to a monoclinic T′ phase, where the Weyl states vanish in the new T′ phase due to the presence of inversion symmetry.
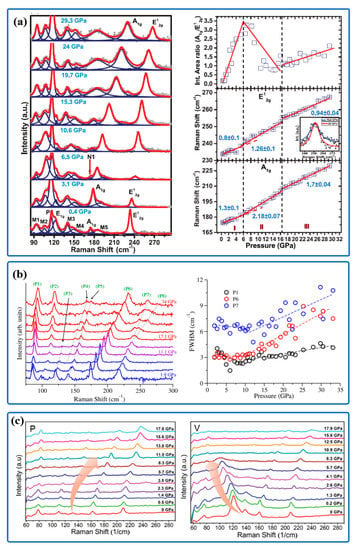
Figure 8.
(a) Raman spectra under selected pressures. Evolution of the frequencies of A1g and modes and the integrated area ratio of A1g to . Reproduced with permission from [75]. (b) Raman spectra of WTe2 under different pressures. The FWHM of P1, P6, and P7, indicating dramatic broadening of P6 and P7 at pressures > 11 GPa. Reproduced with permission from [77]. (c) The evolution of Raman spectra with pressure for different sample orientations. Reproduced with permission from [79].
2.3. High-Magnetic-Field Raman Study of 2D TMDs
The Raman-spectroscopic behavior of 2D TMDs under high magnetic fields has become a popular topic in recent years, although group-VI TMDs do not exhibit magnetism. In 2016, Ji et al. demonstrated a very large magneto-optical Raman effect in MoS2, which was attributed to the broken symmetry induced by a magnetic field [80]. Figure 9a presents the magnetic-field-dependent Raman spectra of three different MoS2 samples measured under parallel (ei‖es, left) and perpendicular (ei⊥es, right) polarization configurations. The frequencies of both E- and A-modes remained unchanged when increasing the magnetic field. The intensity of the E-mode remained almost constant with increasing fields for both polarization configurations, whereas the intensity of the A-mode variation with the field exhibited complementary behavior between the ei‖es and ei⊥es polarization configurations. For monolayer MoS2, the -mode intensity in the ei⊥es polarization configuration reached its maximum at ~6 T and then decreased slightly with increasing field. This was attributed to the magnetic-field-induced symmetry breaking for the electron motion in the inelastic Raman scattering process, and a semi-classic scenario was provided to explain the magnetic-field evolution of the Raman intensities.
The magneto-optical Raman effect in monolayer, bilayer, and trilayer WS2 has also been investigated using magnetic-field-dependent Raman spectroscopy [81]. The magneto–Raman intensity of (Γ), A1g(Γ), and 2LA(M) modes were analyzed as a function of magnetic field for monolayer, bilayer, and trilayer WS2 under two polarization configurations. The magneto-Raman intensity parameter was defined as magneto-Raman intensity = . The A1g(Γ) mode exhibited the largest magneto-Raman intensity under the crossed polarization configuration and was boosted up to 5000% for monolayer and 10,000% for bilayer and trilayer, respectively. The resonant magnetic field for WS2 was ~4 T, which was lower than that of MoS2 (6 T).
It has been demonstrated that noble metal nanostructures can produce localized surface plasmonic resonance (LSPR), which can induce charge transfer from nanostructures to TMDs, leading to the prominent promotion of the optoelectronic properties of TMDs [82]. Recently, the plasmonic effect on the magneto-optical properties of WS2 was investigated by comparing WS2 on SiO2/Si substrate and Au film under different polarization configurations [83]. The magnetic-field-induced variations in the Raman intensities in two WS2 samples were studied in the details. The Raman spectra of WS2/Au were markedly different in terms of polarization dependent behavior from those of WS2/SiO2, which suggested that the plasmonic-effect-induced charge transfer plays an important role in the magneto-optical Raman effect of WS2.
Although the Raman mapping technique has been widely employed in the study of 2D TMDs, it has rarely been used under low-temperature- and high-magnetic-field conditions. In 2020, the polarized Raman mapping of MoS2 under low temperature and magnetic field was reported [84]. As presented in Figure 9b, the structural micro-inhomogeneity in MoS2 was observed in the mapping images for 0 T, 5 T, and 9 T under perpendicular polarization geometry, suggesting the existence of lattice defects in this MoS2 sample. Notably, the magneto-optical Raman intensity for the defect zone dropped to just 26% of that for the regular zone, due to the scattered electron motion by lattice defects. This demonstrated that magneto-optical Raman mapping technique is a feasible tool for directly surveying the micro-inhomogeneity in 2D TMDs.
Wan et al. demonstrated that applying a perpendicular magnetic field can produce a colossal Raman scattering rotation in non-magnetic MoS2 [85]. As shown in Figure 9c, linearly polarized scattered light was rotated by ±125°. The relationship between the intensity of the A-mode and the polarization angle could be easily modulated by varying the magnetic field. The experimental results and analysis revealed the mechanism underlying the magneto-Raman effect in MoS2, which can be attributed to the electron motion in the presence of a perpendicular magnetic field. The external magnetic field induced the symmetry breaking in MoS2, dominating the electron motion during the scattering process.
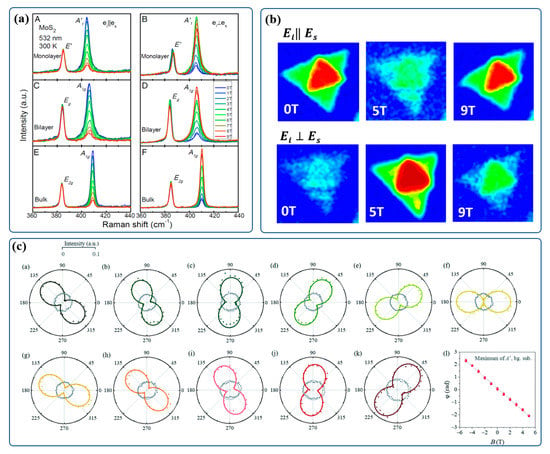
Figure 9.
(a) Room-temperature Raman spectra of monolayer, bilayer, and bulk MoS2 in the presence of magnetic fields in parallel (ei‖es) and perpendicular (ei⊥es) polarization configurations. Reproduced with permission from [80]. (b) Polarized Raman mapping images created using the intensity of the mode under different magnetic fields. Reproduced with permission from [84]. (c) Polar plots of the integrated intensities of the E′ and A′ modes as a function of polarization angle between the incident and scattered lights under different magnetic fields. Reproduced with permission from [85].
3. Conclusions
In the past decade, TMDs have attracted enormous attention because of their striking physical properties and broad potential applications. Raman spectroscopy has been demonstrated to be a feasible tool and extensively employed in the research of TMDs. In this review, Raman studies of TMDs under different extreme conditions, including low temperature, high pressure and high magnetic field, were discussed in detail. As is known, the MX2 format TMDs constitute a large group, of which the atoms on M sites range between group IV–VI transition metals [86]. Due to the limitation in space, it is impossible in this review to cover all important aspects within this review. We have focused, therefore, on Mo- and W-based TMDs, (MX2, M = Mo, W; X = S, Se, Te), which have been the most frequently investigated TMDs in the past decade.
As presented in Table 1, MoS2 and MoTe2 are the most frequently studied TMDs using extreme-condition Raman spectroscopy. Regarding the extreme conditions coupled with Raman spectroscopy, low temperature is the most frequently employed, because low temperature is an essential condition for generating phase transitions in 2D TMDs. Additionally, low temperature can induce structural phase transition. High pressure and high magnetic field serve as additional stimuli that can activate the striking physical properties of TMDs, such as electronic phase transitions or magneto-optical effects. In high-pressure Raman measurement, most TMDs samples are in the bulk format rather than in the mono- or few-layer format. This may be due to the complexity of transferring thin-layer TMDs on diamond. Magnetic-field Raman studies of nonmagnetic TMDs, so far, are scarce, although magnetic 2D materials have attracted increased attention in recent years. We believe that with progress in the superconductivity and topology of 2D TMDs, magnetic field, as a significant stimulus, will be used frequently in Raman studies of TMDs. Although extreme-condition Raman studies on 2D TMDs have been conducted in the past decade, most of them have used only one extreme condition, and those using two or three extreme conditions are still scarce [66,67,84,85].

Table 1.
Summary of extreme-condition Raman spectroscopic studies of group IV–VI TMDs.
Table 1.
Summary of extreme-condition Raman spectroscopic studies of group IV–VI TMDs.
| Extreme Condition 1 | Physical Effect 2 | TMDs | Refs. |
|---|---|---|---|
| LT | structural phase transition | ||
| Td→1T′ | MoTe2 | [30,31] | |
| HM + LT | magneto-optical Raman effect | ||
| MoS2 | [84,85] | ||
| WS2 | [81,83] | ||
| HP | structural phase transition | ||
| 1H→1T′ | MoS2 | [54] | |
| Td→1T′ | WTe2 | [77] | |
| electronic state phase transition | |||
| SC → M | MoS2 | [13] | |
| SC → SM | MoTe2 | [75,76] | |
| SC → M | MoSe2 | [68] | |
| HP + LT | structural phase transition | ||
| 2Hc + 2Ha → 2Ha | MoS2 | [67] |
1 LT = low temperature, HM = high magnetic field, HP = high pressure. 2 Semiconductor = SC, semimetal = SM, metal = M.
Practically, it is difficult to load two or more extreme conditions at the same time in an extreme-condition Raman setup. In most traditional extreme-condition Raman setups, the cryostat, superconducting magnet, or diamond routine anvil cell (DAC) are normally placed under the microscope of a commercial micro-Raman spectrometer, as illustrated in Figure 10a–c. Due to the specific geometries of these instruments providing extreme conditions, it is difficult to combine all of them together under a regular microscope. Moreover, since Raman spectra have to be collected outside the sample chamber, the numerical aperture (NA) of the microscope lens is low, resulting in low spatial resolution and a low signal-to-noise ratio in the Raman spectra.
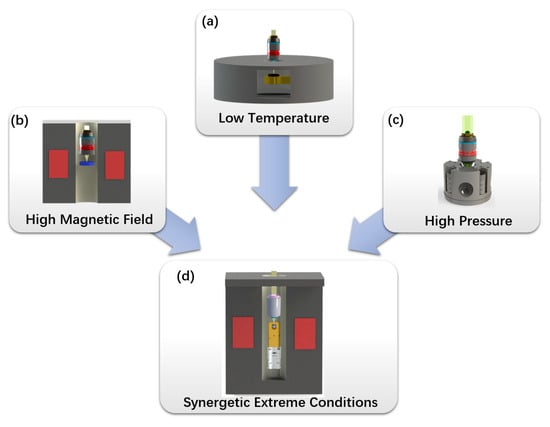
Figure 10.
Schematic setup of routine Raman measurement under (a) low temperature, (b) high magnetic field, and (c) high pressure. (d) Schematic setup of Raman measurement under synergetic extreme conditions.
Thanks to the development of microscopic optics in recent years, such as microscope lens with high NA and piezoelectric positioners working at low temperature and high magnetic field, these challenges are being surmounted. In contrast to traditional extreme-condition Raman setups, microscope lens and piezoelectric positioners are assembled together and inserted in the cryostat chamber of a superconducting magnet, as shown in Figure 10d. This allows Raman measurement at low temperature and magnetic field simultaneously. Coupled with specially designed DACs that can be installed on piezoelectric positioners, Raman measurement can be carried out under high pressure together with the other two extreme conditions [87]. Moreover, along with low-temperature nanopositioners, Raman mapping has been employed to monitor the structural defects in 2D TMDs under low temperature and magnetic fields [84]. Raman mapping will be utilized more frequently owing to its advantages in acquiring spatial distribution and inhomogeneity. In the near future, circular polarization geometries, owing to their sensitivity to the valley properties of 2D TMDs [88,89], will also be adopted in extreme-condition Raman spectroscopy, and will help researchers elucidate the phase transitions in 2D TMDs.
PL emission is a prominent feature of TMDs, which has been extensively investigated under extreme conditions [90,91,92,93]. As PL function is normally accompanied within most commercial Raman spectrometers, extreme-condition PL and Raman measurements can be performed in the same instrumental system. This will be helpful for obtaining a deeper insight into the valley properties of 2D TMDs. In addition, combining ultrafast laser technique, time-resolved Raman spectroscopy will capture the ultrafast dynamical process of the phase transitions of TMDs, providing a deeper understanding of the physical mechanism of phase transitions. Ultrafast laser techniques, serving as additional stimuli, will induce new phenomena to TMDs, such as Bloch–Floquet states and phase transitions [94]. Moreover, performing in situ Raman measurements while imposing an external electric field will help uncover the physical properties of 2D TMDs.
With emerging new types of TMDs and observation of new phenomena, we believe that extreme-condition Raman spectroscopy will play an increasing important role in the research on 2D TMDs.
Author Contributions
Writing—draft preparation and editing, funding acquisition, Y.Y.; resources, Y.H.; visualization, R.L. All authors have read and agreed to the published version of the manuscript.
Funding
This work was supported by the National Natural Science Foundation of China (grant Nos 62175253, 12074420), CAS Project for Young Scientists in Basic Research (grant No YSBR-056).
Data Availability Statement
No new data were created or analyzed in this study. Data sharing is not applicable to this article.
Conflicts of Interest
The authors declare no conflict of interest.
References
- Jones, R.R.; Hooper, D.C.; Zhang, L.W.; Wolverson, D.; Valev, V.K. Raman Techniques: Fundamentals and Frontiers. Nanoscale Res. Lett. 2019, 14, 231. [Google Scholar] [CrossRef] [PubMed]
- Devereaux, T.P.; Hackl, R. Inelastic light scattering from correlated electrons. Rev. Mod. Phys. 2007, 79, 175–233. [Google Scholar] [CrossRef]
- Jin, F.; Yang, Y.; Zhang, A.-M.; Ji, J.-T.; Zhang, Q.-M. Raman scattering under extreme conditions. Chin. Phys. B 2018, 27, 077801. [Google Scholar] [CrossRef]
- Goncharov, A.F.; Struzhkin, V.V. Raman spectroscopy of metals, high-temperature superconductors and related materials under high pressure. J. Raman Spectrosc. 2003, 34, 532–548. [Google Scholar] [CrossRef]
- Chhowalla, M.; Liu, Z.F.; Zhang, H. Two-dimensional transition metal dichalcogenide (TMD) nanosheets. Chem. Soc. Rev. 2015, 44, 2584–2586. [Google Scholar] [CrossRef]
- Dawson, W.G.; Bullett, D.W. Electronic-Structure and Crystallography of MoTe2 and WTe2. J. Phys. C Solid State 1987, 20, 6159–6174. [Google Scholar] [CrossRef]
- Lv, R.; Robinson, J.A.; Schaak, R.E.; Sun, D.; Sun, Y.F.; Mallouk, T.E.; Terrones, M. Transition Metal Dichalcogenides and Beyond: Synthesis, Properties, and Applications of Single- and Few-Layer Nanosheets. Acc. Chem. Res. 2015, 48, 56–64. [Google Scholar] [CrossRef]
- Wang, X.T.; Cui, Y.; Li, T.; Lei, M.; Li, J.B.; Wei, Z.M. Recent Advances in the Functional 2D Photonic and Optoelectronic Devices. Adv. Opt. Mater. 2019, 7, 1801274. [Google Scholar] [CrossRef]
- Zhang, S.S.; Zhang, N.; Zhao, Y.; Cheng, T.; Li, X.B.; Feng, R.; Xu, H.; Liu, Z.R.; Zhang, J.; Tong, L.M. Spotting the differences in two-dimensional materials—The Raman scattering perspective. Chem. Soc. Rev. 2018, 47, 3380. [Google Scholar] [CrossRef]
- Liang, L.B.; Zhang, J.; Sumpter, B.G.; Tan, Q.-H.; Tan, P.-H.; Meunier, V. Low-Frequency Shear and Layer-Breathing Modes in Raman Scattering of Two-Dimensional Materials. ACS Nano 2017, 11, 11777–11802. [Google Scholar] [CrossRef]
- Wang, Y.L.; Cong, C.X.; Qiu, C.Y.; Yu, T. Raman Spectroscopy Study of Lattice Vibration and Crystallographic Orientation of Monolayer MoS2under Uniaxial Strain. Small 2013, 9, 2857–2861. [Google Scholar] [CrossRef] [PubMed]
- Oliver, S.M.; Young, J.; Krylyuk, S.; Reinecke, T.L.; Davydov, A.V.; Vora, P.M. Valley phenomena in the candidate phase change material WSe2(1-x)Te2x. Commun. Phys. 2020, 3, 10. [Google Scholar] [CrossRef]
- Nayak, A.P.; Bhattacharyya, S.; Zhu, J.; Liu, J.; Wu, X.; Pandey, T.; Jin, C.Q.; Singh, A.K.; Akinwande, D.; Lin, J.-F. Pressure-induced semiconducting to metallic transition in multilayered molybdenum disulphide. Nat. Commun. 2014, 5, 3731. [Google Scholar] [CrossRef]
- Thomas, A.; Vikram, K.; Muthu, D.V.S.; Sood, A.K. Structural phase transition from 1H to 1T′ at low pressure in supported monolayer WS2: Raman study. Solid State Commun. 2021, 336, 114412. [Google Scholar] [CrossRef]
- Shen, P.F.; Ma, X.; Guan, Z.; Li, Q.J.; Zhang, H.F.; Liu, R.; Liu, B.; Yang, X.; Dong, Q.; Cui, T.; et al. Linear Tunability of the Band Gap and Two-Dimensional (2D) to Three-Dimensional (3D) Isostructural Transition in WSe2 under High Pressure. J. Phys. Chem. C 2017, 121, 26019–26026. [Google Scholar] [CrossRef]
- Zhang, X.; Sun, D.Z.; Li, Y.L.; Lee, G.-H.; Cui, X.; Chenet, D.; You, Y.M.; Heinz, T.F.; Hone, J.C. Measurement of Lateral and Interfacial Thermal Conductivity of Single- and Bilayer MoS2 and MoSe2 Using Refined Optothermal Raman Technique. ACS Appl. Mater. Interfaces 2015, 7, 25923–25929. [Google Scholar] [CrossRef] [PubMed]
- Su, B.; Huang, Y.; Hou, Y.H.; Li, J.W.; Yang, R.; Ma, Y.C.; Yang, Y.; Zhang, G.Y.; Zhou, X.J.; Luo, J.N.; et al. Persistence of Monoclinic Crystal Structure in 3D Second-Order Topological Insulator Candidate 1 T ′-MoTe2 Thin Flake Without Structural Phase Transition. Adv. Sci. 2022, 9, 21001532. [Google Scholar] [CrossRef]
- Lin, Z.; Liu, W.; Tian, S.; Zhu, K.; Huang, Y.; Yang, Y. Thermal expansion coefficient of few-layer MoS2 studied by temperature-dependent Raman spectroscopy. Sci. Rep. 2021, 11, 7037. [Google Scholar] [CrossRef]
- Li, X.; Li, J.H.; Wang, K.; Wang, X.H.; Wang, S.-P.; Chu, X.Y.; Xu, M.Z.; Fang, X.; Wei, Z.P.; Zhai, Y.J.; et al. Pressure and temperature-dependent Raman spectra of MoS2 film. Appl. Phys. Lett. 2016, 109, 242101. [Google Scholar] [CrossRef]
- Wilson, J.A.; Yoffe, A. The transition metal dichalcogenides discussion and interpretation of the observed optical, electrical and structural properties. Adv. Phys. 1969, 18, 193–335. [Google Scholar] [CrossRef]
- Choi, W.; Choudhary, N.; Han, G.H.; Park, J.; Akinwande, D.; Lee, Y.H. Recent development of two-dimensional transition metal dichalcogenides and their applications. Mater. Today 2017, 20, 116–130. [Google Scholar] [CrossRef]
- Santosh, K.; Zhang, C.; Hong, S.; Wallace, R.; Cho, K. Phase stability of transition metal dichalcogenide by competing ligand field stabilization and charge density wave. 2D Mater. 2015, 2, 035019. [Google Scholar]
- Clarke, R.; Marseglia, E.; Hughes, H. A low-temperature structural phase transition in β-MoTe2. Philos. Mag. B 1978, 38, 121–126. [Google Scholar] [CrossRef]
- Sun, X.L.; Wang, Z.G. Adsorption and diffusion of lithium on heteroatom-doped monolayer molybdenum disulfide. Appl. Surf. Sci. 2018, 455, 911–918. [Google Scholar] [CrossRef]
- Cui, Z.; Wang, X.; Ding, Y.C.; Zhang, C.; Li, M.Q. Alkali-metal-embedded in monolayer MoS2: Optical properties and work functions. Opt. Quantum Electron. 2018, 50, 348. [Google Scholar] [CrossRef]
- Tan, S.J.R.; Sarkar, S.; Zhao, X.X.; Luo, X.; Luo, Y.Z.; Poh, S.M.; Abdelwahab, I.; Zhou, W.; Venkatesan, T.; Chen, W.; et al. Temperature- and Phase-Dependent Phonon Renormalization in 1T′-MoS2. Acs Nano 2018, 12, 5051–5058. [Google Scholar] [CrossRef]
- Sun, Y.; Wu, S.C.; Ali, M.N.; Felser, C.; Yan, B.H. Prediction of Weyl semimetal in orthorhombic MoTe2. Phys. Rev. B 2015, 92, 161107. [Google Scholar] [CrossRef]
- Wang, Z.J.; Gresch, D.; Soluyanov, A.A.; Xie, W.W.; Kushwaha, S.; Dai, X.; Troyer, M.; Cava, R.J.; Bernevig, B.A. MoTe2: A Type-II Weyl Topological Metal. Phys. Rev. Lett. 2016, 117, 056805. [Google Scholar] [CrossRef]
- Deng, K.; Wan, G.L.; Deng, P.; Zhang, K.N.; Ding, S.J.; Wang, E.Y.; Yan, M.Z.; Huang, H.Q.; Zhang, H.Y.; Xu, Z.L.; et al. Experimental observation of topological Fermi arcs in type-II Weyl semimetal MoTe2. Nat. Phys. 2016, 12, 1105–1110. [Google Scholar] [CrossRef]
- Ma, X.L.; Guo, P.J.; Yi, C.J.; Yu, Q.H.; Zhang, A.M.; Ji, J.T.; Tian, Y.; Jin, F.; Wang, Y.Y.; Liu, K.; et al. Raman scattering in the transition-metal dichalcogenides of 1T’-MoTe2, T-d-MoTe2, and T-d-WTe2. Phys. Rev. B 2016, 94, 214105. [Google Scholar] [CrossRef]
- Joshi, J.; Stone, I.R.; Beams, R.; Krylyuk, S.; Kalish, I.; Davydov, A.V.; Vora, P.M. Phonon Anharmonicity in Bulk T d -MoTe2. Appl. Phys. Lett. 2016, 109, 031903. [Google Scholar] [CrossRef]
- Zhang, A.M.; Ma, X.L.; Liu, C.L.; Lou, R.; Wang, Y.M.; Yu, Q.H.; Wang, Y.Y.; Xia, T.L.; Wang, S.C.; Zhang, L.; et al. Topological phase transition between distinct Weyl semimetal states in MoTe2. Phys. Rev. B 2019, 100, 201107. [Google Scholar] [CrossRef]
- Soluyanov, A.A.; Gresch, D.; Wang, Z.J.; Wu, Q.S.; Troyer, M.; Dai, X.; Bernevig, B.A. Type-II Weyl semimetals. Nature 2015, 527, 495–498. [Google Scholar] [CrossRef]
- Bruno, F.Y.; Tamai, A.; Wu, Q.S.; Cucchi, I.; Barreteau, C.; de la Torre, A.; Walker, S.M.; Ricco, S.; Wang, Z.; Kim, T.K.; et al. Observation of large topologically trivial Fermi arcs in the candidate type-II Weyl semimetal WTe2. Phys. Rev. B 2016, 94, 121112. [Google Scholar] [CrossRef]
- Kong, W.-D.; Wu, S.-F.; Richard, P.; Lian, C.-S.; Wang, J.-T.; Yang, C.-L.; Shi, Y.-G.; Ding, H. Raman scattering investigation of large positive magnetoresistance material WTe2. Appl. Phys. Lett. 2015, 106, 081906. [Google Scholar] [CrossRef]
- Chow, C.M.; Yu, H.T.; Jones, A.M.; Schaibley, J.R.; Koehler, M.; Mandrus, D.G.; Merlin, R.; Yao, W.; Xu, X.D. Phonon-assisted oscillatory exciton dynamics in monolayer MoSe2. Npj 2D Mater. Appl. 2017, 1, 33. [Google Scholar] [CrossRef]
- Chakraborty, B.; Matte, H.S.S.R.; Sood, A.K.; Rao, C.N.R. Layer-dependent resonant Raman scattering of a few layer MoS2. J. Raman Spectrosc. 2012, 44, 92–96. [Google Scholar] [CrossRef]
- Soubelet, P.; Bruchhausen, A.E.; Fainstein, A.; Nogajewski, K.; Faugeras, C. Resonance effects in the Raman scattering of monolayer and few-layer MoSe2. Phys. Rev. B 2016, 93, 155407. [Google Scholar] [CrossRef]
- Lee, J.-U.; Kim, K.; Cheong, H. Resonant Raman and photoluminescence spectra of suspended molybdenum disulfide. 2D Mater. 2015, 2, 044003. [Google Scholar] [CrossRef]
- Bhatnagar, M.; Woźniak, T.; Kipczak, L.; Zawadzka, N.; Olkowska-Pucko, K.; Grzeszczyk, M.; Pawłowski, J.; Watanabe, K.; Taniguchi, T.; Babiński, A.; et al. Temperature induced modulation of resonant Raman scattering in bilayer 2H-MoS2. Sci. Rep. 2022, 12, 14169. [Google Scholar] [CrossRef]
- Kutrowska-Girzycka, J.; Jadczak, J.; Bryja, L. The study of dispersive ‘b’-mode in monolayer MoS2 in temperature dependent resonant Raman scattering experiments. Solid State Commun. 2018, 275, 25–28. [Google Scholar] [CrossRef]
- Zobeiri, H.; Xu, S.; Yue, Y.A.; Zhang, Q.Y.; Xie, Y.S.; Wang, X.W. Effect of temperature on Raman intensity of nm-thick WS2: Combined effects of resonance Raman, optical properties, and interface optical interference. Nanoscale 2020, 12, 6064–6078. [Google Scholar] [CrossRef]
- Sekine, T.; Uchinokura, K.; Nakashizu, T.; Matsuura, E.; Yoshizaki, R. Dispersive Raman Mode of Layered Compound 2H-MoS2 under the Resonant Condition. J. Phys. Soc. Jpn. 1984, 53, 811–818. [Google Scholar] [CrossRef]
- Golasa, K.; Grzeszczyk, M.; Leszczynski, P.; Faugeras, C.; Nicolet, A.A.L.; Wysmolek, A.; Potemski, M.; Babinski, A. Multiphonon resonant Raman scattering in MoS2. Appl. Phys. Lett. 2014, 104, 092106. [Google Scholar] [CrossRef]
- Gołasa, K.; Grzeszczyk, M.; Bożek, R.; Leszczyński, P.; Wysmołek, A.; Potemski, M.; Babiński, A. Resonant Raman scattering in MoS2—From bulk to monolayer. Solid State Commun. 2014, 197, 53–56. [Google Scholar] [CrossRef]
- Na, W.; Kim, K.; Lee, J.U.; Cheong, H. Davydov splitting and polytypism in few-layer MoS2. 2D Mater. 2019, 6, 015004. [Google Scholar] [CrossRef]
- Shinde, N.B.; Eswaran, S.K. Davydov Splitting, Double-Resonance Raman Scattering, and Disorder-Induced Second-Order Processes in Chemical Vapor Deposited MoS2 Thin Films. J. Phys. Chem. Lett. 2021, 12, 6197–6202. [Google Scholar] [CrossRef]
- Grzeszczyk, M.; Golasa, K.; Molas, M.R.; Nogajewski, K.; Zinkiewicz, M.; Potemski, M.; Wysmolek, A.; Babinski, A. Raman scattering from the bulk inactive out-of-plane B2g(1) mode in few-layer MoTe2. Sci. Rep. 2018, 8, 17745. [Google Scholar] [CrossRef]
- Carvalho, B.R.; Wang, Y.X.; Mignuzzi, S.; Roy, D.; Terrones, M.; Fantini, C.; Crespi, V.H.; Malard, L.M.; Pimenta, M.A. Intervalley scattering by acoustic phonons in two-dimensional MoS2 revealed by double-resonance Raman spectroscopy. Nat. Commun. 2017, 8, 14670. [Google Scholar] [CrossRef]
- Livneh, T.; Spanier, J.E. A comprehensive multiphonon spectral analysis in MoS2. 2D Mater. 2015, 2, 035003. [Google Scholar] [CrossRef]
- Livneh, T.; Sterer, E. Resonant Raman scattering at exciton states tuned by pressure and temperature in 2H-MoS2. Phys. Rev. B 2010, 81, 195209. [Google Scholar] [CrossRef]
- Bandaru, N.; Kumar, R.S.; Sneed, D.; Tschauner, O.; Baker, J.; Antonio, D.; Luo, S.-N.; Hartmann, T.; Zhao, Y.S.; Venkat, R. Effect of Pressure and Temperature on Structural Stability of MoS2. J. Phys. Chem. C 2014, 118, 3230–3235. [Google Scholar] [CrossRef]
- Jiang, J.J.; Li, H.P.; Dai, L.D.; Hu, H.Y.; Zhao, C.S. Raman scattering of 2H-MoS2 at simultaneous high temperature and high pressure (up to 600 K and 18.5 GPa). AIP Adv. 2016, 6, 035214. [Google Scholar] [CrossRef]
- Li, F.F.; Yan, Y.L.; Han, B.; Li, L.; Huang, X.L.; Yao, M.G.; Gong, Y.B.; Jin, X.L.; Liu, B.L.; Zhu, C.R.; et al. Pressure confinement effect in MoS2 monolayers. Nanoscale 2015, 7, 9075–9082. [Google Scholar] [CrossRef]
- Yan, Y.L.; Li, F.F.; Gong, Y.B.; Yao, M.G.; Huang, X.L.; Fu, X.P.; Han, B.; Zhou, Q.; Cui, T. Interlayer Coupling Affected Structural Stability in Ultrathin MoS2: An Investigation by High Pressure Raman Spectroscopy. J. Phys. Chem. C 2016, 120, 24992–24998. [Google Scholar] [CrossRef]
- Cheng, X.R.; Li, Y.Y.; Shang, J.M.; Hu, C.S.; Ren, Y.F.; Liu, M.; Qi, Z.M. Thickness-dependent phase transition and optical behavior of MoS2 films under high pressure. Nano Res. 2017, 11, 855–863. [Google Scholar] [CrossRef]
- Shen, P.F.; Li, Q.J.; Zhang, H.F.; Liu, R.; Liu, B.; Yang, X.G.; Dong, Q.; Cui, T.; Liu, B.B. Raman and IR spectroscopic characterization of molybdenum disulfide under under quasi-hydrostatic and non-hydrostatic conditions. Phys. Status Solidi B 2017, 254, 1600798. [Google Scholar] [CrossRef]
- Chi, Z.-H.; Zhao, X.-M.; Zhang, H.; Goncharov, A.F.; Lobanov, S.S.; Kagayama, T.; Sakata, M.; Chen, X.-J. Pressure-Induced Metallization of Molybdenum Disulfide. Phys. Rev. Lett. 2014, 113, 036802. [Google Scholar] [CrossRef]
- Zhuang, Y.K.; Dai, L.D.; Wu, L.; Li, H.P.; Hu, H.Y.; Liu, K.X.; Yang, L.F.; Pu, C. Pressure-induced permanent metallization with reversible structural transition in molybdenum disulfide. Appl. Phys. Lett. 2017, 110, 122103. [Google Scholar] [CrossRef]
- Nayak, A.P.; Pandey, T.; Voiry, D.; Liu, J.; Moran, S.T.; Sharma, A.; Tan, C.; Chen, C.-H.; Li, L.-J.; Chhowalla, M.; et al. Pressure-Dependent Optical and Vibrational Properties of Monolayer Molybdenum Disulfide. Nano Lett. 2014, 15, 346–353. [Google Scholar] [CrossRef]
- Staiger, M.; Rafailov, P.; Gartsman, K.; Telg, H.; Krause, M.; Radovsky, G.; Zak, A.; Thomsen, C. Excitonic resonances in WS2 nanotubes. Phys. Rev. B 2012, 86, 165423. [Google Scholar] [CrossRef]
- O’neal, K.R.; Cherian, J.G.; Zak, A.; Tenne, R.; Liu, Z.; Musfeldt, J.L. High Pressure Vibrational Properties of WS2 Nanotubes. Nano Lett. 2016, 16, 993–999. [Google Scholar] [CrossRef]
- Nayak, A.P.; Yuan, Z.; Cao, B.X.; Liu, J.; Wu, J.J.; Moran, S.T.; Li, T.S.; Akinwande, D.; Jin, C.Q.; Lin, J.F. Pressure-Modulated Conductivity, Carrier Density, and Mobility of Multi layered Tungsten Disulfide. Acs Nano 2015, 9, 9117–9123. [Google Scholar] [CrossRef]
- Kim, J.S.; Moran, S.T.; Nayak, A.P.; Pedahzur, S.; Ruiz, I.; Ponce, G.; Rodriguez, D.; Henny, J.; Liu, J.; Lin, J.F.; et al. High pressure Raman study of layered Mo0.5W0.5S2 ternary compound. 2D Mater. 2016, 3, 025003. [Google Scholar] [CrossRef]
- Fan, W.; Zhu, X.; Ke, F.; Chen, Y.B.; Dong, K.C.; Ji, J.; Chen, B.; Tongay, S.; Ager, J.W.; Liu, K.; et al. Vibrational spectrum renormalization by enforced coupling across the van der Waals gap between MoS2 and WS2 monolayers. Phys. Rev. B 2015, 92, 241408. [Google Scholar] [CrossRef]
- Livneh, T.; Reparaz, J.S.; Goni, A.R. Low-temperature resonant Raman asymmetry in 2H-MoS2 under high pressure. J. Phys-Condens. Mat. 2017, 29, 435702. [Google Scholar] [CrossRef] [PubMed]
- Cao, Z.Y.; Hu, J.W.; Goncharov, A.F.; Chen, X.J. Nontrivial metallic state of MoS2. Phys. Rev. B 2018, 97, 214519. [Google Scholar] [CrossRef]
- Caramazza, S.; Capitani, F.; Marini, C.; Mancini, A.; Malavasi, L.; Dore, P.; Postorino, P. Effect of pressure on optical properties of the transition metal dichalcogenide MoSe2. J. Physics Conf. Ser. 2017, 950, 042012. [Google Scholar] [CrossRef]
- Yang, L.F.; Dai, L.D.; Li, H.P.; Hu, H.Y.; Liu, K.X.; Pu, C.; Hong, M.L.; Liu, P.F. Pressure-induced metallization in MoSe2 under different pressure conditions. RSC Adv. 2019, 9, 5794–5803. [Google Scholar] [CrossRef]
- Bhatt, S.V.; Deshpande, M.P.; Sathe, V.; Rao, R.; Chaki, S.H. Raman spectroscopic investigations on transition-metal dichalcogenides MX2 (M = Mo, W.; X = S, Se) at high pressures and low temperature. J. Raman Spectrosc. 2014, 45, 971–979. [Google Scholar] [CrossRef]
- Saha, P.; Ghosh, B.; Mazumder, A.; Mukherjee, G.D. High pressure anomalies in exfoliated MoSe2: Resonance Raman and X-ray diffraction studies. Mater. Res. Express 2020, 7, 025902. [Google Scholar] [CrossRef]
- Bera, A.; Singh, A.; Sorb, Y.A.; Jenjeti, R.N.; Muthu, D.V.S.; Sampath, S.; Narayana, C.; Waghmare, U.V.; Sood, A.K. Chemical ordering and pressure-induced isostructural and electronic transitions in MoSSe crystal. Phys. Rev. B 2020, 102, 014103. [Google Scholar] [CrossRef]
- Ruppert, C.; Aslan, O.B.; Heinz, T.F. Optical Properties and Band Gap of Single- and Few-Layer MoTe2 Crystals. Nano Lett. 2014, 14, 6231–6236. [Google Scholar] [CrossRef] [PubMed]
- Lin, Y.-F.; Xu, Y.; Wang, S.-T.; Li, S.-L.; Yamamoto, M.; Aparecido-Ferreira, A.; Li, W.W.; Sun, H.B.; Nakaharai, S.; Jian, W.-B.; et al. Ambipolar MoTe2Transistors and Their Applications in Logic Circuits. Adv. Mater. 2014, 26, 3263–3269. [Google Scholar] [CrossRef]
- Bera, A.; Singh, A.; Muthu, D.V.S.; Waghmare, U.V.; Sood, A.K. Pressure-dependent semiconductor to semimetal and Lifshitz transitions in 2H-MoTe2: Raman and first-principles studies. J. Phys. Condens. Mat. 2017, 29, 105403. [Google Scholar] [CrossRef]
- Zhao, X.M.; Liu, H.Y.; Goncharov, A.F.; Zhao, Z.W.; Struzhkin, V.V.; Mao, H.K.; Gavriliuk, A.G.; Chen, X.J. Pressure effect on the electronic, structural, and vibrational properties of layered 2H-MoTe2. Phys. Rev. B 2019, 99, 024111. [Google Scholar] [CrossRef]
- Lu, P.C.; Kim, J.S.; Yang, J.; Gao, H.; Wu, J.F.; Shao, D.X.; Li, B.; Zhou, D.W.; Sun, J.; Akinwande, D.; et al. Origin of superconductivity in the Weyl semimetal WTe2 under pressure. Phys. Rev. B 2016, 94, 224512. [Google Scholar] [CrossRef]
- Zhou, Y.H.; Chen, X.L.; Li, N.N.; Zhang, R.R.; Wang, X.F.; An, C.; Zhou, Y.; Pan, X.C.; Song, F.Q.; Wang, B.G.; et al. Pressure-induced Td to 1T′ structural phase transition in WTe2. AIP Adv. 2016, 6, 075008. [Google Scholar] [CrossRef]
- Xia, J.; Li, D.-F.; Zhou, J.-D.; Yu, P.; Lin, J.-H.; Kuo, J.-L.; Li, H.-B.; Liu, Z.; Yan, J.-X.; Shen, Z.-X. Pressure-Induced Phase Transition in Weyl Semimetallic WTe2. Small 2017, 13, 1701887. [Google Scholar] [CrossRef] [PubMed]
- Ji, J.T.; Zhang, A.M.; Fan, J.H.; Li, Y.S.; Wang, X.Q.; Zhang, J.D.; Plummer, E.W.; Zhang, Q.M. Giant magneto-optical Raman effect in a layered transition metal compound. Proc. Natl. Acad. Sci. USA 2016, 113, 2349–2353. [Google Scholar] [CrossRef]
- Du, L.J.; Jia, Z.Y.; Zhang, Q.; Zhang, A.M.; Zhang, T.T.; He, R.; Yang, R.; Shi, D.X.; Yao, Y.G.; Xiang, J.Y.; et al. Electronic structure-dependent magneto-optical Raman effect in atomically thin WS2. 2D Mater. 2018, 5, 035028. [Google Scholar] [CrossRef]
- Yang, Y.; Liu, W.G.; Lin, Z.T.; Pan, R.H.; Gu, C.Z.; Li, J.J. Plasmonic hybrids of two-dimensional transition metal dichalcogenides and nanoscale metals: Architectures, enhanced optical properties and devices. Mater. Today Phys. 2021, 17, 100343. [Google Scholar] [CrossRef]
- Liu, W.G.; Lin, Z.T.; Tian, S.B.; Huang, Y.; Xue, H.Q.; Zhu, K.; Gu, C.Z.; Yang, Y.; Li, J.J. Plasmonic Effect on the Magneto-Optical Property of Monolayer WS2 Studied by Polarized-Raman Spectroscopy. Appl. Sci. 2021, 11, 1599. [Google Scholar] [CrossRef]
- Yang, Y.; Liu, W.G.; Lin, Z.T.; Zhu, K.; Tian, S.B.; Huang, Y.; Gu, C.Z.; Li, J.J. Micro-Defects in Monolayer MoS2 Studied by Low-Temperature Magneto-Raman Mapping. J. Phys. Chem. C 2020, 124, 17418–17422. [Google Scholar] [CrossRef]
- Wan, Y.; Cheng, X.; Li, Y.F.; Wang, Y.Q.; Du, Y.P.; Zhao, Y.B.; Peng, B.; Dai, L.; Kan, E.J. Manipulating the Raman scattering rotation via magnetic field in an MoS2 monolayer. RSC Adv. 2021, 11, 4035–4041. [Google Scholar] [CrossRef]
- Chhowalla, M.; Shin, H.S.; Eda, G.; Li, L.-J.; Loh, K.P.; Zhang, H. The chemistry of two-dimensional layered transition metal dichalcogenide nanosheets. Nat. Chem. 2013, 5, 263–275. [Google Scholar] [CrossRef]
- Hudl, M.; Lazor, P.; Mathieu, R.; Gavriliuk, A.G.; Struzhkin, V.V. PPMS-based set-up for Raman and luminescence spectroscopy at high magnetic field, high pressure and low temperature. EPJ Tech. Instrum. 2015, 2, 3. [Google Scholar] [CrossRef]
- Drapcho, S.G.; Kim, J.; Hong, X.P.; Jin, C.H.; Shi, S.F.; Tongay, S.; Wu, J.Q.; Wang, F. Apparent breakdown of Raman selection rule at valley exciton resonances in monolayer MoS2. Phys. Rev. B 2017, 95, 165417. [Google Scholar] [CrossRef]
- Kim, J.; Lee, J.-U.; Cheong, H. Polarized Raman spectroscopy for studying two-dimensional materials. J. Phys. Condens. Matter 2020, 32, 343001. [Google Scholar] [CrossRef] [PubMed]
- Cao, T.; Wang, G.; Han, W.P.; Ye, H.Q.; Zhu, C.R.; Shi, J.R.; Niu, Q.; Tan, P.H.; Wang, E.; Liu, B.L.; et al. Valley-selective circular dichroism of monolayer molybdenum disulphide. Nat. Commun. 2012, 3, 887. [Google Scholar] [CrossRef]
- Zhang, X.X.; You, Y.M.; Zhao, S.Y.F.; Heinz, T.F. Experimental Evidence for Dark Excitons in Monolayer WSe2. Phys. Rev. Lett. 2015, 115, 257403. [Google Scholar] [CrossRef] [PubMed]
- Golovynskyi, S.; Irfan, I.; Bosi, M.; Seravalli, L.; Datsenko, O.I.; Golovynska, I.; Li, B.K.; Lin, D.Y.; Qu, J.L. Exciton and trion in few-layer MoS2: Thickness- and temperature-dependent photoluminescence. Appl. Surf. Sci. 2020, 515, 146033. [Google Scholar] [CrossRef]
- Wang, Y.K.; Xie, Y.Z.; Dai, Y.Y.; Han, X.; Huang, Y.; Gao, Y.A. Intensive and broad bound exciton emission at cryogenic temperature in suspended monolayer transition metal dichalcogenides. Phys. Rev. Mater. 2022, 6, L111001. [Google Scholar] [CrossRef]
- Bao, C.H.; Tang, P.Z.; Sun, D.; Zhou, S.Y. Light-induced emergent phenomena in 2D materials and topological materials. Nat. Rev. Phys. 2022, 4, 33–48. [Google Scholar] [CrossRef]
Disclaimer/Publisher’s Note: The statements, opinions and data contained in all publications are solely those of the individual author(s) and contributor(s) and not of MDPI and/or the editor(s). MDPI and/or the editor(s) disclaim responsibility for any injury to people or property resulting from any ideas, methods, instructions or products referred to in the content. |
© 2023 by the authors. Licensee MDPI, Basel, Switzerland. This article is an open access article distributed under the terms and conditions of the Creative Commons Attribution (CC BY) license (https://creativecommons.org/licenses/by/4.0/).