Article

Optical and Thermoelectric Properties of Surface-Oxidation Sensitive Layered Zirconium Dichalcogenides ZrS2−xSex (x = 0, 1, 2) Crystals Grown by Chemical Vapor Transport

by
Thalita Maysha Herninda
and
Ching-Hwa Ho
*
Graduate Institute of Applied Science and Technology, National Taiwan University of Science and Technology, Taipei 106, Taiwan
*
Author to whom correspondence should be addressed.
Crystals 2020, 10(4), 327; https://doi.org/10.3390/cryst10040327
Submission received: 11 April 2020 / Revised: 20 April 2020 / Accepted: 20 April 2020 / Published: 22 April 2020

Abstract

:
In this work, structure, optical, and thermoelectric properties of layered ZrS2−xSex single crystals with selenium composition of x = 0, 1, and 2 were examined. Single crystals of zirconium dichalcogenides layer compounds were grown by chemical vapor transport method using I2 as the transport agent. X-ray diffraction (XRD) and high-resolution transmission electron microscope (HRTEM) results indicated that ZrS2−xSex (x = 0, 1, and 2) were crystalized in hexagonal CdI2 structure with one-layer trigonal (1T) stacking type. X-ray photoelectron and energy dispersive X-ray measurements revealed oxidation sensitive behavior of the chalcogenides series. Transmittance and optical absorption showed an indirect optical gap of about 1.78 eV, 1.32 eV, and 1.12 eV for the ZrS2−xSex with x = 0, 1, and 2, respectively. From the result of thermoelectric experiment, ZrSe2 owns the highest figure-of merit (ZT) of ~0.085 among the surface-oxidized ZrS2−xSex series layer crystals at 300 K. The ZT values of the ZrS2−xSex (x = 0, 1, and 2) series also reveal increase with the increase of Se content owing to the increase of carrier concentration and mobility in the highly Se-incorporated zirconium dichalcogenides with surface states.

Graphical Abstract

1. Introduction

Two-dimensional (2D) transition metal dichalcogenides (TMDCs) as MX2 (M = Mo, W, Re and X = S, Se) [1,2,3,4,5] and III-VI layer compounds as NX (N = Ga, In and X = S, Se) [6,7,8] have recently received considerable attentions on their excellent optical and electrical properties available for application in electronics and optoelectronics devices [9] because their specific characteristics of flexible, large-area, and ultra-thin, etc. These materials have a proper band gap of 1~2.5 eV (in near infrared to visible region) [10,11] that suitable for solar-energy applications. Among them, III-VI GaSe and GaS series showed feasibility for making visible light emitting devices owing to their widened and adjustable band gaps [10,11]. On the other hand, ZrX2 (X = S, Se) are the group IVB TMDC materials that crystallized in one-layer trigonal (1T) structure of CdI2 type [12]. These materials also have band gaps ranging from 1.1 to 2 eV [13,14]. The compounds usually possess high conductivity and contains defects and surface states in its layer structure. The proper band-gap value and higher conductivity may also render ZrX2 suitable for electronic and thermoelectric device applications [15,16,17]. Despite their TMDC counterparts of MoS2 series undergoing an indirect-to-direct band gap transition in the monolayer form [18], the ZrX2 series TMDCs may remain in indirect band gap in all thicknesses [19]. The electronic band gaps and optical properties of the layered ZrX2 (X = S, Se) series compounds are rarely studied up to date.
In earlier research, the first principle thermoelectric properties of zirconium dichalcogenides was reported by a number of authors [20,21]; nevertheless, experimental works on thermoelectric properties of ZrX2 (X = S, Se) have rarely been reported. Some of the 1D nanowire and nanoscale thermoelectric materials have been claimed to have improved thermo-electronic transport property [22,23]; however, to date, experimental thermoelectric measurements on the Zr-based ZrS2, ZrSSe, and ZrSe2 layered TMDCs are seldom found in the literature, in spite of some thermoelectric materials [24,25,26,27] having been reported for power-generation applications. In this paper, the optical and thermoelectric properties of ZrS2−xSex (x = 0, 1, and 2) were characterized using temperature-dependent transmittance, Raman, and thermoelectric measurements from low to room temperature. Transmittance and optical absorption revealed indirect allowed transition of all series ZrS2−xSex (x = 0, 1, and 2) layered crystals. Raman measurement of ZrS2−xSex (x = 0, 1, and 2) also sustains that the whole series 2D materials are crystallized in the 1T phase similar to the result of X-ray diffraction (XRD). The Raman mode of A1g is the prominent peak in the layer plane. Because of surface oxidation, the ZrS2−xSex (x = 0, 1, and 2) series chalcogenides reveal lower resistivity. From thermoelectric measurement, the ZT value increases with the Se content is increased in the ZrSe2−xSex (x = 0, 1, and 2) series at room temperature.

2. Materials and Methods

High quality ZrS2−xSex (x = 0, 1, and 2) bulk crystals were grown by chemical vapor transport (CVT) method using Iodine (I2) as the transport agent [28]. Prior to the growth, synthesis of the starting material powders of ZrS2−xSex (x = 0, 1, and 2) with stoichiometry were needed. For crystal growth, the starting material powder together with proper amount of transport agent (10 mg/cm3) were cooled with liquid nitrogen, and then sealed in a vacuum of ~10−6 Torr inside a quartz ampoule. The growth temperature was set as 900 °C → 850 °C with a gradient of 2.5 °C/cm. The growth time kept 280 h for growing single crystals. After the growth the crystal series essentially exhibited silver-black and shiny color on their fresh surface. When they are oxidized in ambient (about 8 days in air) ZrS2 becomes silver-yellow color, ZrSSe becomes silver orange, and ZrSe2 becomes silver red. The color change is maybe caused by free of chalcogen (S, Se) and which substitution by oxygen in the zirconium compounds. The crystal images are shown in Figure S1 in supporting information (SI) for contrast. With weakened van der Waals bonding between the layers, thin ZrX2 nanosheets can be mechanically exfoliated and transferred onto a SiO2/Si substrate (8 × 8 × 0.3 mm3) using Scotch tape for performing micro-Raman experiment. To avoid surface oxidation in air, the as-grown ZrX2 series crystals and exfoliated nanosheets (on SiO2/Si) were stored in an evacuated chamber before measurements. Prior to each of the experiments, the as-grown crystals can be exfoliated again to obtain fresh surface.
For X-ray diffraction (XRD) measurements, several small crystals from each composition of the ZrX2 series were finely ground and the X-ray powder patterns were taken and recorded by means of a slow moving radiation detector. The copper Kα radiation (1.542 Å) was employed in the X-ray diffraction measurements, and a silicon standard was used for experimental calibration. The micro-Raman measurements of the ZrS2, ZrSSe, and ZrSe2 nanosheets were carried out in a RAMaker microscope spectrometer (ProTrustTech, Tainan, Taiwan) with a 532-nm solid state diode-pumped laser as the excitation source. An Olympus objective lens (50× or 100× with long working distance) acted as the interconnection-coupled medium between the nanosheet sample, incident and reflected lights, and a charge-coupled-device (CCD) spectrometer equipped with one 1200 grooves/mm grating. The power of the 532-nm laser was controlled at 8 mW and the spot size was ~0.8 μm. A Janis liquid helium open-circled cryostat equipped (Janis Co., Woburn, MA, USA) with Lakeshore 335 digital thermometer controller facilitated low-temperature and temperature-dependent measurements.
For transmission measurement of the thin ZrX2 (X = S, Se) samples, a 150 W tungsten halogen lamp was utilized for the white light source. The white light was dispersed by a Photonics International (PTI) monochromator (Photonics International, MA, USA) equipped one 600 grooves/mm grating for providing monochromatic light. The incident light was chopped at 200 Hz, and phase-locked detection by using a lock-in amplifier was employed. The transmission light from the layer sample was detected by a Si detector (E > 1.1 eV) or an InGaAs detector (E = 0.7 to 1.7 eV) in different wavelength range.
For thermoelectric measurement, a stainless-steel plate of 4 × 2 × 0.01 cm−3 covered with thin insulating tape on its top surface acted as the sample holder. The insulating tape should have much lower thermal conductivity than the measured sample, to avoid any parasitic heat loss to the substrate. Gold evaporated film on the insulating tape acted as the heater (R ~ 9 Ω) for the layered samples. The layered zirconium dichalcogenide crystals were prepared in rectangle shape of bar-type four-point measurement configuration (size ~0.45 × 0.12 × 0.01 cm3) that available for both resistivity and thermoelectric measurements. For thermoelectric measurement, one end of the bar-shape ZrX2 sample was closely attached on the Au-film heater, and a current of ~ 0.4 A was sent. When the sample temperature is balanced (after seconds), the voltage difference (ΔV) and temperature difference (ΔT) are simultaneously measured from the two central probes of the bar-shape ZrX2 sample for the estimation of Seebeck coefficient and thermal conductivity. A pair of E-type thermocouples was used for sensing the temperature difference between the two central probes in the thermoelectric-measured sample. The temperature-dependent thermoelectric measurement was done from 20 to 300 K.

3. Results and Discussion

3.1. Structure and Composition Analysis of ZrS2−xSex (x = 0, 1, and 2) Crystals

Figure 1a shows high-resolution-transmission-electron-microscope (HRTEM) images of ZrS2−xSex (x = 0, 1, and 2) series crystals. The obvious dotted pattern in selected-area-electron-diffraction (SAED) pictures that proves all the crystals are high-quality single crystals. From the HRTEM and SAED results, the lattice constant a can be determined to be 3.651 Å for ZrS2, 3.687 Å for ZrSSe, and 3.769 Å for ZrSe2, respectively. Essentially, the lattice constant a will be expanded when more Se atoms are incorporated into the ZrS2−xSex (x = 0, 1, and 2) series crystals. This result is well-matched with those obtained and calculated from XRD measurement (see Table S1). The XRD results shown in Figure 1b also indicate that ZrSSe series crystals are mainly crystallized in the 1T-CdI2 layer structure with verification of the preferred c plane peak indexed as (001) [29]. The lattice constant c measured from XRD can be determined to be 5.818 Å for ZrS2, 5.980 Å for ZrSSe, and 6.101 Å for ZrSe2, respectively. For the lattice constant of a axis, the peak indices of (101), (102), (110), (103), (201), (202), and (113) planes also show gradually increase with the selenium content is increased in the XRD pattern in Figure 1b. This result reveals lattice dilation of a axis in the ZrS2−xSex lattice from x = 0 to x = 1. The monolayer of 1T-ZrX2 consists of six hexagonal chalcogen atoms that octahedrally coordinated with one center metal atom [30]. The obtained lattice constants of ZrS2−xSex (x = 0, 1, and 2) reveal that the lattice constant a possesses the similar trend as that of c, in which the values are simultaneously increased with the Se content is increased as displayed in Figure 1c. For ZrX2, the metal atoms are located in the centre sheet and which is sandwiched by two chalcogen layers to form X-M-X monolayer with strong covalent bond within the layer plane, and adjacent layers are connected by weak van der Waals force as displayed in Figure 1d [19,31]. All the structural analysis of HRTEM and XRD in Figure 1 confirmed that the ZrS2−xSex (x = 0, 1, and 2) series crystals are crystallized in the 1T layered structure.
Energy dispersive X-ray (EDX) spectroscopy is carried out to estimate stoichiometric content of ZrS2−xSex (x = 0, 1, and 2) series (Figure S2). The x value of chalcogen composition is lower than that of nominal composition due to the surface oxidation under ambient air condition after eight days. The ZrSe2 demonstrate color change due to the surface oxidation as evident in Figure S1b,c from black shiny (fresh surface) to pink red and white color (oxidize surface). It is noticed that even with fresh surface, the ZrX2 samples in Figure S2 still revealed chalcogen deficiency, the zirconium dangling bonds can easily oxidize with oxygen in the layer compounds. Thus, the surface states and defects, like S/Se vacancies or Zr interstitials, still exist in the ZrS2−xSex to affect electrical conduction and carrier transport properties. These layered semiconductors will become degenerate and high carrier concentration, and we will evaluate the materials by temperature-dependent resistivity later.

3.2. Raman Spectroscopy

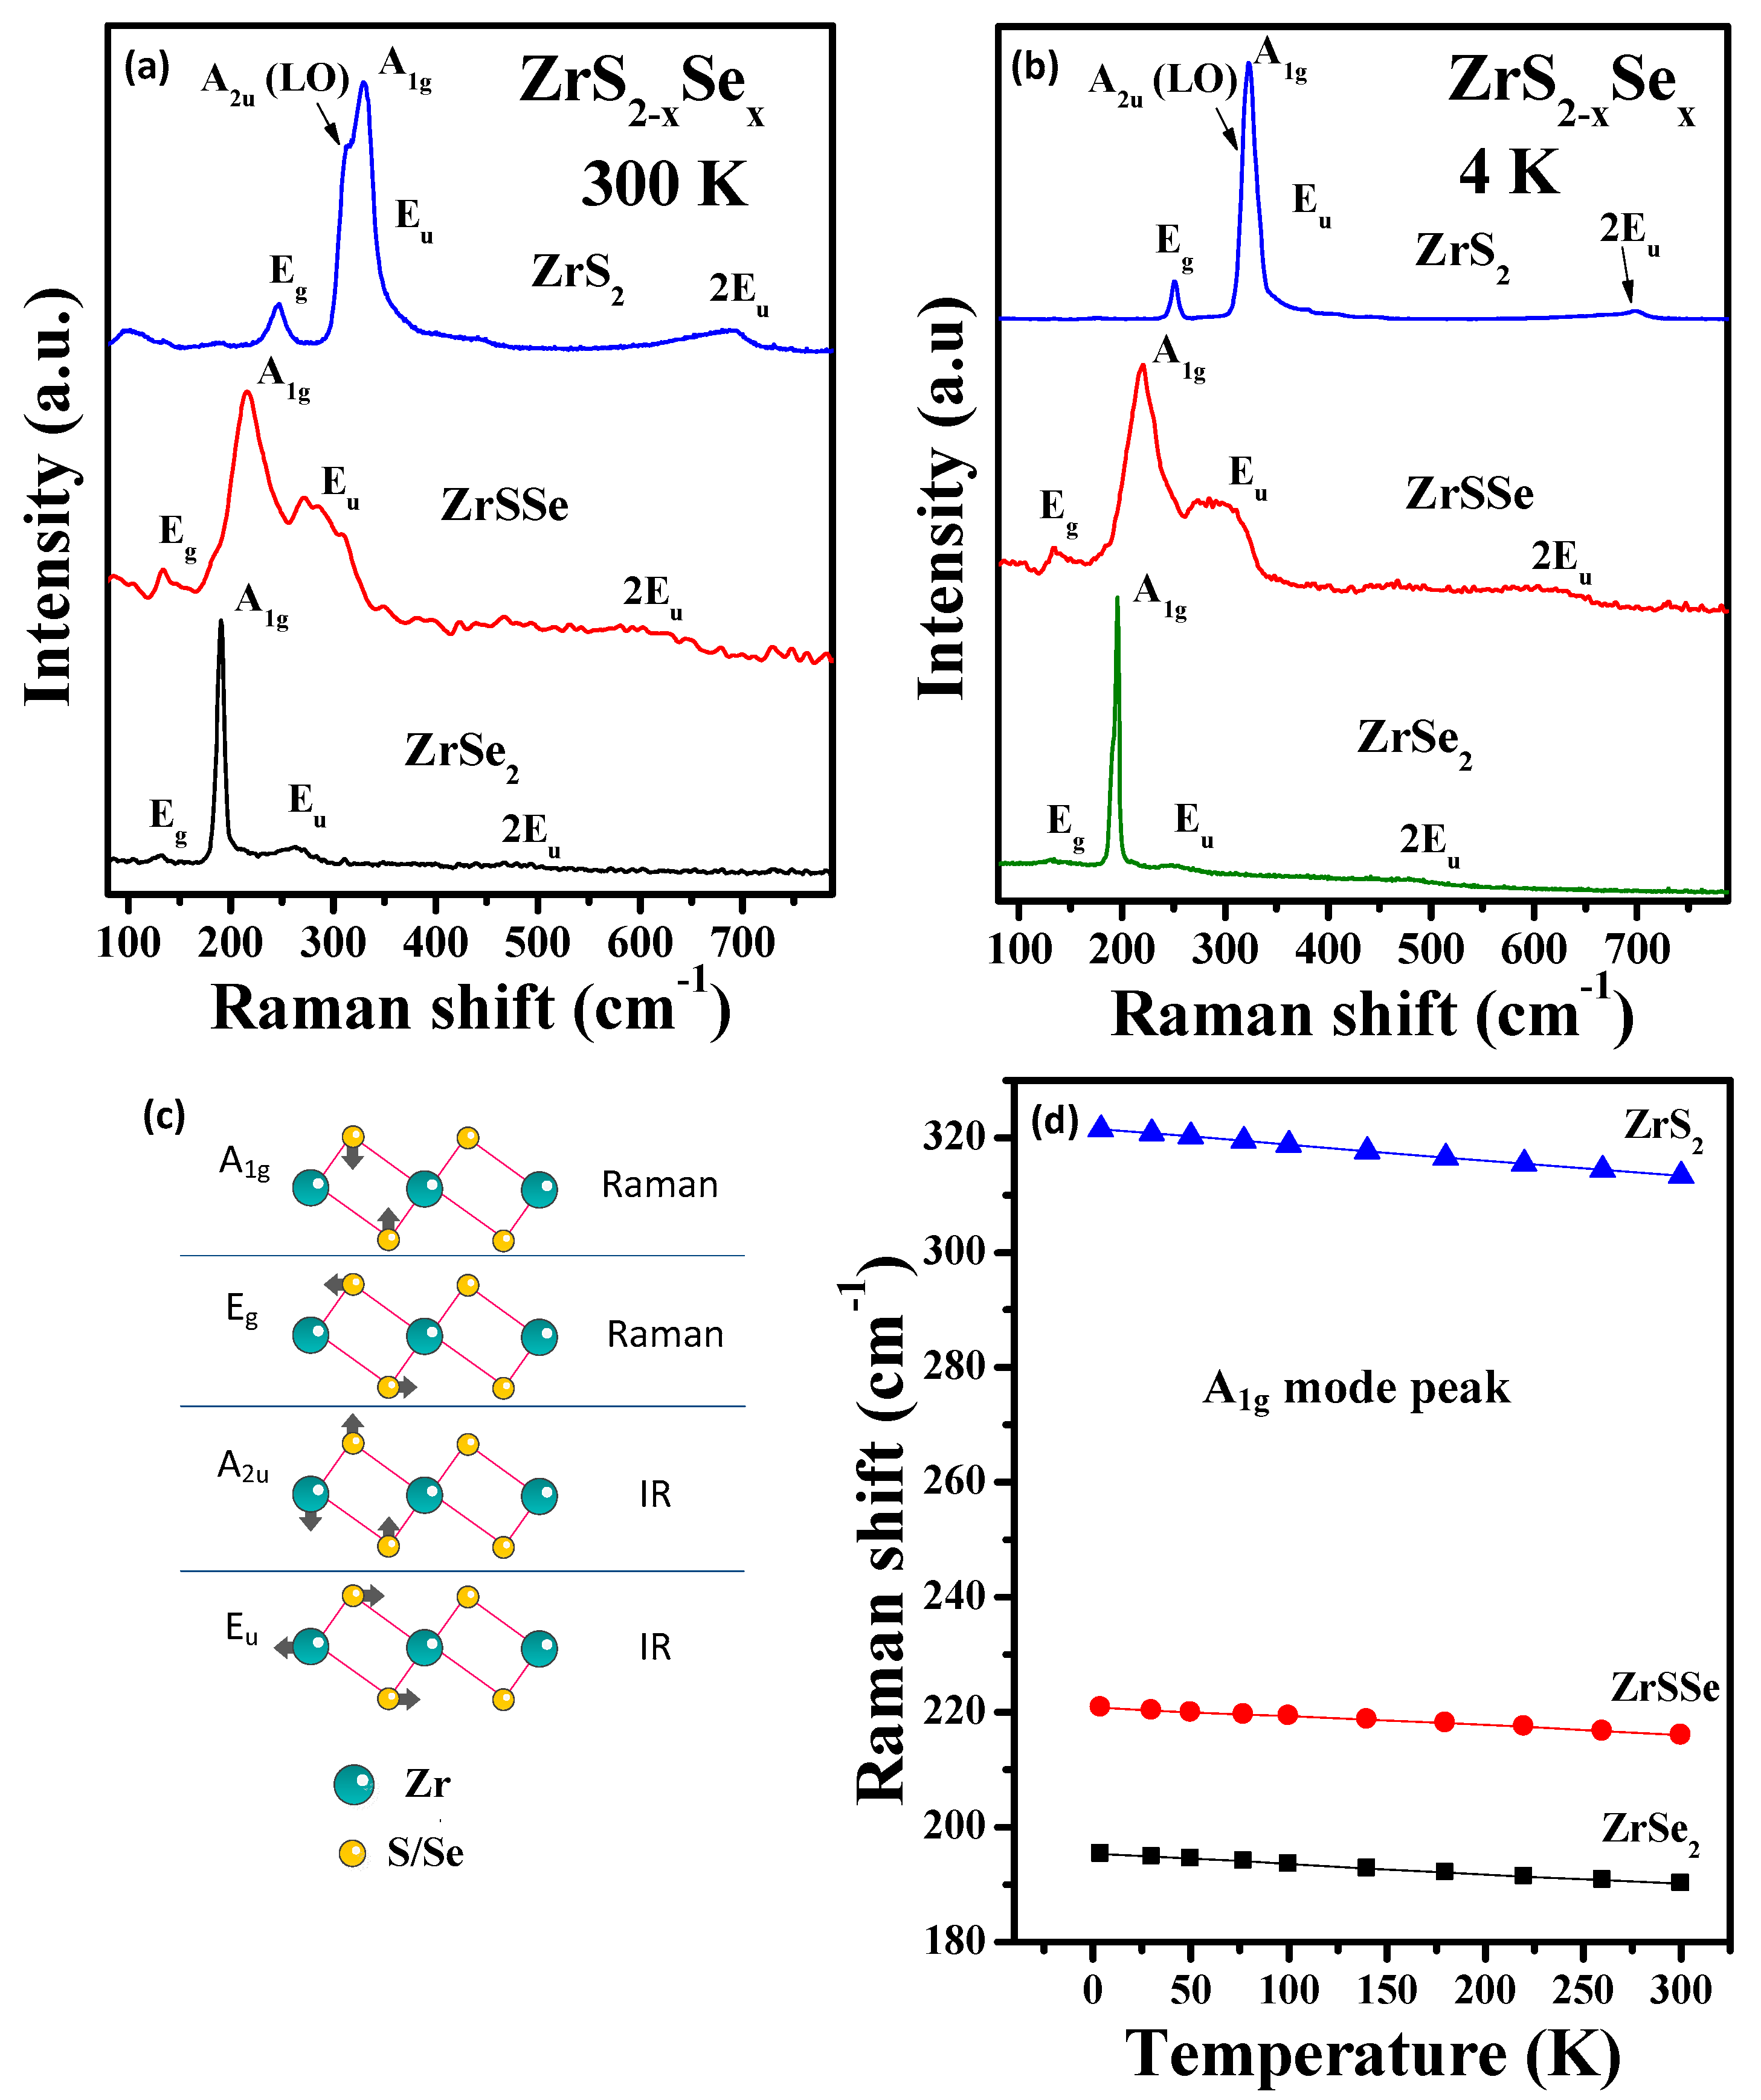
For micro-Raman measurement, the bulk ZrS2−xSex (x = 0, 1, and 2) samples are exfoliated into thin layers (t < 40 nm, measured by atomic force microscopy) on a commercialized SiO2/Si substrate (thickness: SiO2~200 nm and Si~300 μm). The ZrX2 thin layers were characterized from 4 to 300 K. Figure 2a shows the Raman spectra of multilayer ZrS2−xSex (x = 0, 1, and 2) at room temperature, and the low temperature Raman spectra at 4 K is also included in Figure 2b, for comparison. The temperature-dependent Raman spectra of ZrS2, ZrSSe, and ZrSe2 are shown in Figure S3. The in-plane (Eg) and out-plane (A1g) Raman modes can be detected in these ZrX2 related layer crystals. At 300 K, ZrS2−xSex (x = 0, 1, and 2) exhibit much broadened peaks compared to those measured at 4 K owing to thermal effect on lattice vibration. An A2u(LO) peak near A1g of ZrS2 is detected which may be caused by IR mode [32] or by non-harmonic effect of A1g induced by acoustic phonon [33]. Figure 2c shows the representative scheme of vibrated eigen-modes of ZrX2 [32]. ZrS2 reveals three peaks positioned at 246 ± 2 (Eg), 316 ± 2 (A2u) and 332 ± 2 cm−1 (A1g), as well as IR mode 2Eu at approximately 680 ± 2 cm−1 at 300 K. Raman spectrum of ZrSSe reveals strong A1g mode at ~214 cm−1 and weak Eg mode at 133 ± 2 cm−1. The longitudinal optical mode Eu appears at 286 ± 2 cm−1. For ZrSe2, there are three peaks positioned at 126 ± 2 (Eg), 191 ± 2 (A1g), and 262 ± 2 cm−1 (Eu) at 300 K. The Raman modes of the ZrS2−xSex (x = 0, 1, and 2) series show frequency-reduction behavior with the increase of Se content. The heavier selenium atom causes the vibration peak shifted to lower wavenumber for identification of Se doping effect. Figure 2d shows the Raman shift of A1g mode as the function of temperature from 4 to 300 K. The variation mode follows a linear dependence of energy reduction when the temperature is increased. This behavior may be attributed to the lattice dilation of ZrS2−xSex (x = 0, 1, and 2) at room temperature to decrease lattice vibration frequency [34]. The temperature-dependent Raman spectra of ZrS2−xSex series are also shown in Figure S3 for detailed comparison of the modes’ shift with temperature.

3.3. Optical Band Gap and Valence-Band Structure

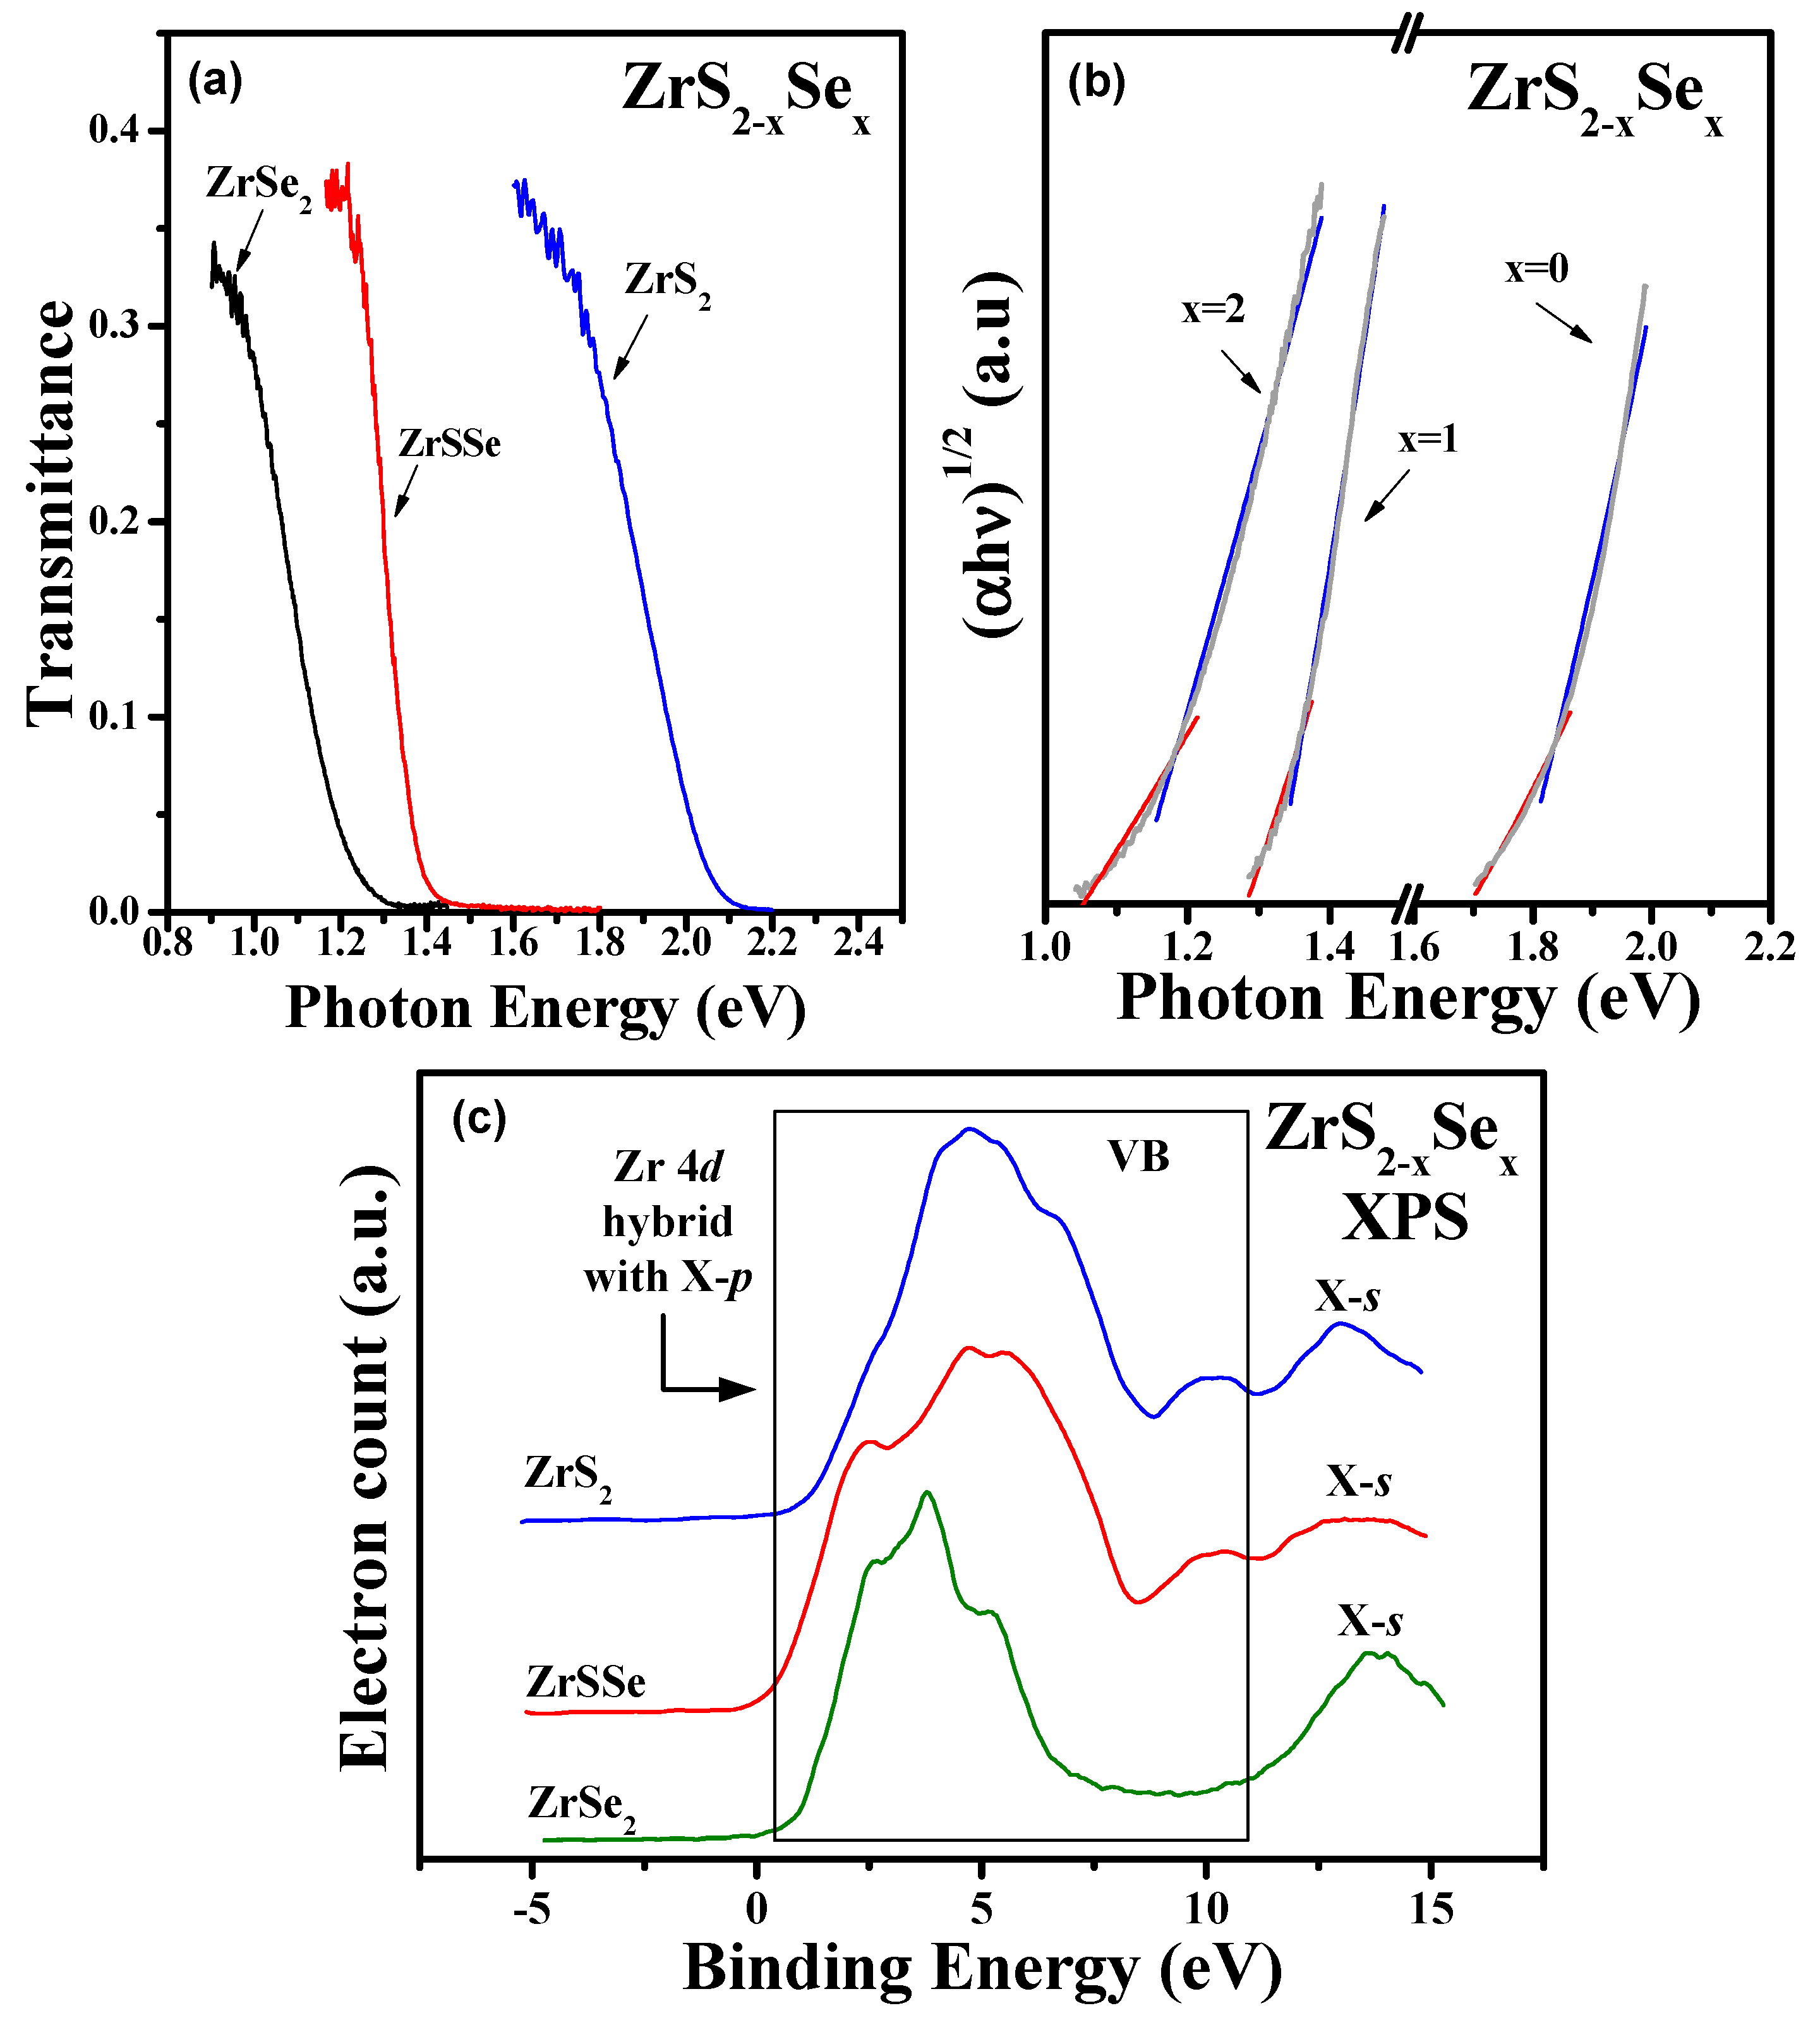
To further characterize the ZrS2−xSex (x = 0, 1, and 2) series, transmittance measurement and X-ray photoelectron spectroscopy (XPS) are carried out. The transmittance measurement is very useful to evaluate optical absorption near band-edge portion [35]. The transmittance spectrum needs to be measured at near-normal incidence, and the absorption coefficient should be determined from measured transmittance by examining the spectral dependence of reflectance [35]. The transmittance spectra of ZrS2−xSex (x = 0, 1, and 2) crystals measured at 300 K were shown in Figure 3a. The thickness of the crystal was controlled to be ~6 µm to ~10 µm measured by atomic force microscopy. Essentially, bulk ZrX2 series crystals were mechanically exfoliated to µm scale to obtain fresh surface using Scotch tape. It is noticed that even a little oxide (ZrO2) still existed on the surface of ZrS2; the band gap of ZrO2 (~5 eV) is usually larger than ZrS2, similar to that of Ga2O3 [36] > Ga2S3 [37] and In2O3 [38] > In2S3 [39]. There is no light-shielding effect from the surface oxide on ZrX2 when doing transmittance. The related band-edge value of ZrX2 could be obtained by analyzing the photon (Eg) and phonon (Ep) energies expressed by αhν = (hν − Eg + Ep)2/[exp(Ep/kT) − 1] + (hν − Eg − Ep)2/[1 − exp(−Ep/kT)] for assisting an indirect transition of absorption and emission of a phonon in the optical process. The plot of (αhν)1/2 versus hν for the analysis of indirect gaps are shown in Figure 3b. The indirect band edge Eg of each crystal is 1.78 eV for ZrS2, 1.32 eV for ZrSSe, and 1.12 eV for ZrSe2 at 300 K. These values are in agreement with previous result reported for ZrS2 and ZrSSe [40]. The obtained phonon energies from the linear fits of (αhν)1/2 versus hν [41] are Ep = 40 ± 10 meV for all the ZrS2−xSex (x = 0, 1, and 2) series. The variation of indirect band edge indicated the doping effect of selenium content in pure ZrS2 would cause the band-edge position shifting to lower energy with increasing Se content. This situation resembled the gradual lattice constant change with respect to the increasing of selenium composition obtained by XRD and HRTEM measurements. The XPS spectra in Figure 3c show the main valence-band structure of ZrS2−xSex (x = 0, 1, and 2 with fresh surface) is coming from Zr 4d hybrid with chalcogen p orbital. According to the electron configuration, transition metal Zr d electrons used to have bonding with chalcogen S/Se, which forms Zr4+ (d0s0) configuration connected to 2⋅(S/Se)2− (s2p6) [42]. For octahedral coordination, the d orbitals will split into two sets of energies due to the trigonal distortion and ligand field. The higher energy set comes from dz2 symmetry and lower energy set comes from dxz, dyz, dxy symmetry [43]. For group IVB TMDC materials, especially for the ZrS2−xSex (x = 0, 1, and 2) series, the dz2 set is vacant and forms the lowest conduction band. The complete set of XPS spectra were also measured and displayed in Figure S4 for comparison. The energies of Zr 3d, S 2p, and Se 3d orbitals show redshift as the Se content is increased in the ZrS2−xSex (x = 0, 1, and 2) series. It also verifies a little oxygen-incorporation effect in the ZrS2−xSex (x = 0, 1, and 2) series layer crystals.

3.4. Transport and Thermoelectric Properties

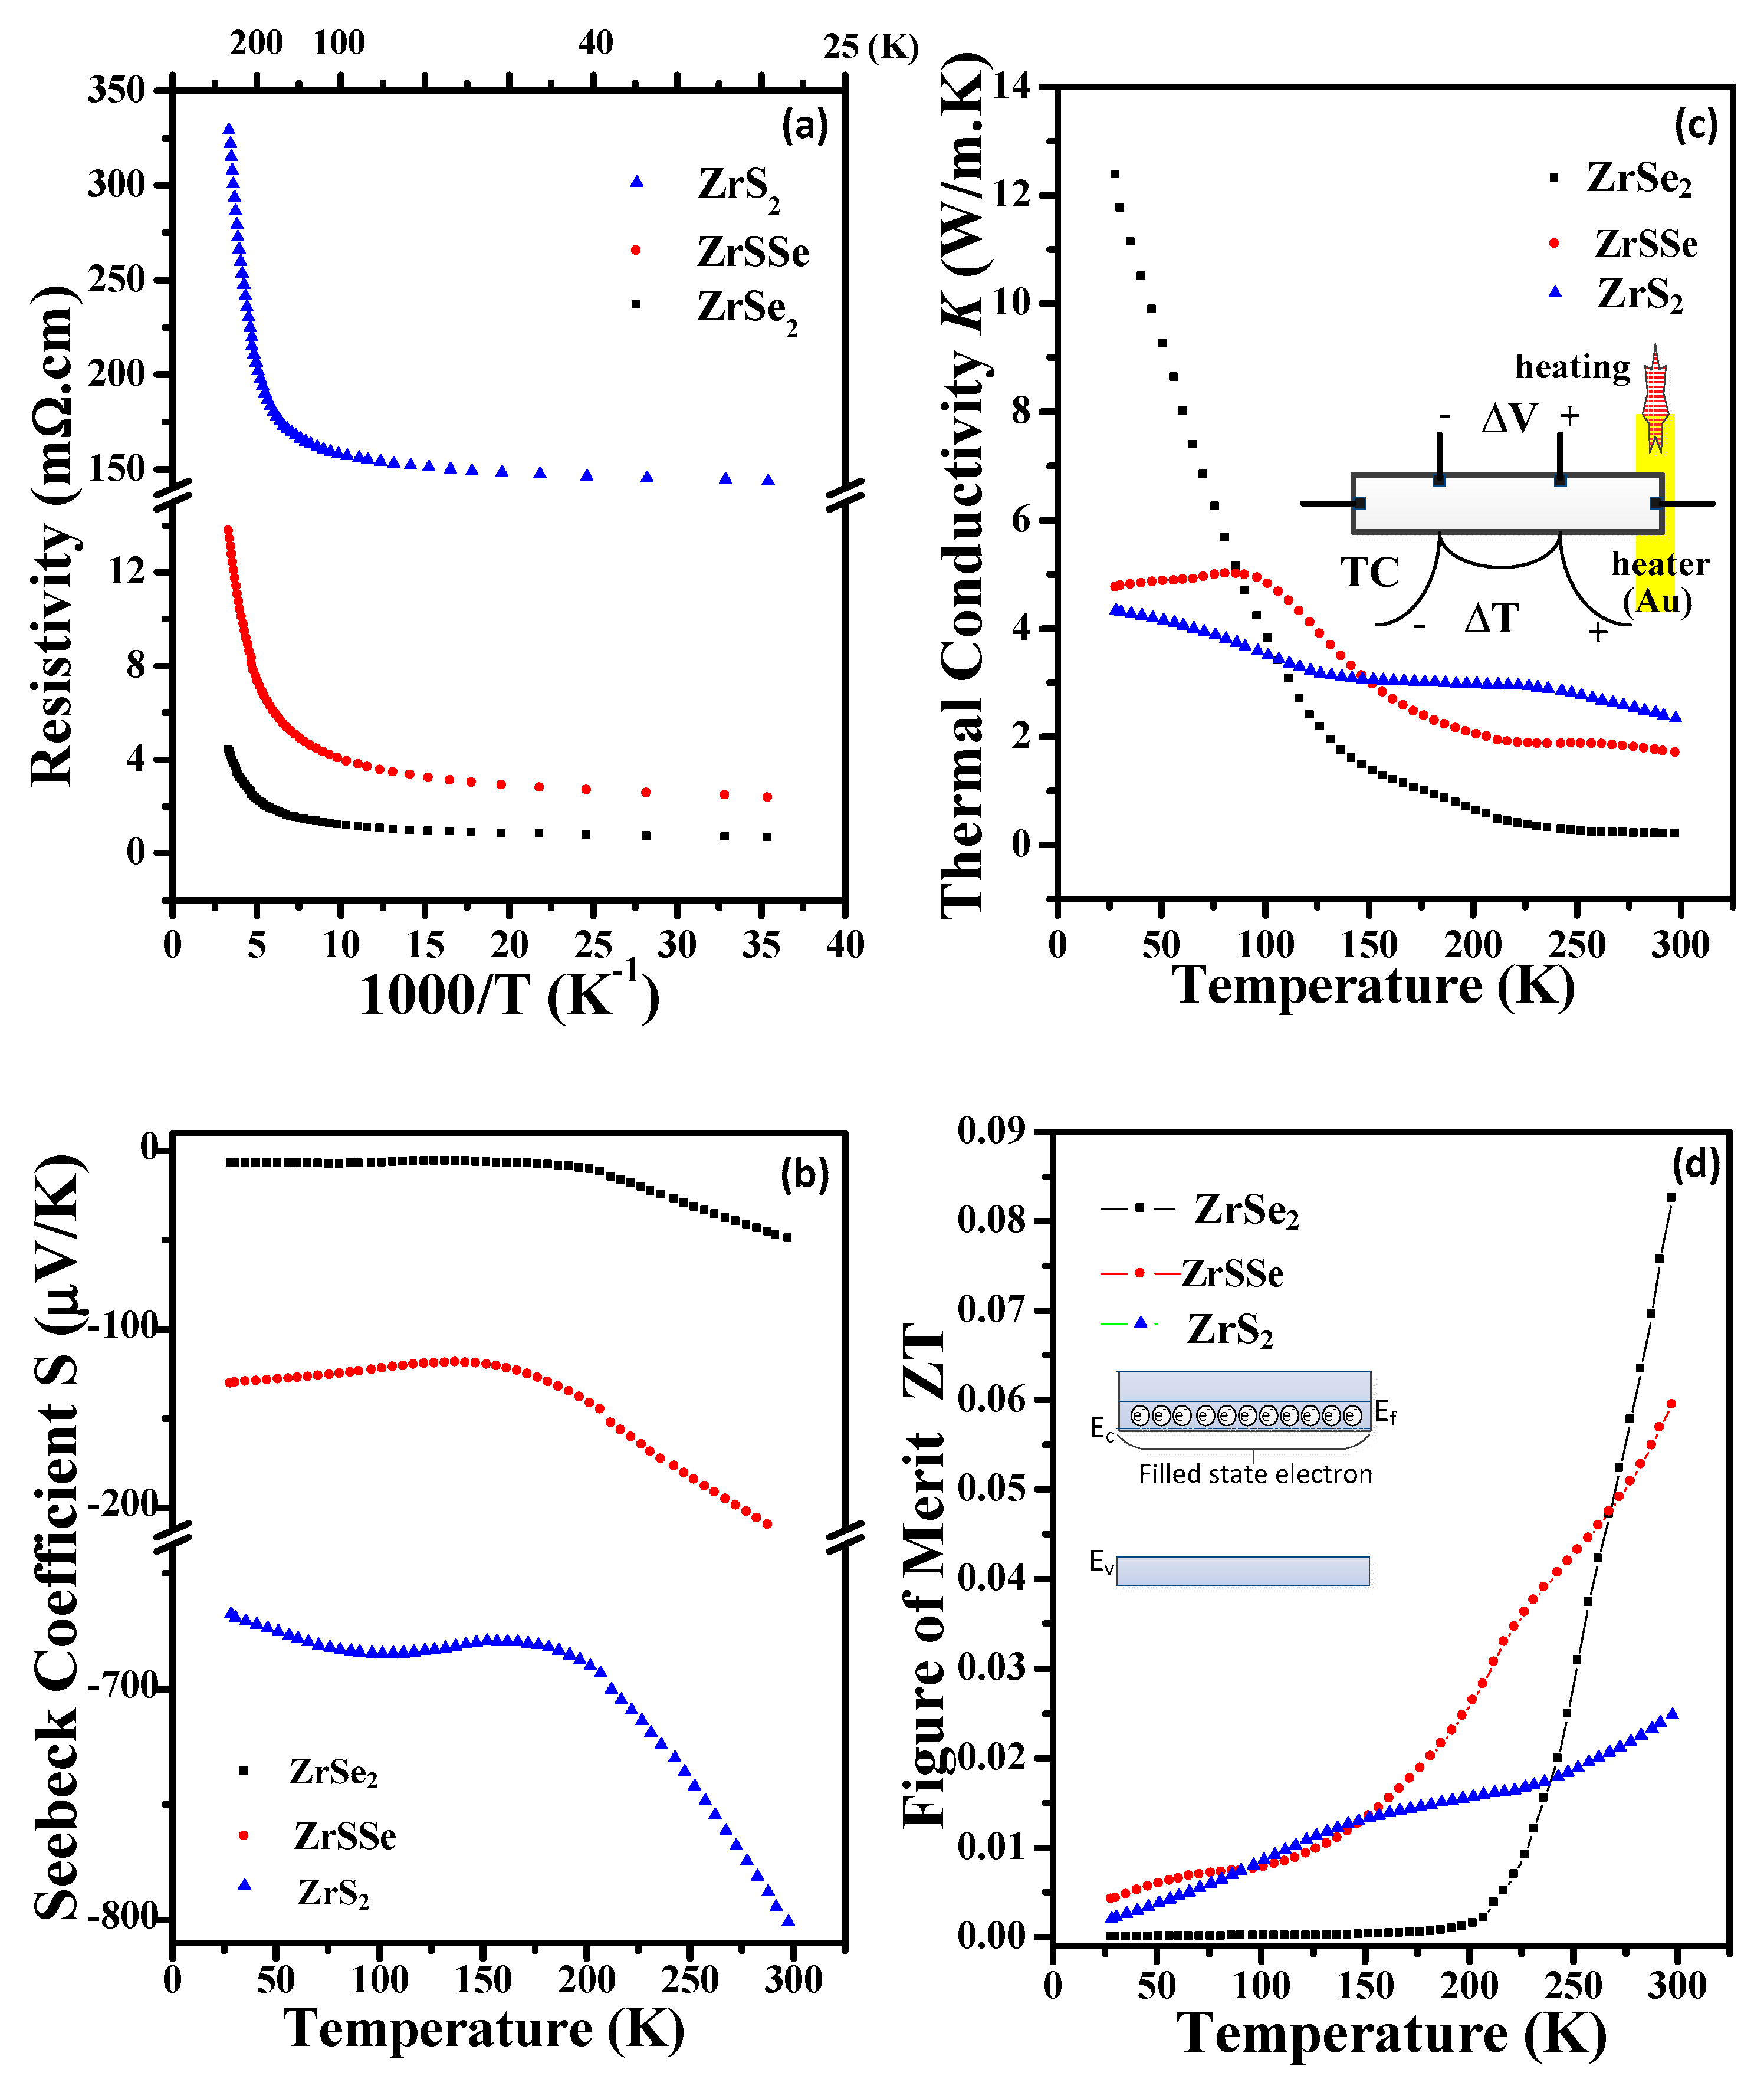
For the characterization of electrical and thermoelectric properties of ZrS2−xSex (x = 0, 1, and 2) series layer crystals, temperature-dependent resistivity and thermoelectric measurements from 20 to 300 K were carried out. Since many researchers have claimed that ZrX2 (X = S, Se) series displayed good thermoelectric properties, we measured the experimental result and compared with previous theoretical results [44,45] herein. The layered samples of ZrS2−xSex (x = 0, 1, and 2) crystals with dimension about 0.45 × 0.12 × 0.01 cm3 were prepared. Because the existence of defects, surface states, surface oxide (i.e., ZrX2−xOx, x = 0 to 2), etc., room-temperature resistivity and Hall-effect measurements of ZrS2−xSex (x = 0, 1, and 2) were also done to identify their electrical property. The results are listed in Table S2, for comparison. The carrier type of all the ZrX2 series was n type, and carrier concentrations were determined to be 4.05 × 1017 cm−3 for ZrS2, 1.6 × 1018 cm−3 for ZrSSe, and 2.9 × 1018 cm−3 for ZrSe2, respectively. The high carrier concentration also renders lower resistivity of 0.25 Ω-cm for ZrS2, 0.0211 Ω-cm for ZrSSe, and 0.0058 Ω-cm for ZrSe2, respectively. Figure 4a shows temperature dependent resistivity of ZrS2−xSex (x = 0, 1, and 2) series as a function of reciprocal temperature. The series shows metallic carrier-conduction behavior due to the increasing resistivity as the temperature increased. The lower resistivity of the ZrS2−xSex (x = 0, 1, and 2) series may come from heavily doping from defects, like chalcogen vacancies or native impurities, i.e., surface oxidation states in air (or from environment water vapor) [46], which cause the material to behave like a degenerate semiconductor, as the band scheme shown in the inset of Figure 4d. Dissimilar to the other 2D materials, like MoS2 and MoSe2, ZrS2−xSex (x = 0, 1, and 2) series exhibits relatively low resistivity owing to the surface states. The sign of Seebeck coefficient (S = −ΔV/ΔT) indicates all three ZrX2 compounds are n-type semiconductor as shown in Figure 4b. The carrier type is similar to that determined by Hall-effect measurement. The resistivity values of ZrS2−xSex (x = 0, 1, and 2) in Table S2 reveal reduction with the increase of Se content owing to the increased mobility and carrier concentration obtained by Hall measurement. This property may result in reduction of Seebeck coefficient of the high Se compound as displayed in Figure 4b. The Seebeck coefficient of ZrSe2 is about −50 μV/K at 300 K. The magnitude of S value is close to a previous ZrS3−3xSe3x compound [47]. The efficiency of a thermoelectric material is determined by a dimensionless figure of merit (ZT) defined as ZT = S2⋅T/(ρ⋅κ), where ρ, T, and κ, are electrical resistivity, absolute temperature, and thermal conductivity. Thermal conductivity κ can be calculated from the heating power and temperature difference ΔT from the sample geometry as P = κ⋅(w⋅t/l)⋅ΔT, where w is width, t is thickness, and l is length, respectively. The ZT is an index of efficient thermoelectric material, but ZT value is inversely proportional to thermal conductivity κ [48,49]. Figure 4d shows the ZT values of the ZrS2−xSex series from 20 to 300 K. The ZT values of all samples increase when the temperature is increased, while thermal conductivity κ decreases when the temperature is raised (see Figure 4c). At 300 K, the highest ZT value of 0.085 was achieved by ZrSe2, followed by ZrSSe of ZT = 0.06 and ZrS2 of ZT = 0.02, respectively. When the Se content increases, the mobility and electron concentration are also increased to promote thermoelectric performance in the ZrS2−xSex (x = 0, 1, and 2) series. The carrier concentration of ZrSe2 is close to ~1019 cm−3 in Table S2. The concentration value was claimed to be an optimum carrier density for achieving optimal ZT in the thermoelectric materials [50]. ZrSe2 is therefore shows the best thermoelectric performance in the ZrS2−xSex (x = 0, 1, and 2) series layered TMDCs.

4. Conclusions

In conclusion, ZrS2−xSex (x = 0, 1, and 2) crystals were successfully grown by CVT method. The structural, optical, and thermoelectric properties of the compounds were characterized. The HRTEM image, SAED, and XRD results confirmed the 1T-CdI2 structure. The ZrS2−xSex (x = 0, 1, and 2) series revealed an indirect band gap positioned at 1.78 eV, 1.32 eV, and 1.12 eV, respectively. The energy gap varies accordingly with Se composition change, which indicates the similar electronic and band structures of the layered ZrX2 (X = S, Se). A few layers of Raman spectra of ZrS2−xSex (x = 0, 1, and 2) were observed from 4 to 300 K. The frequencies of vibration modes decreased with the increase of Se content due to the heavier atomic weight of Se. All the layered ZrS2−xSex reveal chalcogen deficiency and existing native oxide (ZrX2−xOx) and surface states on their surface to render lower resistivity compared to the other 2D wide-gap TMDCs. Temperature-dependent resistivity shows degenerate semiconductor behavior of all ZrS2−xSex layer compounds, with ZrSe2 possessing the lowest resistivity. Along with Hall-effect measurement, ZrSe2 also shows higher mobility and higher electron concentration to promote carrier transport and thermoelectric performance in the layered ZrS2−xSex. At 300 K, the ZT is increased, and κ is decreased, with the increase of the Se content. An experimental value of ZT ≈ 0.085 is obtained for ZrSe2 owing its enhanced mobility and optimal carrier concentration in the ZrS2−xSex (x = 0, 1, and 2) series layered crystals.

Supplementary Materials

The following are available online at https://www.mdpi.com/2073-4352/10/4/327/s1, Figure S1: Crystal morphology of c-plane layered ZrS2−xSex (x = 0, 1, and 2). Figure S2: Energy Dispersive X-ray (EDX) analysis of ZrS2−xSex (x = 0, 1, and 2). Figure S3: Temperature-dependent Raman spectra of ZrS2, ZrSe2, and ZrSSe. Figure S4: The XPS spectra of (a) Zr 3d3/2 and Zr 3d 5/2, (b) S 2p3/2 and S 2p1/2, and (c) Se 3d5/2 and Se 3d3/2 in ZrS2−xSex (x = 0, 1, and 2). Table S1: The comparison of lattice constants of ZrS2−xSex obtained by XRD and TEM measurements. Table S2: Resistivity and Hall measurement results at 300 K.

Author Contributions

T.M.H. and C.-H.H. synthesized the compounds and grew the crystals. C.-H.H. conceives the research idea and designs & implements the thermoelectric-measurement system. T.M.H. did the optical and electrical measurements under the supervision of C.-H.H.; T.M.H. and C.-H.H. wrote the paper. All authors have read and agreed to the published version of the manuscript.

Funding

This research was funded by Ministry of Science and Technology, Taiwan under the grant numbers MOST108-2221-E-011-138-MY2 and MOST107-2112-M-011-001-MY3.

Acknowledgments

The authors would like to acknowledge the funding support from the Ministry of Science and Technology, Taiwan under the grant numbers MOST108-2221-E-011-138-MY2 and MOST107-2112-M-011-001-MY3.

Conflicts of Interest

The authors declare no conflict of interest.

References

  1. Wang, Q.H.; Kalantar-Zadeh, K.; Kis, A.; Coleman, J.N.; Strano, M.S. Electronics and Optoelectronics of Two-Dimensional Transition Metal Dichalcogenides. Nat. Nanotechnol. 2012, 7, 699–712. [Google Scholar] [CrossRef] [PubMed]
  2. Fang, H.; Chuang, S.; Chang, T.C.; Takei, K.; Takahashi, T.; Javey, A. High-Performance Single Layered WSe2 p-FETs with Chemically Doped Contacts. Nano Lett. 2012, 12, 3788–3792. [Google Scholar] [CrossRef] [PubMed] [Green Version]
  3. Ovchinnikov, D.; Gargiulo, F.; Allain, A.; Pasquier, D.J.; Dumcenco, D.; Ho, C.H.; Yazyev, O.V.; Kis, A. Disorder Engineering and Conductivity Dome in ReS2 with Electrolyte Gating. Nat. Commun. 2016, 7, 12391. [Google Scholar] [CrossRef] [PubMed]
  4. Ho, C.H.; Huang, C.E. Optical Property of the Near Band-Edge Transitions in Rhenium Disulfide and Diselenide. J. Alloys Compd. 2004, 383, 74–79. [Google Scholar] [CrossRef]
  5. Ho, C.H.; Yen, P.C.; Huang, Y.S.; Tiong, K.K. Photoreflectance Study of the Excitonic Transitions of Rhenium Disulphide Layer Compounds. Phys. Rev. B 2002, 66, 245207. [Google Scholar] [CrossRef]
  6. Wu, C.C.; Ho, C.H.; Shen, W.T.; Cheng, Z.H.; Huang, Y.S.; Tiong, K.K. Optical Properties of GaSe1−xSx Series Layered Semiconductors Grown by Vertical Bridgman Method. Mater. Chem. Phys. 2004, 88, 313–317. [Google Scholar] [CrossRef]
  7. Ho, C.H.; Wu, C.C.; Cheng, Z.H. Crystal Structure and Electronic Structure of GaSe1−xSx Series Layered Solids. J. Cryst. Growth 2005, 279, 321–328. [Google Scholar] [CrossRef]
  8. Ho, C.H. Thickness-Dependent Carrier Transport and Optically Enhanced Transconductance Gain in III-VI Multilayer InSe. 2D Mater. 2016, 3, 025019. [Google Scholar] [CrossRef]
  9. Ho, C.H.; Lee, H.W.; Wu, C.C. Polarization Sensitive Behaviour of the Band-Edge Transitions in ReS2 and ReSe2 Layered Semiconductors. J. Phys. Condens. Matter 2004, 16, 5937–5944. [Google Scholar] [CrossRef]
  10. Ho, C.H.; Huang, K.W. Visible Luminescence and Structural Property of GaSe1−xSx (0 ≤ x ≤ 1) Series Layered Crystals. Solid Stat. Commun. 2005, 136, 591–594. [Google Scholar] [CrossRef]
  11. Ho, C.H.; Chu, Y.J. Bending Photoluminescence and Surface Photovoltaic Effect on Multilayer InSe 2D Microplate Crystals. Adv. Opt. Mater. 2015, 3, 1570–1578. [Google Scholar] [CrossRef]
  12. Conroy, L.E.; Park, K.C. Electrical Properties of The Group IV Disulfides, Titanium disulfide, Zirconium Disulfide, Hafnium Disulfide and Tin Disulfide. Inorg. Chem. 1968, 7, 459–463. [Google Scholar] [CrossRef]
  13. Abdulsalam, M.; Joubert, D.P. Optical spectrum and excitons in bulk and monolayer MX2 (M = Zr, Hf; X = S, Se). Phys. Stat. Solidi B 2016, 253, 705. [Google Scholar] [CrossRef]
  14. Murray, R.B.; Bromley, R.A.; Yoffe, A.D. The Band Structures of Some Transition Metal Dichalcogenides. II. Group IVA; Octahedral Coordination. J. Phys. C Solid Stat. Phys. 1972, 5, 746–758. [Google Scholar] [CrossRef]
  15. Zhu, Y.; Wang, X.; Zhang, M.; Cai, C.; Xie, L. Thickness and Temperature Dependent Electrical Properties of ZrS2 Thin Films Directly Grown on Hexagonal Boron Nitride. Nano Res. 2016, 9, 2931–2937. [Google Scholar] [CrossRef]
  16. Wilson, J.A.; Yoffe, A.D. The Transition Metal Dichalcogenides Discussion and Interpretation of the Observed Optical, Electrical and Structural Properties. Adv. Phys. 1969, 18, 193–335. [Google Scholar] [CrossRef]
  17. Qin, D.; Ge, X.J.; Ding, G.; Lu, J.T. Strain-induced Thermoelectric Performance Enhancement of Monolayer ZrSe2. RSC Adv. 2017, 7, 47243–47250. [Google Scholar] [CrossRef] [Green Version]
  18. Ellis, J.K.; Lucero, M.J.; Scuseria, G.E. The indirect to direct band gap transition in multilayered MoS2 as predicted by screened hybrid density functional theory. Appl. Phys. Lett. 2011, 99, 261908. [Google Scholar] [CrossRef]
  19. Li, Y.; Kang, J.; Li, J. Indirect-to-direct band gap transition of the ZrS2 monolayer by strain: First-principles calculations. RSC Adv. 2014, 4, 7396. [Google Scholar] [CrossRef]
  20. Lv, H.Y.; Lu, W.J.; Shao, D.F.; Lu, H.Y.; Sun, Y.P. Strain-induced Enhancement in The Thermoelectric Performance of a ZrS2 Monolayer. J. Mater. Chem. C 2016, 4, 4538–4545. [Google Scholar] [CrossRef] [Green Version]
  21. Khan, F.; Din, H.U.; Khan, S.A.; Rehman, G.; Bilal, M.; Nguyen, C.V.; Ahmad, I.; Gan, L.Y.; Amin, B. Theoretical Investigation of Electronic Structure and Thermoelectric Properties of MX2 (M = Zr, Hf; X = S, Se) van der Waals Heterostructures. J. Phys. Chem. Solids 2019, 126, 304–309. [Google Scholar] [CrossRef]
  22. Hou, B.; Jung, S.H.; Zhang, J.; Hong, Y.; Kim, B.S.; Sohn, J.I.; Lee, E.K.; Choi, B.L.; Whang, D.; Cha, S.; et al. Growth of Quantum Dot Coated Core-Shell Anisotropic Nanowires for Improved Thermal and Electronic Transport. Appl. Phys. Lett. 2019, 114, 243104. [Google Scholar] [CrossRef]
  23. Yazdani, S.; Pettes, M.T. Nanoscale Self-Assembly of Thermoelectric Materials: A Review of Chemistry-Based Approaches. Nanotechnology 2018, 29, 432001. [Google Scholar] [CrossRef] [PubMed]
  24. Sadia, Y.; Aminov, Z.; Mogilyansky, D.; Gelbstein, Y. Texture anisotropy of higher manganese silicide following arc-melting and hot-pressing. Intermetallics 2016, 68, 71–77. [Google Scholar] [CrossRef]
  25. Gelbstein, Y. Pb1−xSnxTe Alloys—Application Considerations. J. Electron. Mater. 2011, 40, 533–536. [Google Scholar] [CrossRef]
  26. Xing, Y. High-efficiency half-Heusler thermoelectric modules enabled by self-propagating synthesis and topologic structure optimization. Energy Environ. Sci. 2019, 12, 3390–3399. [Google Scholar] [CrossRef]
  27. Rull-Bravo, M.; Moure, A.; Fernandez, J.F.; Mart’ın-Gonz´alez, M. Skutterudites as thermoelectric materials: Revisited. RSC Adv. 2015, 5, 41653–41667. [Google Scholar] [CrossRef]
  28. Ho, C.H. Optical Study of The Structural Change in ReS2 Single Crystals Using Polarized Thermoreflectance Spectroscopy. Opt. Express 2005, 13, 8–19. [Google Scholar] [CrossRef]
  29. Patel, S.G.; Agarwal, M.K.; Batra, N.M.; Lakshminarayana, D. Electrical Properties of Zirconium Diselenide Single Crystals Grown by Iodine Transport Method. Bull. Mater. Sci. 1998, 21, 213–217. [Google Scholar] [CrossRef]
  30. Golub, A.S.; Zubavichus, Y.V.; Slovokhotov, Y.L.; Novikov, Y.N. Single-Layer Dispersions of Transition Metal Dichalcogenides in The Synthesis of Intercalation Compounds. Russ. Chem. Rev. 2003, 72, 123–141. [Google Scholar] [CrossRef]
  31. Dasadia, A.K.; Nariya, B.B.; Jani, A.R. Growth and Structure Determination of ZrSTe—A New Ternary Phase of Transition Metal Chalcogenides. J. Cryst. Growth 2015, 426, 265–269. [Google Scholar] [CrossRef]
  32. Roubi, L.; Carlone, C. Resonance Raman Spectrum of HfS2 and ZrS2. Phys. Rev. B 1988, 37, 6808–6812. [Google Scholar] [CrossRef] [PubMed]
  33. Mañas-Valero, S.; García-López, V. Raman Spectra of ZrS2 and ZrSe2 from Bulk to Atomically Thin Layers. Appl. Sci. 2016, 6, 264. [Google Scholar] [CrossRef] [Green Version]
  34. Yan, R.; Simpson, J.R.; Bertolazzi, S.; Brivio, J.; Watson, M.; Wu, X.; Kis, A.; Luo, T.; Hight Walker, A.R.; Xing, H.G. Thermal Conductivity of Monolayer Molybdenum Disulfide Obtained from Temperature-Dependent Raman Spectroscopy. ACS Nano 2014, 8, 986–993. [Google Scholar] [CrossRef]
  35. Ho, C.H.; Huang, Y.S.; Tiong, K.K.; Liao, P.C. Absorption-Edge Anisotropy in ReS2 and ReSe2 Layered Semiconductors. Phys. Rev. B 1998, 58, 16130–16135. [Google Scholar] [CrossRef]
  36. Ho, C.H.; Tseng, C.Y.; Tien, L.C. Thermoreflectance Characterization of β-Ga2O3 Thin-Film Nanostrips. Opt. Express 2010, 18, 16360–16369. [Google Scholar] [CrossRef]
  37. Ho, C.H.; Chen, H.H. Optically Decomposed Near-Band-Edge Structure and Excitonic Transitions in Ga2S3. Sci. Rep. 2014, 4, 6143. [Google Scholar] [CrossRef] [Green Version]
  38. Ho, C.H.; Chan, C.H.; Tien, L.C.; Huang, Y.S. Direct Optical Observation of Band-Edge Excitons, Band Gap, and Fermi Level in Degenerate Semiconducting Oxide Nanowires In2O3. J. Phys. Chem. C 2011, 115, 25088–25096. [Google Scholar] [CrossRef]
  39. Ho, C.H.; Wang, Y.P.; Chan, C.H.; Huang, Y.S.; Li, C.H. Temperature-Dependent Photoconductivity in β-In2S3 Single Crystals. J. Appl. Phys. 2010, 108, 043518. [Google Scholar] [CrossRef]
  40. Moustafa, M.; Wasnick, A.; Janowitz, C.; Manzke, R. Temperature Shift of the Absorption Edge and Urbach Tail of ZrSxSe2x Single Crystals. Phys. Rev. B 2017, 95, 245207. [Google Scholar] [CrossRef]
  41. Greenaway, D.L.; Nitsche, R. Preparation and Optical Properties of Group IV-VI2 Chalcogenides Having The CdI2 Structure. J. Phys. Chem. Solid. 1965, 26, 1445–1458. [Google Scholar] [CrossRef]
  42. Moustafa, M.; Zandt, T.; Janowitz, C.; Manzke, R. Growth and Band Gap Determination of the ZrSxSe2−x Single Cystal Series. Phys. Rev. B 2009, 80, 035206. [Google Scholar] [CrossRef]
  43. Kolobov, A.V.; Tominaga, J. In Two Dimensional Transition Metal Dichalcogenides. Mater. Sci. 2016, 239, 17–23. [Google Scholar]
  44. Ghafari, A.; Janowitz, C. Electronic and Thermoelectric Properties of ZrSxSe2−x. Comput. Mater. Sci. 2019, 169, 109109. [Google Scholar] [CrossRef]
  45. Yumnam, G.; Pandey, T.; Singh, A.K. High Temperature Thermoelectric Properties of Zr and Hf Based Transition Metal Dichalcogenides: A First Principles Study. J. Chem. Phys. 2015, 143, 234704. [Google Scholar] [CrossRef] [Green Version]
  46. Mleczko, M.J.; Zhang, C.; Lee, H.R.; Kuo, H.H.; Magyari-Köpe, B.; Moore, R.G.; Shen, Z.X.; Fisher, I.R.; Nishi, Y.; Pop, E. HfSe2 and ZrSe2: Two-Dimensional Semiconductors with Native High-k Oxides. Sci. Adv. 2017, 3, e1700481. [Google Scholar] [CrossRef] [Green Version]
  47. Patel, K.R. Thermoelectric Power Measurements of Zirconium Sulphoselenide Single Crystals. Int. J. Phys. Math. Sci. 2012, 2, 74–85. [Google Scholar]
  48. Guo, S.D.; Li, Y.F.; Guo, X.S. Predicted Janus Monolayer ZrSSe with Enhanced n-type Thermoelectric Properties Compared with Monolayer ZrS2. Comput. Mater. Sci. 2019, 161, 16–23. [Google Scholar] [CrossRef]
  49. Ho, C.H. The Study of Structure, Thermoelectric and Photoelectric Properties of Layered Tin Monochalcogenides SnX (X = S, Se) for Energy Application. ACS Appl. Energy Mater. 2020, 3. [Google Scholar] [CrossRef]
  50. Ding, G.; Gao, G.Y.; Huang, Z.; Zhang, W.; Yao, K. Thermoelectric Properties of Monolayer MSe2 (M = Zr, Hf): Low Lattice Thermal Conductivity and A Promising Figure of Merit. Nanotechnology 2016, 27, 375703. [Google Scholar] [CrossRef]
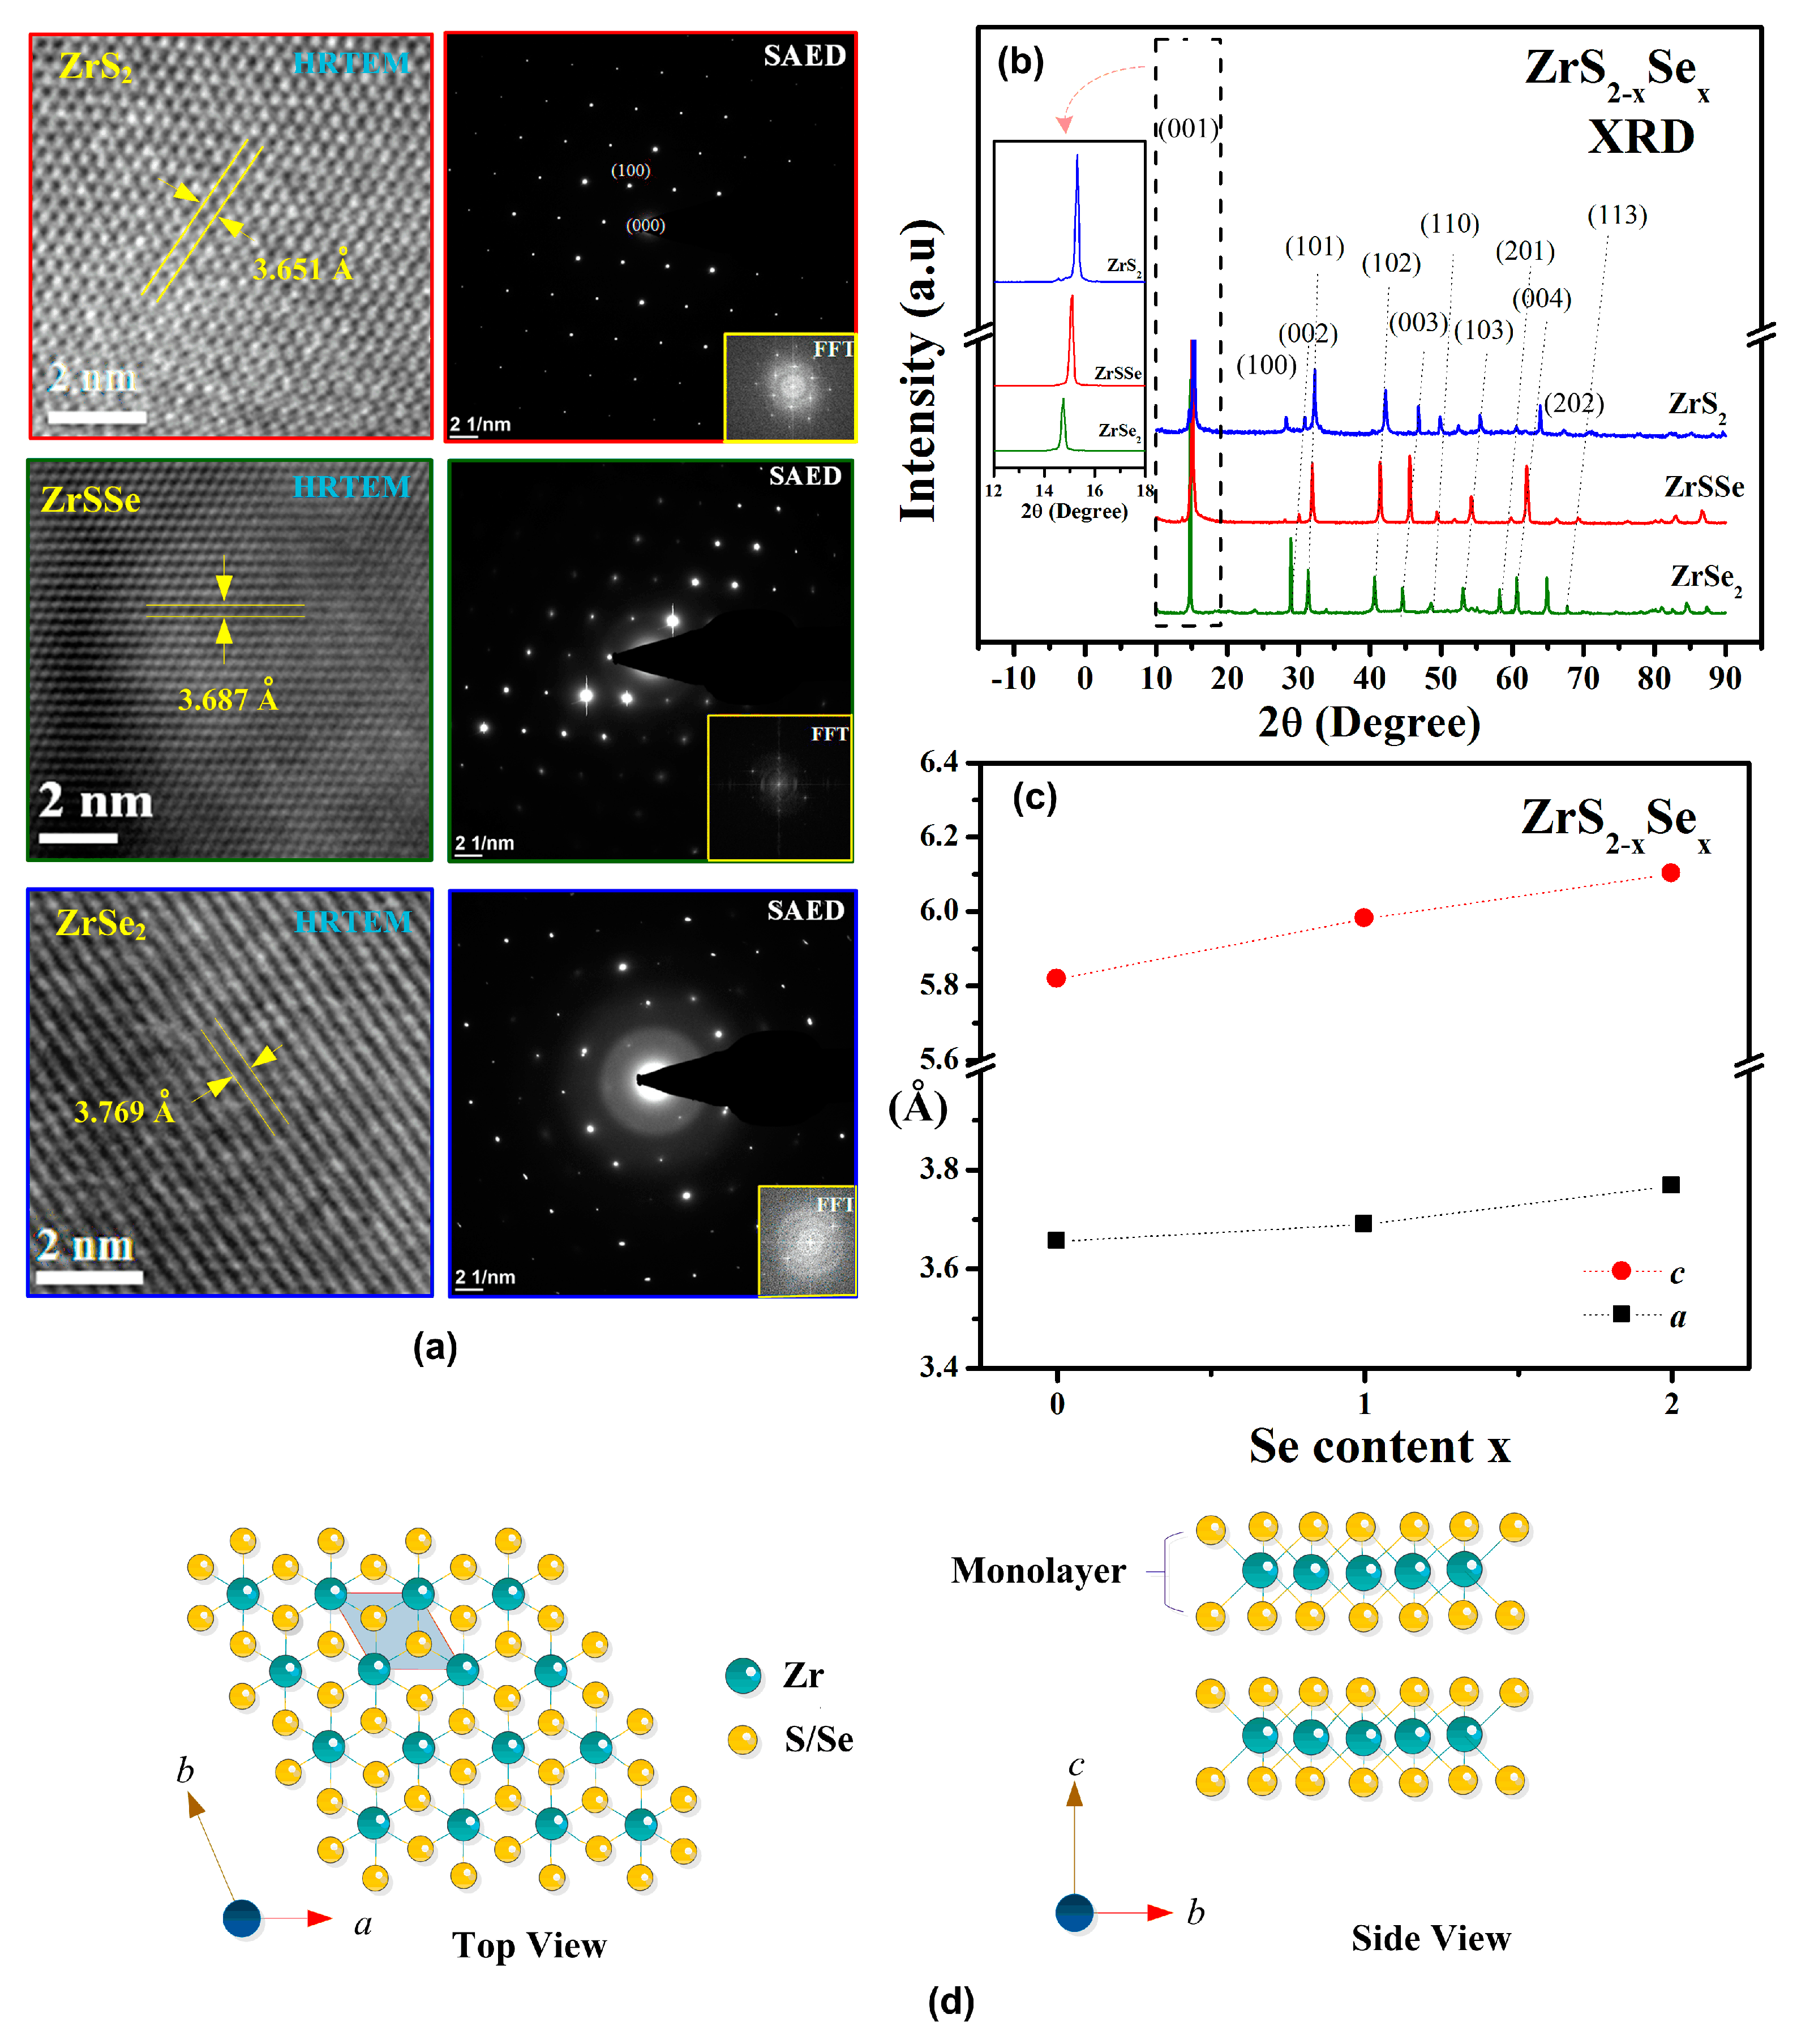
Figure 1. (a) High-resolution transmission electron microscope (HRTEM) results, selected-area-electron-diffraction (SAED), and FFT images of ZrS2, ZrSSe, and ZrSe2. (b) XRD pattern of ZrS2−xSex (x = 0, 1, and 2). (c) Selenium doping effect on the variation of lattice constants a and c. (d) Atomic arrangements of layered ZrX2 (X = S, Se) observed from top view and side view.
Crystals 10 00327 g001
Figure 2. Raman spectra of ZrS2−xSex (x = 0, 1, and 2) at (a) 300 K and (b) 4 K. (c) The illustration of atomic movements of vibrational modes. (d) Raman frequency of A1g mode as a function of temperature in ZrS2−xSex (x = 0, 1, and 2).
Crystals 10 00327 g002
Figure 3. (a) Transmittance spectra of ZrS2−xSex (x = 0, 1, and 2) at 300 K. (b) Plot of (αhν)1/2 versus hν for the analysis of indirect gaps of ZrS2−xSex (x = 0, 1, and 2) at 300 K. (c) Valence-band XPS spectra of ZrS2−xSex (x = 0, 1, and 2) compounds.
Crystals 10 00327 g003
Figure 4. (a) Resistivity as function of reciprocal temperature. (b) Seebeck coefficient of ZrS2−xSex (x = 0, 1, and 2) as function of temperature. (c) Thermal conductivity as function of temperature of ZrS2−xSex (x = 0, 1, and 2). The inset shows the experimental configuration of thermoelectric measurement. (d) The dependences of ZT values (figure of merit) versus temperature.
Crystals 10 00327 g004