Abstract
Cu-Ce(Mn)-Al oxide catalysts to NO removal in the broad temperature range were synthesized and tested. The precursor of copper aluminium spinel was obtained with the coprecipitation method. By this method, Cu–Al spinels with various amounts of manganese and cerium were synthesized as well. These oxides crystallized in the structure of inverse spinel; however, Ce doping caused the appearance of additional CeO2 phase as determined by XRD. The samples were mesoporous solids with moderate surface area and porosity measured by low temperature sorption of nitrogen. The addition of another metal to Cu–Al spinel caused an increase of activity in selective catalytic reduction of nitrogen oxide with ammonia. The presence of manganese caused the formation of a higher amount of N2O by-product. The catalytic activity increased with the cerium concentration. For the sample with the atomic ratio Ce0.15Cu0.18, ca. 90% of NO conversion was registered between 200 and 350 °C. As examined with XPS spectroscopy, such conversion was attained due to the good dispersion of copper on the catalyst surface. This copper was placed mainly in spinel octahedral positions which enable its easier reduction. The spinel structure causes the presence of cerium as the trivalent cation important in redox cycles with the participation of copper.
1. Introduction
Nitrogen oxides (NOx) are one of the main air pollutants that form during fuel burning. Their Selective Catalytic Reduction (SCR) with ammonia is applied to remove them from off-gases from the stationary sources of emission [1]. During this process, nitrogen and water are expected products like in the following reactions:
4NO + 4NH3 +O2 → 4N2 + 6H2O,
6NO + 4NH3 → 5N2 + 6H2O.
Unfortunately, nitrous oxide is often formed as well, according to the reaction equations:
3NO → N2O + NO2,
2NH3 + 2O2 → N2O + 3H2O,
4NO + 4NH3 + 3O2 → 4N2O+ 6H2O,
4NO2 + 4NH3 +O2 → 4N2O + 6H2O.
This greenhouse gas influences the global warming about 300 hundred times stronger than carbon dioxide. Its lifetime in atmosphere is ca. 180 years and can be decomposed only in the stratosphere according to the reaction equation:
N2O + O3 → 2NO + O2 → 2NO2.
Ozone is taken from the ozone layer damaging Earth’s protection [2]. The amount of nitrous oxide emitted from anthropogenic sources has increased and now is assessed as 40% of total N2O emission [3]. Therefore, in order to design catalysts for SCR of NOx, it is important to remember their high selectivity to avoid forming this by-product. Such catalysts can be obtained by the deposition of an active phase on a support or by its coprecipitation with metal ions improving its properties.
Coprecipitation is regarded as a simple synthesis method of industrial catalysts [4]. The oxide catalysts obtained by this method turned out to be efficient in SCR of NOx due to the good dispersion of an active phase, its high concentration [5], as well as a strong interaction between active metals [6]. In such systems, aluminum oxide has often been the dispersive phase. Moreover, its acidic properties also improve resistance to sulfur poisoning [6]. The aluminum oxide often crystallizes with other metals in the spinel structure [5,7]. It was suggested that the spinel structure can be responsible for the high catalytic activity of copper–aluminum oxide systems in SCR of NO [7]. It is related to the large adsorption of NO due to the high number of oxygen vacancies [1,6]. The spinel composition can be designed in such a way to obtain the catalyst active in a broad temperature range of 100–400 °C [8]. In automotive catalysts, the alumina support is promoted with ceria, which can store oxygen, develop their surface area, and improve thermal stability. The key factor in the CeO2 efficiency is its dispersion [4]. The lattice oxygen of ceria takes part in the oxidation reaction, and the reduced oxide is reoxidized by NO or N2O with the formation of nitrogen without N2O production [1]. CeO2 inhibits also the formation of NH species, which are intermediates of N2O [6]. Cerium and copper can form a redox system which inhibits SO2 oxidation or can form sulfates protecting the active copper centers and can accelerate its decomposition as well [6]. Ceria also inhibits the formation of ammonium nitrate and protects the catalyst from the alkali poisoning providing the Lewis acid sites for NH3 activation [6].
The aim of the presented paper was to obtain a copper aluminum spinel catalyst and then to modify its catalytic properties by substituting a part of copper by cerium and/or manganese. The relationship between the sample catalytic activity in SCR of NO with ammonia and the amount of cerium was examined. Factors determining the catalytic activity were identified by a physicochemical characterization of solids.
2. Results and Discussion
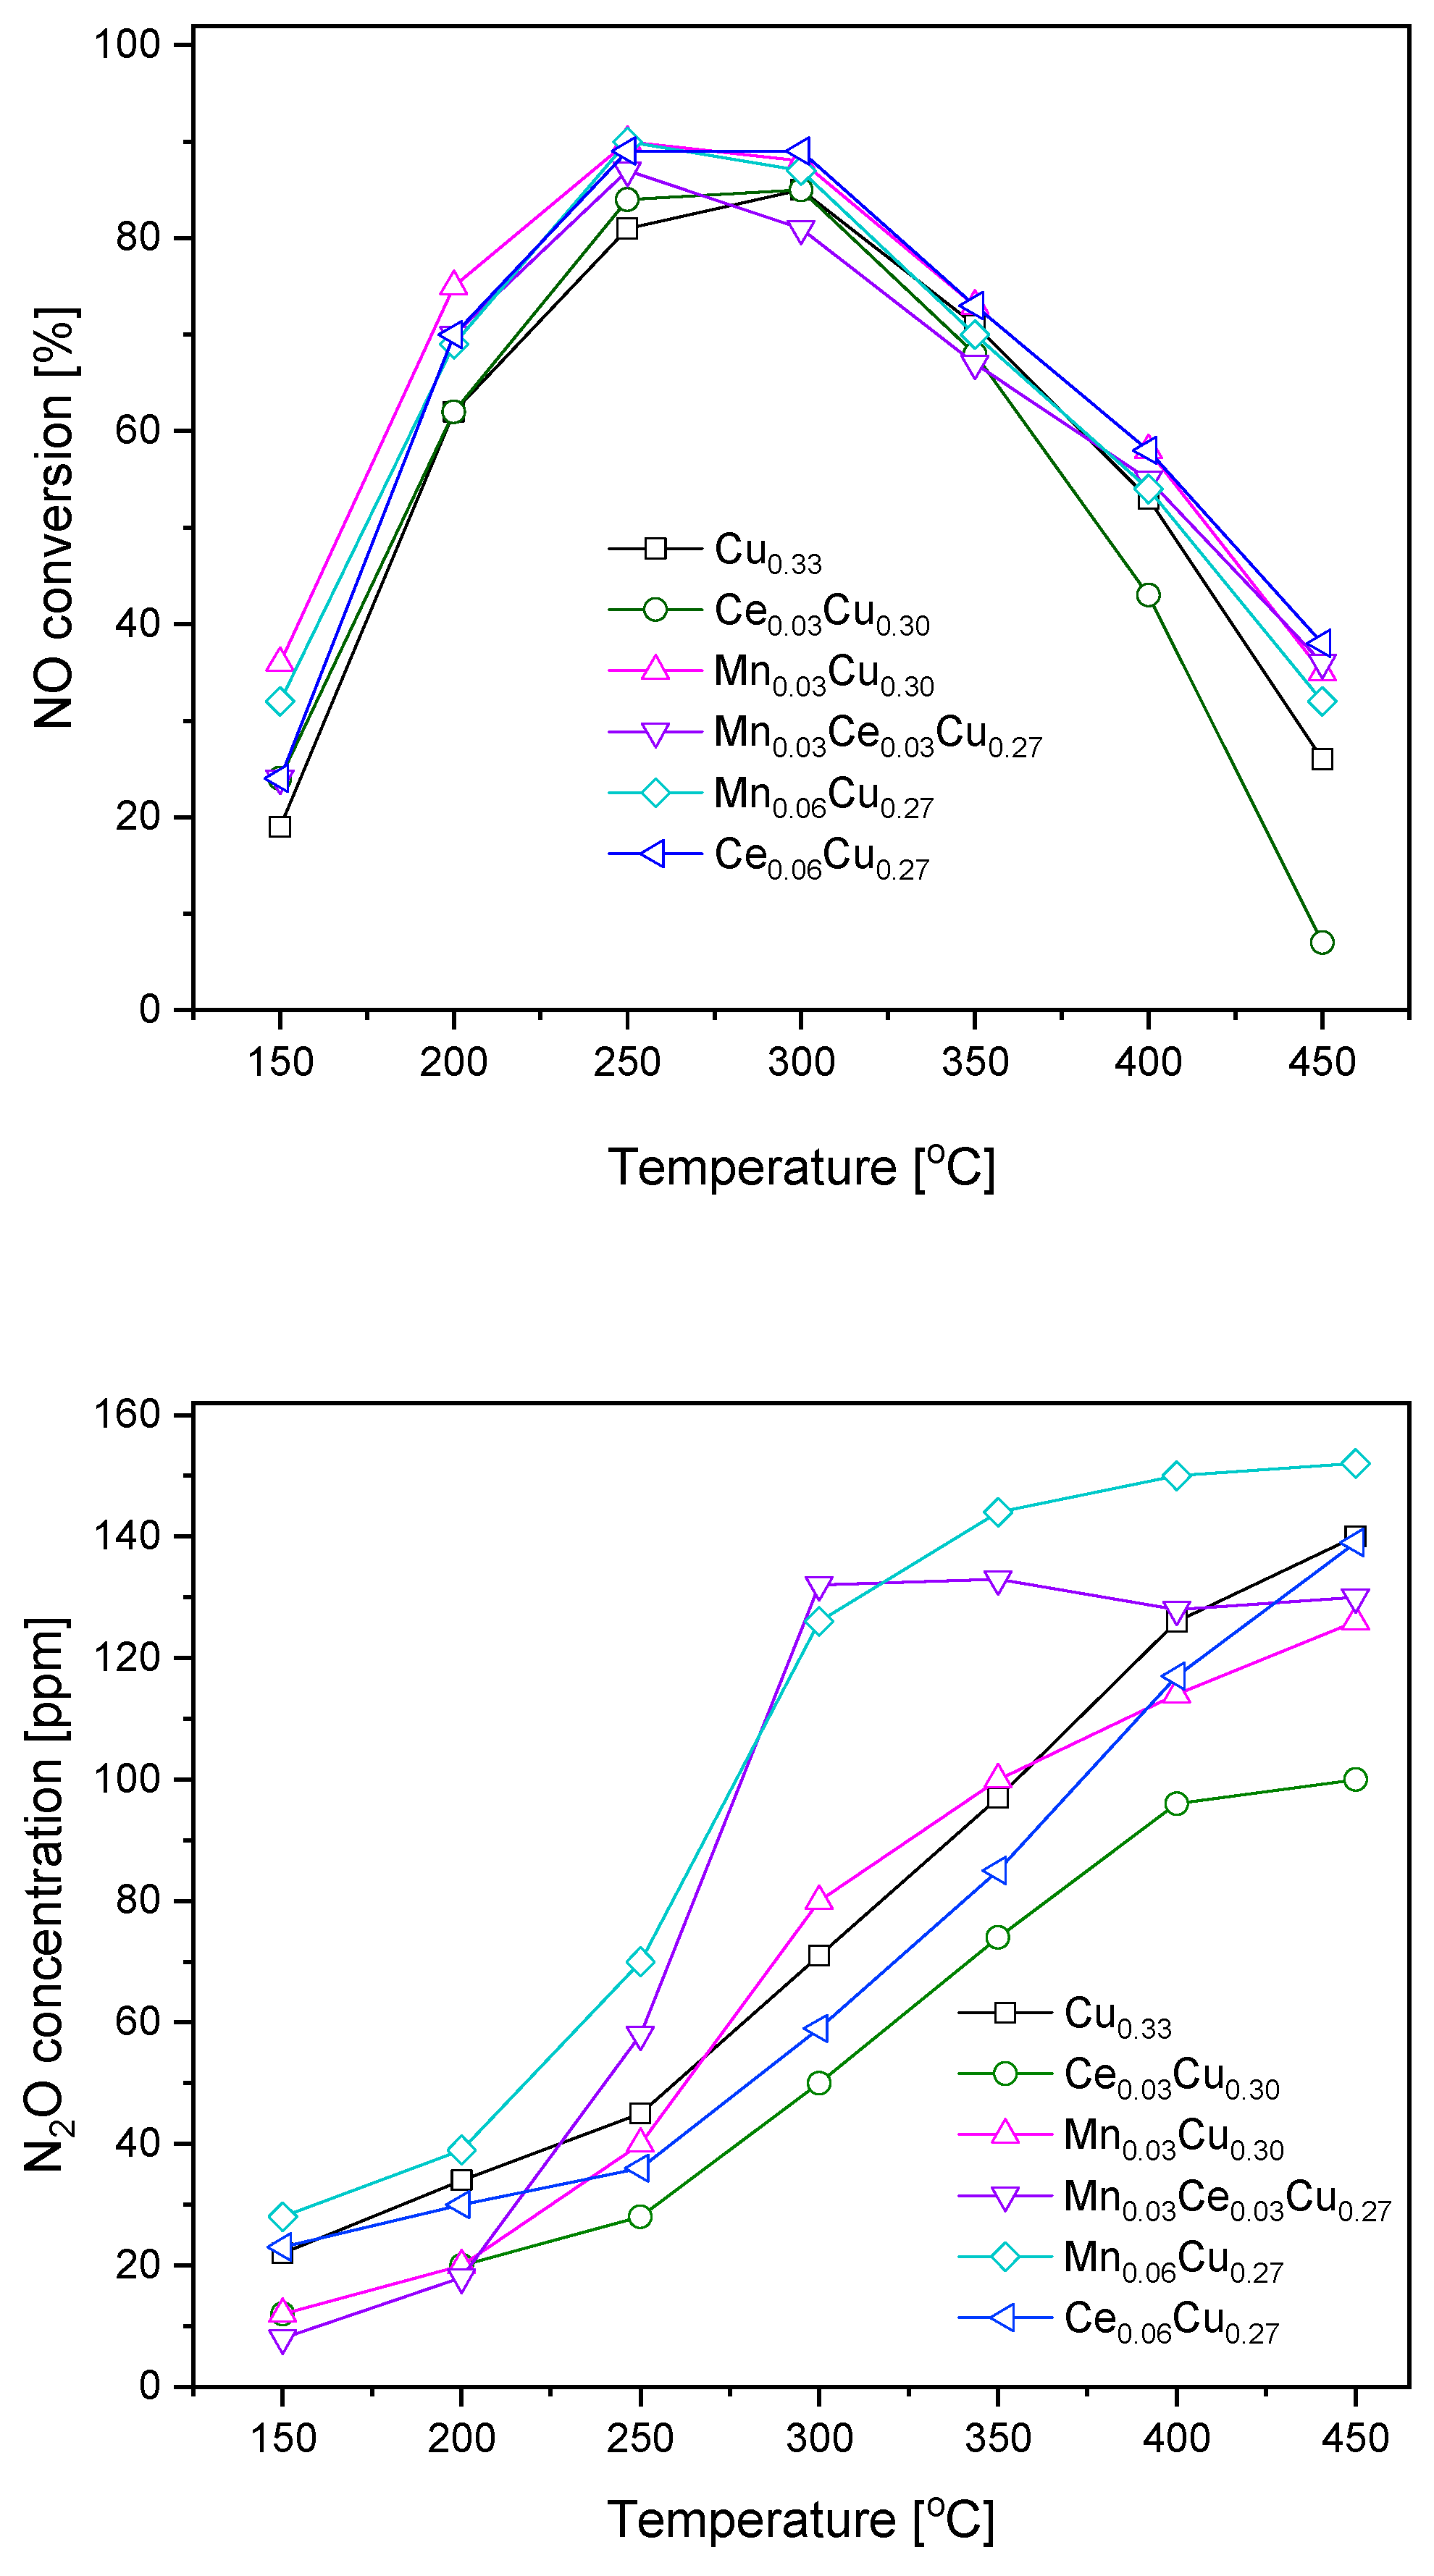
Obtained copper–aluminium oxide and its derivatives doped with cerium and manganese (0.03 and 0.06 atomic ratio) were subjected to catalytic tests in SCR of NO with ammonia (Figure 1). For all samples, the NO conversion was in the range 20–40% at 150 °C, attained its maximum at 250 or 300 °C, and decreased below 40% at 450 °C. Over the Cu0.33 sample, the maximum of NO conversion of ca. 85% was observed at 300 °C. The replacement of copper by cerium in the Ce0.03Cu0.30 sample caused a slight increase in the catalytic efficiency at lower temperatures (150–250 °C) and a more distinct decrease above 400 °C. The analogous substitution with manganese brought about an increase in NO conversion in the whole temperature range. The mixed Mn0.03Ce0.03Cu0.27 sample was less efficient than that with manganese but slightly better than with cerium one, particularly at higher temperatures of 400–450 °C. The increase in manganese content did not strengthen the catalytic efficiency. In contrast, the same increase in the cerium concentration caused improvement in the catalyst activity making the Ce0.06Cu0.27 sample only slightly less active than the Mn0.03Cu0.30 sample at low temperatures of 150–200 °C.
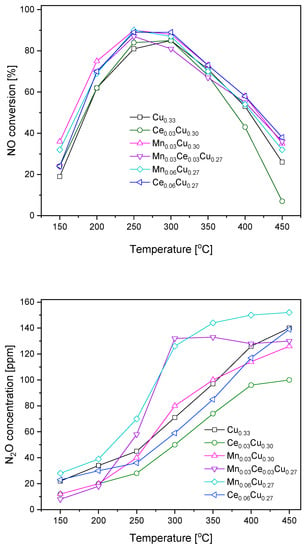
Figure 1.
NO conversion and N2O formation over Cu–Al catalysts doped with manganese and cerium.
During the catalytic tests, the concentration of N2O forming the undesired by-product was measured as well (Figure 1). Over the undoped catalyst, the concentration of N2O achieved 45 ppm at 250 °C and started to rise more rapidly above this temperature reaching a level of 140 ppm at 450 °C. The admixture of Ce resulted in significant lowering of N2O formation, namely, at 300 °C, the N2O concentration exceeded the detection limit of 30 ppm and reached 100 ppm at 450 °C. In the temperature range of 300–350 °C, the presence of manganese increased the formation of by-product in comparison to the Cu0.33 sample; however, at higher temperatures (400–450 °C), the opposite was true. The equimolar Ce0.03Mn0.03Cu0.27 catalyst caused the formation of 60 ppm of nitrous oxide at 250 °C, while above 300 °C, the concentration of N2O was constant at the level of 130 ppm. The increase of the Mn amount resulted in the highest N2O concentration in the whole temperature range. In the case of higher cerium content, the amount of N2O formed was about 10 ppm higher than over the Ce0.03Cu0.30 sample up to 350 °C.
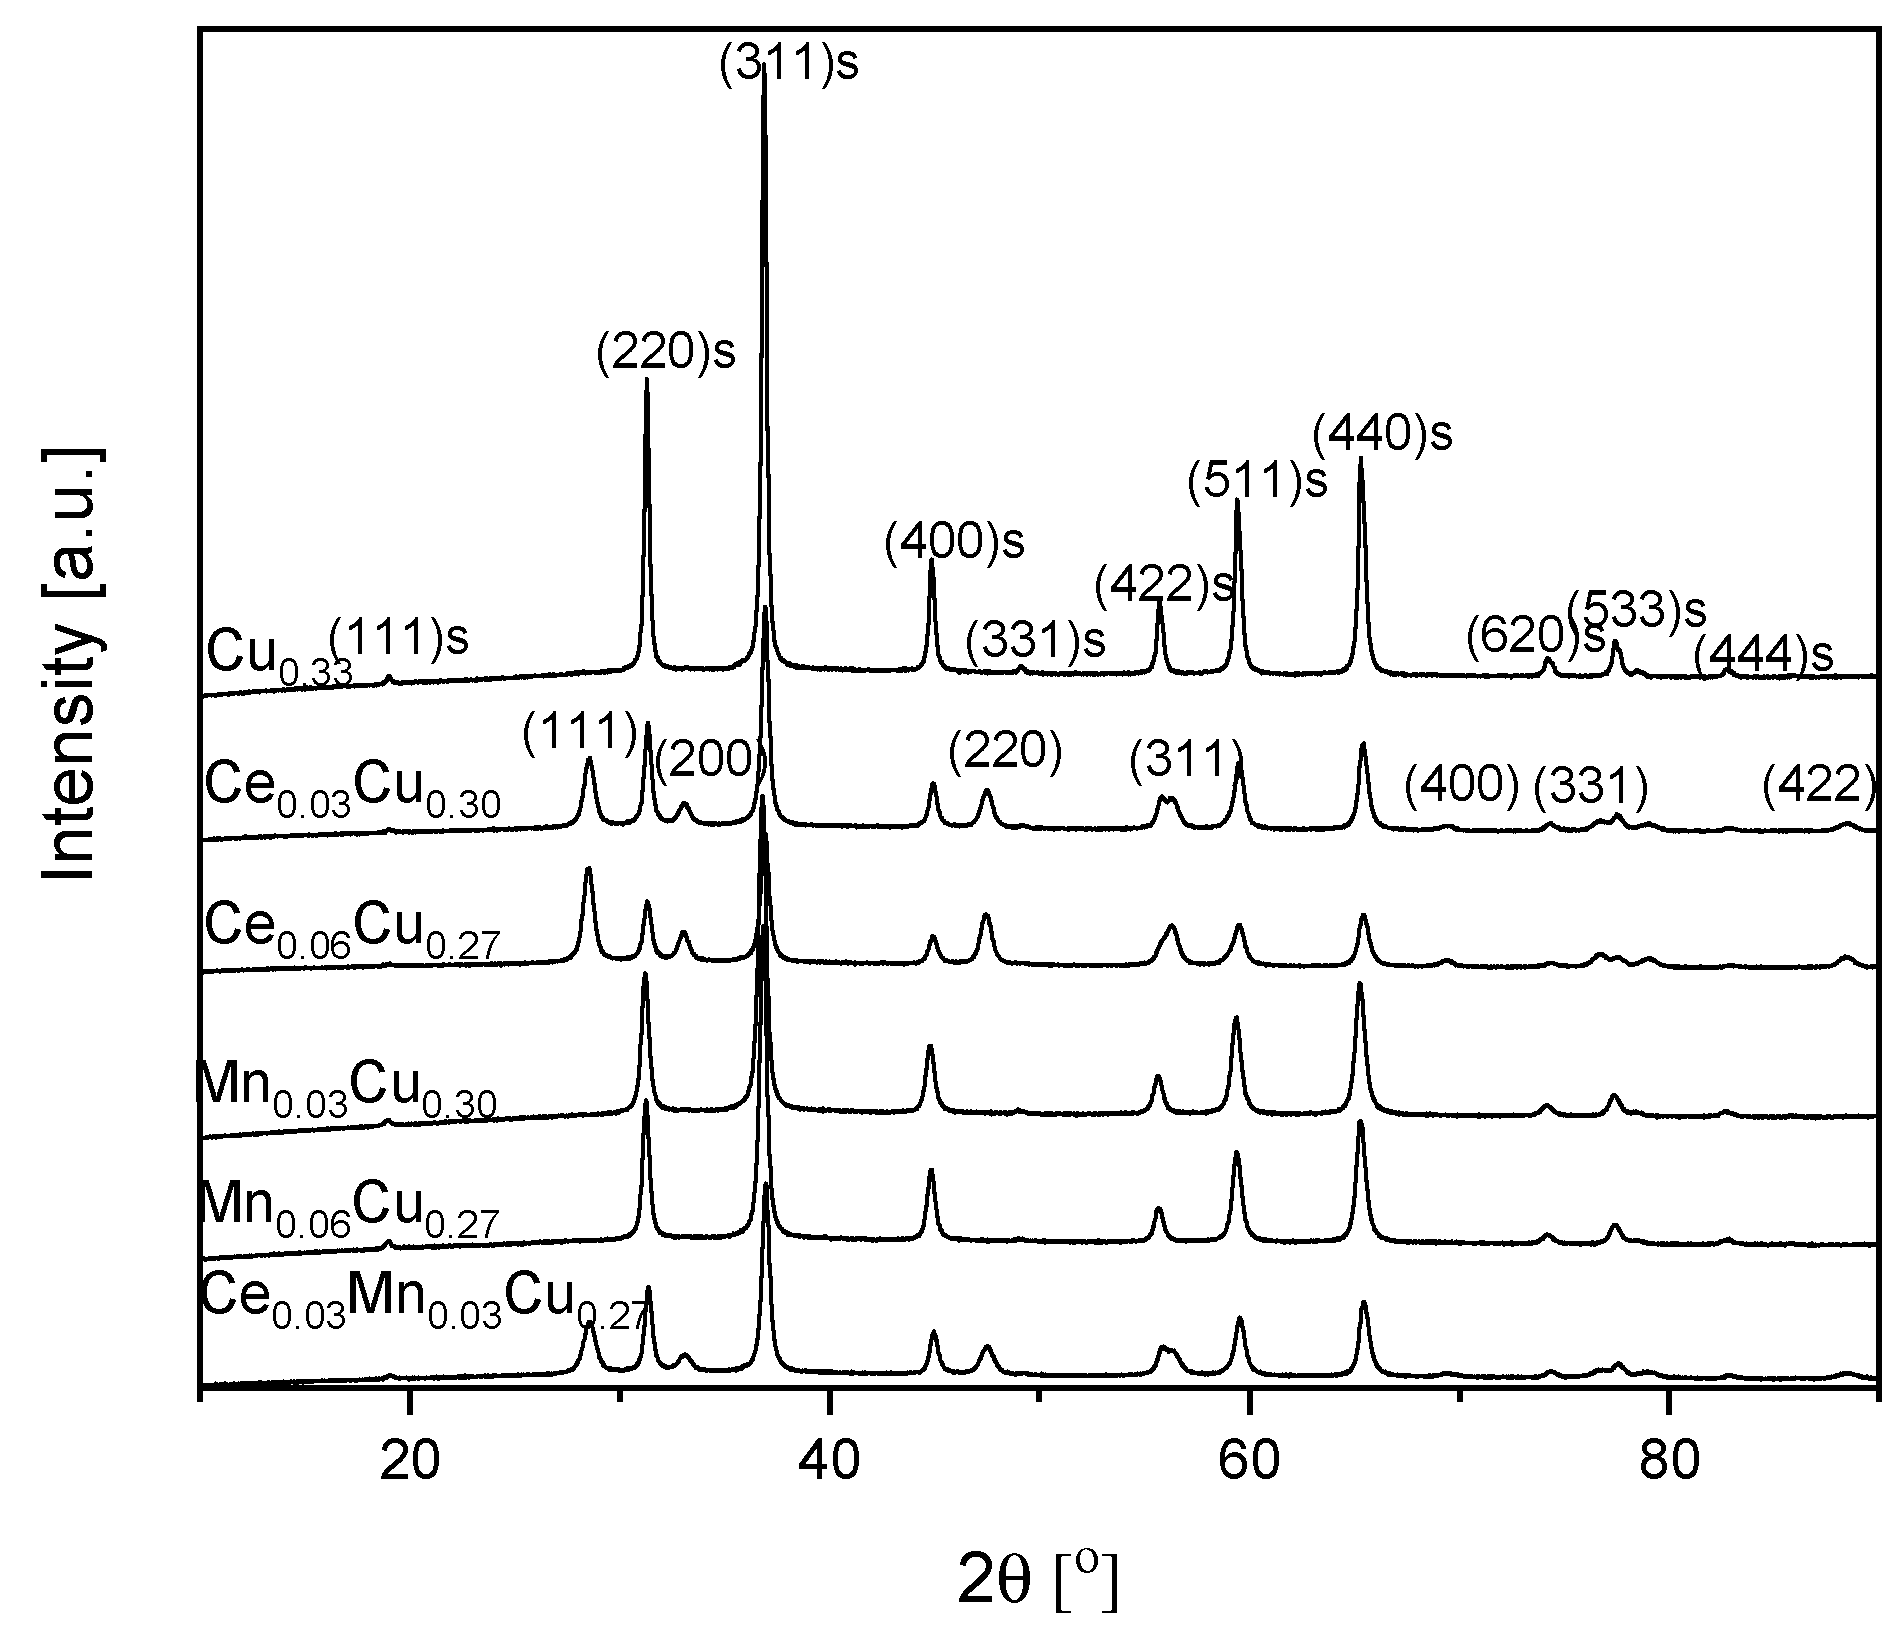
To determine the crystallographic structure of catalysts, powder XRD patterns were registered as seen in Figure 2. For the Cu0.33 sample, the diffraction lines at a 2θ angle of ca. 19.0, 31.2, 36.9, 44.9, 49.2, 55.8, 59.4, 65.2, 74.2, 77.4, 78.5, and 82.7° can be ascribed to (111), (220), (311), (400), (331), (422), (511), (440), (620), (533), (622), and (444) planes of CuAl2O4 spinel, respectively [01-071-0967]. Main reflections are narrow, which suggests that crystallites were rather large. Their average size was estimated based on the (311) plane from the Scherrer equation as equal to 31 nm (Table 1). After an admixture of cerium, new reflections at a 2θ angle of ca. 28.6, 33.1, 47.5, 56.3, 69.5, 76.7, and 88.5° appear, which origin from (111), (200), (220), (311), (400), (331), and (422) planes of CeO2, respectively [03-065-2975]. At the same time, the average crystallite size decreased to 21 nm. The double increase in the cerium content did not change the CeO2 crystallite size (calculated for the (111) plane) in contrast to a noticeable decrease of spinel crystallite size to 18 nm (Table 1). In the case of manganese doping, only reflections from the spinel phase are present. It suggests that Mn formed a solid solution with copper–aluminum oxide in the spinel structure or an amorphous oxide. Manganese admixture caused a decrease of the average crystallite size to 18 nm in the Mn0.03Cu0.30 sample and to 21 nm in the Mn0.06Cu0.27 one. The doubly doped sample Ce0.03Mn0.03Cu0.27 crystallized in the spinel structure, although some cerium oxide was also detected. It seems that manganese ions have built into the spinel phase as well. The ceria crystallites were about 12 nm large and the spinel ones were ca. 20 nm.
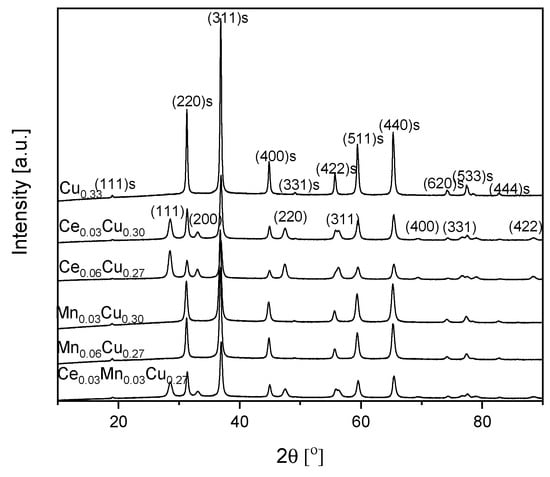
Figure 2.
XRD patterns of Cu–Al catalysts doped with manganese and cerium. The reflexes coming from the pure spinel structure are marked by ‘s’.

Table 1.
Composition, crystallite sizes, and textural properties of Ce- and Mn-doped Cu–Al spinel catalysts.
The chemical composition and textural properties of oxide catalysts are compared in Table 1. The measured metal contents for the first six samples were very close to the intended ones. The Cu0.33 sample exhibited a SSABET of 19 m2 g−1 and a total pore volume of 0.445 cm3 g−1. The replacement of some copper by cerium or manganese resulted in an increase in the specific surface area and a decrease of pore volume. The doping with Ce (0.03) caused almost 50% growth in SSABET, whereas the same amount of Mn brought about almost a double increase in this value. The pore volume decreased above two times. Further increase in Mn and Ce content (to 0.06) did not result in a change of SSABET. The total pore volume decreased with manganese amount and increased with cerium concentration.
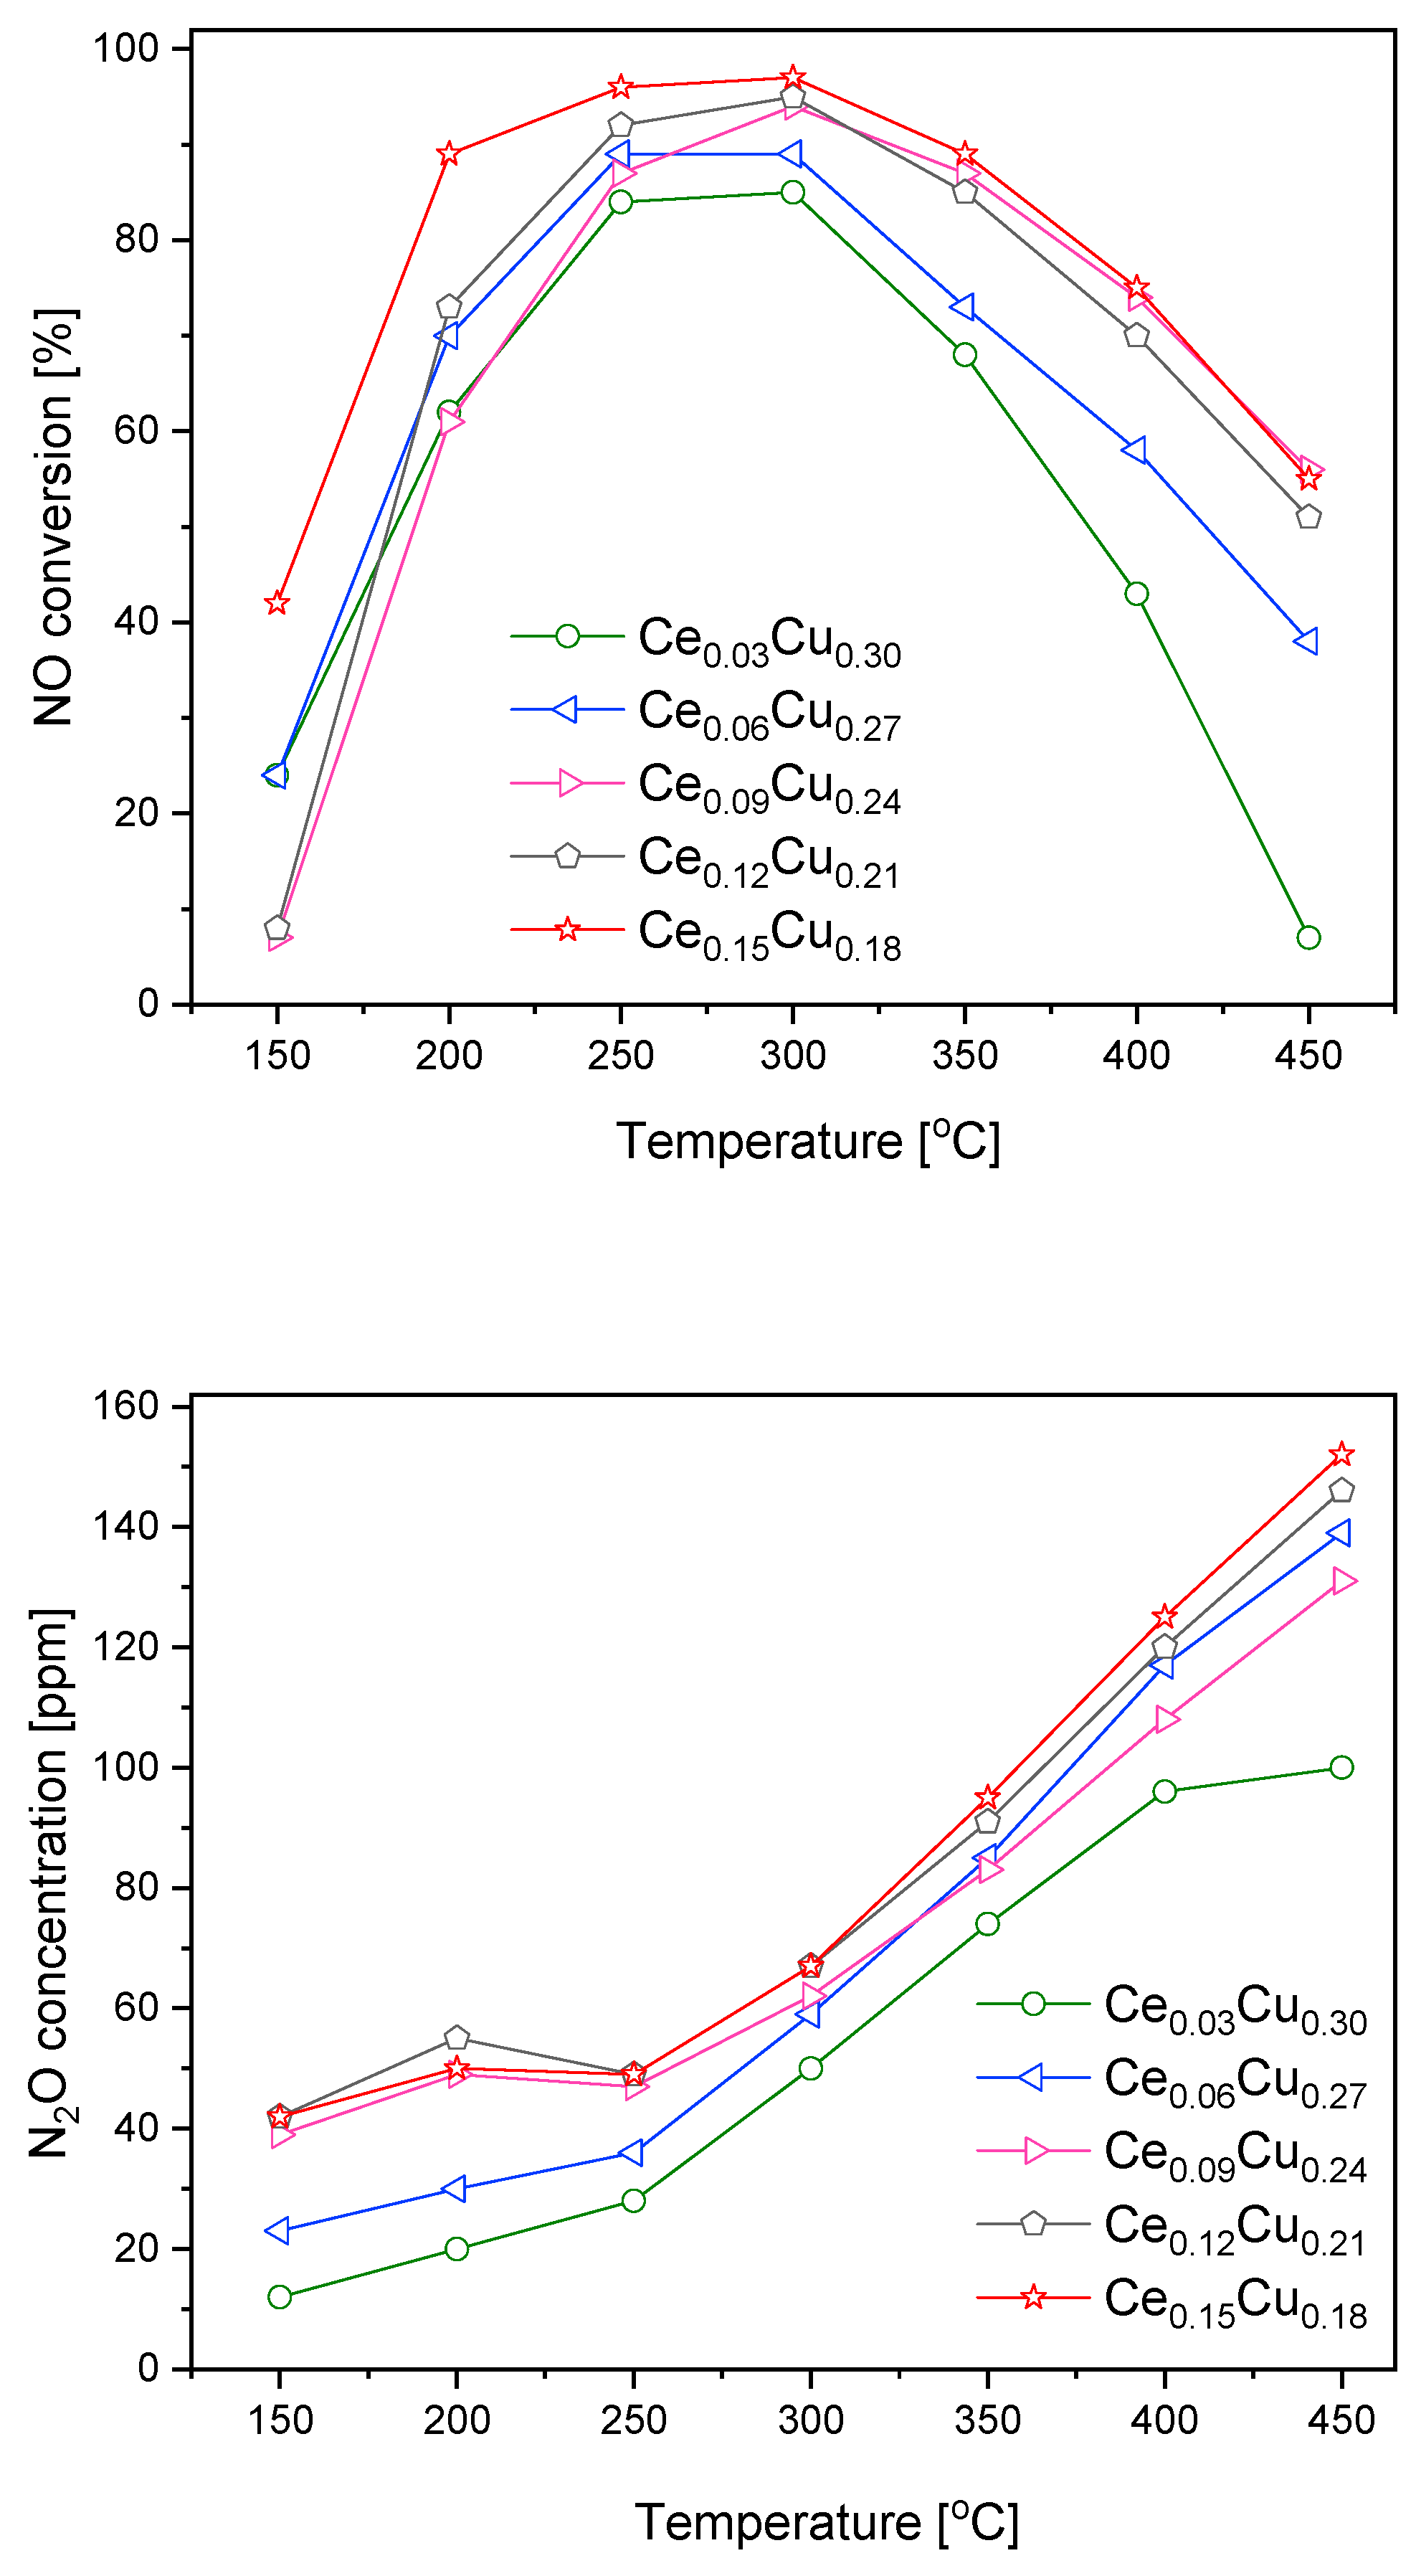
Taking into account that the Ce0.06Cu0.27 sample was only slightly less catalytically active than the Mn0.03Cu0.30 one at lower temperatures, the increase in Mn content did not improve catalytic efficiency, and less N2O was formed over cerium containing catalysts. We prepared some additional samples with a higher content of Ce. Over such catalysts, NO conversion increased with the cerium content; simultaneously, N2O formation grew (Figure 3). The NO conversion at 150 °C was an exception where the sequence of catalyst activity was different. Below 250 °C, the concentration of nitrous oxide changed from 40 to 50 ppm. Above this temperature, the growth was faster and linearly achieved ca. 150 ppm at 450 °C. The increase in nitrous oxide formation with Ce content was small for higher cerium concentrations. NO conversion and N2O formation over the Ce0.09Cu0.24 catalyst did not follow that trend. The Ce0.15Cu0.18 sample exhibited the highest catalytic activity in the whole range of tested temperatures attaining the maximum at 250–300 °C and a NO conversion above 80% in the temperature range of 200–350 °C, this activity is worse at higher temperatures than observed for the zeolite catalyst containing copper—Cu-SSZ-13, which achieved such activity in the range of 175–450 °C [9]. The comparable efficiency was attained for copper–alumina coprecipitated in the presence of carbon nanotubes—CuAlLDOCNT, NO conversion higher than 80% was measured for the temperature range of 180–330 °C [10]. For this catalyst, selectivity to N2 was about 95%. While for the zeolite materials, N2O yield, calculated as YN2O = (2xcN2O)/(cNOin + cNH3in), was ca. 6–10% [9]. We estimated this value for our catalyst in the range of 7–11%.
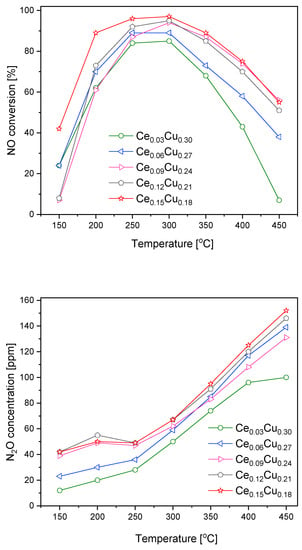
Figure 3.
NO conversion and N2O formation over Cu–Al catalysts doped with cerium.
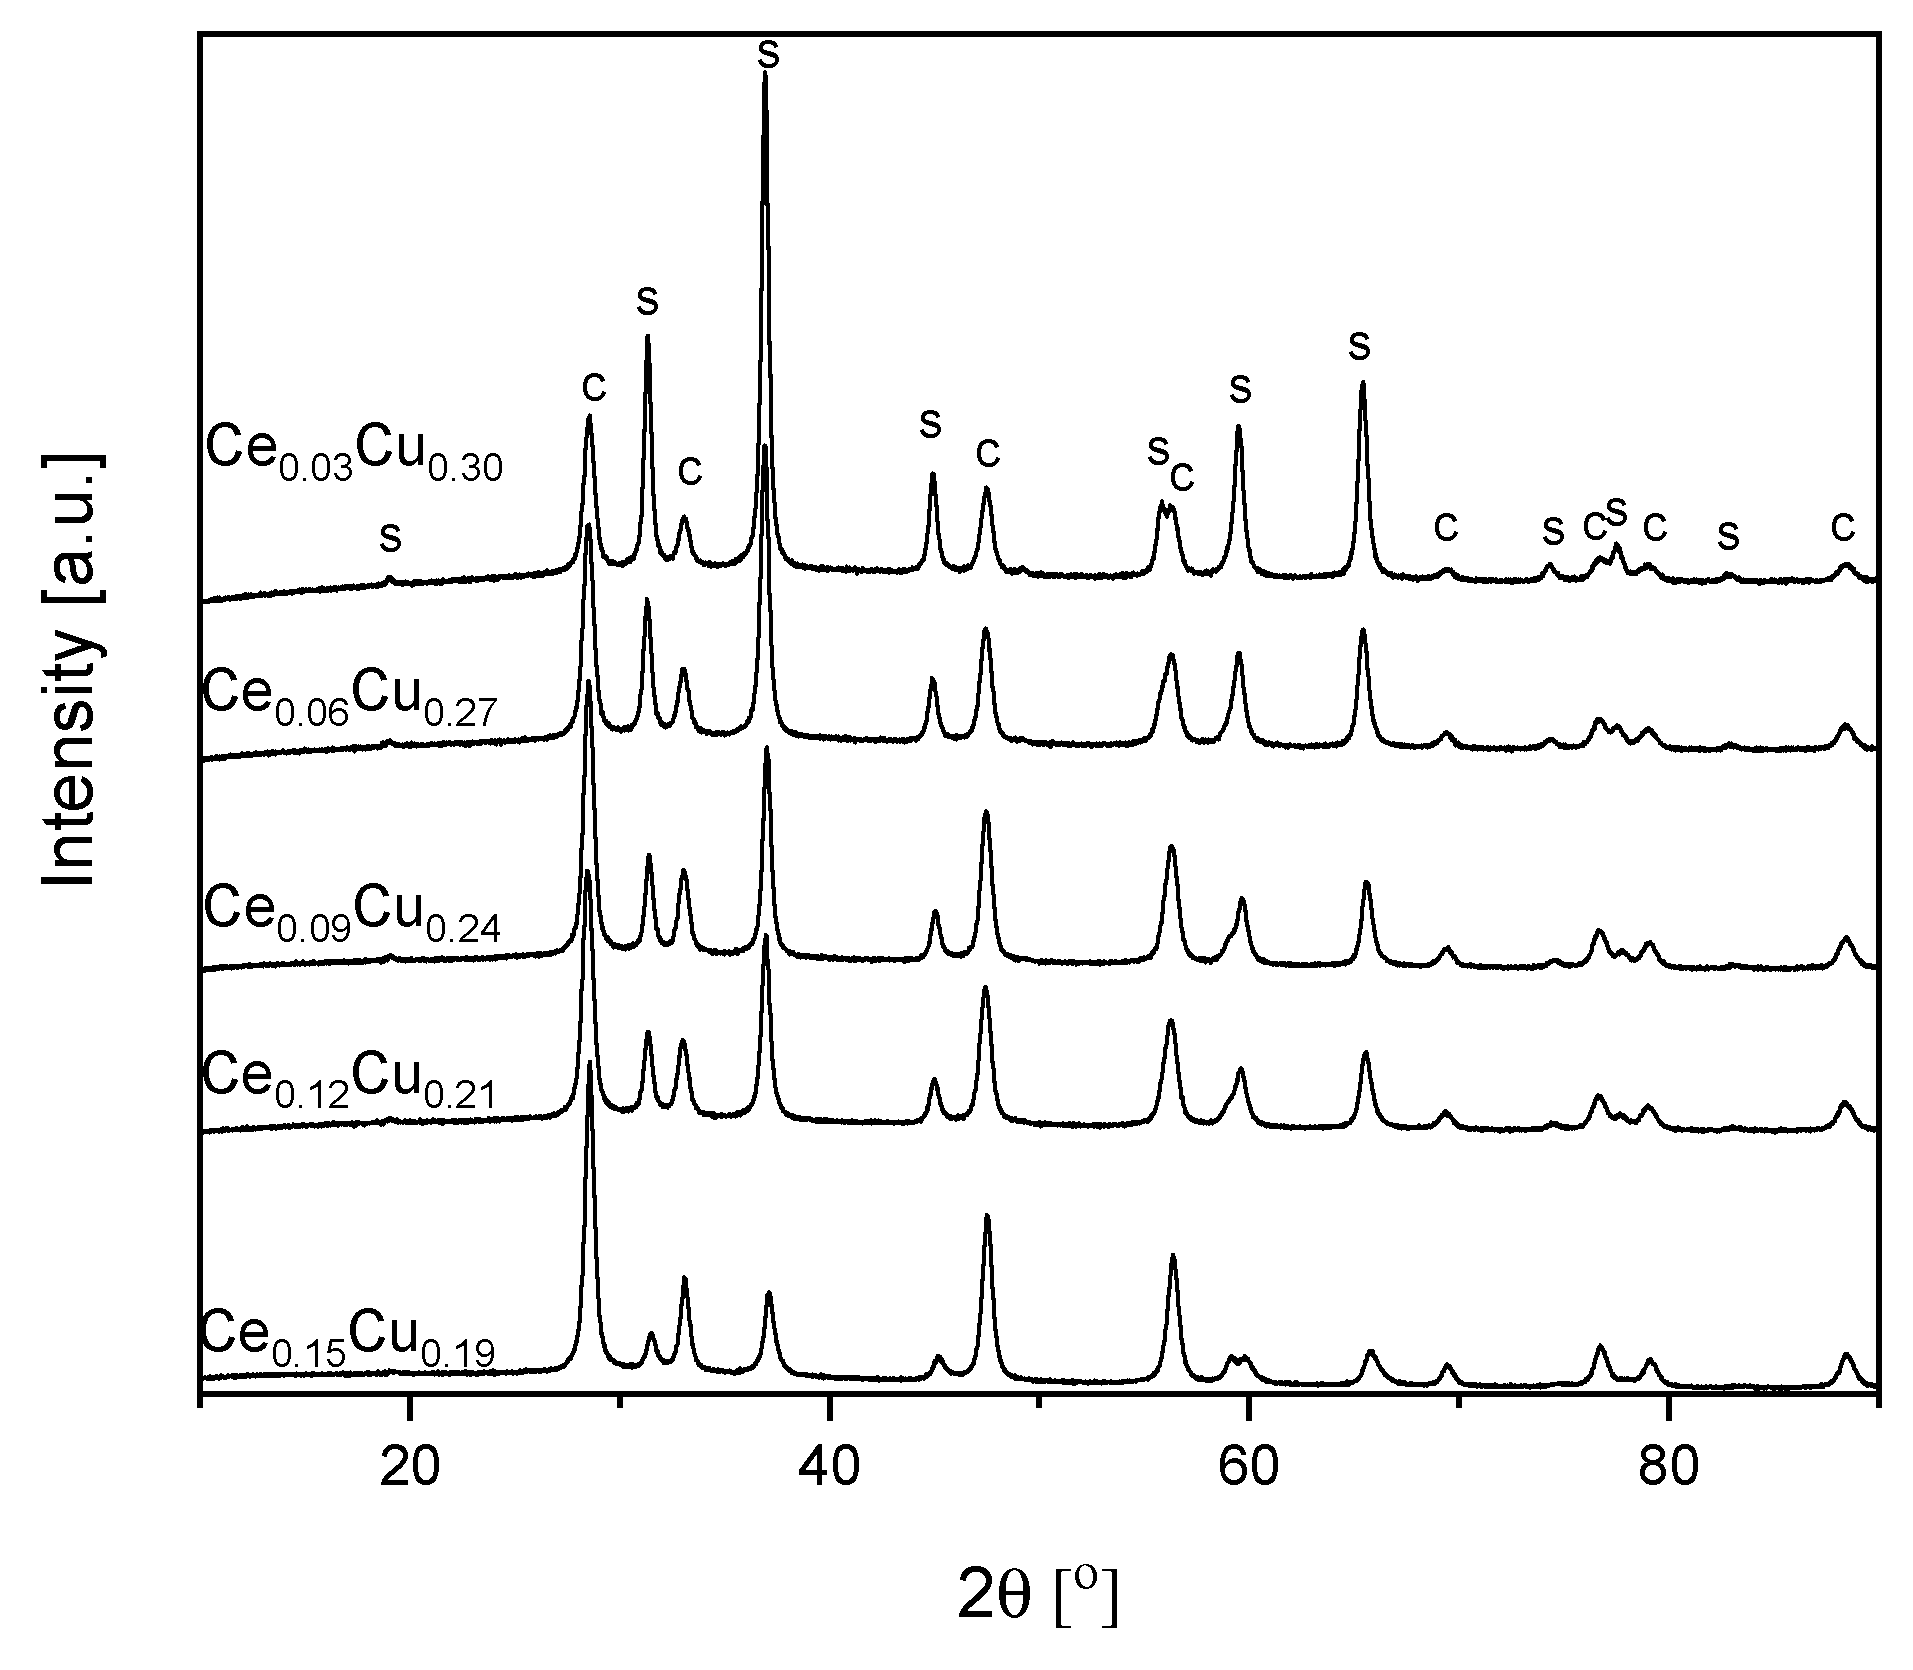
As seen from Table 1 and Figure 4, the average size of spinel crystallites decreased with the cerium content. Much weaker growth of spinel crystallites in the presence of ceria was described earlier [11]. On the other hand, the size of CeO2 crystallites remained almost the same. Only for the Ce0.15Cu0.18 sample a small increase in the crystallites size was observed. The metal concentration for the Ce0.09Cu0.24 and Ce0.12Cu0.21 samples were very similar, which could result from an experimental error during synthesis. The measured composition of the Ce0.15Cu0.18 catalyst was close to intended. The specific surface area lowered for the Ce0.09Cu0.24 sample to ca. 25 m2 g−1, and for the Ce0.12Cu0.21, catalyst remained similar as for the Ce0.06Cu0.27 sample. The total pore volume did not change significantly. The catalyst with the highest cerium content exhibited the largest SSABET and a pore volume ca. 44 m2 g−1 and 0.348 cm3 g−1, respectively (Table 1).
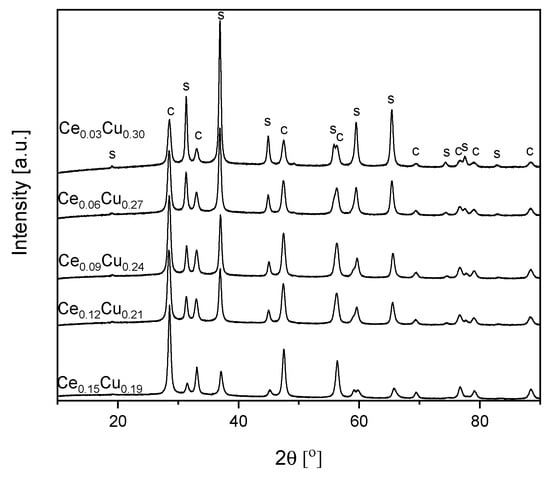
Figure 4.
XRD patterns of Cu–Al catalysts doped with cerium, ‘s’ stands for spinel and ‘c’ for CeO2.
To shed some light on the catalytic activity of copper aluminum spinel and the role of Ce dopant, the XPS measurements were taken for parent Cu0.33 and samples with various Ce contents before and after SCR of NO. The surface concentration of cerium and copper was calculated from the XPS survey spectra (Table 2). All samples were analyzed in detail in O 1s, C 1s, Al 2p, Cu 2p, and Ce 3d regions.

Table 2.
XPS Surface composition of cerium doped Cu–Al spinels (at.%).
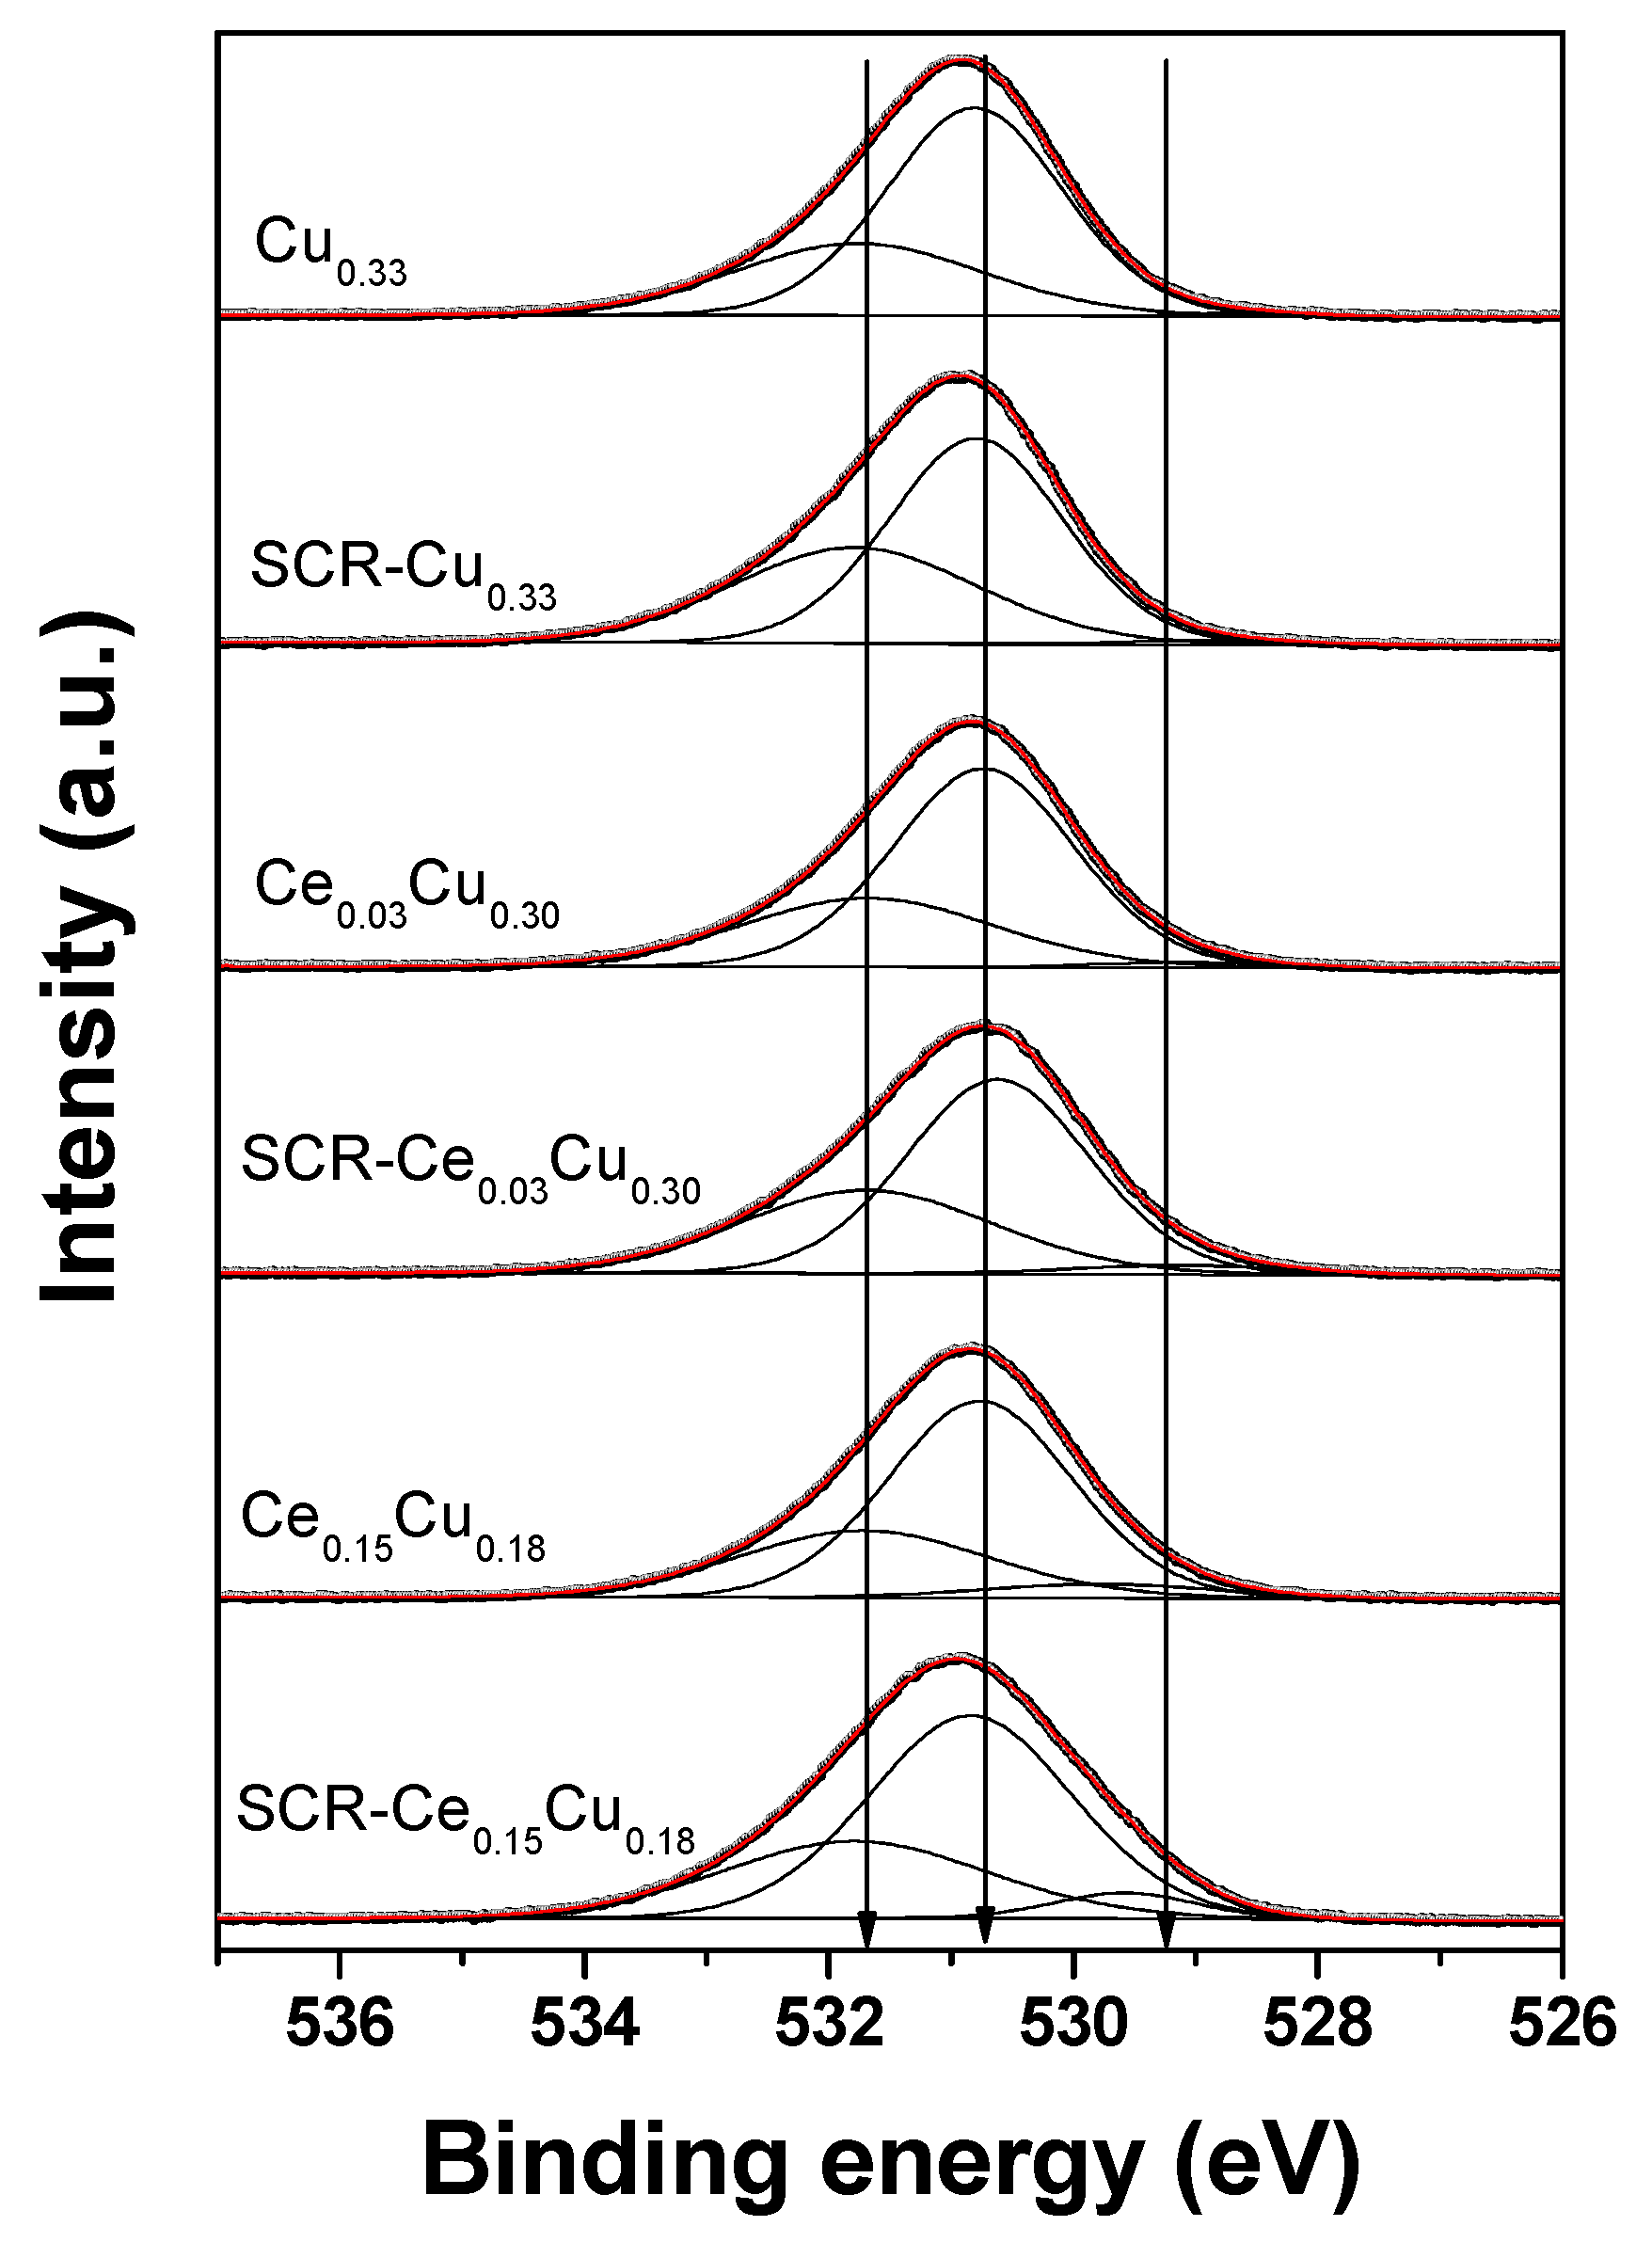
The O 1s spectra (Figure 5) were well-decomposed into three components: (i) a most intense peak (>60%) located at 530.6–530.8 eV referred to the O2− ions in the matrix of CuAl2O4 [12]; (ii) a small peak (<3%) at 528.5–529.8 eV due to oxygen–metal bonds (CuO (528.6 eV–529.8 eV) [13,14], CeO2 (528.7–529.2 eV) [15,16], Al2O3 (528.3–528.7 eV)) [17]; (iii) a peak at BE of 531.7–531.8 eV assigned to OH groups, adsorbed water, and oxygen of organic contaminants. It can be seen from Table 3 that there are some small differences (<5%) of relative amount of oxygen species between the fresh and used samples. However, one cannot exclude that these differences could be larger, but samples after the SCR reaction were stored under air atmosphere and could reoxidized before XPS studies.
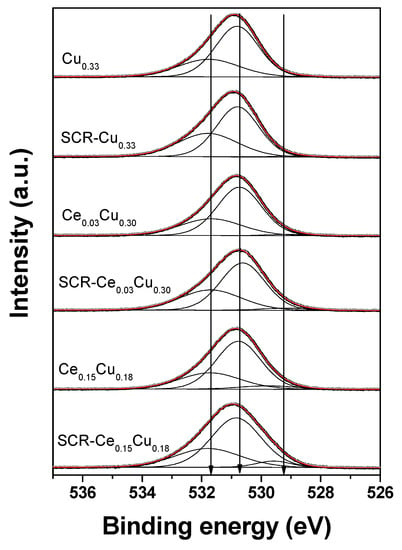
Figure 5.
O 1s XPS spectra of Cu–Al parent spinels and doped with cerium for fresh and used catalysts.

Table 3.
Spectral fitting parameters for O 1s: binding energy (eV) and percentage of total area.
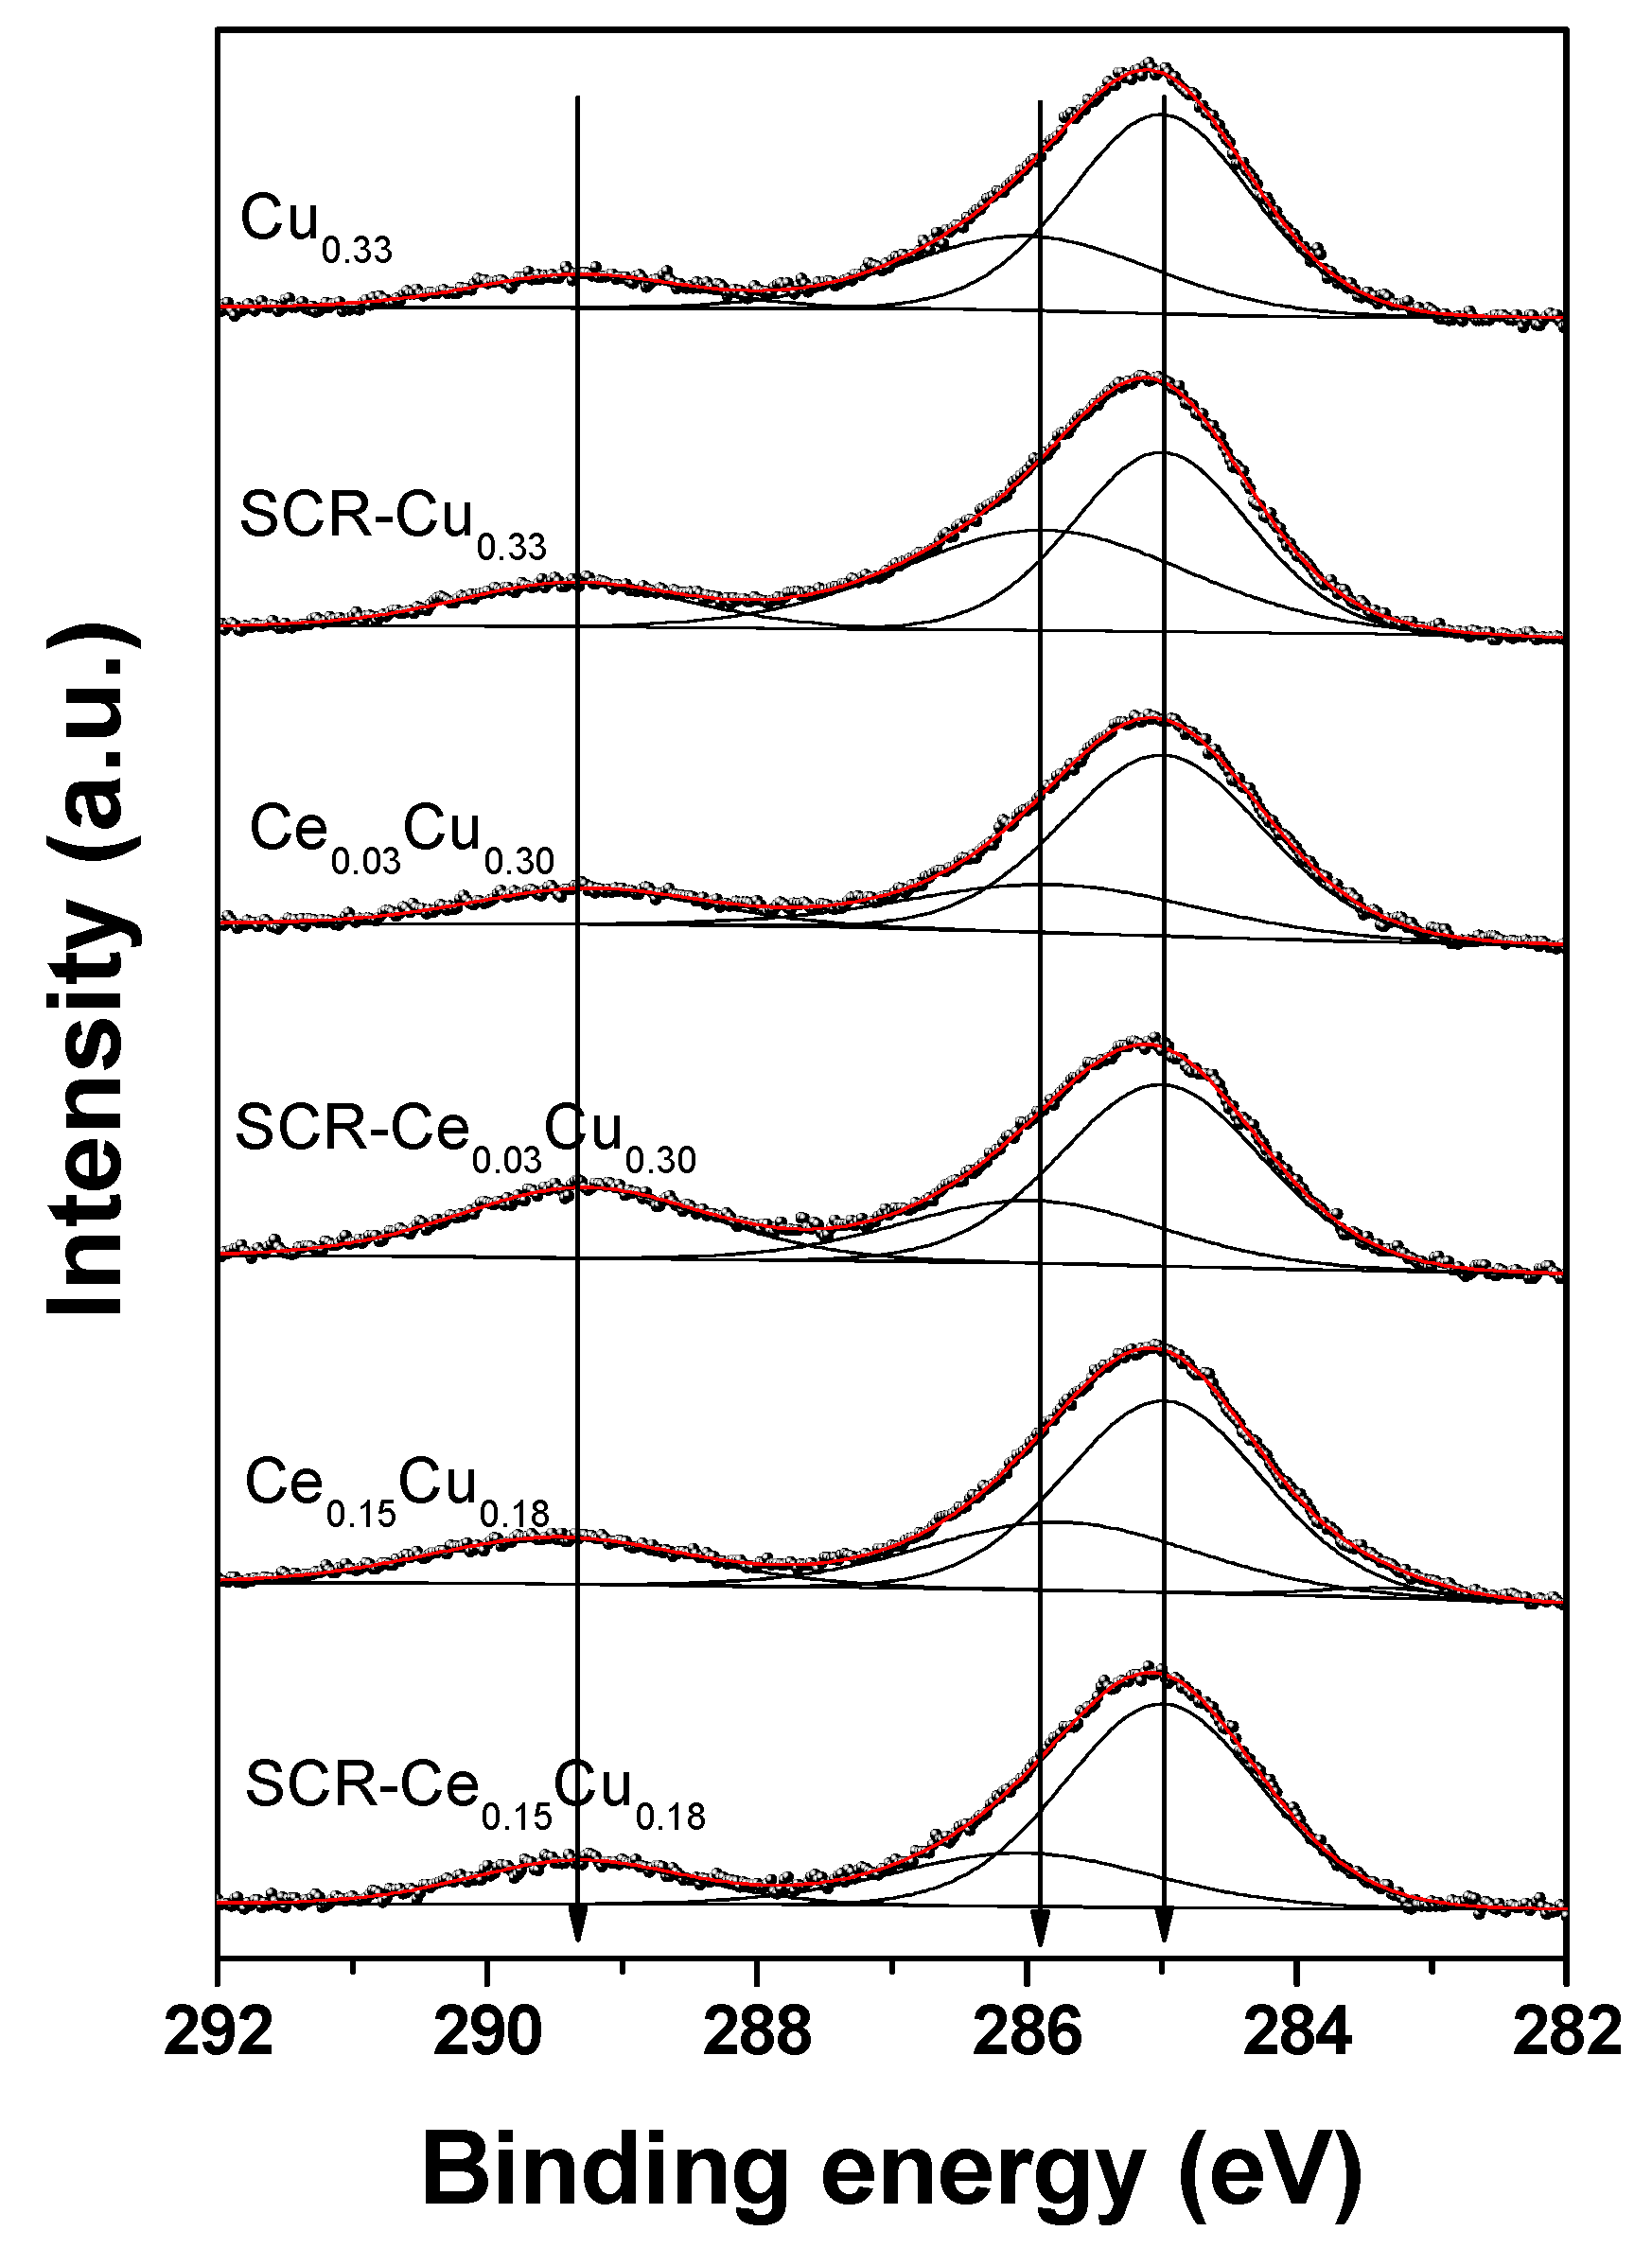
Three peaks at 285.0 eV (organic contaminants), 285.8–286.0 eV (C–O groups), and 289.2–289.5 eV (O–C=O groups) can be distinguished in the C 1s spectra (Figure 6). The hydrocarbon contamination was used as an internal calibration for our insulating samples, as we mentioned below. The binding energy of the Al 2p3/2 core line is close to 74.1 eV suggesting Al3+ in tetrahedral sites of the spinel structure [12,18].
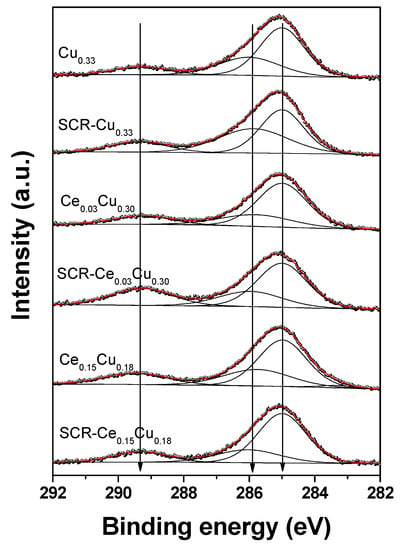
Figure 6.
C 1s XPS spectra of Cu–Al parent spinels and doped with cerium for fresh and used catalysts.
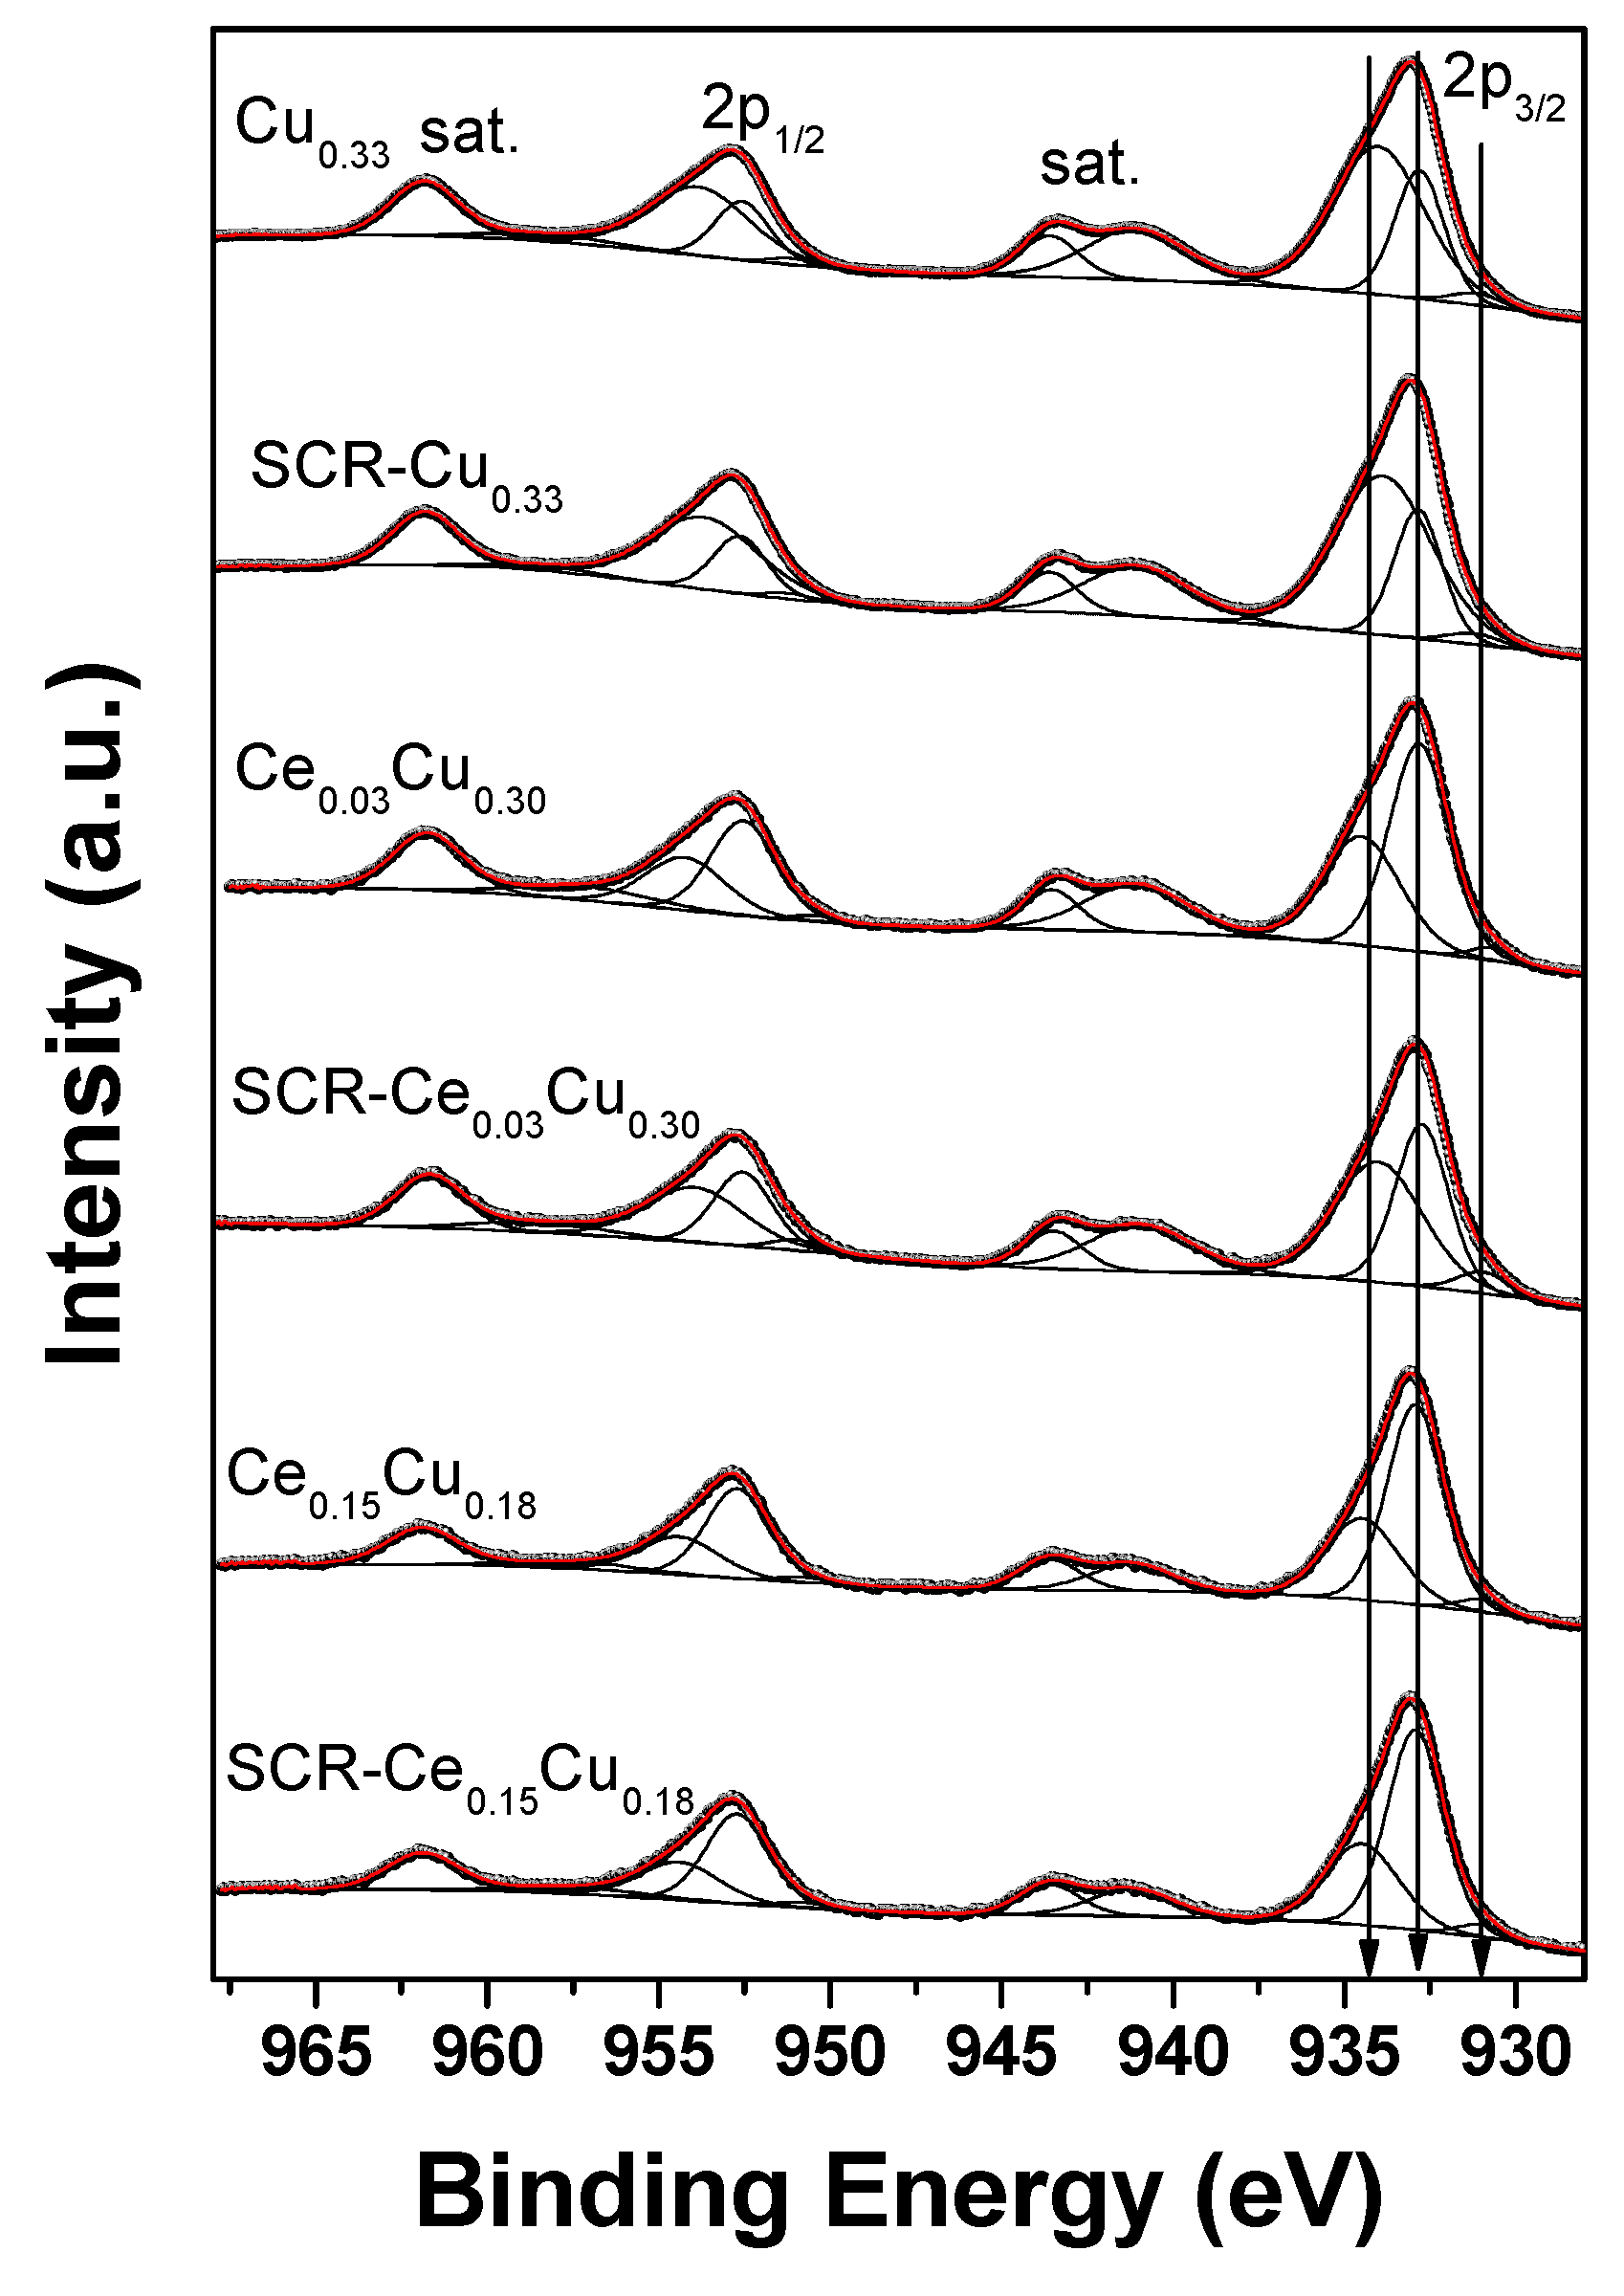
Three doublets were used to properly fit the Cu 2p spectra (Figure 7 and Table 4). The spin-orbit splittings of all doublets were in the range of 19.7–19.9 eV. The weakest doublet (<5%) with Cu 2p3/2 BE values of 930.7–931.2 eV is associated with the presence of reduced Cu+ and/or Cu0 [12,19]. Such a component can be related to the limited reduction of highly dispersed small copper particles under high-vacuum conditions or to the differential charging caused by some structural damages in the spinel structure. Some additional clue to distinguish between Cu+ and Cu0 species can be drawn from the copper Wagner plot [20]. The kinetic energy of maximum of Cu L3M45M45 Auger peak was read from the survey spectra, whereas binding energy of low-energy component from the Cu 2p high-resolution spectra. The copper Auger parameter for such contribution is below 1847.6 eV for all measured samples. Thus, based on the copper Wagner plot, we can expect that a low-energy component is related more to Cu0 than Cu+ [20]. However, one can point out that such a procedure is a major approximation only and results should be treated with caution. The most intense components origin from the octahedral Cu2+ (932.7–932.9 eV) [21] and tetrahedral Cu2+ species (933.9–934.5 eV) [19] in Cu–Al spinel structure and/or CuO particles. The main photoelectron Cu 2p peaks are accompanied by strong shake-up satellites confirming that copper is present in all samples as Cu2+ species mainly.
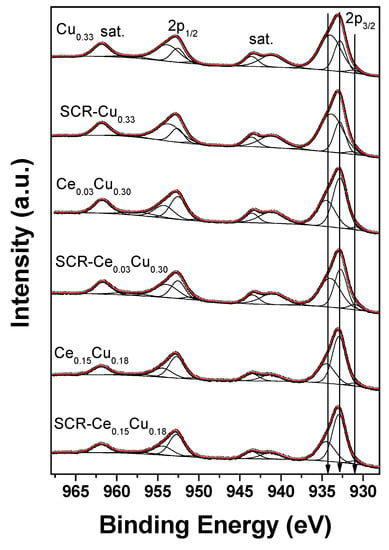
Figure 7.
Cu 2p XPS spectra of Cu–Al parent spinels and doped with cerium for fresh and used catalysts.

Table 4.
Spectral fitting parameters for Cu 2p3/2: binding energy (eV) and percentage of total area.
In the parent Cu0.33 sample, copper was observed in the concentration twice lower than intended in the synthesis. The majority of Cu+2 species occupied tetrahedral sites in the amount ca. twice higher than found in our recent paper [22]. The ratio of tetrahedral to octahedral copper cations was close to typical of bulk partially inverse CuAl2O spinel (60:40) [23]. In copper–alumina systems, the spinel phase was the only one observed [11], and in the Cu0.33 sample, the reduced Cu+ cations can occur in octahedrons which favor forming such species [23]. The SCR conditions resulted in a small decrease (10%) in the presence of Cu2+ cations in octahedral sites as well as in the amount of reduced copper. Cerium addition caused a significant growth of the octahedral component mostly for Ce0.15Cu0.18 (over 63%). It was shown [23] that Cu2+ ions in the octahedral positions are important in catalytic reactions due to undergoing Cu2+ → Cu+ transitions. Moreover, the reduced copper is crucial in dissociative NO adsorption [11].
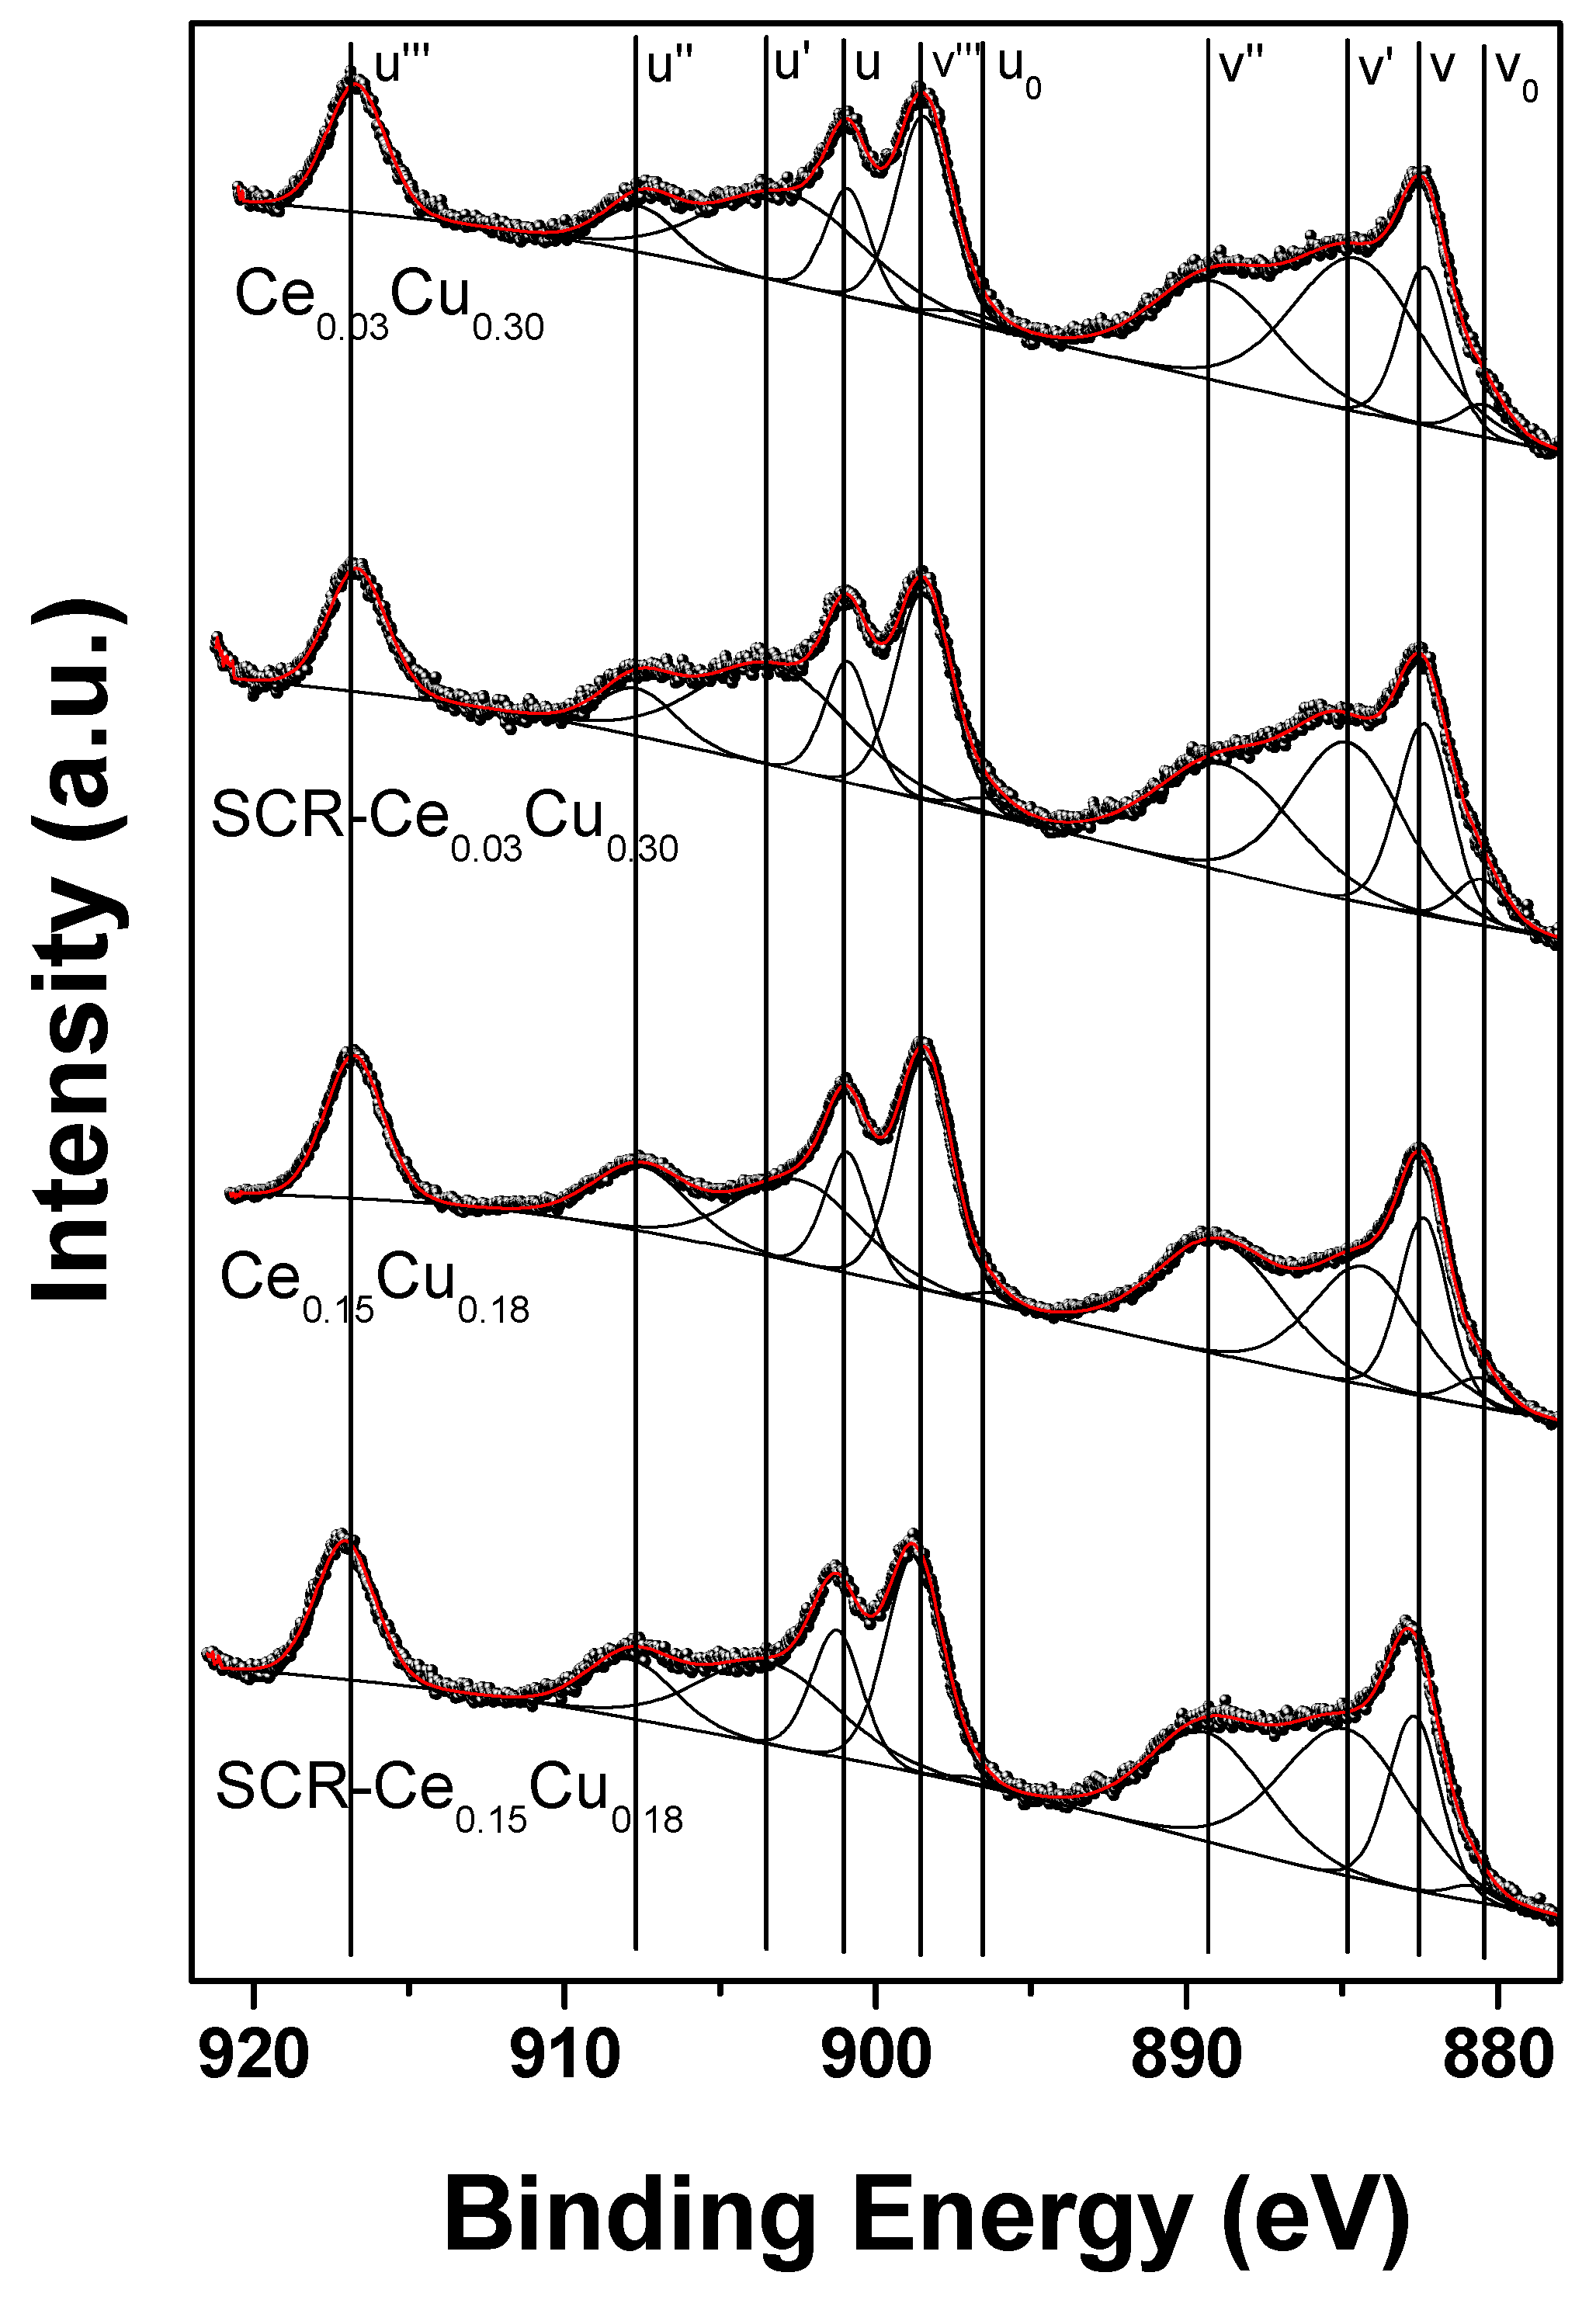
The Ce 3d XPS spectra of Ce-doped Cu–Al catalysts as received and after SCR are presented in Figure 8. According to the common approach [24,25,26,27], Ce 3d spectra can be fitted with eight or ten components marked ’v’ for Ce 3d5/2 and ‘u’ for Ce 3d3/2 multiplets. The multiplicity of these states comes from different Ce 4f level occupancies in the final state. Here, we have chosen 10-components approach; however, v0 and u0 peaks are difficult to resolve because the energy separation with v and u peaks is small. The peaks at 882.3 (v), 889.1 (v’’), and 898.4 eV (v’’’) as well as 900.9 (u), 907.6 (u’’), and 916.7 eV (u’’’) can be assigned to Ce4+, whereas 880.4 (v0), 884.5 (v’), 896.9 (u0), and 902.9 eV (u’) to Ce3+. The position of the Ce4+ reference line (u’’’) was 916.7 eV which is in perfect agreement with literature data [28]. The surface concentration of Ce3+ was estimated from the Ce3+/(Ce3+ + Ce4+) peak areas ratio [29]. Because Ce 3d spectra are quite similar to reference CeO2 spectrum [30], a Ce3+ percentage of 29% (Ce0.03-SCR), 43% (Ce0.03), 36% (Ce0.15-SCR), and 30% (Ce0.15) found in our samples is very close to pure CeO2 [20], and is connected with the copper content on the surface as expected. However, these values are much higher than found in Cu/CeO2 [19]. The presence of trivalent Ce3+ is closely related to the oxygen vacancies in the spinel structure, and as a result, influences the redox properties and catalytic performance of Ce-based systems. The vicinity of ceria is necessary for Cu+ ions to take part in redox reactions. On the other hand, the presence of cerium retards the sintering of the Cu particles and ensures its good dispersion [11]. In the case of the Ce0.03Cu0.30 sample, the concentration of copper was retained at the surface, although its amount was decreased by 10% compared to the Cu0.33 sample. The same ratio of the surface copper amount to the intended Cu concentration was observed for the Ce0.15Cu0.18 sample. Copper covers preferentially ceria [11] like in the Ce0.15Cu0.18 sample, where the ratio of Ce/Cu was twice lower than intended. The amount of reduced copper increased significantly after the SCR reaction, which could be the result of reducing conditions and the presence of cerium, because it was not observed for copper–aluminum oxide. During catalytic tests of Ce-containing samples, the concentration of copper in tetrahedral sites increased by about 25% at the cost of octahedral Cu, not observed to such an extent for the Cu0.33 sample. This tetrahedral copper could form CuO [11] and pure Al2O3 spinel as observed in the Ce0.15Cu0.18 sample. In such copper–ceria–alumina systems, dissociative adsorption of NO and surface mobility of N atoms increase which can result in higher efficiency in SCR [11] observed for the Ce0.15Cu0.18 sample.
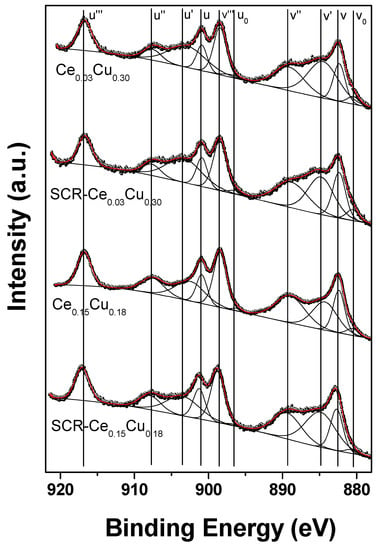
Figure 8.
Ce 3d XPS spectra of Cu–Al spinels doped with cerium for fresh and used catalysts.
3. Materials and Methods
Samples were obtained by coprecipitatation of metal nitrates with ammonium carbonate. The copper to aluminium ratio was equal to 1:2—typical of spinel compounds. The 1M solutions of copper (Cu(NO3)2·3H2O) and aluminum (Al(NO3)3·9H2O) nitrates were mixed and dropped into a beaker simultaneously with the 1M solution of (NH4)2CO3 taken in a 20% excess to a stoichiometric amount. The solutions were added at a rate of 4 mL min−1 under stirring and the obtained precipitation was aged at 50 °C for one hour. Then, the solid was filtered with distilled water and dried overnight at room temperature. The sample was calcined at 900 °C for 6 h. The sample was marked as Cu0.33. Next, samples were promoted with manganese or cerium and prepared analogously using Ce(NO3)3·6H2O and Mn(NO3)2·4H2O as substrates. The amount of copper was lowered and another metal was added to obtain the samples with the Cu:Ce(Mn) ratio equal to 0.30:0.03 and 0.27:0.06, the sample where Cu:Ce:Mn was 0.27:0.03:0.03 was prepared as well. They were denoted as Ce0.03Cu0.30, Ce0.06Cu0.27, Mn0.03Cu0.30, Mn0.06Cu0.27, and Ce0.03Mn0.03Cu0.27. The samples with higher cerium concentrations—Cu:Ce equal to 0.24:0.09, 0.21:0.12, and 0.18:0.15—were synthesized and marked as Ce0.09Cu0.24, Ce0.12Cu0.21, and Ce0.15Cu0.18.
The samples were subjected to catalytic tests in selective catalytic reduction of NO with ammonia. The concentrations of NO and NH3 were equal to 800 ppm and the oxygen concentration was 3.5%. These reagents were diluted in helium and passed at a rate of 100 mL min−1 through a quartz reactor with 0.2 g of a catalyst. Its 0.25–1 mm fraction was placed on quartz wool. The concentrations of NO and N2O were measured in the temperature range of 150–450 °C at a step of 50 °C with the IR analyzers—serie 2020 A0, produced by ABB.
The crystallographic structure of the samples was determined with the powder X-ray diffraction. XRD patterns were recorded at 2θ angles from 10 to 90°, with a step of 0.013° by a PANalytical-Empyrean diffractometer. As a radiation source, the copper lamp was used with λ = 1.5406 Å.
To perform the quantitative analysis of the metals contained in the materials, the XRF method was used. An EDX 3600H apparatus from Skyray Instruments with a tungsten lamp enabled probing with the depth larger than 50 μm.
The textural properties of samples were examined by the low temperature sorption of nitrogen. The isotherms were registered within the relative pressure range of 0–0.98 with a Gemini V 2.00 2380 (Micromeritics) analyzer. The specific surface area was measured using the BET method—SSABET. The total pore volume was assessed with the BJH model from the desorption branch.
Cu–Al spinel (Cu0.33) and the samples with minimum and maximum cerium concentrations (Ce0.03Cu0.30 and Ce0.15Cu0.18) were subjected to surface analysis with X-ray Photoelectron Spectroscopy (XPS). The experiments were performed with a SES R4000 hemispherical analyzer (Gammadata Scienta) and non-monochromatic MgKα X-ray radiation (1253.6 eV). The X-ray anode operated at 12 kV and 15 mA. For pass energy of 100 eV, the system resolution (FWHM) measured for the Ag 3d5/2 line was 0.9 eV. The spectrometer calibration was conducted according to ISO 15472:2001. During the experiment, the pressure in the analysis chamber was close to 3 × 10⁻¹⁰ mbar. Samples in the powder form were pressed into In foil and seated on a special holder. The analysis area was about 4 mm2 (5 × 0.8 mm). The survey scans were obtained at pass energy of 200 eV (with 250 meV step), whereas the high-resolution spectra were obtained at a pass energy of 100 eV (with 25 meV step). The spectra deconvolution into individual components were performed with using the CasaXPS 2.3.19 software. We used a Shirley-type background algorithm and pseudo-Voigt line profiles (mixture of Gaussian and Lorentzian lines) with 70:30 variable proportions. The charging was corrected to the carbon C 1s line at 285.0 eV.
4. Conclusions
The precursor of mixed copper–aluminum oxide with the molar ratio 2:1 was obtained with the coprecipitation method. The sample crystallized in the inverse spinel structure. In subsequent samples, a part of copper—0.03 and 0.06—was substituted by cerium or manganese. Manganese was built into the spinel structure in contrast to Ce samples in which an additional CeO2 phase was detected. Since the Ce0.06Cu0.27 sample exhibited optimum catalytic efficiency, the amount of cerium was increased 2.5 times. The highly crystalline samples were mesoporous solids with a low specific surface area. The addition of cerium or/and manganese caused an increase in SSA. The maximum activity in SCR NO with ammonia within the broad temperature range was attained over the Ce0.15Cu0.18 sample. On the surface of this catalyst, well-dispersed copper was present mainly in octahedral sites, which was caused by the cerium presence. Cu concentration was twice higher than Ce and its amount was connected with the concentration of Ce3+. The high amount of this reduced cerium resulted from its interaction with the spinel. On the surface of this catalyst, copper was present mainly as copper oxide with a contribution of reduced copper, and oxygen occurred as lattice species. The concentration of reduced copper could influence this catalyst efficiency.
Author Contributions
Investigation, A.B., K.R., C.C., G.M., and J.G.; writing, A.B. and J.G. All authors have read and agreed to the published version of the manuscript.
Funding
This research was financed from Research Subvention AGH UST No 16.16.210.476.
Conflicts of Interest
The authors declare no conflict of interest.
References
- Gómez-García, M.; Pitchon, V.; Kiennemann, A. Pollution by nitrogen oxides: An approach to NOx abatement by using sorbing catalytic materials. Environ. Int. 2005, 31, 445–467. [Google Scholar] [CrossRef] [PubMed]
- Denisovа, K.O.; Ilyin, A.A.; Rumyantsev, R.N.; Ilyin, A.P.; Volkova, A.V. Nitrous Oxide: Production, Application, and Protection of the Environment. Rus. J. Gen. Chem. 2019, 89, 46–54. [Google Scholar] [CrossRef]
- Wu, L.; Chen, X.; Wei, W.; Liu, Y.; Wang, D.; Ni, B.-J. A Critical Review on Nitrous Oxide Production by Ammonia-Oxidizing Archaea. Environ. Sci. Technol. 2020, 54, 9175–9190. [Google Scholar] [CrossRef] [PubMed]
- Montini, T.; Melchionna, M.; Monai, M.; Fornasiero, P. Fundamentals and Catalytic Applications of CeO2-Based Materials. Chem. Rev. 2016, 116, 5987–6041. [Google Scholar] [CrossRef] [PubMed]
- Zhang, F.; Zhang, S.; Guan, N.; Schreier, E.; Richter, M.; Eckelt, R.; Fricke, R. NO SCR with propane and propene on Co-based alumina catalysts prepared by co-precipitation. Appl. Catal. B Environ. 2007, 73, 209–219. [Google Scholar] [CrossRef]
- Han, L.; Cai, S.; Gao, M.; Hasegawa, J.-Y.; Wang, P.; Zhang, J.; Shi, L.; Zhang, D. Selective Catalytic Reduction of NOx with NH3 by Using Novel Catalysts: State of the Art and Future Prospects. Chem. Rev. 2019, 119, 10916–10976. [Google Scholar] [CrossRef] [PubMed]
- Kumar, P.A.; Reddy, M.P.; Ju, L.K.; Hyun-Sook, B.; Phil, H.H. Low temperature propylene SCR of NO by copper alumina catalyst. J. Mol. Catal. A: Chem. 2008, 291, 66–74. [Google Scholar] [CrossRef]
- Qi, F.; Xiong, S.; Liao, Y.; Dang, H.; Yang, S. A novel dual layer SCR catalyst with a broad temperature window for the control of NOx emission from diesel bus. Catal. Commun. 2015, 65, 108–112. [Google Scholar] [CrossRef]
- Palčić, A.; Bruzzese, P.C.; Pyra, K.; Bertmer, M.; Góra-Marek, K.; Poppitz, D.; Pöppl, A.; Gläser, R.; Jabłońska, M. Nanosized Cu-SSZ-13 and Its Application in NH3-SCR. Catalysts 2020, 10, 506. [Google Scholar] [CrossRef]
- Wu, X.; Meng, H.; Du, Y.; Liu, J.; Hou, B.; Xie, X. Insight into Cu2O/CuO collaboration in the selective catalytic reduction of NO with NH3: Enhanced activity and synergistic mechanism. J. Catal. 2020, 384, 72–87. [Google Scholar] [CrossRef]
- Fernández-García, M.; Rebollo, E.G.; Guerrero-Ruiz, A.; Conesa, J.; Soria, J.; Luque, R. Influence of Ceria on the Dispersion and Reduction/Oxidation Behaviour of Alumina-Supported Copper Catalysts. J. Catal. 1997, 172, 146–159. [Google Scholar] [CrossRef]
- Ponmudi, S.; Sivakumar, R.; Sanjeeviraja, C.; Gopalakrishnan, C.; Jeyadheepan, K. Facile fabrication of spinel structured n-type CuAl2O4 thin film with nano-grass like morphology by sputtering technique. Appl. Surf. Sci. 2019, 483, 601–615. [Google Scholar] [CrossRef]
- Anderson, J.; Fierro, J. Bulk and Surface Properties of Copper-Containing Oxides of the General Formula LaZr1-xCuxO3. J. Solid State Chem. 1994, 108, 305–313. [Google Scholar] [CrossRef]
- Ertl, G.; Hierl, R.; Knözinger, H.; Thiele, N.; Urbach, H. XPS study of copper aluminate catalysts. Appl. Surf. Sci. 1980, 5, 49–64. [Google Scholar] [CrossRef]
- Paparazzo, E. XPS studies of damage induced by X-ray irradiation on CeO2 surfaces. Surf. Sci. 1990, 234, L253–L258. [Google Scholar] [CrossRef]
- Sarma, D.; Rao, C. XPES studies of oxides of second- and third-row transition metals including rare earths. J. Electron Spectrosc. Relat. Phenom. 1980, 20, 25–45. [Google Scholar] [CrossRef]
- Turner, N.H.; Single, A.M. Determination of peak positions and areas from wide-scan XPS spectra. Surf. Interface Anal. 1990, 15, 215–222. [Google Scholar] [CrossRef]
- Han, M.; Wang, Z.; Xu, Y.; Wu, R.; Jiao, S.; Chen, Y.; Feng, S. Physical properties of MgAl2O4, CoAl2O4, NiAl2O4, CuAl2O4, and ZnAl2O4 spinels synthesized by a solution combustion method. Mater. Chem. Phys. 2018, 215, 251–258. [Google Scholar] [CrossRef]
- Severino, F.; Brito, J.L.; Laine, J.M.; Fierro, J.; Agudo, A. Nature of Copper Active Sites in the Carbon Monoxide Oxidation on CuAl2O4 and CuCr2O4 Spinel Type Catalysts. J. Catal. 1998, 177, 82–95. [Google Scholar] [CrossRef]
- NIST XPS Database. Available online: https://srdata.nist.gov/xps/ (accessed on 28 November 2020).
- Shen, Y.; Guo, M.; Xia, X.; Shao, G. Role of materials chemistry on the electrical/electronic properties of CuO thin films. Acta Mater. 2015, 85, 122–131. [Google Scholar] [CrossRef]
- Białas, A.; Kuśtrowski, P.; Dudek, B.; Piwowarska, Z.; Wach, A.; Michalik, M.; Kozak, M. Copper-aluminum oxide catalysts for total oxidation of toluene synthesized by thermal decomposition of co-precipitated precursors. Thermochim. Acta 2014, 590, 191–197. [Google Scholar] [CrossRef]
- Bechara, R.; Aboukai’s, A.; Bonnelle, J.-P. X-Ray Photoelectron Spectroscopic Study of a Cu-AI-0 Catalyst under H, or CO Atmospheres. J. Chem. Soc. Faraday Trans. 1993, 89, 1257–1262. [Google Scholar] [CrossRef]
- Konsolakis, M.; Ioakeimidis, Z. Surface/structure functionalization of copper-based catalysts by metal-metal interaction. Appl. Surf. Sci. 2014, 320, 244–255. [Google Scholar] [CrossRef]
- Ramana, S.; Rao, B.G.; Venkataswamy, P.; Rangaswamy, A.; Reddy, B.M. Nanostructured Mn-doped ceria solid solutions for efficient oxidation of vanillyl alcohol. J. Mol. Catal. A Chem. 2016, 415, 113–121. [Google Scholar] [CrossRef]
- Romeo, M.; Bak, K.; El Fallah, J.; Le Normand, F.; Hilaire, L. XPS Study of the reduction of cerium dioxide. Surf. Interface Anal. 1993, 20, 508–512. [Google Scholar] [CrossRef]
- Pappacena, A.; Rancan, M.; Armelao, L.; Llorca, J.; Ge, W.; Ye, B.; Lucotti, A.; Trovarelli, A.; Boaro, M. New Insights into the Dynamics That Control the Activity of Ceria–Zirconia Solid Solutions in Thermochemical Water Splitting Cycles. J. Phys. Chem. C 2017, 121, 17746–17755. [Google Scholar] [CrossRef]
- Damyanova, S.; Perez, C.; Schmal, M.; Bueno, J. Characterization of ceria-coated alumina carrier. Appl. Catal. A Gen. 2002, 234, 271–282. [Google Scholar] [CrossRef]
- Artiglia, L.; Orlando, F.; Roy, K.; Kopelent, R.; Safonova, O.V.; Nachtegaal, M.; Huthwelker, T.; Van Bokhoven, J.A. Introducing Time Resolution to Detect Ce3+ Catalytically Active Sites at the Pt/CeO2 Interface through Ambient Pressure X-ray Photoelectron Spectroscopy. J. Phys. Chem. Lett. 2017, 8, 102–108. [Google Scholar] [CrossRef]
- Gurgul, J.; Rinke, M.T.; Schellenberg, I.; Pöttgen, R. The antimonide oxides REZnSbO and REMnSbO (RE = Ce, Pr); An XPS study. Solid State Sci. 2013, 17, 122–127. [Google Scholar] [CrossRef]
Publisher’s Note: MDPI stays neutral with regard to jurisdictional claims in published maps and institutional affiliations. |
© 2020 by the authors. Licensee MDPI, Basel, Switzerland. This article is an open access article distributed under the terms and conditions of the Creative Commons Attribution (CC BY) license (http://creativecommons.org/licenses/by/4.0/).

