
Prediction of Human Papillomavirus (HPV) Association of Oropharyngeal Cancer (OPC) Using Radiomics: The Impact of the Variation of CT Scanner

 , and
, and 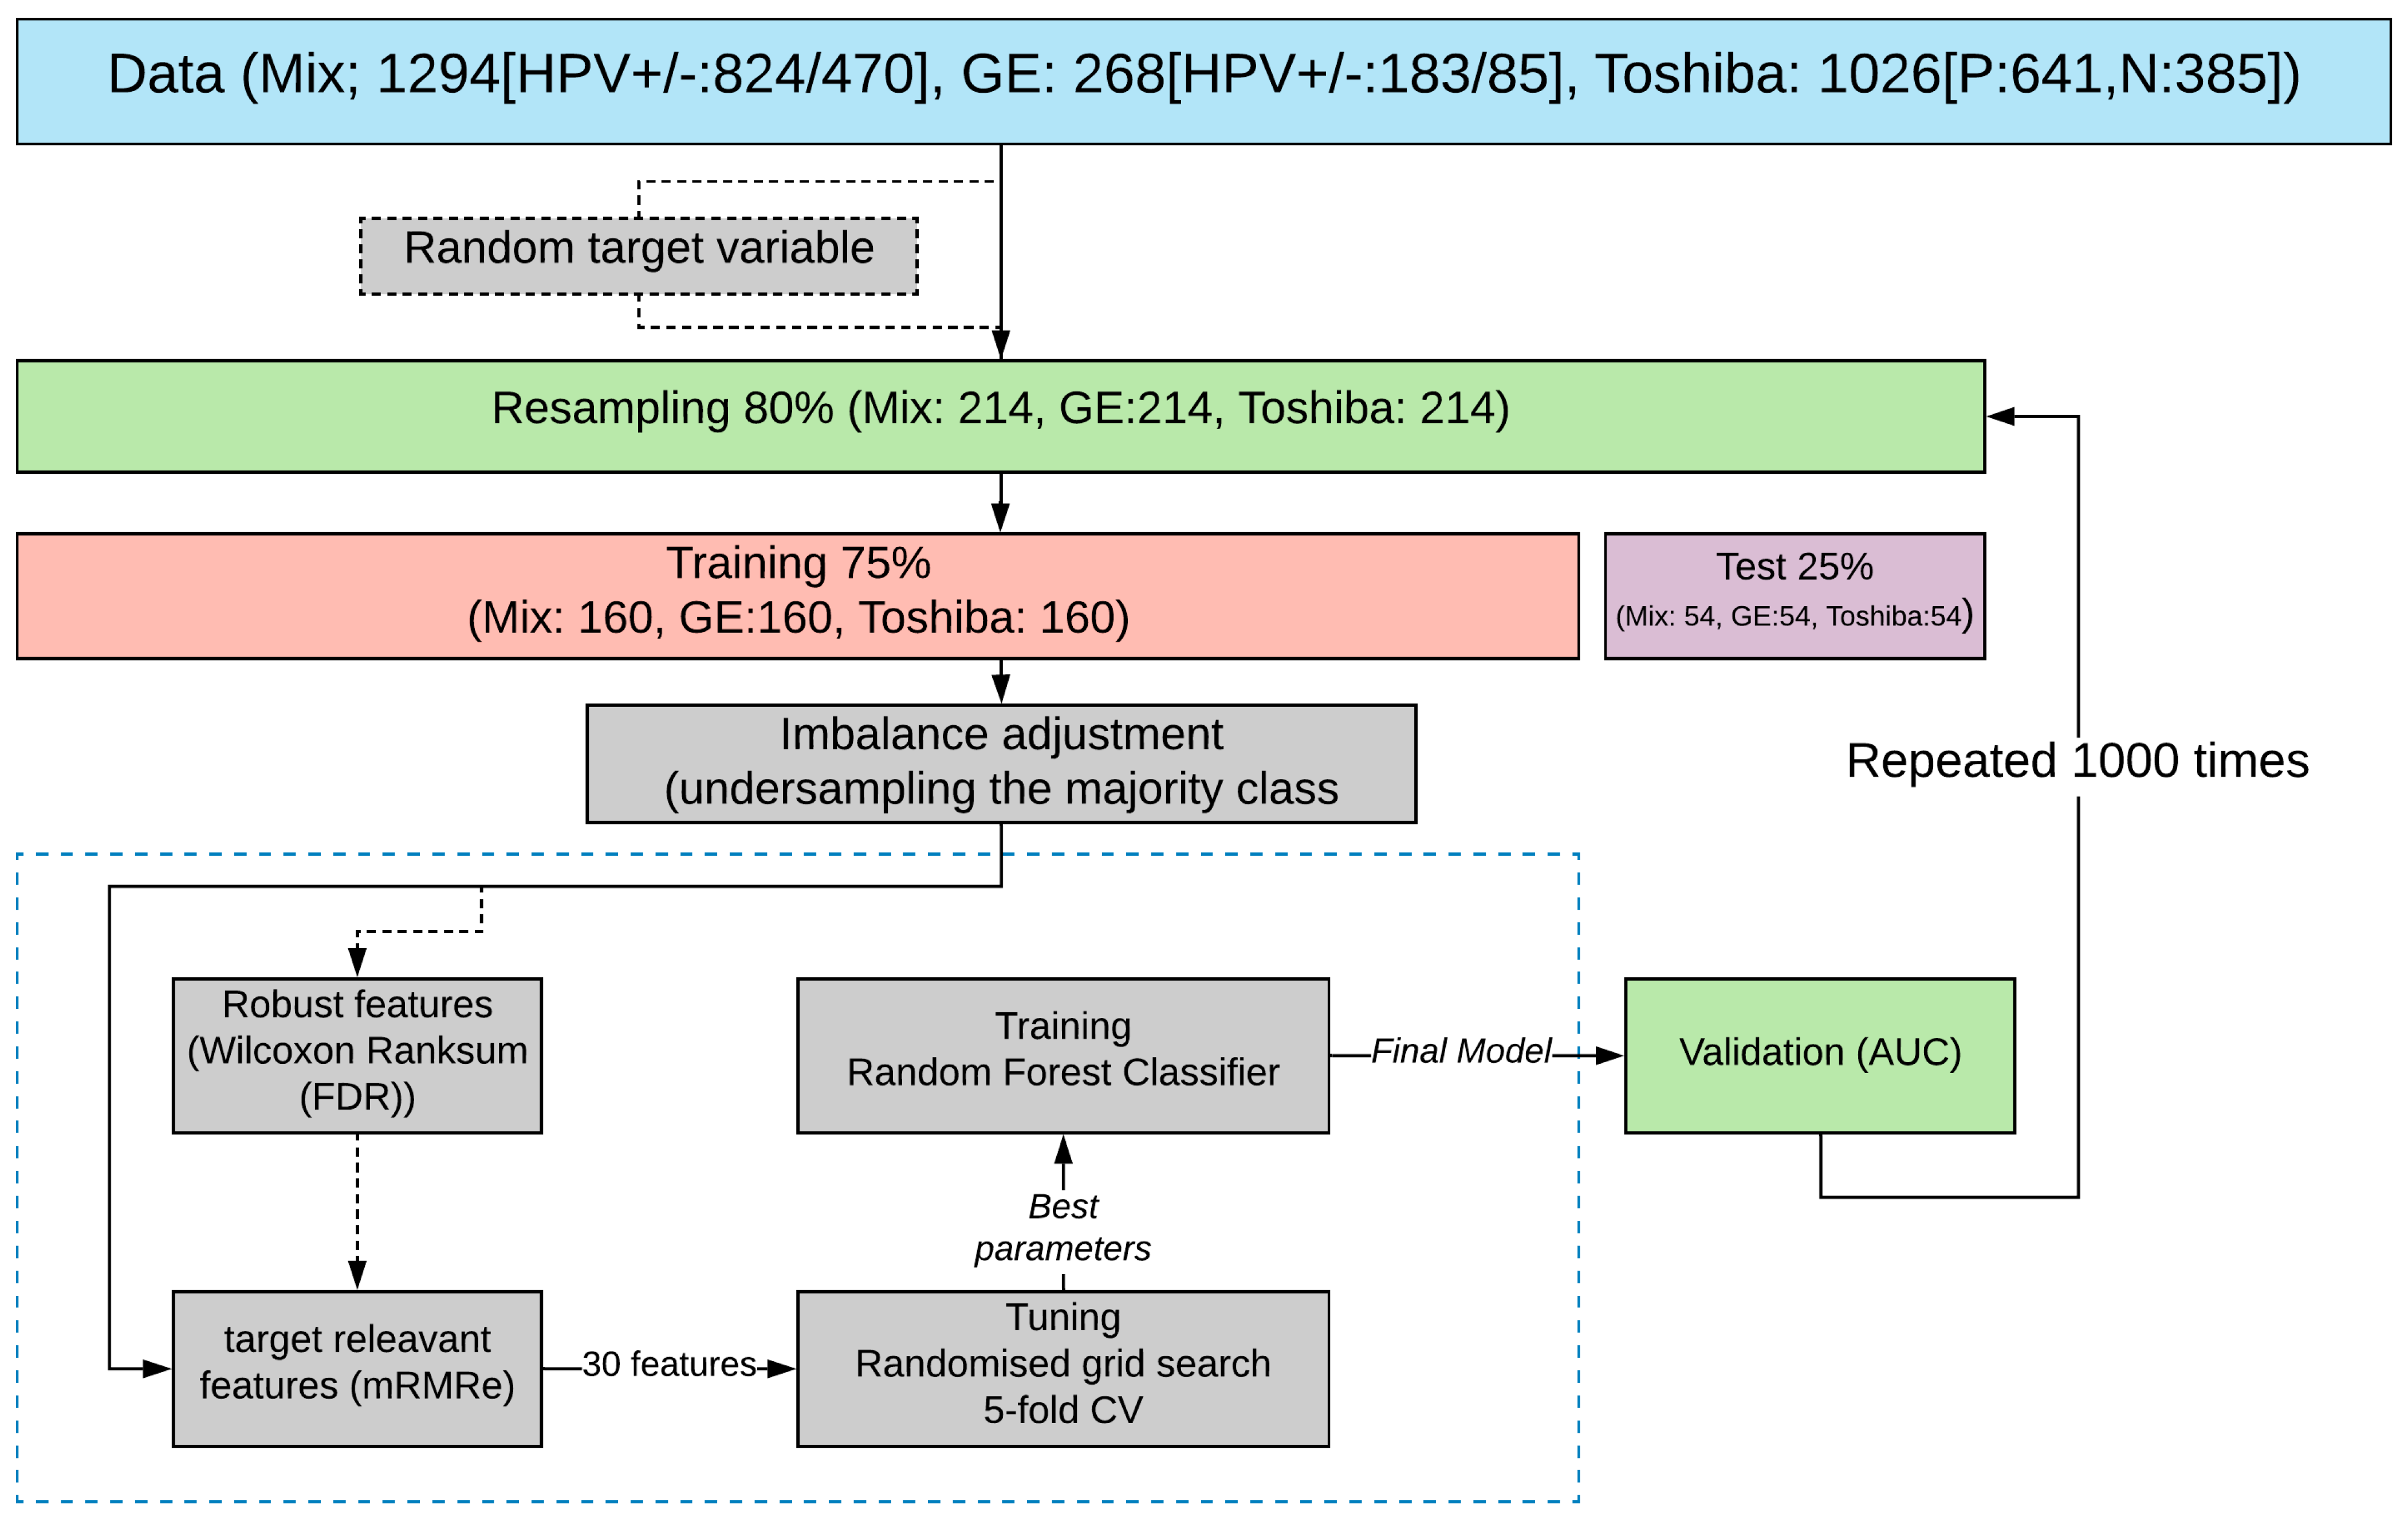
Abstract
Simple Summary
Abstract
1. Introduction
2. Methods
2.1. Dataset
2.2. Feature Extraction
2.3. Data Sampling and Splitting
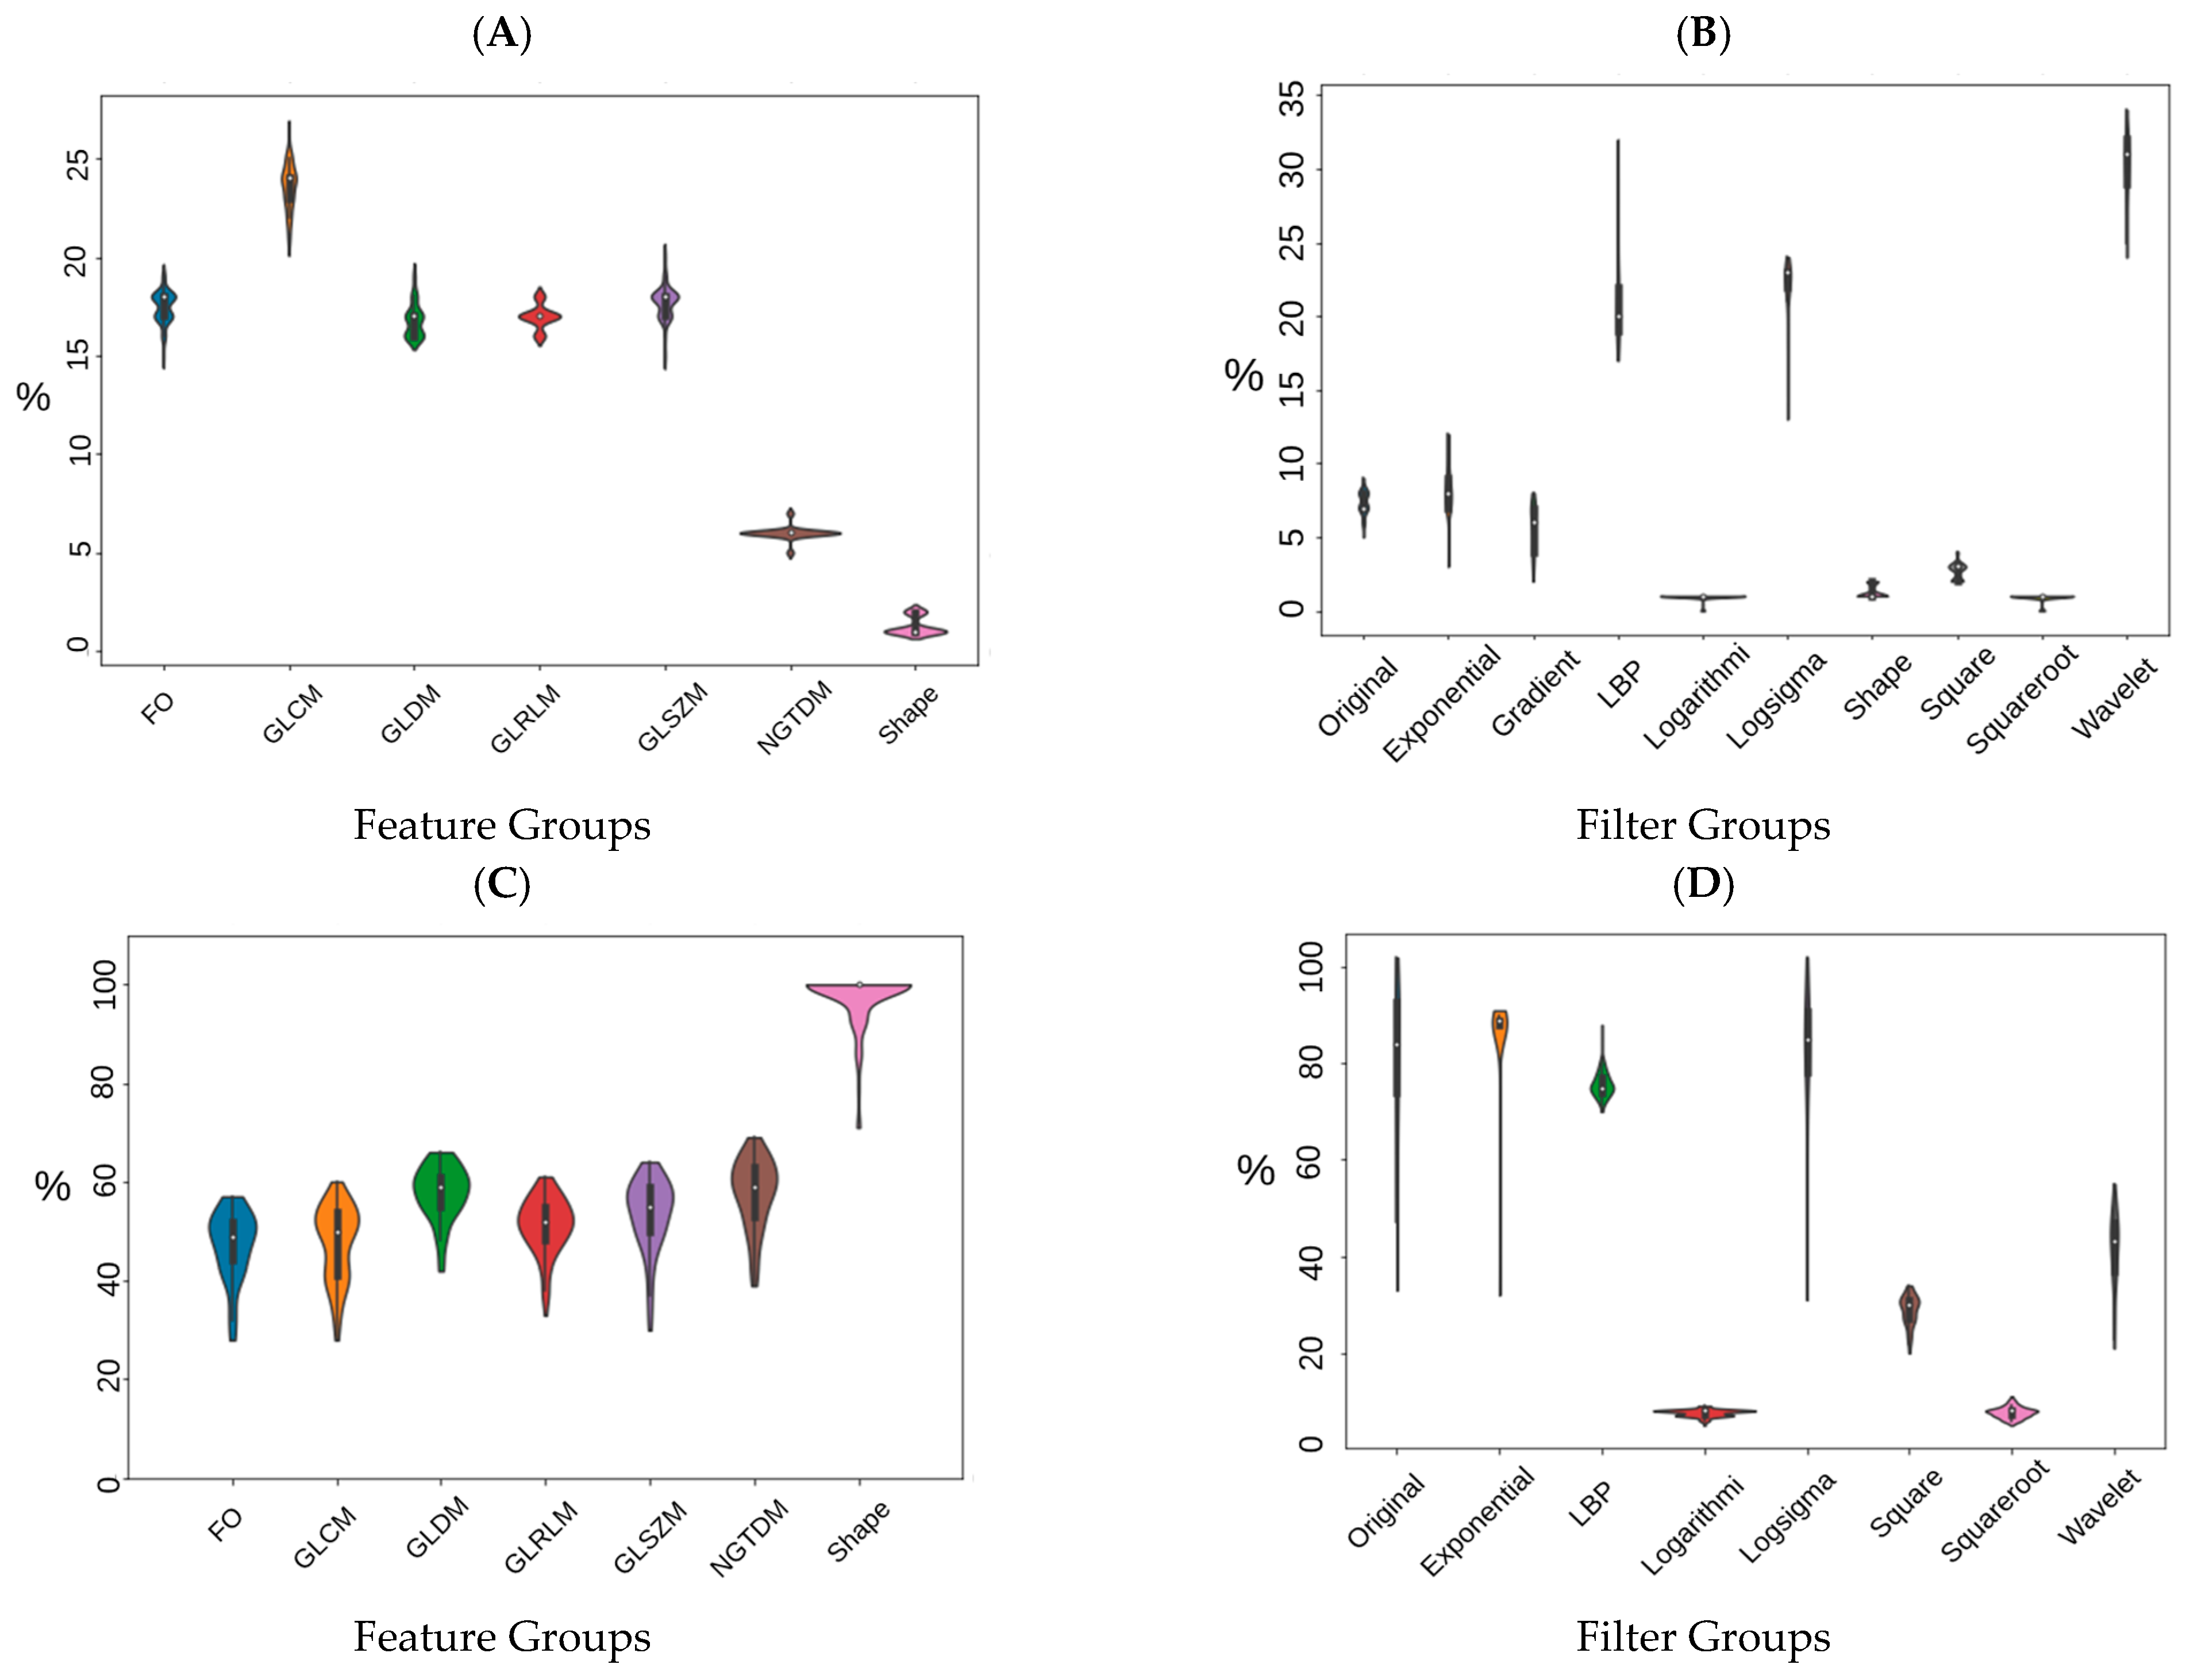
2.4. Reproducibility Analysis and Feature Selection
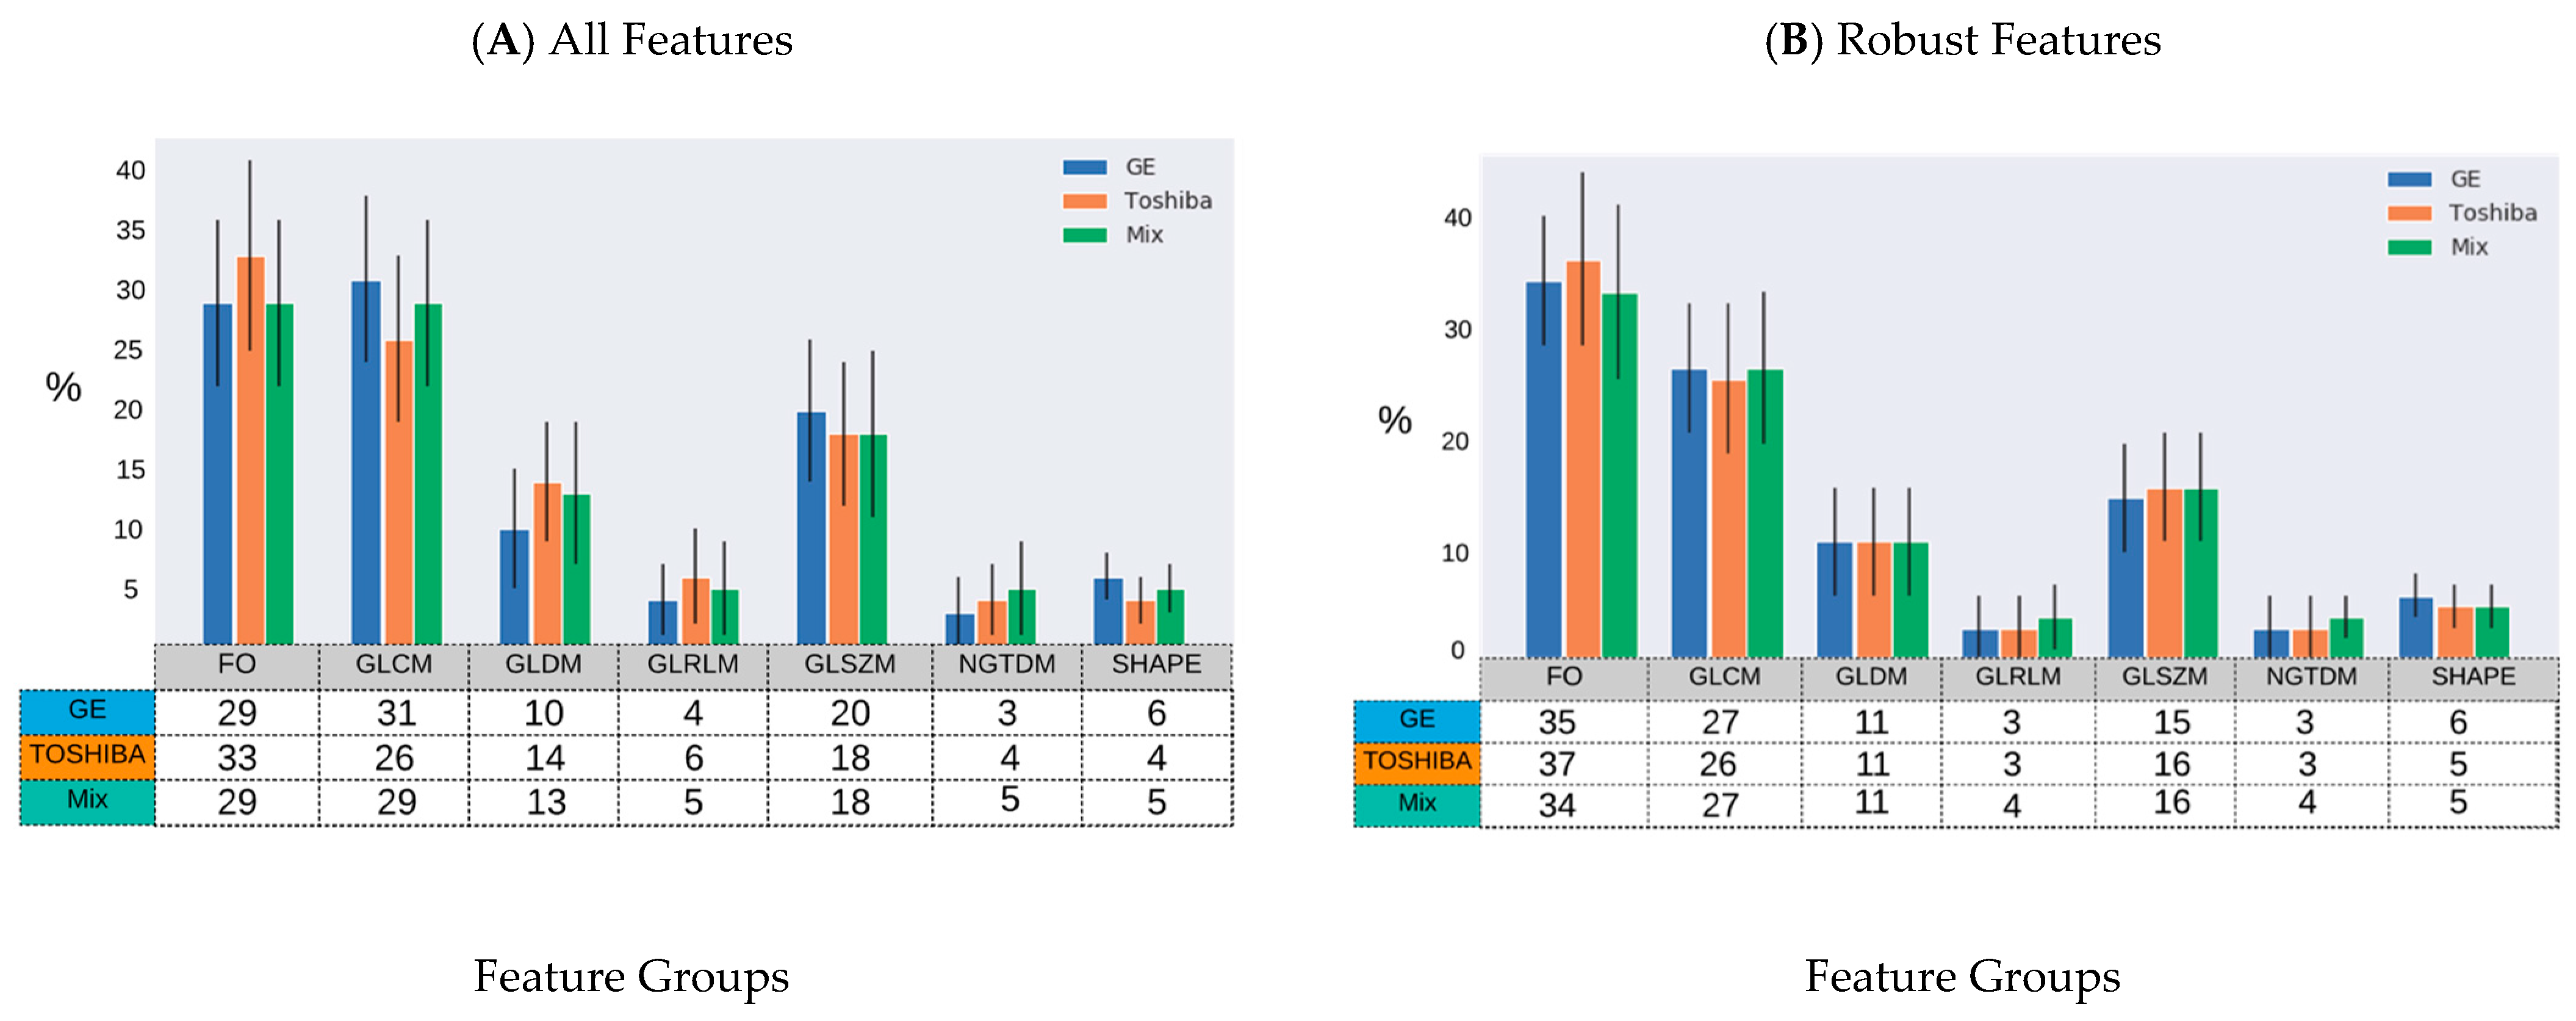
2.5. Feature Selection
2.6. Tuning and Training
3. Results
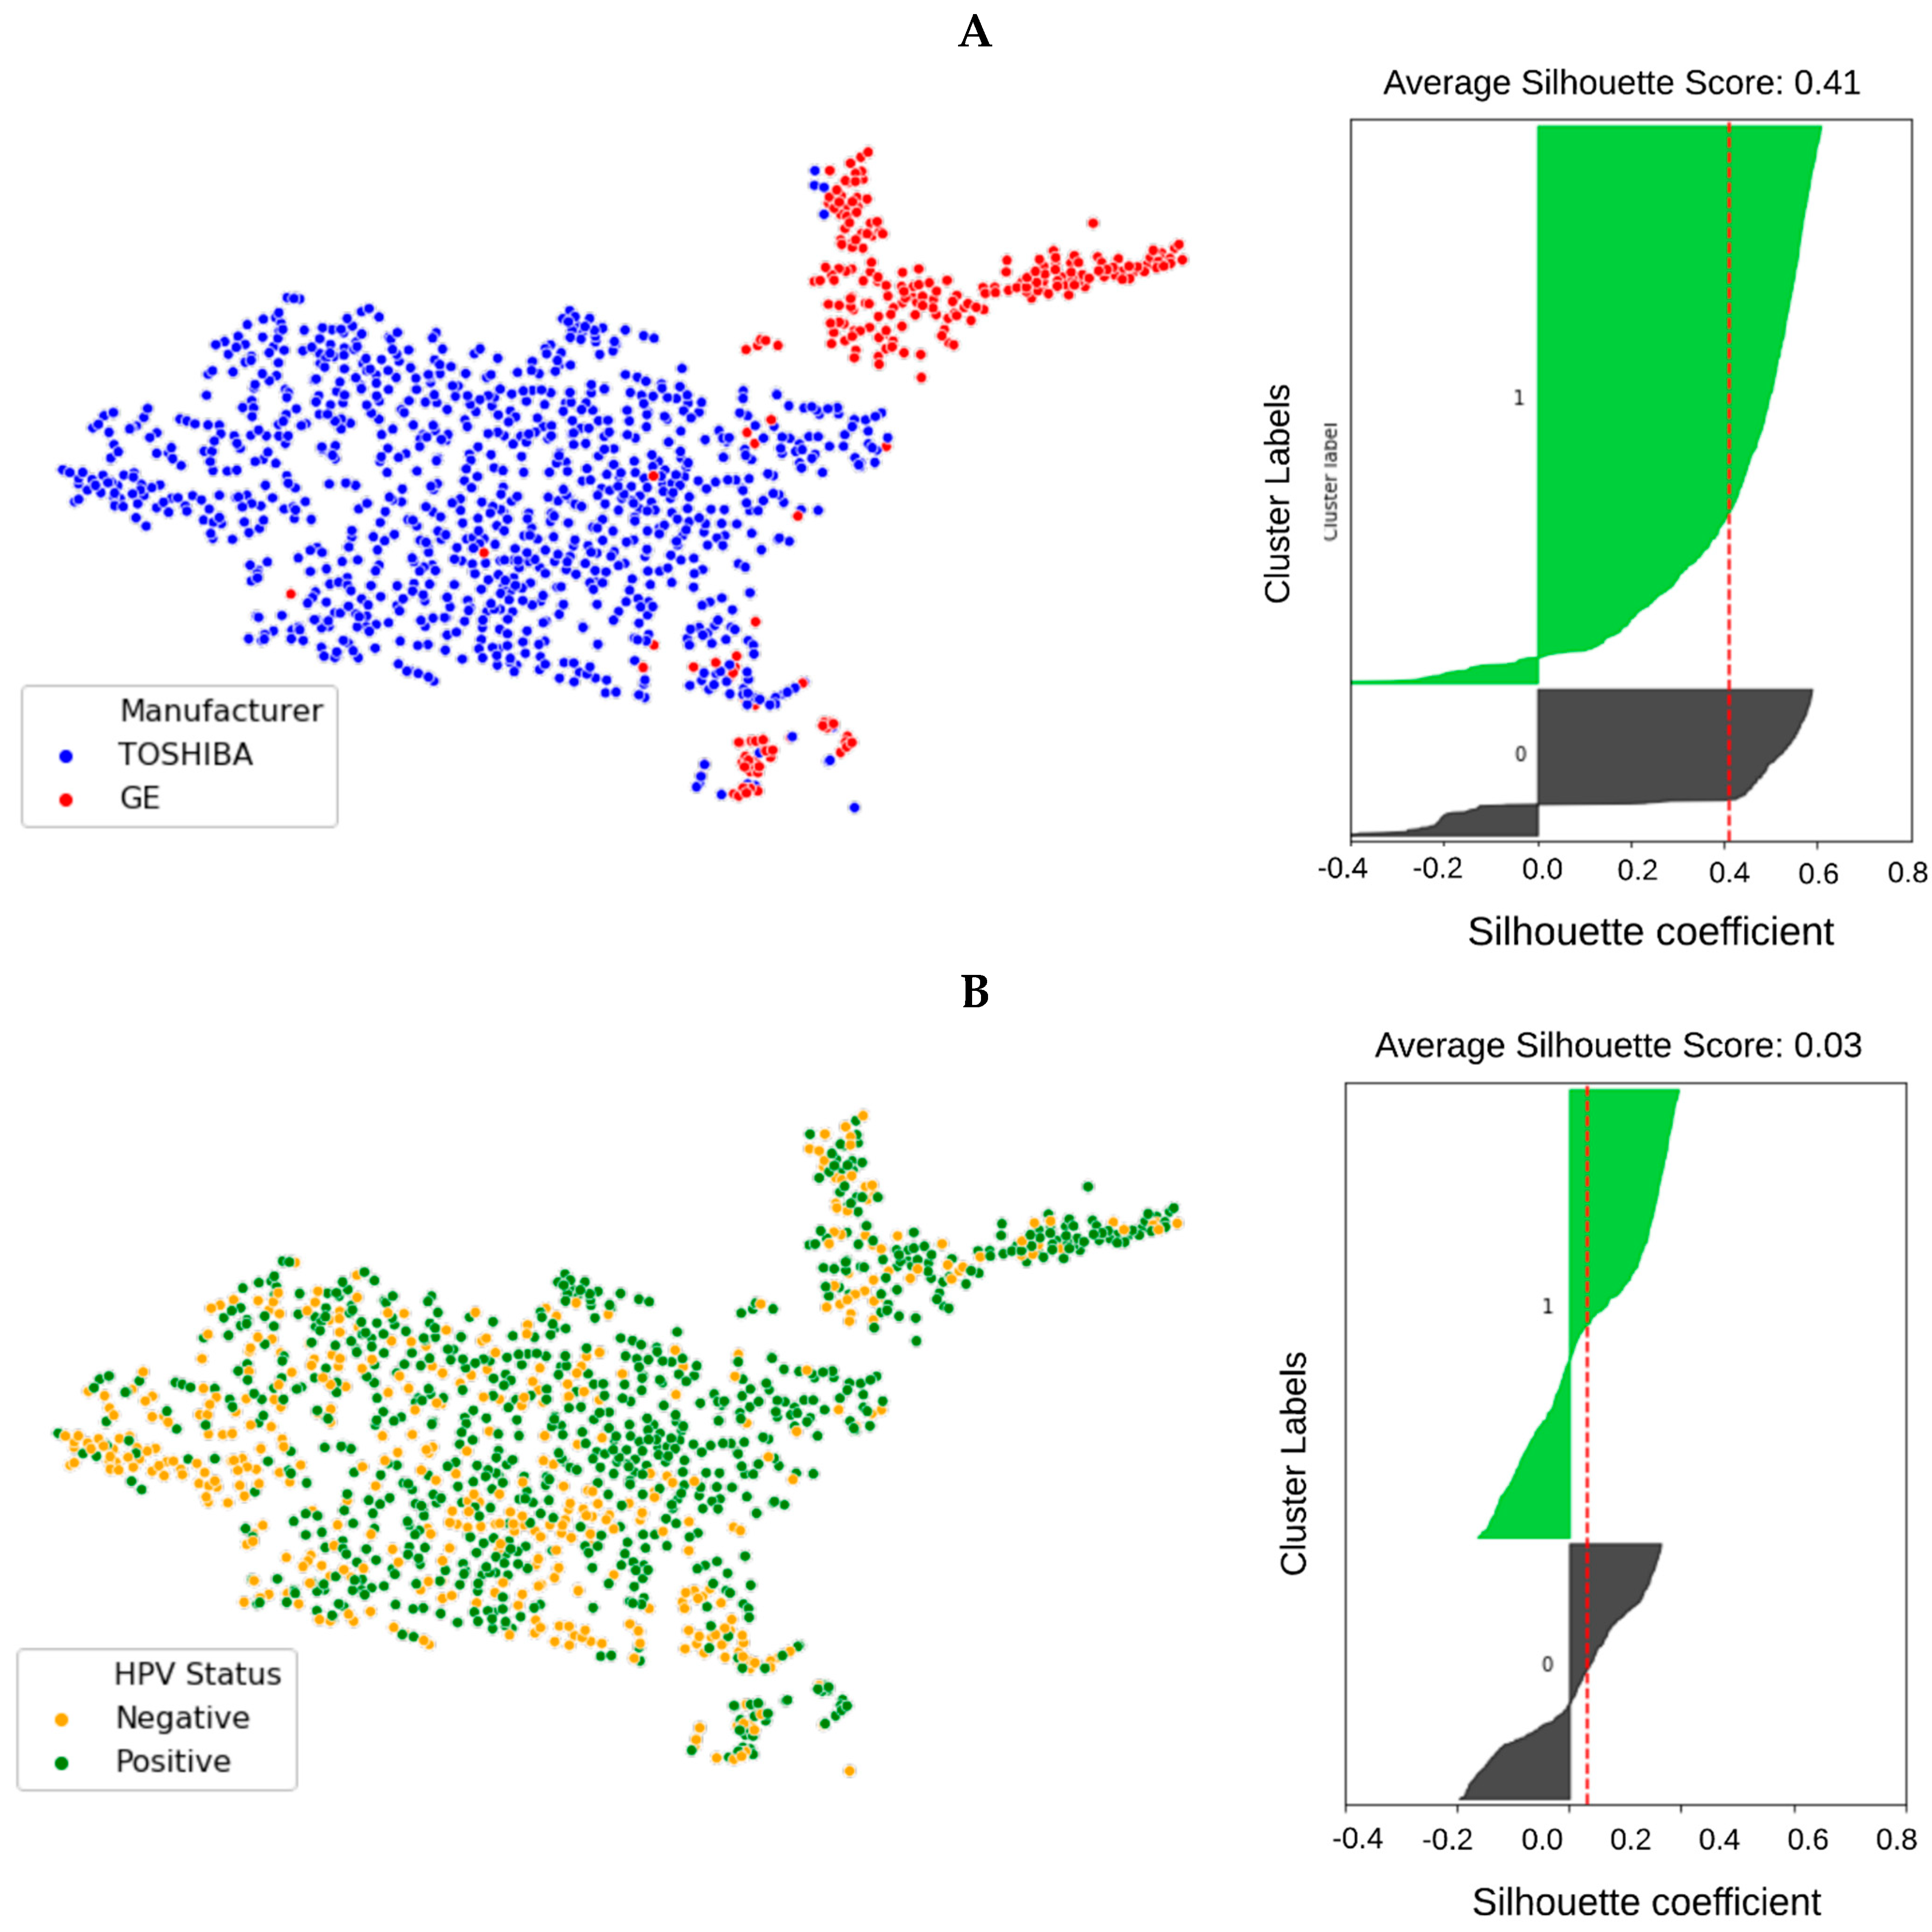
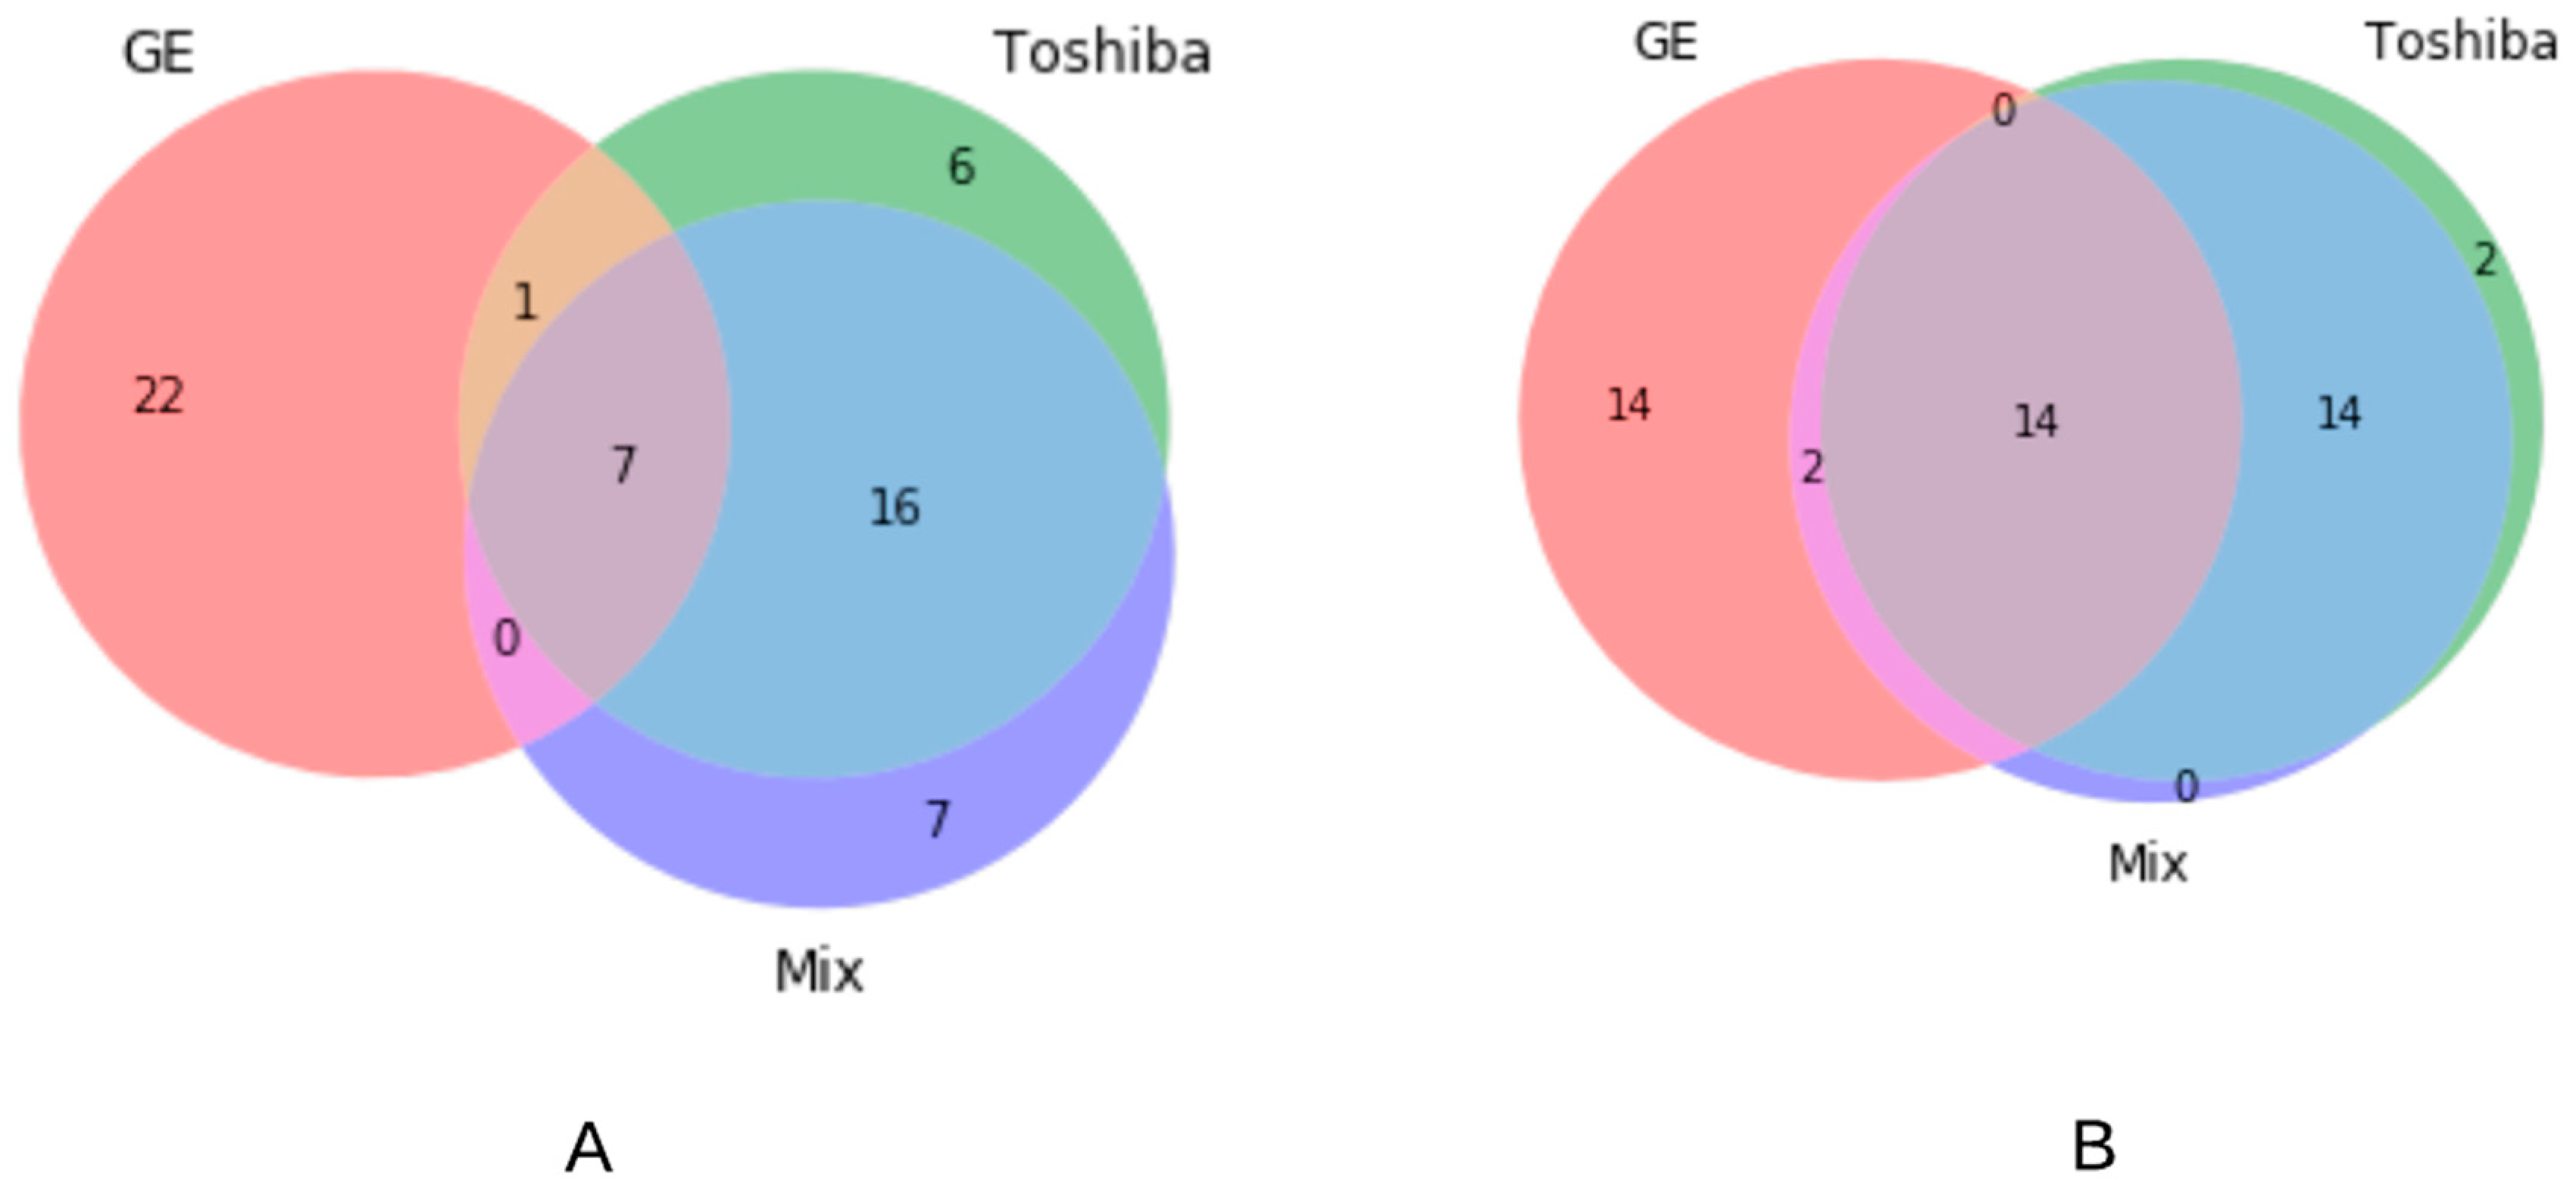
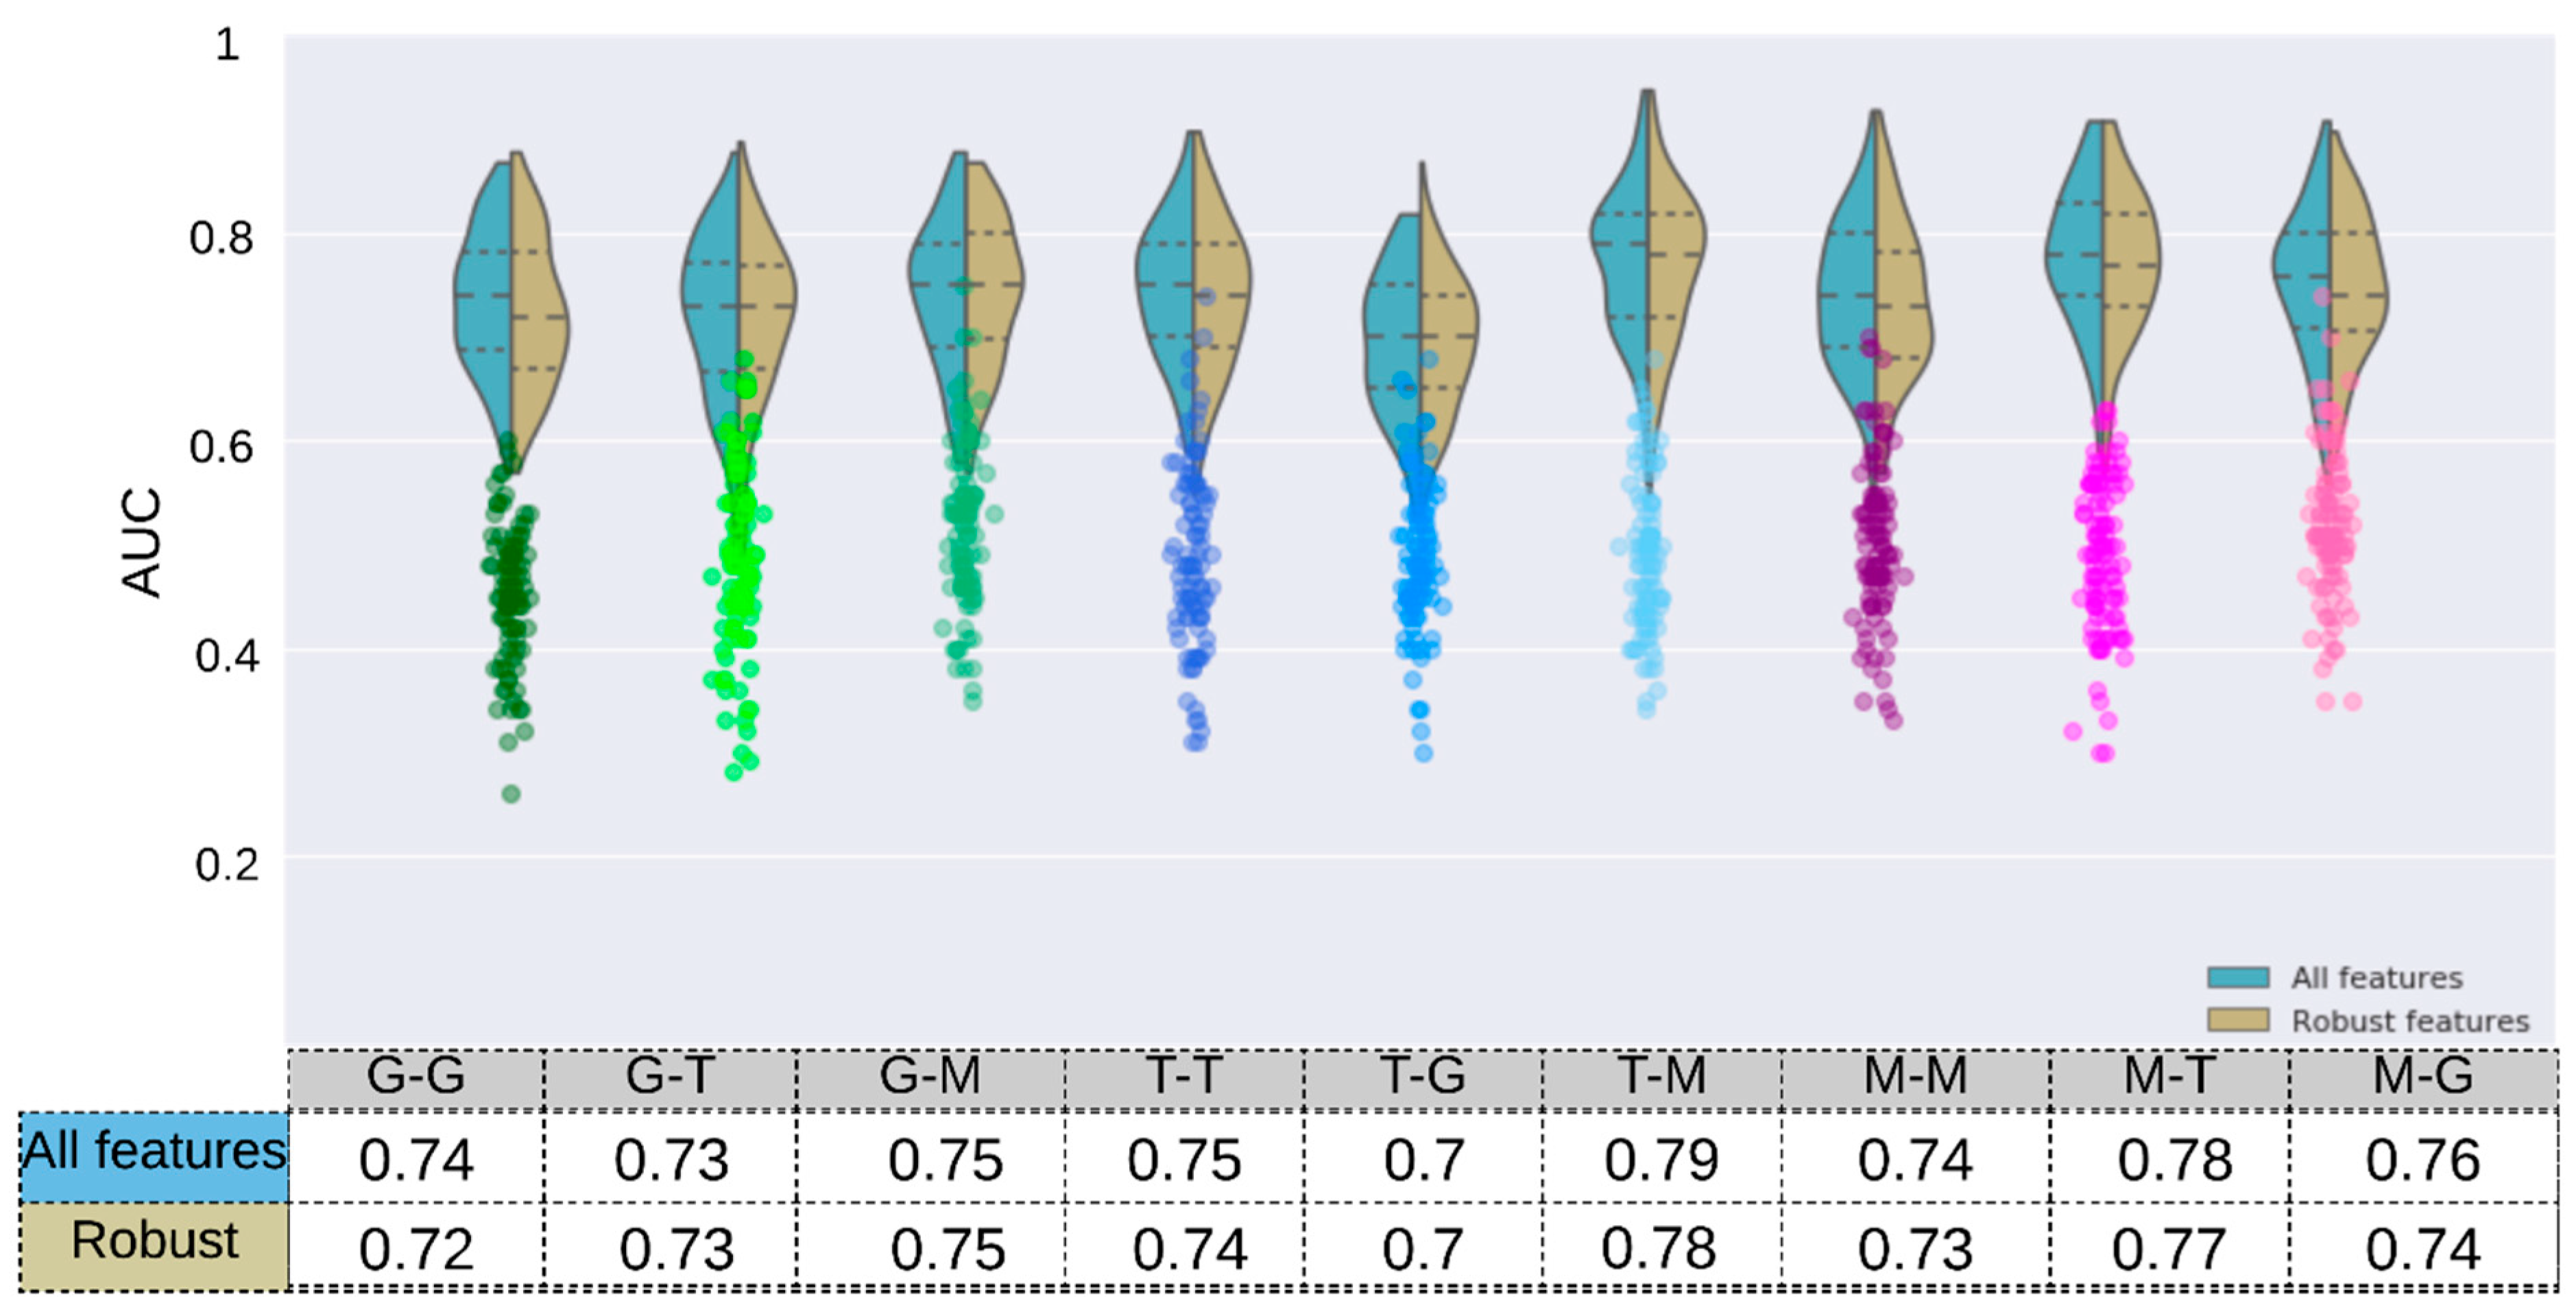
Scanner Grouping and Prediction of HPV Status
4. Discussion
5. Conclusions
Supplementary Materials
Author Contributions
Funding
Institutional Review Board Statement
Informed Consent Statement
Data Availability Statement
Conflicts of Interest
References
- Aerts, H.J.W.L.; Velazquez, E.R.; Leijenaar, R.T.H.; Parmar, C.; Grossmann, P.; Carvalho, S.; Bussink, J.; Monshouwer, R.; Haibe-Kains, B.; Rietveld, D.; et al. Decoding tumour phenotype by noninvasive imaging using a quantitative radiomics approach. Nat. Commun. 2014, 5, 4006. [Google Scholar] [CrossRef]
- McKinney, S.M.; Sieniek, M.; Godbole, V.; Godwin, J. International Evaluation of an AI System for Breast Cancer Screening. Nature 2020, 577, 89–94. Available online: https://www.nature.com/articles/s41586-019-1799-6 (accessed on 1 February 2021). [CrossRef]
- Lambin, P.; Rios-Velazquez, E.; Leijenaar, R.; Carvalho, S.; van Stiphout, R.G.; Granton, P.; Zegers, C.M.; Gillies, R.; Boellard, R.; Dekker, A.; et al. Radiomics: Extracting more information from medical images using advanced feature analysis. Eur. J. Cancer 2012, 48, 441–446. [Google Scholar] [CrossRef] [PubMed]
- Gillies, R.J.; Kinahan, P.E.; Hricak, H. Radiomics: Images Are More than Pictures, They Are Data. Radiology 2016, 278, 563–577. [Google Scholar] [CrossRef] [PubMed]
- Parekh, V.S.; Jacobs, M.A. Deep learning and radiomics in precision medicine. Expert Rev. Precis. Med. Drug Dev. 2019, 4, 59–72. [Google Scholar] [CrossRef]
- Vial, A.; Stirling, D.; Field, M.; Ros, M.; Ritz, C.; Carolan, M.; Holloway, L.; Miller, A.A. The role of deep learning and radiomic feature extraction in cancer-specific predictive modelling: A review. Transl. Cancer Res. 2018, 7, 803–816. [Google Scholar] [CrossRef]
- Choi, J.Y. Radiomics and Deep Learning in Clinical Imaging: What Should We Do? Nucl. Med. Mol. Imaging 2018, 52, 89–90. [Google Scholar] [CrossRef]
- Reiazi, R.; Abbas, E.; Famiyeh, P.; Rezaie, A.; Kwan, J.Y.; Patel, T.; Bratman, S.V.; Tadic, T.; Liu, F.-F.; Haibe-Kains, B. The impact of the variation of imaging parameters on the robustness of Computed Tomography Radiomic features: A review. Comput. Biol. Med. 2021, 133, 104400. [Google Scholar] [CrossRef]
- Haarburger, C.; Müller-Franzes, G.; Weninger, L.; Kuhl, C.; Truhn, D.; Merhof, D. Radiomics feature reproducibility under inter-rater variability in segmentations of CT images. Sci. Rep. 2020, 10, 12688. [Google Scholar] [CrossRef] [PubMed]
- Shafiq-Ul-Hassan, M.; Latifi, K.; Zhang, G.; Ullah, G.; Gillies, R.; Moros, E. Voxel size and gray level normalization of CT radiomic features in lung cancer. Sci. Rep. 2018, 8, 10545. [Google Scholar] [CrossRef] [PubMed]
- Park, J.E.; Kim, H.S.; Kim, D.; Park, S.Y.; Kim, J.Y.; Cho, S.J.; Kim, J.H. A systematic review reporting quality of radiomics research in neuro-oncology: Toward clinical utility and quality improvement using high-dimensional imaging features. BMC Cancer 2020. [Google Scholar] [CrossRef] [PubMed]
- Yamashita, R.; Perrin, T.; Chakraborty, J.; Chou, J.F.; Horvat, N.; Koszalka, M.A.; Midya, A.; Gonen, M.; Allen, P.; Jarnagin, W.R.; et al. Radiomic feature reproducibility in contrast-enhanced CT of the pancreas is affected by variabilities in scan parameters and manual segmentation. Eur. Radiol. 2019. [Google Scholar] [CrossRef]
- Choe, J.; Lee, S.M.; Do, K.-H.; Lee, G.; Lee, J.-G.; Seo, J.B. Deep Learning-based Image Conversion of CT Reconstruction Kernels Improves Radiomics Reproducibility for Pulmonary Nodules or Masses. Radiology 2019, 292, 365–373. [Google Scholar] [CrossRef]
- Mackin, D.; Fave, X.; Zhang, L.; Fried, D.; Yang, J.; Taylor, B.; Rodriguez-Rivera, E.; Dodge, C.; Jones, A.K.; Court, L. Measuring Computed Tomography Scanner Variability of Radiomics Features. Investig. Radiol. 2015, 50, 757–765. [Google Scholar] [CrossRef]
- Andrearczyk, V.; Depeursinge, A.; Müller, H. Neural network training for cross-protocol radiomic feature standardization in computed tomography. J. Med. Imaging 2019, 6, 024008. [Google Scholar] [CrossRef]
- Bogowicz, M.; Riesterer, O.; Ikenberg, K.; Stieb, S.; Moch, H.; Studer, G.; Guckenberger, M.; Tanadini-Lang, S. Computed Tomography Radiomics Predicts HPV Status and Local Tumor Control After Definitive Radiochemotherapy in Head and Neck Squamous Cell Carcinoma. Int. J. Radiat. Oncol. Biol. Phys. 2017, 99, 921–928. [Google Scholar] [CrossRef] [PubMed]
- Yu, K.; Zhang, Y.; Yu, Y.; Huang, C.; Liu, R.; Li, T.; Yang, L.; Morris, J.S.; Baladandayuthapani, V.; Zhu, H. Radiomic analysis in prediction of Human Papilloma Virus status. Clin. Transl. Radiat. Oncol. 2017, 7, 49–54. [Google Scholar] [CrossRef] [PubMed]
- Ravanelli, M.; Grammatica, A.; Tononcelli, E.; Morello, R.; Leali, M.; Battocchio, S.; Agazzi, G.; di Monale E Bastia, M.B.; Maroldi, R.; Nicolai, P.; et al. Correlation between Human Papillomavirus Status and Quantitative MR Imaging Parameters including Diffusion-Weighted Imaging and Texture Features in Oropharyngeal Carcinoma. Am. J. Neuroradiol. 2018, 39, 1878–1883. [Google Scholar] [CrossRef]
- Leijenaar, R.T.; Bogowicz, M.; Jochems, A.; Hoebers, F.J.; Wesseling, F.W.; Huang, S.H.; Chan, B.; Waldron, J.N.; O’Sullivan, B.; Rietveld, D.; et al. Development and validation of a radiomic signature to predict HPV (p16) status from standard CT imaging: A multicenter study. Br. J. Radiol. 2018, 91, 20170498. [Google Scholar] [CrossRef]
- Bagher-Ebadian, H.; Lu, M.; Siddiqui, F.; Ghanem, A.I.; Wen, N.; Wu, Q.; Liu, C.; Movsas, B.; Chetty, I.J. Application of radiomics for the prediction of HPV status for patients with head and neck cancers. Med. Phys. 2020, 47, 563–575. [Google Scholar] [CrossRef]
- Bratman, S.V.; Bruce, J.P.; O’Sullivan, B.; Pugh, T.J.; Xu, W.; Yip, K.W.; Liu, F.-F. Human Papillomavirus Genotype Association with Survival in Head and Neck Squamous Cell Carcinoma. JAMA Oncol. 2016, 2, 823–826. [Google Scholar] [CrossRef]
- Fakhry, C.; Westra, W.H.; Li, S.; Cmelak, A.; Ridge, J.A.; Pinto, H.; Forastiere, A.; Gillison, M.L. Improved Survival of Patients with Human Papillomavirus-Positive Head and Neck Squamous Cell Carcinoma in a Prospective Clinical Trial. JNCI J. Natl. Cancer Inst. 2008, 100, 261–269. [Google Scholar] [CrossRef]
- Lang, D.M.; Peeken, J.C.; Combs, S.E.; Wilkens, J.J.; Bartzsch, S. Deep Learning Based HPV Status Prediction for Oropharyngeal Cancer Patients. Cancers 2021, 13, 786. [Google Scholar] [CrossRef] [PubMed]
- Van Griethuysen, J.J.; Fedorov, A.; Parmar, C.; Hosny, A.; Aucoin, N.; Narayan, V.; Beets-Tan, R.G.; Fillion-Robin, J.-C.; Pieper, S.; Aerts, H.J. Computational Radiomics System to Decode the Radiographic Phenotype. Cancer Res. 2017, 77, e104–e107. [Google Scholar] [CrossRef]
- Haralick, R.M.; Shanmugam, K.; Dinstein, I. Textural Features for Image Classification. IEEE Trans. Syst. Man Cybern. 1973, SMC-3, 610–621. [Google Scholar] [CrossRef]
- Galloway, M.M. Texture analysis using gray level run lengths. Comput. Graph. Image Process. 1975, 4, 172–179. [Google Scholar] [CrossRef]
- Rizzo, S.; Botta, F.; Raimondi, S.; Origgi, D.; Fanciullo, C.; Morganti, A.G.; Bellomi, M. Radiomics: The facts and the challenges of image analysis. Eur. Radiol. Exp. 2018, 2, 36. [Google Scholar] [CrossRef]
- Benjamini, Y.; Hochberg, Y. Controlling the false discovery rate: A practical and powerful approach to multiple testing. J. R. Stat. Soc. 1995, 57, 289–300. Available online: https://rss.onlinelibrary.wiley.com/doi/abs/10.1111/j.2517-6161.1995.tb02031.x (accessed on 1 February 2020). [CrossRef]
- De Jay, N.; Papillon-Cavanagh, S.; Olsen, C.; El-Hachem, N.; Bontempi, G.; Haibe-Kains, B. mRMRe: An R package for parallelized mRMR ensemble feature selection. Bioinformatics 2013, 29, 2365–2368. [Google Scholar] [CrossRef]
- Yasaka, K.; Akai, H.; Mackin, D.; Court, L.; Moros, E.; Ohtomo, K.; Kiryu, S. Precision of quantitative computed tomography texture analysis using image filtering: A phantom study for scanner variability. Medicine 2017, 96, e6993. [Google Scholar] [CrossRef] [PubMed]
- Varghese, B.A.; Hwang, D.; Cen, S.Y.; Levy, J.; Liu, D.; Lau, C.; Rivas, M.; Desai, B.; Goodenough, D.J.; Duddalwar, V.A. Reliability of CT-based texture features: Phantom study. J. Appl. Clin. Med. Phys. 2019, 20, 155–163. [Google Scholar] [CrossRef] [PubMed]
- Shafiq-Ul-Hassan, M.; Zhang, G.G.; Hunt, D.C.; Latifi, K.; Ullah, G.; Gillies, R.J.; Moros, E.G. Accounting for reconstruction kernel-induced variability in CT radiomic features using noise power spectra. J. Med. Imaging 2017, 5, 011013. [Google Scholar] [CrossRef] [PubMed]
- Perrin, T.; Midya, A.; Yamashita, R.; Chakraborty, J.; Saidon, T.; Jarnagin, W.R.; Gonen, M.; Simpson, A.L.; Do, R.K.G. Short-term reproducibility of radiomic features in liver parenchyma and liver malignancies on contrast-enhanced CT imaging. Abdom. Radiol. 2018, 43, 3271–3278. [Google Scholar] [CrossRef] [PubMed]
- Duda, D.; Kretowski, M.; Bezy-Wendling, J. Effect of Slice Thickness on Texture-Based Classification of Liver Dynamic CT Scans. In Computer Information Systems and Industrial Management; Springer: Berlin/Heidelberg, Germany, 2013; pp. 96–107. [Google Scholar]
- Midya, A.; Chakraborty, J.; Gönen, M.; Do, R.K.G.; Simpson, A.L. Influence of CT acquisition and reconstruction parameters on radiomic feature reproducibility. J. Med. Imaging 2018, 5, 011020. [Google Scholar] [CrossRef]
- Amadasun, M.; King, R. Textural features corresponding to textural properties. IEEE Trans. Syst. Man Cybern. 1989, 19, 1264–1274. [Google Scholar] [CrossRef]
- Soufi, M.; Arimura, H.; Nagami, N. Identification of optimal mother wavelets in survival prediction of lung cancer patients using wavelet decomposition-based radiomic features. Med. Phys. 2018, 45, 5116–5128. [Google Scholar] [CrossRef] [PubMed]
- Mahon, R.N.; Ghita, M.; Hugo, G.D.; Weiss, E. ComBat harmonization for radiomic features in independent phantom and lung cancer patient computed tomography datasets. Phys. Med. Biol. 2020, 65, 015010. [Google Scholar] [CrossRef]
- Berenguer, R.; Pastor-Juan, M.D.R.; Canales-Vázquez, J.; Castro-García, M.; Villas, M.V.; Legorburo, F.M.; Sabater, S. Radiomics of CT Features May Be Nonreproducible and Redundant: Influence of CT Acquisition Parameters. Radiology 2018, 288, 407–415. [Google Scholar] [CrossRef] [PubMed]
- Kakino, R.; Nakamura, M.; Mitsuyoshi, T.; Shintani, T.; Hirashima, H.; Matsuo, Y.; Mizowaki, T. Comparison of radiomic features in diagnostic CT images with and without contrast enhancement in the delayed phase for NSCLC patients. Phys. Med. 2020, 69, 176–182. [Google Scholar] [CrossRef] [PubMed]


Publisher’s Note: MDPI stays neutral with regard to jurisdictional claims in published maps and institutional affiliations. |
© 2021 by the authors. Licensee MDPI, Basel, Switzerland. This article is an open access article distributed under the terms and conditions of the Creative Commons Attribution (CC BY) license (https://creativecommons.org/licenses/by/4.0/).
Share and Cite
Reiazi, R.; Arrowsmith, C.; Welch, M.; Abbas-Aghababazadeh, F.; Eeles, C.; Tadic, T.; Hope, A.J.; Bratman, S.V.; Haibe-Kains, B. Prediction of Human Papillomavirus (HPV) Association of Oropharyngeal Cancer (OPC) Using Radiomics: The Impact of the Variation of CT Scanner. Cancers 2021, 13, 2269. https://doi.org/10.3390/cancers13092269
Reiazi R, Arrowsmith C, Welch M, Abbas-Aghababazadeh F, Eeles C, Tadic T, Hope AJ, Bratman SV, Haibe-Kains B. Prediction of Human Papillomavirus (HPV) Association of Oropharyngeal Cancer (OPC) Using Radiomics: The Impact of the Variation of CT Scanner. Cancers. 2021; 13(9):2269. https://doi.org/10.3390/cancers13092269
Chicago/Turabian StyleReiazi, Reza, Colin Arrowsmith, Mattea Welch, Farnoosh Abbas-Aghababazadeh, Christopher Eeles, Tony Tadic, Andrew J. Hope, Scott V. Bratman, and Benjamin Haibe-Kains. 2021. "Prediction of Human Papillomavirus (HPV) Association of Oropharyngeal Cancer (OPC) Using Radiomics: The Impact of the Variation of CT Scanner" Cancers 13, no. 9: 2269. https://doi.org/10.3390/cancers13092269
APA StyleReiazi, R., Arrowsmith, C., Welch, M., Abbas-Aghababazadeh, F., Eeles, C., Tadic, T., Hope, A. J., Bratman, S. V., & Haibe-Kains, B. (2021). Prediction of Human Papillomavirus (HPV) Association of Oropharyngeal Cancer (OPC) Using Radiomics: The Impact of the Variation of CT Scanner. Cancers, 13(9), 2269. https://doi.org/10.3390/cancers13092269