Prediction Equations to Estimate Resting Metabolic Rate in Healthy, Community-Dwelling Chinese Older Adults
 , and
, and
Abstract
1. Introduction
2. Materials and Methods
2.1. Study Design and Participants
2.2. Measurements
2.3. Published RMR Prediction Equations
2.4. Statistical Analysis
3. Results
3.1. Subject Characteristics
3.2. RMR Prediction Equations from the Development Subsample
3.3. Assessment of Uncertainty and Dispersion in the Study Samples
3.4. Comparison of RMR Prediction Equations with the Measured RMR
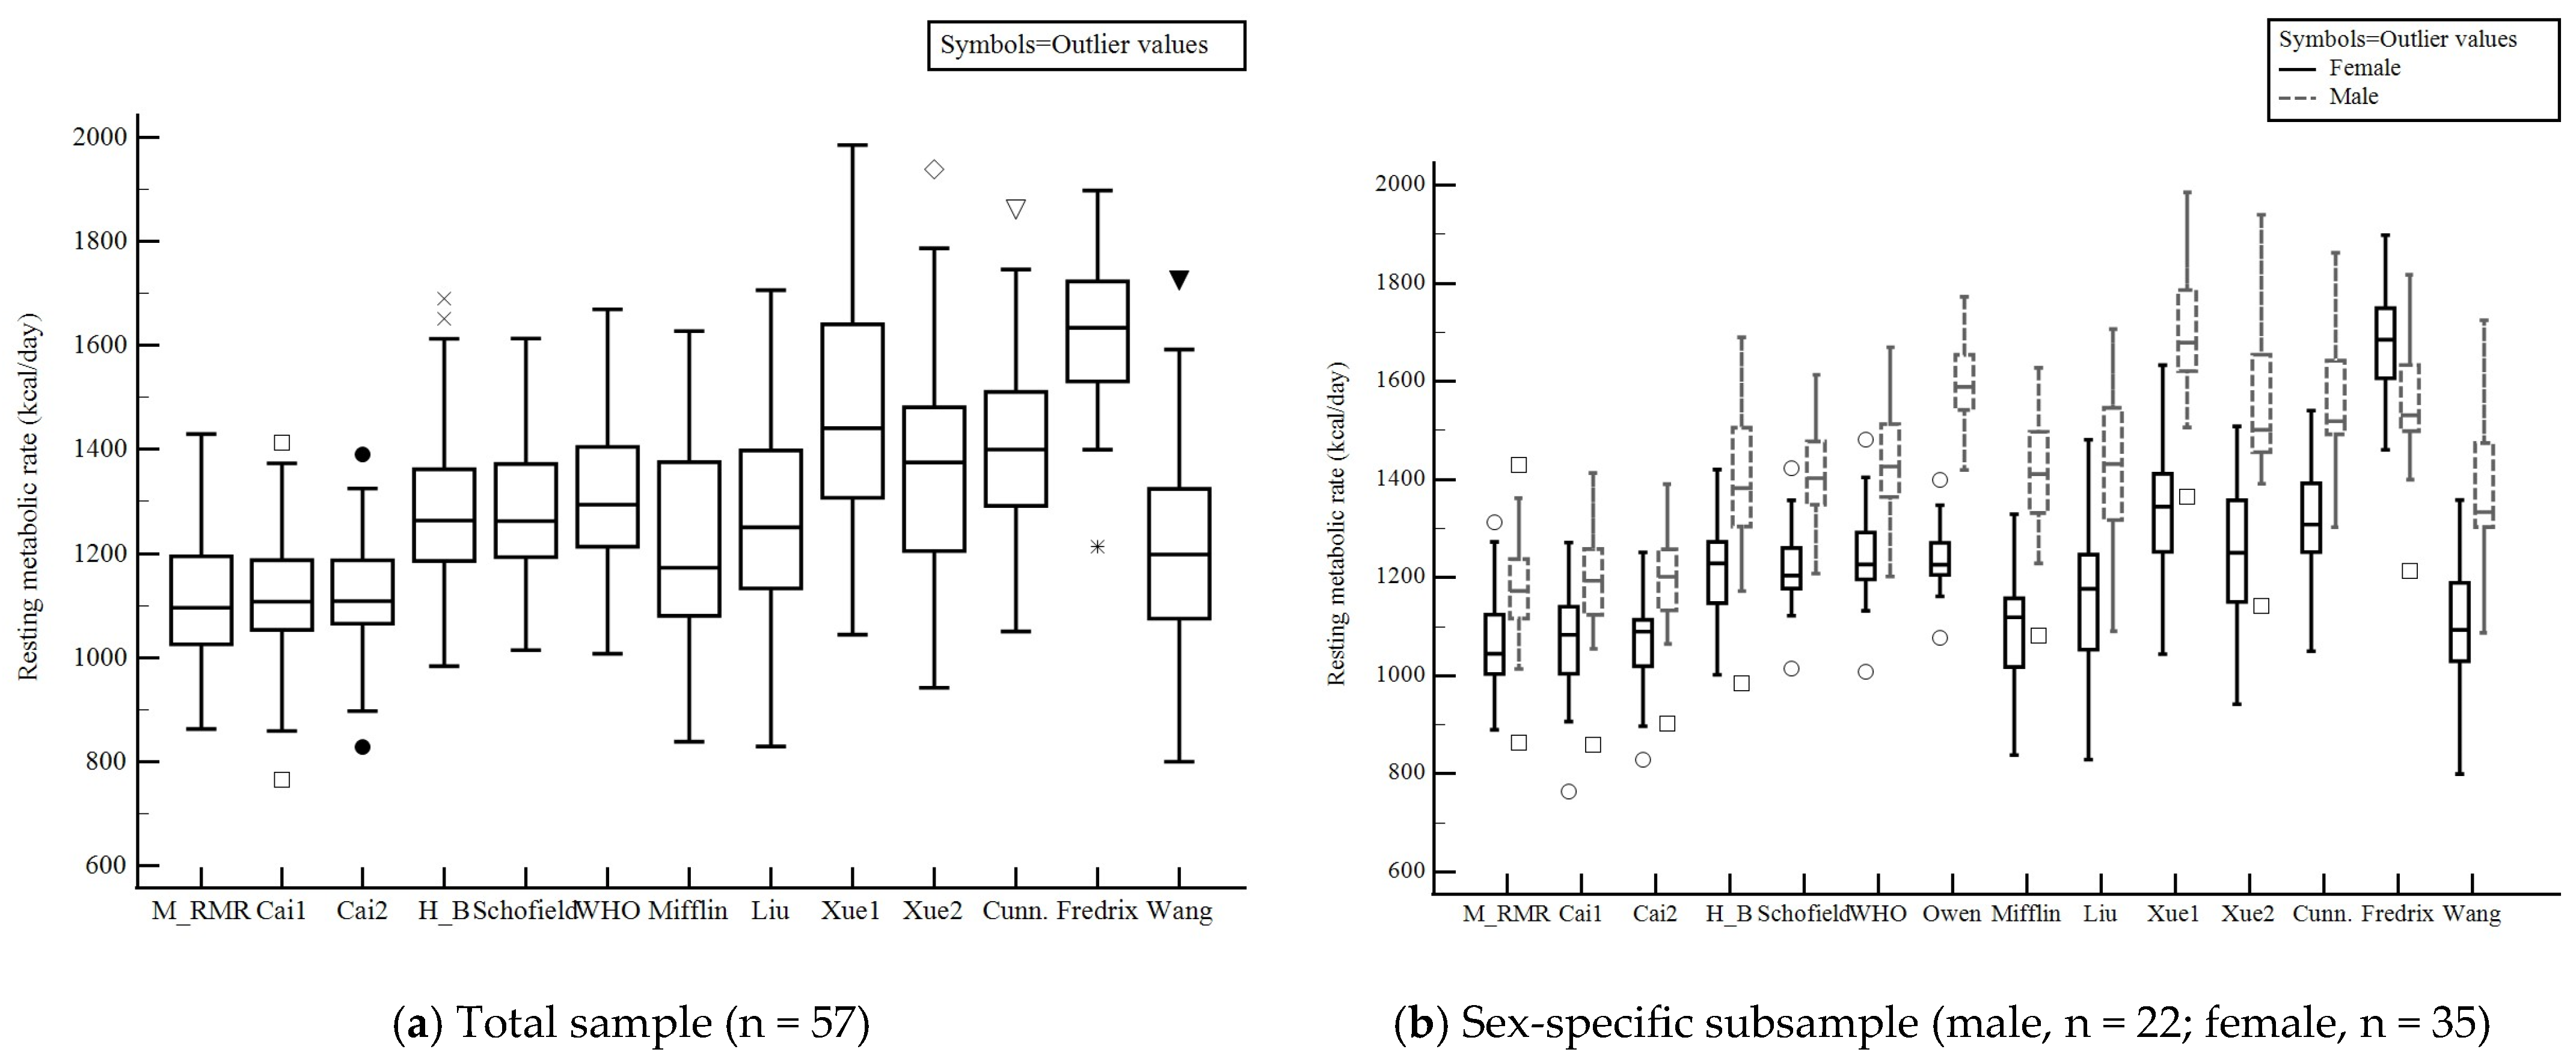
3.5. Box-And-Whisker Plots to Visualize RMR Values
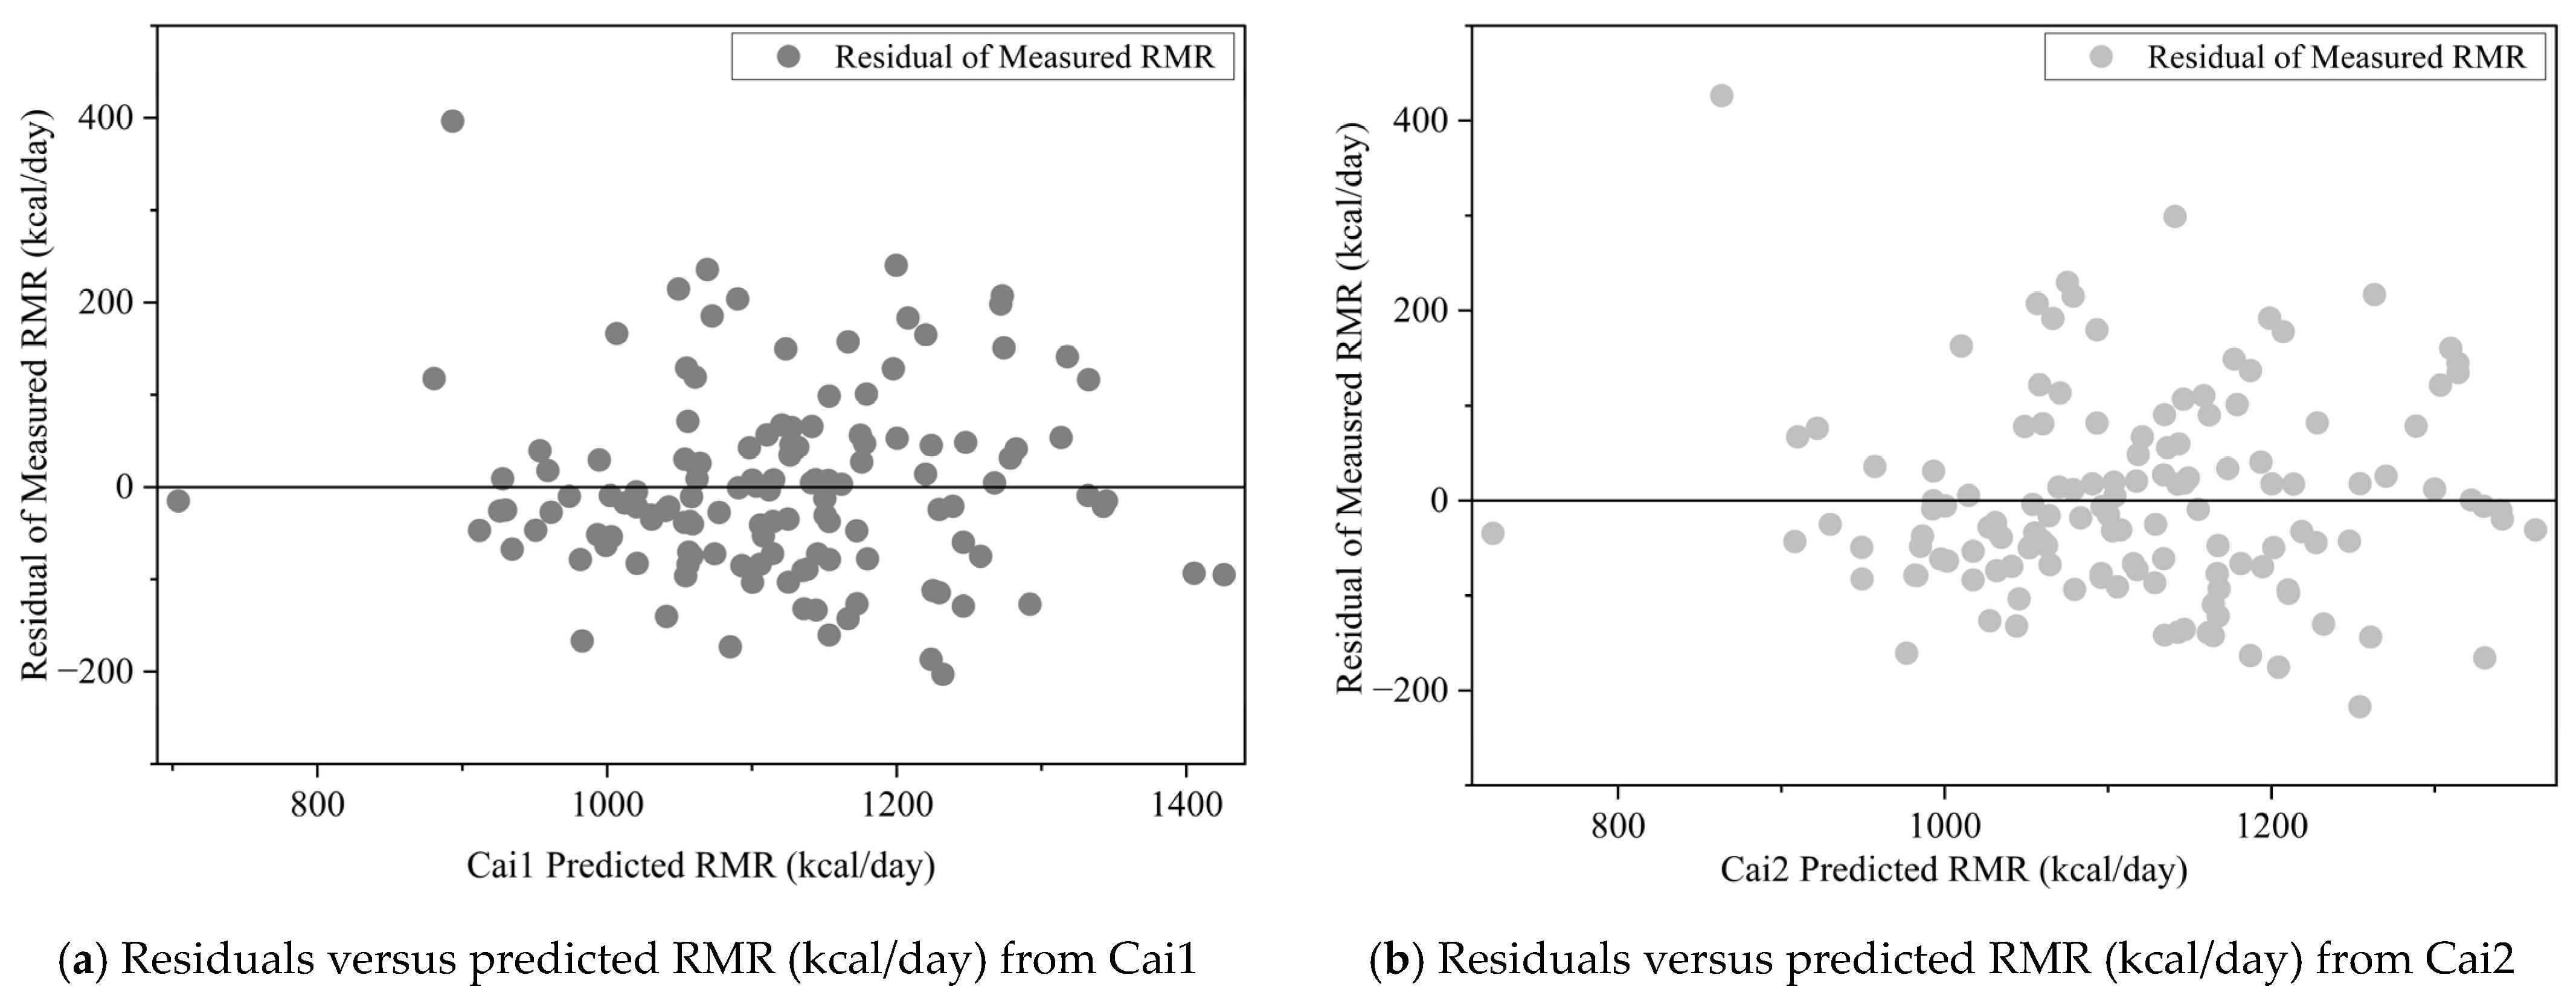
3.6. Correlations Among the Predicted and Measured RMR Values
3.7. Bland–Altman Analyses of the Predicted and Measured RMR Values
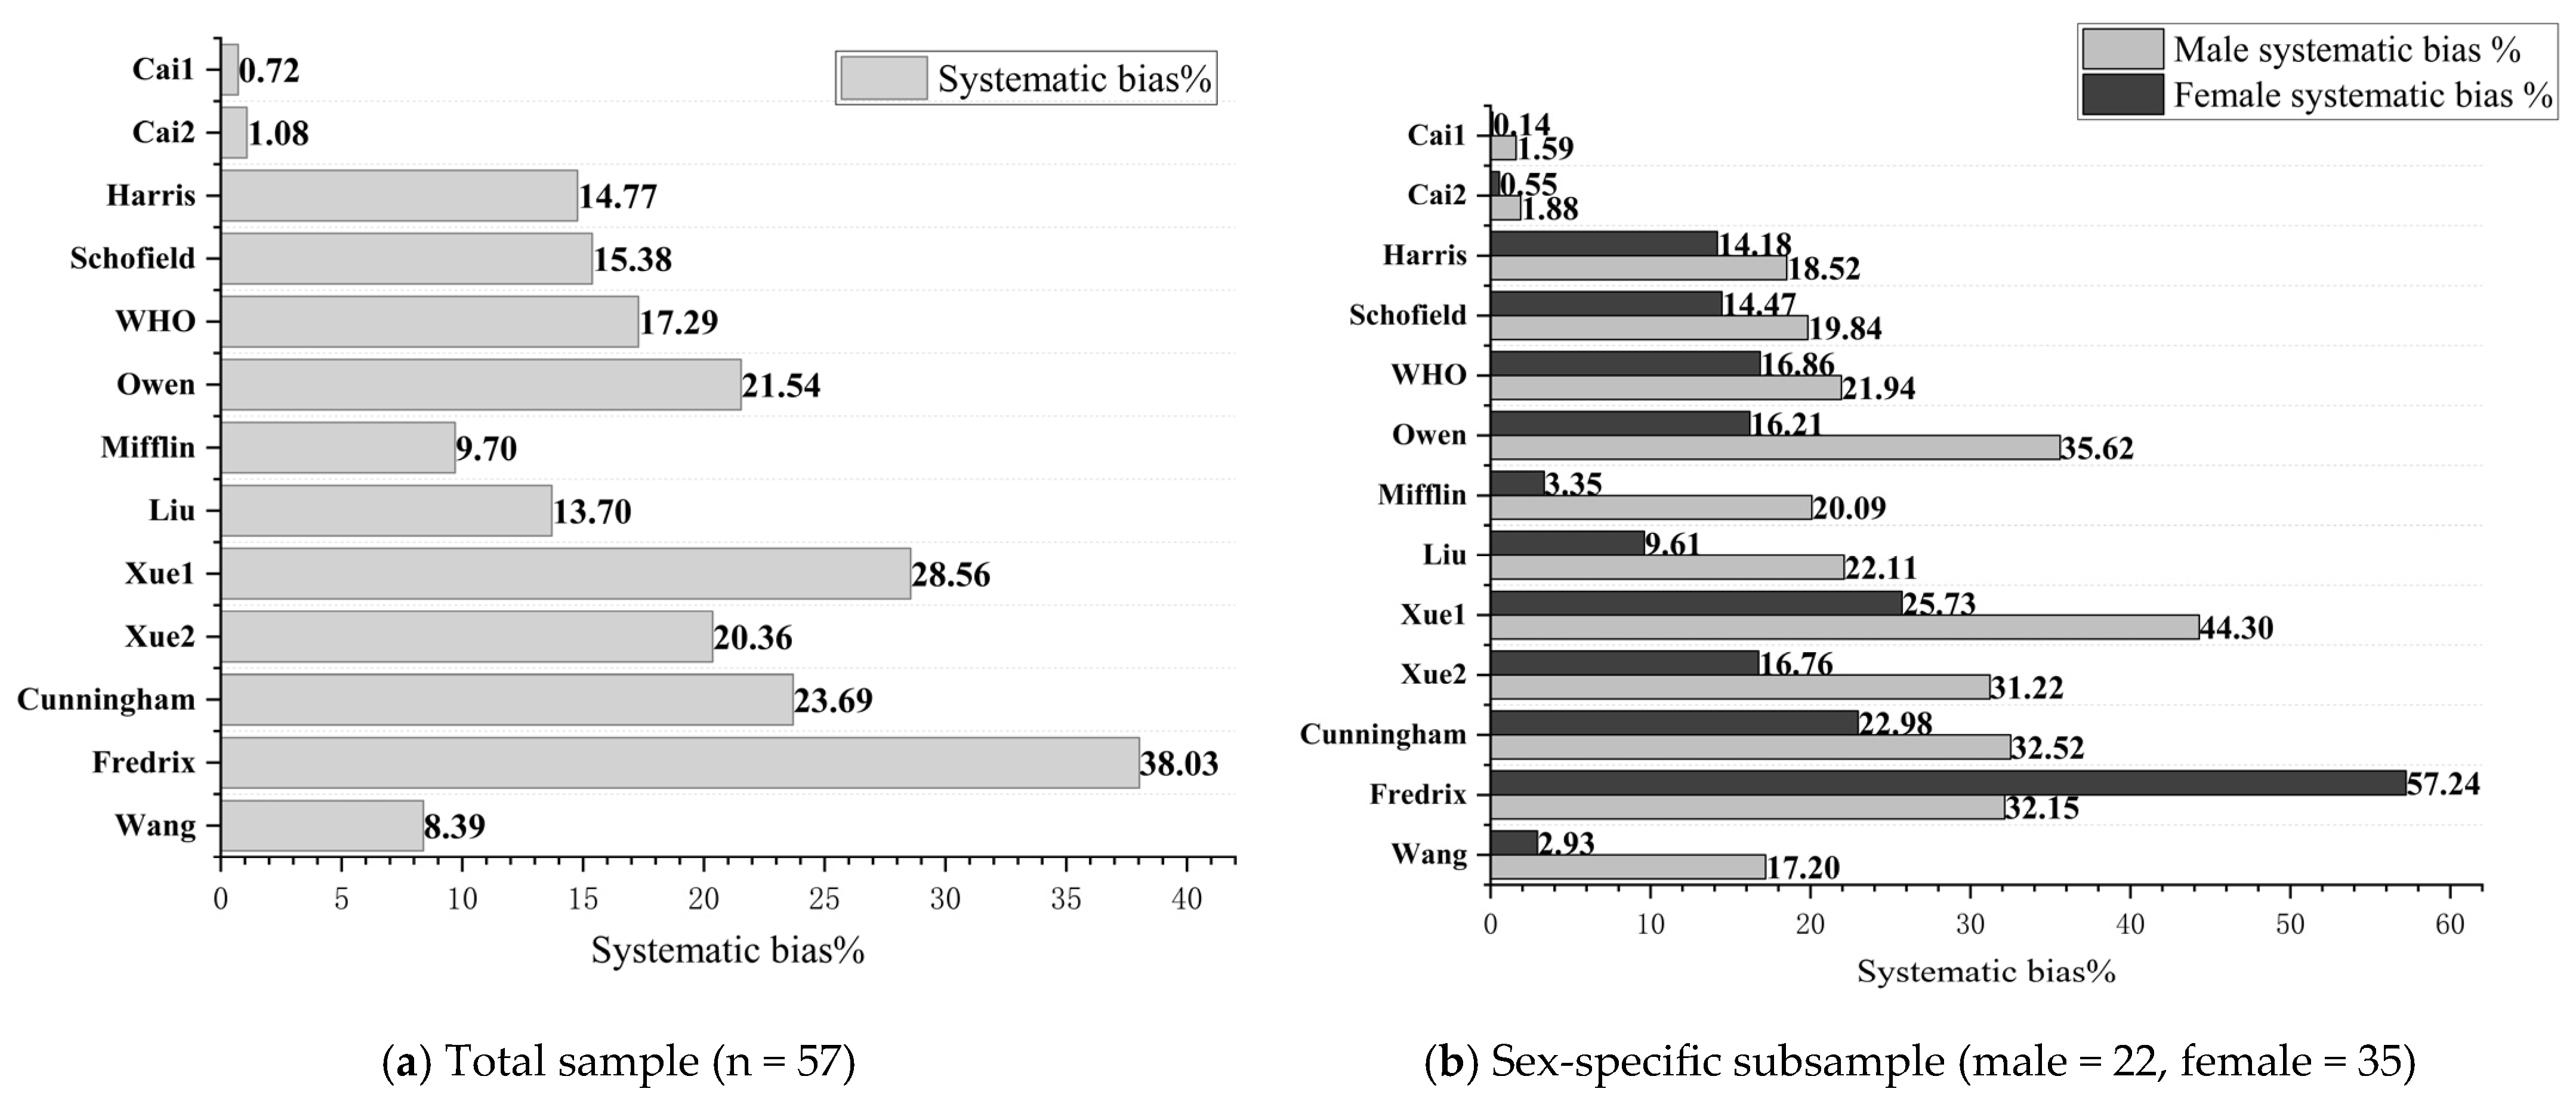
3.8. Systematic Bias (%) Derived from a Bland–Altman Analysis
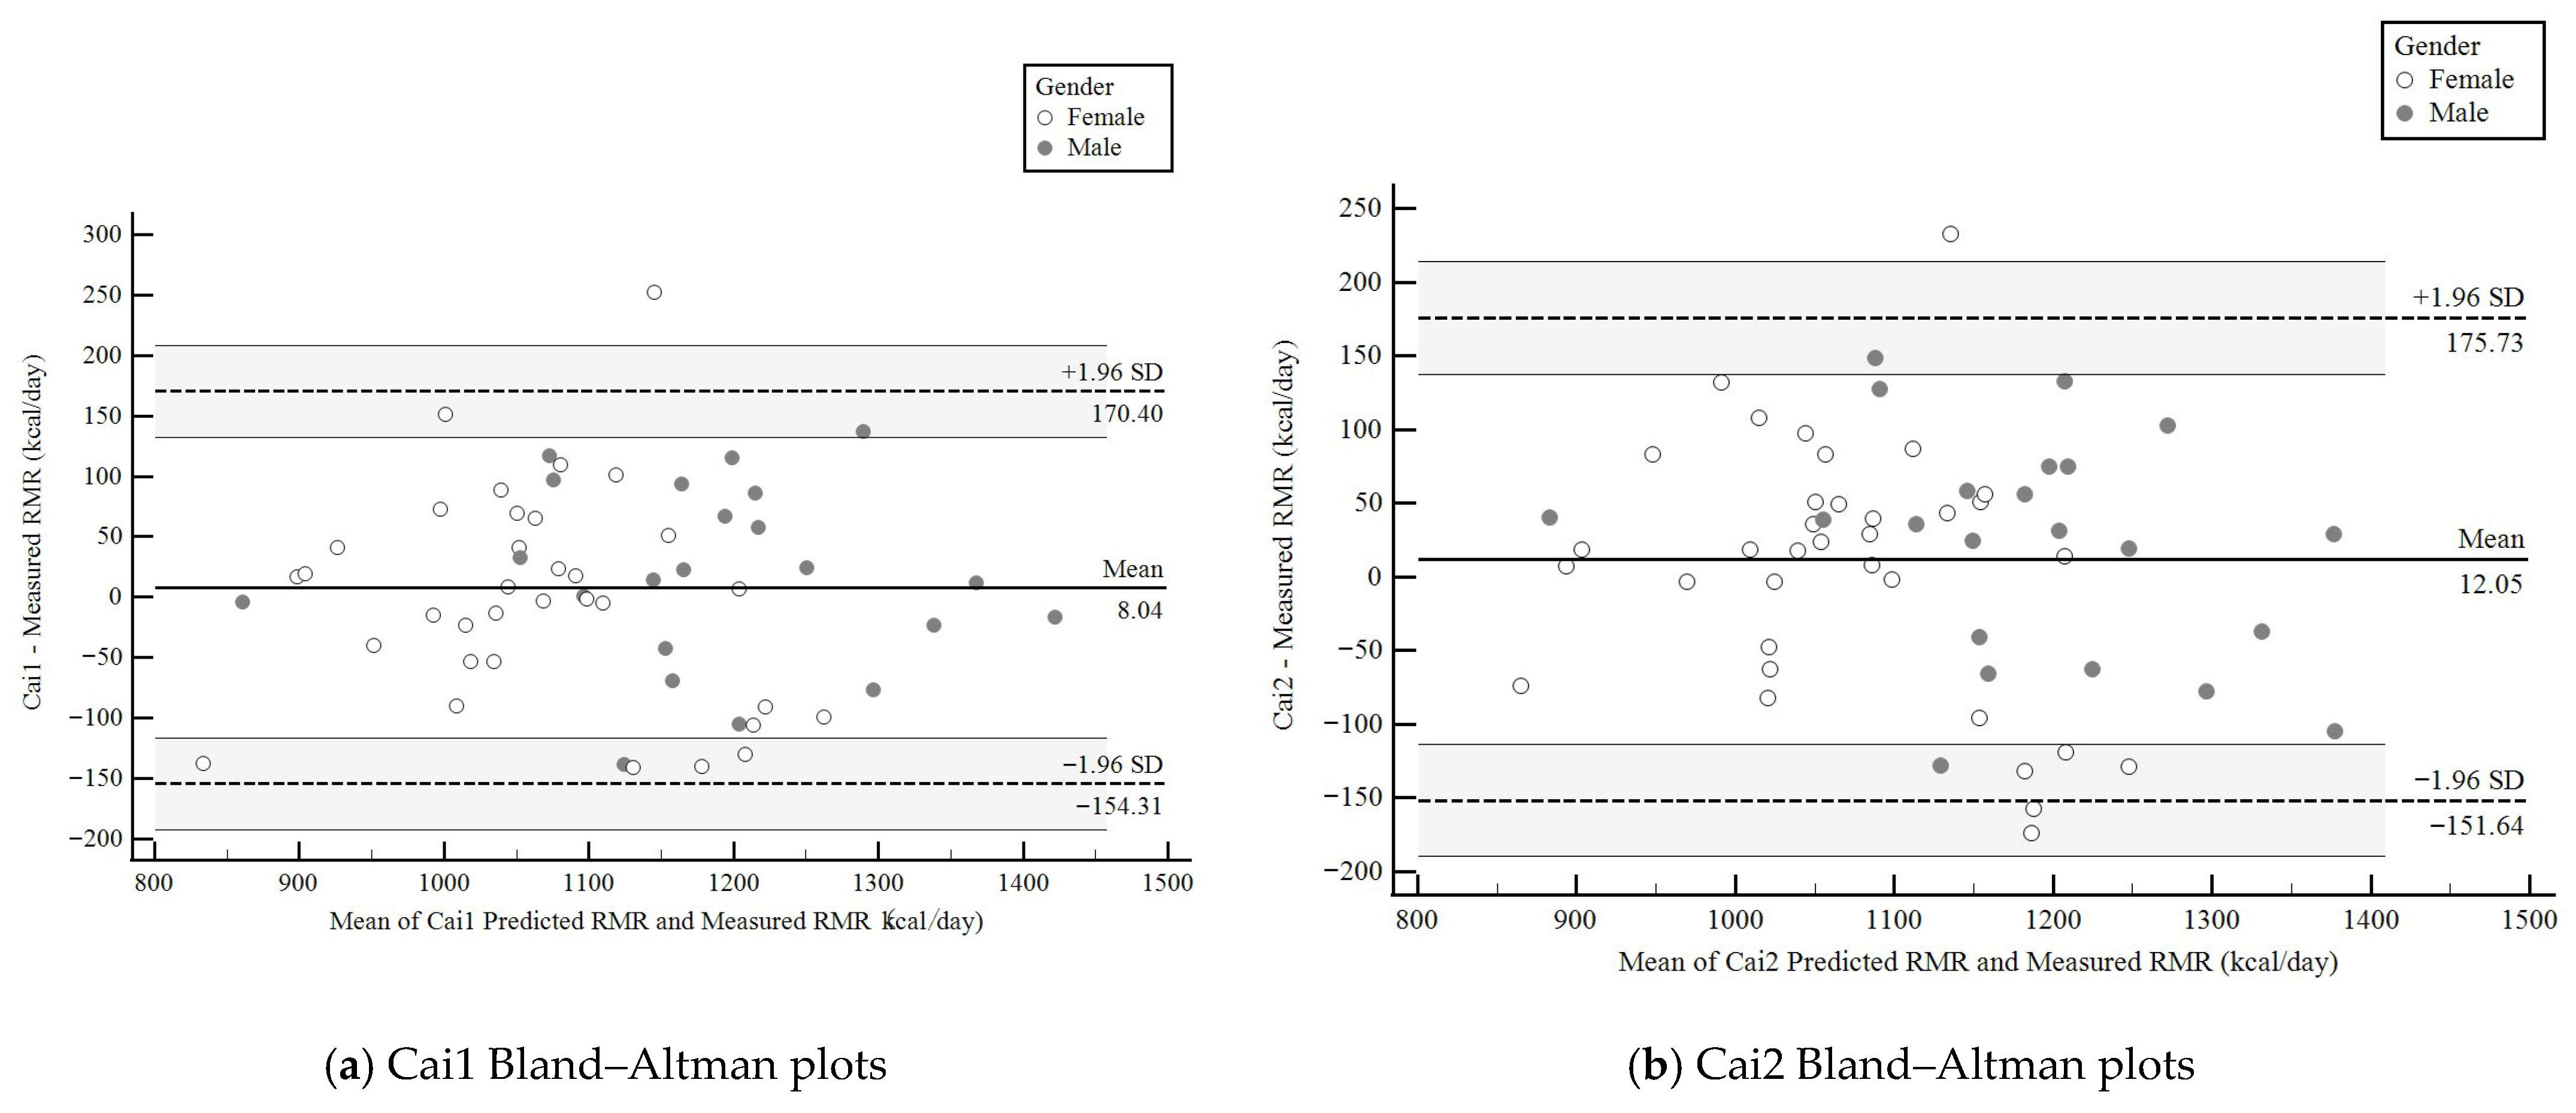
3.9. Bland–Altman Plots of Agreement for the Cai1 and Cai2 Predicted RMR Equations
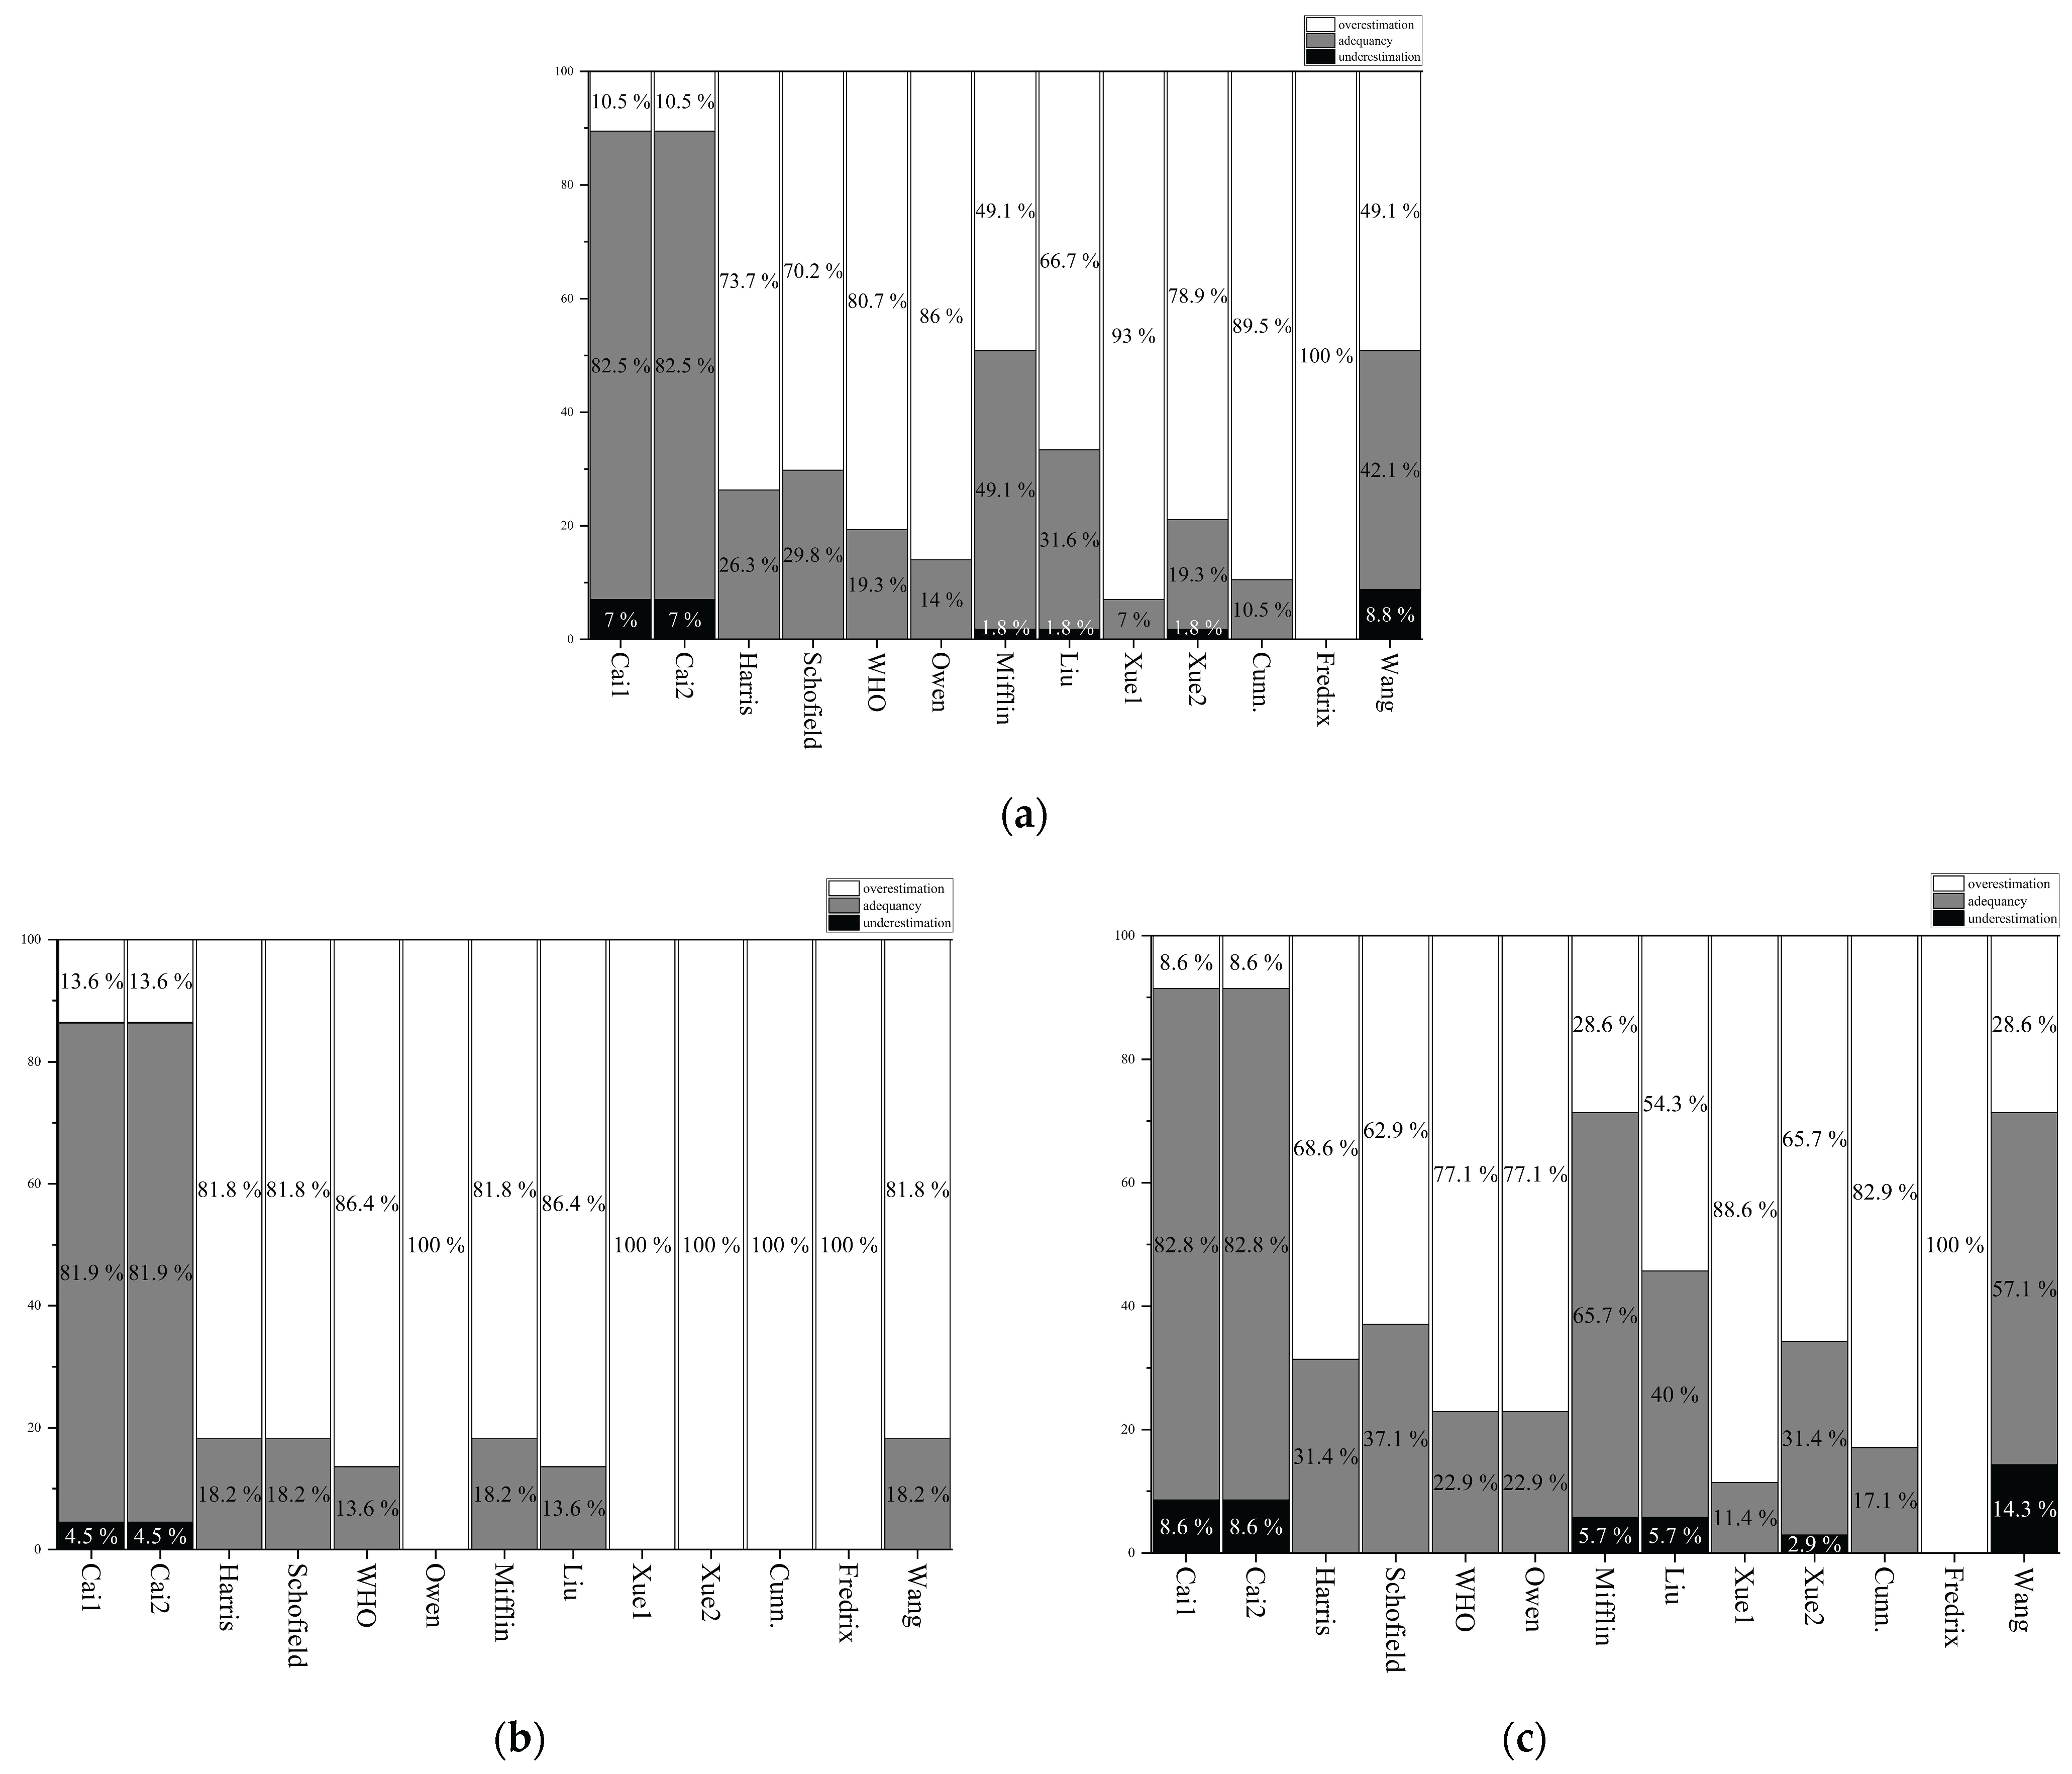
3.10. Percent Adequacy, Overestimation, and Underestimation of the Prediction Equations
4. Discussion
4.1. Key Findings
4.2. Underlying Mechanism for Discrepancies in Published RMR Prediction Equations
4.2.1. Body Composition Drives Bias
4.2.2. Unexpected Results from RMR Prediction Equations Derived from Chinese Populations
4.2.3. Unexpected Results from RMR Prediction Equations Derived from Different Age Samples
4.3. Potential Applications of the Novel Equations
4.4. Strength and Limitations
5. Conclusions
Supplementary Materials
Author Contributions
Funding
Institutional Review Board Statement
Informed Consent Statement
Data Availability Statement
Acknowledgments
Conflicts of Interest
References
- Phillips, D.R.; Feng, Z. Challenges for the aging family in the People’s Republic of China. Can. J. Aging 2015, 34, 290–304. [Google Scholar] [CrossRef] [Scilit]
- Chen, X.; Giles, J.; Yao, Y.; Yip, W.; Meng, Q.; Berkman, L.; Chen, H.; Chen, X.; Feng, J.; Feng, Z.; et al. The path to healthy ageing in China: A Peking University-Lancet Commission. Lancet 2022, 400, 1967–2006. [Google Scholar] [CrossRef] [Scilit]
- Xu, X.; Byles, J.E.; Shi, Z.; Hall, J.J. Evaluation of older Chinese people’s macronutrient intake status: Results from the China Health and Nutrition Survey. Br. J. Nutr. 2015, 113, 159–171. [Google Scholar] [CrossRef] [Scilit] [PubMed]
- Zhang, J.; Song, P.K.; Zhao, L.Y.; Sun, Y.; Yu, K.; Yin, J.; Pang, S.J.; Liu, Z.; Man, Q.Q.; He, L.; et al. Malnutrition in relation with dietary, geographical, and socioeconomic factors among older Chinese. Biomed. Environ. Sci. 2021, 34, 337–347. [Google Scholar] [CrossRef] [Scilit]
- Ramasinghe, C.; Bordiga, M.; Xu, B. A comprehensive review of the triangular relationship among diet, gut microbiota, and aging. Int. J. Mol. Sci. 2025, 25, 8785. [Google Scholar] [CrossRef] [Scilit] [PubMed]
- Ainsworth, B.E.; Haskell, W.L.; Whitt, M.C.; Irwin, M.L.; Swartz, A.M.; Strath, S.J.; O’Brien, W.L.; Bassett, D.R., Jr.; Schmitz, K.H.; Emplaincourt, P.O.; et al. Compendium of physical activities: An update of activity codes and MET intensities. Med. Sci. Sports Exerc. 2000, 32, S498–S504. [Google Scholar] [CrossRef] [Scilit] [PubMed]
- Herrmann, S.D.; Willis, E.A.; Ainsworth, B.E. The 2024 compendium of physical activities and its expansion. J. Sport Health Sci. 2024, 13, 1–2. [Google Scholar] [CrossRef] [Scilit]
- Achamrah, N.; Delsoglio, M.; De Waele, E.; Berger, M.M.; Pichard, C. Indirect calorimetry: The 6 main issues. Clin. Nutr. 2021, 40, 4–14. [Google Scholar] [CrossRef] [Scilit]
- Manini, T.M.; Everhart, J.E.; Anton, S.D.; Schoeller, D.A.; Cummings, S.R.; Mackey, D.C.; Delmonico, M.J.; Bauer, D.C.; Simonsick, E.M.; Colbert, L.H.; et al. Activity energy expenditure and change in body composition in late life. Am. J. Clin. Nutr. 2009, 90, 1336–1342. [Google Scholar] [CrossRef] [Scilit]
- Pontzer, H.; Yamada, Y.; Sagayama, H.; Ainslie, P.N.; Andersen, L.F.; Anderson, L.J.; Arab, L.; Baddou, I.; Bedu-Addo, K.; Blaak, E.E.; et al. Daily energy expenditure through the human life course. Science 2021, 373, 808–812. [Google Scholar] [CrossRef] [Scilit]
- Delsoglio, M.; Achamrah, N.; Berger, M.M.; Pichard, C. Indirect calorimetry in clinical practice. J. Clin. Med. 2019, 8, 1387. [Google Scholar] [CrossRef] [Scilit]
- Oshima, T.; Berger, M.M.; De Waele, E.; Guttormsen, A.B.; Heidegger, C.P.; Hiesmayr, M.; Singer, P.; Wernerman, J.; Pichard, C. Indirect calorimetry in nutritional therapy. A position paper by the ICALIC study group. Clin. Nutr. 2017, 36, 651–662. [Google Scholar] [CrossRef] [Scilit]
- Banks, A.S.; Allison, D.B.; Alquier, T.; Ansarullah; Austad, S.N.; Auwerx, J.; Ayala, J.E.; Baur, J.A.; Carobbio, S.; Churchill, G.A.; et al. A consensus guide to preclinical indirect calorimetry experiments. Nat. Metab. 2025, 7, 1765–1780. [Google Scholar] [CrossRef] [Scilit]
- Harris, J.A.; Benedict, F.G. A biometric study of human basal metabolism. Proc. Natl. Acad. Sci. USA 1918, 4, 370–373. [Google Scholar] [CrossRef] [Scilit]
- Energy and Protein Requirements. Report of a Joint FAO/WHO/UNU Expert Consultation; World Health Organization Technical Report Series; World Health Organization: Geneva, Switzerland, 1985; Volume 724, pp. 1–206.
- Schofield, W.N. Predicting basal metabolic rate, new standards and review of previous work. Hum. Nutr. Clin. Nutr. 1985, 39, 5–41. [Google Scholar] [PubMed]
- Owen, O.E.; Kavle, E.; Owen, R.S.; Polansky, M.; Caprio, S.; Mozzoli, M.A.; Kendrick, Z.V.; Bushman, M.C.; Boden, G. A reappraisal of caloric requirements in healthy women. Am. J. Clin. Nutr. 1986, 44, 1–19. [Google Scholar] [CrossRef] [Scilit] [PubMed]
- Mifflin, M.D.; St Jeor, S.T.; Hill, L.A.; Scott, B.J.; Daugherty, S.A.; Koh, Y.O. A new predictive equation for resting energy expenditure in healthy individuals. Am. J. Clin. Nutr. 1990, 51, 241–247. [Google Scholar] [CrossRef] [Scilit] [PubMed]
- Frankenfield, D.; Roth-Yousey, L.; Compher, C. Comparison of predictive equations for resting metabolic rate in healthy nonobese and obese adults: A systematic review. J. Am. Diet. Assoc. 2005, 105, 775–789. [Google Scholar] [CrossRef] [Scilit]
- Cunningham, J.J. A reanalysis of the factors influencing basal metabolic rate in normal adults. Am. J. Clin. Nutr. 1980, 33, 2372–2374. [Google Scholar] [CrossRef] [Scilit]
- Fredrix, E.W.; Soeters, P.B.; Deerenberg, I.M.; Kester, A.D.; von Meyenfeldt, M.F.; Saris, W.H. Resting and sleeping energy expenditure in the elderly. Eur. J. Clin. Nutr. 1990, 44, 741–747. [Google Scholar]
- Liu, H.Y.; Lu, Y.F.; Chen, W.J. Predictive equations for basal metabolic rate in Chinese adults: A cross-validation study. J. Am. Diet. Assoc. 1995, 95, 1403–1408. [Google Scholar] [CrossRef] [Scilit] [PubMed]
- Wang, Z.; Heshka, S.; Gallagher, D.; Boozer, C.N.; Kotler, D.P.; Heymsfield, S.B. Resting energy expenditure-fat-free mass relationship: New insights provided by body composition modeling. Am. J. Physiol. Endocrinol. Metab. 2000, 279, E539–E545. [Google Scholar] [CrossRef] [Scilit] [PubMed]
- Xue, J.; Li, S.; Zhang, Y.; Hong, P. Accuracy of predictive resting-metabolic-rate equations in Chinese Mainland adults. Int. J. Environ. Res. Public Health 2019, 16, 2747. [Google Scholar] [CrossRef] [Scilit]
- Wouters-Adriaens, M.P.; Westerterp, K.R. Low resting energy expenditure in Asians can be attributed to body composition. Obesity 2008, 16, 2212–2216. [Google Scholar] [CrossRef] [Scilit]
- Kua, P.S.; Albakri, M.; Tay, S.M.; Thong, P.S.; Xia, O.J.; Chua, W.H.P.; Chong, K.; Tan, N.W.K.; Loh, X.H.; Tan, J.H.; et al. Novel resting energy expenditure prediction equations for multi-ethnic Asian older adults with multimorbidity. Nutrients 2025, 17, 2144. [Google Scholar] [CrossRef] [Scilit] [PubMed]
- Müller, M.J.; Heymsfield, S.B.; Bosy-Westphal, A. Are metabolic adaptations to weight changes an artefact? Am. J. Clin. Nutr. 2021, 114, 1386–1395. [Google Scholar] [CrossRef] [Scilit]
- Nair, K.S.; Halliday, D.; Garrow, J.S. Increased energy expenditure in poorly controlled type 1 (insulin-dependent) diabetic patients. Diabetologia 1984, 27, 13–16. [Google Scholar] [CrossRef] [Scilit]
- Gougeon, R.; Lamarche, M.; Yale, J.F.; Venuta, T. The prediction of resting energy expenditure in type 2 diabetes mellitus is improved by factoring for glycemia. Int. J. Obes. Relat. Metab. Disord. 2002, 26, 1547–1552. [Google Scholar] [CrossRef] [Scilit]
- Pedrianes-Martin, P.B.; Perez-Valera, M.; Morales-Alamo, D.; Martin-Rincon, M.; Perez-Suarez, I.; Serrano-Sanchez, J.A.; Gonzalez-Henriquez, J.J.; Galvan-Alvarez, V.; Acosta, C.; Curtelin, D.; et al. Resting metabolic rate is increased in hypertensive patients with overweight or obesity: Potential mechanisms. Scand. J. Med. Sci. Sports 2021, 31, 1461–1470. [Google Scholar] [CrossRef] [Scilit]
- Wasyluk, W.; Zwolak, A.; Jonckheer, J.; De Waele, E.; Dąbrowski, W. Methodological Aspects of Indirect Calorimetry in Patients with Sepsis-Possibilities and Limitations. Nutrients 2022, 14, 930. [Google Scholar] [CrossRef] [Scilit]
- Weir, J.B. New methods for calculating metabolic rate with special reference to protein metabolism. J. Physiol. 1949, 109, 1–9. [Google Scholar] [CrossRef] [Scilit]
- Koo, T.K.; Li, M.Y. A Guideline of Selecting and Reporting Intraclass Correlation Coefficients for Reliability Research. J. Chiropr. Med. 2016, 15, 155–163. [Google Scholar] [CrossRef] [Scilit] [PubMed]
- Bland, J.M.; Altman, D.G. Applying the right statistics: Analyses of measurement studies. Ultrasound Obstet. Gynecol. 2003, 22, 85–93. [Google Scholar] [CrossRef] [Scilit] [PubMed]
- Chan, Y.H. Biostatistics 104: Correlational analysis. Singapore Med. J. 2003, 44, 614–619. [Google Scholar]
- Müller, M.J.; Bosy-Westphal, A.; Klaus, S.; Kreymann, G.; Lührmann, P.M.; Neuhäuser-Berthold, M.; Noack, R.; Pirke, K.M.; Platte, P.; Selberg, O.; et al. World Health Organization equations have shortcomings for predicting resting energy expenditure in persons from a modern, affluent population: Generation of a new reference standard from a retrospective analysis of a German database of resting energy expenditure. Am. J. Clin. Nutr. 2004, 80, 1379–1390. [Google Scholar] [CrossRef] [Scilit]
- Lührmann, P.M.; Herbert, B.M.; Neuhäuser-Berthold, M. Effects of fat mass and body fat distribution on resting metabolic rate in the elderly. Metabolism 2001, 50, 972–975. [Google Scholar] [CrossRef] [Scilit] [PubMed]
- Fernández-Verdejo, R.; Sanchez-Delgado, G.; Ravussin, E. Energy expenditure in humans: Principles, methods, and changes throughout the life course. Annu. Rev. Nutr. 2024, 44, 51–76. [Google Scholar] [CrossRef] [Scilit]
- Manini, T.M. Energy expenditure and aging. Ageing Res. Rev. 2010, 9, 1–11. [Google Scholar] [CrossRef] [Scilit]
- Javed, F.; He, Q.; Davidson, L.E.; Thornton, J.C.; Albu, J.; Boxt, L.; Krasnow, N.; Elia, M.; Kang, P.; Heshka, S.; et al. Brain and high metabolic rate organ mass: Contributions to resting energy expenditure beyond fat-free mass. Am. J. Clin. Nutr. 2010, 91, 907–912. [Google Scholar] [CrossRef] [Scilit]
- Jensen, M.D.; Kanaley, J.A.; Roust, L.R.; O’Brien, P.C.; Braun, J.S.; Dunn, W.L.; Wahner, H.W. Assessment of body composition with use of dual-energy x-ray absorptiometry: Evaluation and comparison with other methods. Mayo Clin. Proc. 1993, 68, 867–873. [Google Scholar] [CrossRef] [Scilit]
- Jin, H.; Wang, Z.; Guo, A.; Zhang, H.; Liu, W.; Zhu, Y.; Hua, M.; Shi, J.; Shi, J.; Yu, D. Patterns of multimorbidity in community health centres in Shanghai, China: A retrospective, cross-sectional study based on outpatient data from 2014 to 2018. BMJ Open 2022, 12, e048727. [Google Scholar] [CrossRef] [Scilit]
- Chen, H.; Hao, L.; Yang, C.; Yan, B.; Sun, Q.; Sun, L.; Chen, H.; Chen, Y. Understanding the rapid increase in life expectancy in shanghai, China: A population-based retrospective analysis. BMC Public Health 2018, 18, 256. [Google Scholar] [CrossRef] [Scilit] [PubMed]
- Park, J.S.; Cho, S.R.; Yim, J.E. Resting energy expenditure in Korean type 2 diabetes patients: Comparison between measured and predicted values. Nutr. Res. Pract. 2023, 17, 464–474. [Google Scholar] [CrossRef] [Scilit] [PubMed]
- Byrne, N.M.; Hills, A.P.; Hunter, G.R.; Weinsier, R.L.; Schutz, Y. Metabolic equivalent: One size does not fit all. J. Appl. Physiol. 2005, 99, 1112–1119. [Google Scholar] [CrossRef] [Scilit] [PubMed]


| Equation | Characteristics | Population | Equation |
|---|---|---|---|
| Harris–Benedict (1918) [14] | N = 239 (136 M, 103 F) | Male Female | RMR = 66 + (13.7 × WT) + (5 × HT) − (6.8 × age) RMR = 655 + (9.5 × WT) + (1.9 × HT) − (4.7 × age) |
| Age = 29 ± 14 | |||
| Schofield (1985) [16] | N = 86 (50 M, 36 F) | Male Female | RMR = (11.711 × WT) + 587.7 RMR = (9.082 × WT) + 658.5 |
| Age > 60 | |||
| WHO (1985) [15] | N ≈ 2526 (2279 M, 247 F) | Male Female | RMR = (13.5 × WT) + 487.0 RMR = (10.5 × WT) + 596.0 |
| Age = 19–82 | |||
| Owen (1986) [17] | N = 104 (60 M, 44 F) | Male Female | RMR = (10.2 × WT) + 879.0 RMR = (7.18 × WT) + 795.0 |
| Age = 18–82 | |||
| Mifflin–St. Jeor (1990) [18] | N = 498 (251 M, 248 F) | Male Female | RMR = (10 × WT) + (6.25 × HT) − (5 × age) + 5.0 RMR = (10 × WT) + (6.25 × HT) − (5 × age) − 161 |
| Age = 19–78 | |||
| Liu (1995) [22] | N = 223 (102 M, 121 F) | All | RMR = (13.88 × WT) + (4.16 × HT) − (3.43 × age) − (112.4 × sex) |
| Age = 20–78 | |||
| Xue equation 1 (2019) [24] (Xue1) | N = 315 (127 M, 188 F) | All | RMR = (13.9 × WT) + (247 × sex) − (5.39 × age) + 855.0 |
| Age = 18–67 | |||
| Cunningham (1980) [20] | N = 223 (136 M, 103 F) | All | RMR = (21.6 × FFM) + 501.6 |
| Age = 29 ± 11 | |||
| Fredrix (1990) [21] | N = 40 (18 M, 22 F) | All | RMR = (10.7 × WT) − (9 × age) − (203 × sex) + 1641.0 |
| Age = 65 ± 8 | |||
| Wang (2000) [23] | N = 174 | All | RMR = (24.6 × FFM) + 175.0 |
| Age < 45 | |||
| Xue equation 2 (2019) [24] (Xue2) | N = 315 (127 M, 188 F) | All | RMR = (26.535 × FFM) − (5.06 × age) + 602.1 |
| Age = 18–67 |
| Variable | Total (N = 189) | Males (n = 73) | Females (n = 116) |
|---|---|---|---|
| Mean ± SD | Mean ± SD | Mean ± SD | |
| (Range) | (Range) | (Range) | |
| Measured RMR (Kcal/Day) | 1116.9 ± 147.9 | 1197.0 ± 152.9 | 1071.2 ± 158.9 |
| (689–1530) | (863–1530) | (689–1470) | |
| FFM (kg) | 41.5 ± 7.9 | 49.3 ± 5.6 | 36.6 ± 4.5 |
| (28.8–65.1) | (41.7–65.1) | (28.8–46.5) | |
| Age (y) | 69.5 ± 6.3 | 70.8 ± 6.1 | 68.6 ± 6.2 |
| (60–94) | (60–94) | (60–92) | |
| Weight (kg) | 63.6 ± 10.5 | 70.2 ± 8.9 | 59.5 ± 9.3 |
| (37.0–88.9) | (53.0–87.6) | (37.0–88.9) | |
| Height (cm) | 162.7 ± 7.5 | 169.7 ± 5.2 | 158.2 ± 4.9 |
| (143.0–186.7) | (158.0–186.7) | (143.0–168.3) | |
| BMI (kg/m2) | 24.0 ± 3.1 | 24.3 ± 2.7 | 23.7 ± 3.4 |
| (15.8–35.5) | (20.3–30.6) | (15.8–35.5) | |
| FM (kg) | 22.1 ± 5.8 | 20.9 ± 5.0 | 22.9 ± 6.1 |
| (8.2–42.4) | (9.2–32.1) | (8.2–42.4) | |
| FM (%) | 34.7 ± 6.6 | 29.5 ± 4.5 | 38.0 ± 5.5 |
| (16.9–47.7) | (16.9–36.9) | (19.6–47.7) | |
| SBP (mmHg) | 128.7 ± 13.1 | 132.6 ± 13.1 | 126.5 ± 12.5 |
| (93–150) | (93–147) | (97–150) | |
| DBP (mmHg) | 78.8 ± 8.8 | 81.9 ± 8.4 | 77.1 ± 8.6 |
| (61–94) | (68–94) | (61–94) |
| Equation | Regression Equation | p | R2 | β | RMSE |
|---|---|---|---|---|---|
| Cai1 | RMR = 1393.019 − (11.112 × age) + (11.963 × FFM) | <0.01 | 0.572 | age (−0.445) FFM (0.632) | 99.238 |
| Cai2 | RMR = 1537.513 + (91.038 × sex) − (11.515 × age) + (5.436 × WT) | <0.01 | 0.528 | age (−0.461) sex (0.292) WT (0.387) | 104.189 |
| Equation | Variable | β (95% CI) | SE | p |
|---|---|---|---|---|
| Cai1 equation | Constant | 1393.019 (1179.673, 1606.365) | 107.831 | <0.001 |
| Age | −11.112 (−13.961, −8.264) | 1.440 | <0.001 | |
| FFM | 11.963 (9.803, 14.123) | 1.092 | <0.001 | |
| Cai2 equation | Constant | 1537.513 (1273.273, 1801.753) | 133.544 | <0.001 |
| Age | −11.515 (−14.638, −8.388) | 1.581 | <0.001 | |
| Sex | 91.038 (44.862, 137.213) | 23.337 | <0.001 | |
| Weight | 5.436 (3.401, 7.471) | 1.028 | <0.001 |
| Variable | Predicted RMR (kcal/day) | Measured RMR (kcal/day) | _d (kcal/day) | t | p |
|---|---|---|---|---|---|
| Cai1 | 1117.0 | 1109.0 | 8.0 | 0.53 | 1.000 a |
| Male | 1193.7 | 1175.3 | 18.4 | 1.25 | 0.993 a |
| Female | 1068.8 | 1067.3 | 1.5 | 0.12 | 1.000 a |
| Cai2 | 1121.0 | 1109.0 | 12.0 | 0.80 | 1.000 a |
| Male | 1197.1 | 1175.3 | 21.8 | 1.47 | 0.971 a |
| Female | 1073.2 | 1067.3 | 5.9 | 0.46 | 1.000 a |
| Harris [14] | 1285.8 | 1109.0 | 176.8 | 11.69 | <0.001 |
| Male | 1392.7 | 1175.3 | 217.4 | 14.70 | <0.001 |
| Female | 1218.6 | 1067.3 | 151.3 | 11.67 | <0.001 |
| Schofield [16] | 1293.7 | 1109.0 | 184.7 | 12.21 | <0.001 |
| Male | 1408.2 | 1175.3 | 232.9 | 15.75 | <0.001 |
| Female | 1221.7 | 1067.3 | 154.5 | 11.92 | <0.001 |
| WHO [15] | 1318.9 | 1109.0 | 209.9 | 13.87 | <0.001 |
| Male | 1432.8 | 1175.3 | 257.5 | 17.42 | <0.001 |
| Female | 1247.2 | 1067.3 | 179.9 | 13.88 | <0.001 |
| Owen [17] | 1376.7 | 1109.0 | 267.7 | 17.69 | <0.001 |
| Male | 1593.6 | 1175.3 | 418.3 | 28.29 | <0.001 |
| Female | 1240.3 | 1067.3 | 173.0 | 13.35 | <0.001 |
| Mifflin [18] | 1222.0 | 1109.0 | 113.0 | 7.47 | <0.001 |
| Male | 1411.1 | 1175.3 | 235.8 | 15.95 | <0.001 |
| Female | 1103.0 | 1067.3 | 35.8 | 2.76 | 0.249 a |
| Liu [22] | 1272.2 | 1109.0 | 163.2 | 10.78 | <0.001 |
| Male | 1434.8 | 1175.3 | 259.5 | 17.55 | <0.001 |
| Female | 1169.8 | 1067.3 | 102.6 | 7.92 | <0.001 |
| Xue1 [24] | 1478.4 | 1109.0 | 369.4 | 24.42 | <0.001 |
| Male | 1695.6 | 1175.3 | 520.3 | 35.19 | <0.001 |
| Female | 1341.9 | 1067.3 | 274.6 | 21.19 | <0.001 |
| Xue2 [24] | 1360.3 | 1109.0 | 251.3 | 16.61 | <0.001 |
| Male | 1541.9 | 1175.3 | 366.6 | 24.79 | <0.001 |
| Female | 1246.1 | 1067.3 | 178.9 | 13.80 | <0.001 |
| Cunningham [20] | 1407.0 | 1109.0 | 298.0 | 19.70 | <0.001 |
| Male | 1557.2 | 1175.3 | 381.9 | 25.83 | <0.001 |
| Female | 1312.5 | 1067.3 | 245.2 | 18.93 | <0.001 |
| Fredrix [21] | 1629.8 | 1109.0 | 520.8 | 34.42 | <0.001 |
| Male | 1552.7 | 1175.3 | 377.5 | 25.53 | <0.001 |
| Female | 1678.2 | 1067.3 | 610.9 | 47.14 | <0.001 |
| Wang [23] | 1206.1 | 1109.0 | 97.1 | 6.42 | <0.001 |
| Male | 1377.2 | 1175.3 | 201.9 | 13.66 | <0.001 |
| Female | 1098.6 | 1067.3 | 31.3 | 2.42 | 0.470 a |
| Equations | Mean ± SD (kcal/day) | Pearson’s Correlation Coefficient (r) | ||||
|---|---|---|---|---|---|---|
| Male (n = 22) | Female (n = 35) | Total (n = 57) | Male | Female | Total | |
| Measured RMR | 1173.3 ± 125.6 | 1067.3 ± 112.0 | 1108.9 ± 128.7 | |||
| Cai1 | 1193.7 ± 121.4 | 1068.8 ± 102.0 | 1117.0 ± 125.6 | 0.83 a | 0.68 a | 0.79 a |
| Cai2 | 1197.1 ± 104.0 | 1073.2 ± 89.2 | 1121.0 ± 112.7 | 0.80 a | 0.65 a | 0.77 a |
| Harris [14] | 1392.7 ± 161.5 | 1218.6 ± 93.2 | 1285.8 ± 150.3 | 0.78 a | 0.43 b | 0.69 a |
| Schofield [16] | 1408.2 ± 107.3 | 1221.7 ± 79.6 | 1293.7 ± 128.7 | 0.73 a | 0.19 | 0.58 a |
| WHO [15] | 1432.8 ± 123.7 | 1247.2 ± 92.0 | 1318.8 ± 138.8 | 0.73 a | 0.19 | 0.58 a |
| Owen [17] | 1593.6 ± 93.5 | 1240.3 ± 62.9 | 1376.6 ± 188.1 | 0.73 a | 0.19 | 0.54 a |
| Mifflin [18] | 1411.1 ± 127.0 | 1103.0 ± 110.6 | 1221.9 ± 190.4 | 0.75 a | 0.45 a | 0.65 a |
| Liu [22] | 1434.8 ± 149.2 | 1169.8 ± 133.4 | 1272.1 ± 190.2 | 0.75 a | 0.35 b | 0.63 a |
| Xue1 [24] | 1695.6 ± 142.3 | 1341.9 ± 126.6 | 1478.4 ± 217.5 | 0.80 a | 0.37 b | 0.64 a |
| Xue2 [24] | 1541.9 ± 163.2 | 1246.1 ± 139.9 | 1360.3 ± 207.4 | 0.87 a | 0.50 a | 0.72 a |
| Cunn. [20] | 1557.2 ± 116.5 | 1312.5 ± 105.5 | 1407.0 ± 162.0 | 0.85 a | 0.37 b | 0.66 a |
| Fredrix [21] | 1552.7 ± 129.6 | 1678.2 ± 110.5 | 1629.7 ± 133.1 | 0.83 a | 0.51 a | 0.35 a |
| Wang [23] | 1377.2 ± 132.7 | 1098.6 ± 120.2 | 1206.1 ± 184.6 | 0.85 a | 0.37 b | 0.66 a |
| RMR Prediction Equation | _d ± SD a (kcal/day) | LoA a (_d ± 1.96 SD) (kcal/day) | 95% CI a of the _d (kcal/day) | p | ||||||
|---|---|---|---|---|---|---|---|---|---|---|
| Male (n = 22) | Female (n = 35) | Total (n = 57) | Male (n = 22) | Female (n = 35) | Total (n = 57) | Male (n = 22) | Female (n = 35) | Total (n = 57) | Total (n = 57) | |
| Cai1 | 18.5 ± 74.9 | 1.5 ± 87.9 | 8.0 ± 82.8 | −128.4, 165.3 | −170.7, 173.7 | −154.3, 170.4 | −14.8, 51.7 | −28.7, 31.7 | −13.9, 30.0 | 0.466 |
| Cai2 | 21.8 ± 77.4 | 5.9 ± 87.7 | 12.0 ± 83.5 | −129.9, 173.5 | −165.9, 177.8 | −151.6, 175.7 | −12.5, 56.1 | −24.2, 36.0 | −10.1, 34.2 | 0.281 |
| Harris [14] | 217.4 ± 103.9 | 151.3 ± 112.7 | 176.8 ± 113.2 | 13.8, 421.0 | −69.5, 372.1 | −45.0, 398.6, | 171.4, 263.5 | 112.6, 190.0 | 146.8, 206.8 | <0.05 |
| Schofield [16] | 232.9 ± 89.9 | 154.5 ± 126.0 | 184.7 ± 119.0 | 56.6, 409.2 | −92.5, 401.5 | −48.5, 418.0 | 193.0, 272.8 | 111.2, 197.7 | 153.1, 216.3 | <0.05 |
| WHO [15] | 257.5 ± 94.5 | 179.9 ± 132.4 | 209.9 ± 124.2 | 72.3, 442.7 | −79.5, 439.3 | −33.7, 453.4 | 215.6, 299.4 | 134.4, 225.4 | 176.9, 242.8 | <0.05 |
| Owen [17] | 418.3 ± 88.5 | 173.0 ± 119.1 | 267.7 ± 161.4 | 245.0, 591.7 | −60.4, 406.4 | −48,7, 584.1 | 379.1, 457.6 | 132.1, 213.9 | 224.9, 310.5 | <0.05 |
| Mifflin [18] | 235.8 ± 91.3 | 35.8 ± 118.1 | 113.0 ± 145.7 | 57.0, 414.7 | −195.6, 267.2 | −172.7, 398.6 | 195.4, 276.3 | −4.8, 76.3 | 74.3, 151.7, | <0.05 |
| Liu [22] | 259.5 ± 101.9 | 102.6 ± 143.6 | 163.2 ± 149.5 | 59.8, 459.3 | −178.8, 383.9 | −129.9, 456.2 | 214.3, 304.7 | 53.3, 151.9 | 123.5, 202.8, | <0.05 |
| Xue 1 [24] | 520.3 ± 87.4 | 274.6 ± 136.7 | 369.4 ± 169.6 | 349.0, 691.7 | 6.7, 542.5 | 36.9, 701.9 | 481.5, 559.1 | 227.6, 321.6 | 324.4, 414.4 | <0.05 |
| Xue 2 [24] | 366.6 ± 83.7 | 178.9 ± 130.3 | 251.3 ± 146.4 | 202.6, 530.6 | −76.5, 434.3 | −35.6, 538.3 | 329.5, 403.7 | 134.1, 223.6 | 212.4, 290.2 | <0.05 |
| Cunningham [20] | 381.9 ± 68.7 | 245.3 ± 123.8 | 298.0 ± 124.8 | 247.3, 516.4 | 2.6, 488.0 | 53.4, 542.6 | 351.4, 412.3 | 202.8, 287.8 | 264.9, 331.1 | <0.05 |
| Fredrix [21] | 377.5 ± 75.8 | 610.9 ± 111.7 | 520.8 ± 151.2 | 228.8, 526.1 | 392.0, 829.8 | 224.3, 817.2 | 343.8, 411.1 | 572.5, 649.2 | 480.7, 560.9 | <0.05 |
| Wang [23] | 201.9 ± 73.0 | 31.3 ± 132.2 | 97.1 ± 140.1 | 58.9, 344.9 | −227.8, 290.4 | −177.4, 371.7 | 169.5, 234.2 | −14.1, 76.7 | 60.0, 134.3 | <0.05 |
| Prediction Equation | Adequacy % | Overestimation % | Underestimation % |
|---|---|---|---|
| Cai1 | 82.5 | 10.5 | 7.0 |
| Cai2 | 82.5 | 10.5 | 7.0 |
| Harris–Benedict [14] | 26.3 | 73.7 | 0 |
| Schofield [16] | 29.8 | 70.2 | 0 |
| WHO [15] | 19.3 | 80.7 | 0 |
| Owen [17] | 14 | 86 | 0 |
| Mifflin [18] | 49.1 | 49.1 | 1.8 |
| Liu [22] | 31.6 | 66.7 | 1.8 |
| Xue1 [24] | 7 | 93 | 0 |
| Xue2 [24] | 19.3 | 78.9 | 1.8 |
| Cunningham [20] | 10.5 | 89.5 | 0 |
| Fredrix [21] | 0 | 100 | 0 |
| Wang [23] | 42.1 | 49.1 | 8.8 |
Disclaimer/Publisher’s Note: The statements, opinions and data contained in all publications are solely those of the individual author(s) and contributor(s) and not of MDPI and/or the editor(s). MDPI and/or the editor(s) disclaim responsibility for any injury to people or property resulting from any ideas, methods, instructions or products referred to in the content. |
© 2026 by the authors. Licensee MDPI, Basel, Switzerland. This article is an open access article distributed under the terms and conditions of the Creative Commons Attribution (CC BY) license.
Share and Cite
Cai, Z.; You, B.; Yu, S.; Fan, Y.; Tian, H.; Ainsworth, B.E.; Chen, P. Prediction Equations to Estimate Resting Metabolic Rate in Healthy, Community-Dwelling Chinese Older Adults. Nutrients 2026, 18, 344. https://doi.org/10.3390/nu18020344
Cai Z, You B, Yu S, Fan Y, Tian H, Ainsworth BE, Chen P. Prediction Equations to Estimate Resting Metabolic Rate in Healthy, Community-Dwelling Chinese Older Adults. Nutrients. 2026; 18(2):344. https://doi.org/10.3390/nu18020344
Chicago/Turabian StyleCai, Zhenghua, Bochao You, Shuyun Yu, Yi Fan, Haili Tian, Barbara E. Ainsworth, and Peijie Chen. 2026. "Prediction Equations to Estimate Resting Metabolic Rate in Healthy, Community-Dwelling Chinese Older Adults" Nutrients 18, no. 2: 344. https://doi.org/10.3390/nu18020344
APA StyleCai, Z., You, B., Yu, S., Fan, Y., Tian, H., Ainsworth, B. E., & Chen, P. (2026). Prediction Equations to Estimate Resting Metabolic Rate in Healthy, Community-Dwelling Chinese Older Adults. Nutrients, 18(2), 344. https://doi.org/10.3390/nu18020344