You are currently viewing a new version of our website. To view the old version click .
Nutrients
  • Article
  • Open Access

11 November 2025

Development and Psychometric Evaluation of the Transtheoretical Model-Based Sustainable Nutrition Behavior Scale (TTM-SNBS) for Adolescents

,
,
and
1
Department of Nutrition and Dietetics, Institute of Health Sciences, Erciyes University, Kayseri 38280, Türkiye
2
Department of Nutrition and Dietetics, Faculty of Health Sciences, Yuksek Ihtisas University, Ankara 06530, Türkiye
3
Department of Biostatistics and Medical Informatics, Faculty of Medicine, Ankara Yildirim Beyazit University, Ankara 06010, Türkiye
4
Department of Nutrition and Dietetics, Faculty of Health Sciences, Erciyes University, Kayseri 38280, Türkiye
This article belongs to the Section Nutrition and Public Health

Abstract

Background/Objectives: Sustainable nutrition is essential for human and planetary health. The Transtheoretical Model-based Sustainable Nutrition Behavior Scale (TTM-SNBS) was developed to assess sustainable nutrition behaviors and the dynamic processes of behavior change in adolescents. Methods: The item pool was generated through literature review and expert consultation using the Delphi technique (10 experts, three rounds). Construct validity was assessed using exploratory and confirmatory factor analyses. Reliability was evaluated through Cronbach’s alpha and test–retest methods. External validity was examined through correlations with the Sustainable and Healthy Eating Behaviors Scale (SHEBS), following COSMIN standards. The study included 512 adolescents aged 14–18 years (54% female) from public high schools in Ankara, Türkiye. Results: Initially, 75 items were developed through expert evaluation. After preliminary testing, two items with low and negative correlations were removed; 73 were retained for validation. Factor analyses and refinement produced a 45-item final validated scale comprising one stage of change item and five subscales: cognitive processes (14 items), behavioral processes (18 items), decisional balance—pros (4 items), decisional balance—cons (4 items), and self-efficacy (4 items). Items showed good discrimination (>0.27). Cronbach’s alpha values ranged from 0.67 to 0.93, and fit indices were acceptable (χ2/df = 2.8–4.2; RMSEA = 0.045–0.065). External validity was supported by significant positive correlations with the SHEBS. Conclusions: The TTM-SNBS is the first psychometrically validated, theory-based instrument to assess sustainable nutrition behaviors in adolescents. It offers a reliable and valid instrument to support future research and interventions promoting sustainable dietary practices.

1. Introduction

Global population growth, environmental change, and the needs of future generations have made sustainable development a global priority. The 17 Sustainable Development Goals (SDGs) adopted by the United Nations emphasize the central role of nutrition in health, the environment, the economy, and society []. According to the World Health Organization (WHO) and the Food and Agriculture Organization (FAO), sustainable and healthy nutrition refers to dietary patterns that support optimal growth and health throughout life, have a low environmental impact, and are accessible, affordable, safe, equitable, and culturally acceptable []. Factors such as poverty, food insecurity, food safety, equality, and educational quality influence a population’s nutritional status [].
Adolescents, defined by WHO as individuals aged 10–19 years, represent 1.2 billion people worldwide []. This life stage is characterized by rapid physical, cognitive, and social development. It represents a critical period for addressing nutritional needs and establishing sustainable dietary behaviors that contribute to lifelong health benefits []. As outlined in the WHO’s Global Acceleration Action for the Health of Adolescents (AA-HA!) report [], adolescent health initiatives support the SDGs in three key ways: promoting healthy living today, enabling healthier living in adulthood, and improving the well-being of future generations [,].
In recent years, several instruments have been developed to assess sustainable dietary behaviors [,,,,,,,]. These tools primarily focus on (i) comprehensive assessment of healthy and sustainable eating behaviors [,,], (ii) measuring knowledge, attitudes, and behaviors related to sustainable eating [], and (iii) evaluating current knowledge levels and general attitudes [,,]. However, most existing instruments capture only current attitudes and behaviors, overlooking the dynamic, stage-based nature of behavior change—an aspect widely recognized as central to health behavior research. This limitation highlights a gap in the literature and underscores the need for theory-driven measures that incorporate behavioral change frameworks.
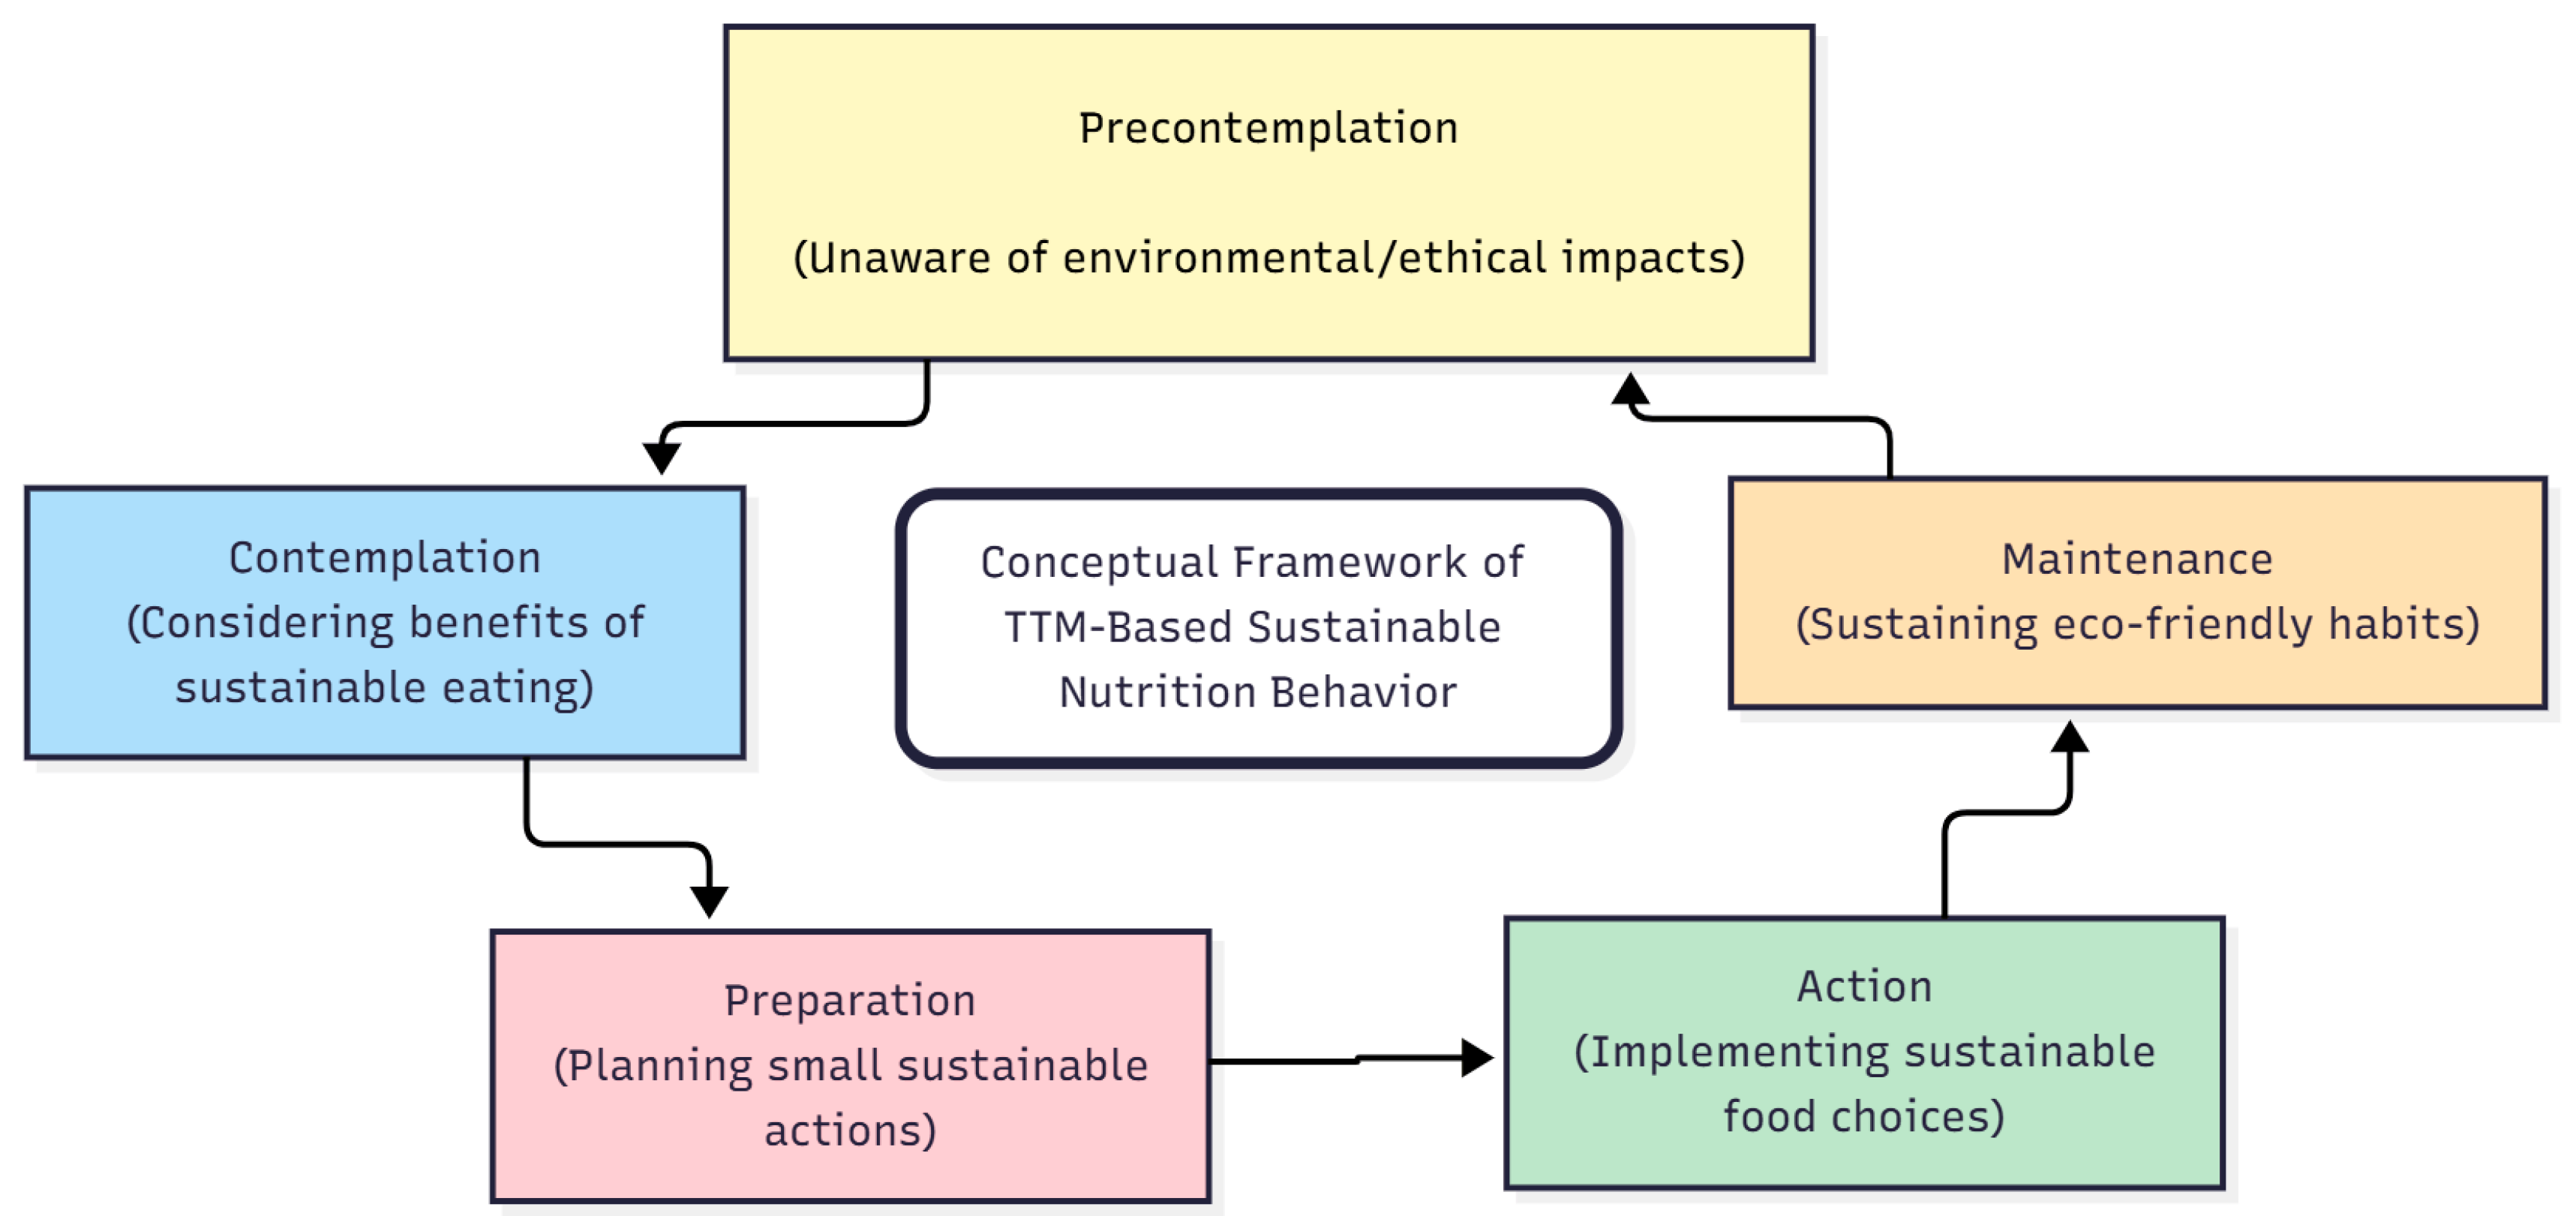
The Transtheoretical Model (TTM), developed by Dr. James Prochaska and colleagues, conceptualizes the change in five stages (precontemplation, contemplation, preparation, action, and maintenance) and includes the components of the change process, decision balance, and self-efficacy [,]. Individuals progress through distinct psychosocial processes that facilitate behavior change at different stages [,,]. The conceptual alignment between TTM stages and processes and sustainable eating behaviors, integrating environmental and ethical dimensions, is illustrated in Figure 1.
Figure 1. Conceptual framework of TTM-based sustainable nutrition behavior. The diagram illustrates the correspondence between sustainable nutrition behaviors—integrating environmental (e.g., food waste reduction, plant-based choices) and ethical dimensions (e.g., conscious purchasing)—and the stages of the Transtheoretical Model (TTM).
The present study aimed to develop and validate the Transtheoretical Model-based Sustainable Nutrition Behavior Scale (TTM-SNBS) for adolescents. To our knowledge, this is the first psychometrically validated instrument grounded in TTM principles. The TTM-SNBS makes a novel contribution to the systematic evaluation of sustainable nutrition behaviors among adolescents.

2. Materials and Methods

This methodological study was conducted to develop and validate the TTM-SNBS. The data were collected at a single time point, and descriptive statistics were calculated for demographic characteristics of individuals.

2.1. Study Design

The development and validation of the TTM-SNBS instrument were conducted in three stages: the development of scale items, the development of the scale itself, and the evaluation of the scale []. The reporting of the study was conducted in accordance with the updated COSMIN (COnsensus-based Standards for the selection of health Measurement INstruments) guidelines [].

2.2. Ethical Considerations

The study was approved by the Erciyes University Social and Human Sciences Ethics Committee (approval date: 29 November 2022, number: 549) and conducted in accordance with the principles outlined in the Declaration of Helsinki. It was part of a doctoral dissertation titled Investigation of the Effect of Transtheoretical Model-Based Nutrition Education on Sustainable Nutrition Behavior in Adolescents.

2.3. Item Development

The item pool was created through a comprehensive literature review in October and November 2022. A systematic search strategy was applied using international databases (Google Scholar, PubMed, Scopus, and PsycINFO) and national databases such as the National Thesis Center of the Council of Higher Education (Türkiye). The search included the keywords ‘transtheoretical model’, ‘behavior change’, ‘healthy eating’, and ‘stage of change’.
The review included both English and Turkish sources without any language restrictions. Accordingly, existing behavior change scales [,,,,,,,,] and studies focusing on behaviors related to sustainable nutrition and health [,,,,,,,,] were examined. The items were evaluated in terms of conceptual structure, wording, and content, and were subsequently adapted to the concept of sustainable nutrition. To ensure cultural relevance and comprehensibility, Turkish-adapted TTM scales [,,,] and national theses based on behavior change scales [,,,,] were also reviewed.
This process initially resulted in a scale draft consisting of 98 items, including 39 cognitive, 39 behavioral, 14 decisional balance, and six self-efficacy items, as well as 1 stage of change question. These reflected the basic structures of the TTM. The draft version was first reviewed by four faculty members (two from nutrition and dietetics, including one with public health expertise, and two from nursing with model-based research experience).
Subsequently, expert evaluation using the Delphi technique was conducted to ensure the content validity of the draft scale. Details of the Delphi procedure are presented in Section 2.4.1 (Content Validity), including details such as the number of experts, inclusion criteria, and consensus threshold.

2.4. Scale Development Process

2.4.1. Content Validity

The TTM-SNBS draft form, comprising an item pool of 99 items, was evaluated by 10 field experts using the Delphi technique. The expert panel consisted of academics with 8–25 years of professional experience, including two full professors specializing in sustainable nutrition and in scale development/adaptation. All experts had prior research or publication experience related to behavioral change, sustainability, or psychometric evaluation. The experts provided a rating for each item, categorizing it as follows: ‘Item is appropriate’, ‘Item is appropriate but can be changed’, or ‘Item is not appropriate’. The experts who indicated the option ‘The item is appropriate but requires alteration’ were invited to propose an enhancement. The content validity of each item was assessed by comparing the expert scores with the Content Validity Ratio (CVR) values suggested by Ayre and Scally (2014) and adjusted according to the number of experts []. Responses were collected and managed at Ankara Yildirim Beyazit University Statistical Consultancy Application and Research Centre using REDCap (Research Electronic Data Capture) electronic data capture tools. REDCap is a secure, web-based software platform [,].
The Delphi process consisted of three rounds. After each round, the CVR for each item was recalculated, with a value greater than 0.80 considered statistical evidence of consensus []. Items that reached consensus in the first round were excluded from subsequent rounds, while revised items were re-evaluated in the second and third rounds.
The scale items on which the experts reached consensus were subsequently reviewed by a linguist for comprehensibility, grammar, and punctuation. To assess the clarity of the items, the revised form was administered to a sample of 10 students aged between 13 and 15. Students were instructed to read and respond to each item individually. No negative feedback was received regarding the items []. After the pretest, the scale was finalized.

2.4.2. Preliminary Administration of the TTM-SNBS

The finalized scale was administered to 50 randomly selected adolescents who met the inclusion criteria. The duration of administration and the consistency of responses were analyzed.
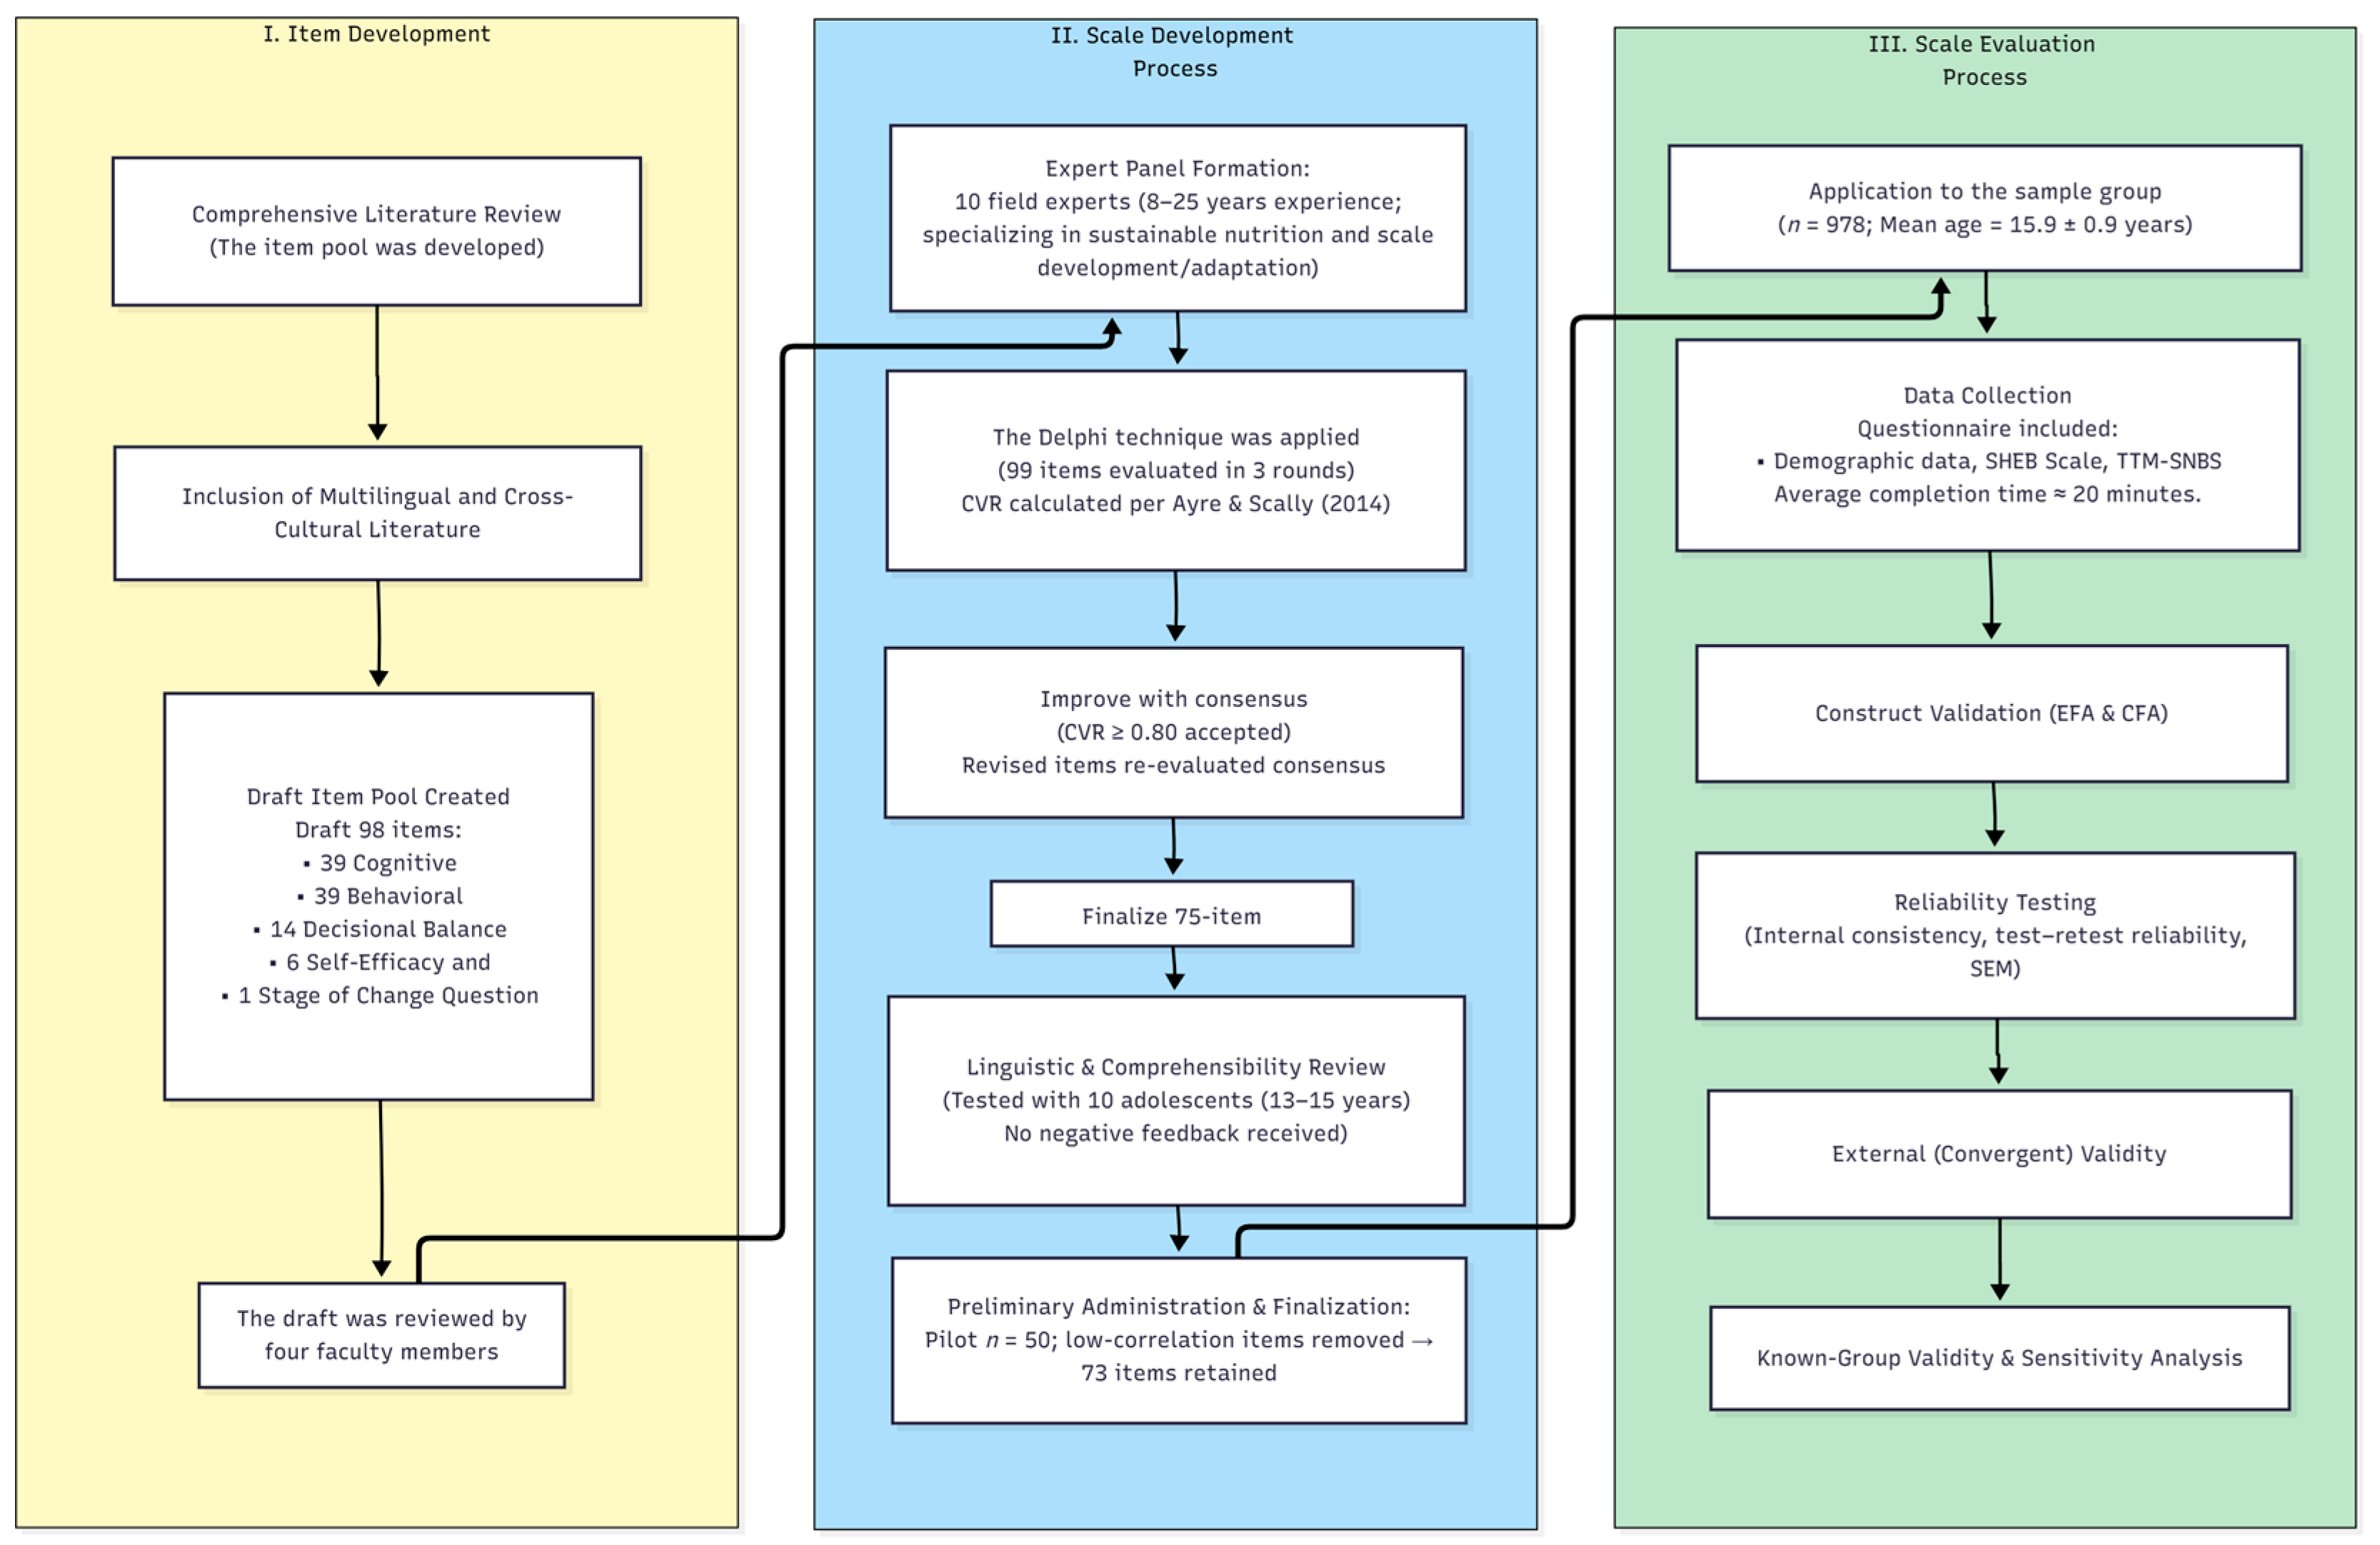
In the final phase of the study, the TTM-SNBS was administered to the target sample, and psychometric analyses were conducted to establish the scale’s validity and reliability. The overall development and validation process is summarized in Figure 2.
Figure 2. Flowchart of the Transtheoretical Model-Based Sustainable Nutrition Behavior Scale (TTM-SNBS) Development and Validation Study []. CVR: Content Validity Ratio; EFA: Exploratory Factor Analysis; CFA: Confirmatory Factor Analysis; SEM: Structural Equation Modeling.

2.5. Scale Evaluation

2.5.1. Participants

This cross-sectional study was conducted between March and June 2023 in two public Anatolian high schools located in the Çankaya district of Ankara, Türkiye. The study population consisted of students in the 9th, 10th, and 11th grades who were aged 12 years and above, had reading comprehension and response skills, and whose mother tongue was Turkish. Individuals who were either international students or below the age of 12 were excluded from the study.
The minimum sample size required for validity and reliability testing was determined. According to the literature for internal construct reliability, at least 500 students should have scale responses []. For test–retest reliability, the scale was reapplied to the students one week later, and repeatability was evaluated. For an intraclass correlation coefficient (ICC) of 0.50, it was decided to reapply the TTM to at least 30 of the students with a type I error of 0.05 and 90% power []. For external construct validity, the required sample size was calculated to obtain a relationship of at least 0.60 (>0.50) with the Sustainable and Healthy Eating Behaviors Scale (SHEBS) with a type I error of 0.05 and 90% power was calculated as at least 510 [].

2.5.2. Data Collection

Prior to the study, students and their parents were informed about its purpose, and written consent was obtained. The questionnaire was administered to 978 adolescents who voluntarily participated, with completion taking approximately 20 min.
A data collection form consisting of general information and scales sections was used in the study. Demographic and anthropometric data were collected through the general information section. At the scales section, the validated Turkish version of the SHEBS [] is included. SHEBS has been developed in accordance with the FAO’s sustainable diet concept, the LiveWell approach, and principles of sustainable and healthy nutrition behavior. SHEBS was used to assess sustainable dietary behaviors across eight factors. Also, the TTM-SNBS, developed to determine the gradual change in adolescents’ sustainable nutrition behaviors within the scope of this study, was applied. The TTM-SNBS was finalized with 75 items after three Delphi sessions and structured according to the core dimensions of the TTM (stages of change, cognitive and behavioral processes, decisional balance, and self-efficacy). The detailed structure of all instruments, including item counts, scale types, and scoring, is presented in Appendix A.

2.5.3. Statistical Analysis

The developed 75-item draft TTM-SNBS first established content validity through expert opinion and demonstrated comprehensibility and consistent responses during a preliminary study. The comprehensive psychometric evaluation of the scale’s validity and reliability was performed in the following stages:
Exploratory Factor Analysis (EFA): Conducted to identify the factor structure of the scale. Items with standardized factor loadings ≥ 0.30 were retained, and factor retention was guided by eigenvalues > 1 and the scree plot. Kaiser-Meyer-Olkin (KMO) and Bartlett’s test of sphericity tests were used to determine the sample size and suitability for factor analysis. The proportion of variance explained was reported for the identified factors [,].
Confirmatory Factor Analysis (CFA): Performed to validate the final structure obtained from EFA. Model fit indices included χ2/df, Root Mean Square Error of Approximation (RMSEA), Standardized Root Mean Square Residual (SRMR), Comparative Fit Index (CFI), and Tucker–Lewis Index (TLI), with thresholds of χ2/df < 5, RMSEA ≤ 0.08, SRMR ≤ 0.08, and CFI/TLI ≥ 0.95 considered acceptable [].
Construct Validity: The internal consistency of the scales that demonstrated construct validity was examined using Cronbach’s alpha coefficient. A coefficient value > 0.90 was considered excellent, >0.80 good, >0.70 acceptable, and >0.60 questionable in terms of reliability [].
Test–retest Reliability: To evaluate the test–retest reliability of the scales, the ICC was calculated using a two-way mixed-effects model with absolute agreement. ICC values were interpreted as follows: below 0.50 = poor reliability, between 0.50 and 0.75 = moderate reliability, between 0.76 and 0.90 = good reliability, and above 0.90 = excellent reliability [].
Measurement Error: The Standard Error of Measurement (SEM) was also calculated to assess the measurement error of the scales.
Construct Validity-Hypothesis Testing: To evaluate the construct validity of the TTM-SNBS, their relationships with the subdimensions of the SHEBS were examined. The following thresholds were used to interpret the correlation coefficients: <0.30 = negligible, <0.50 = low, <0.70 = moderate, <0.90 = high, and ≥0.90 = very high correlation [].
Known-Group Validity: Assessed by comparing the scale scores of students in the highest and lowest 27% groups based on the total TTM-SNBS score using the Mann–Whitney U test.
Floor and Ceiling Effects: Considered to be present if ≥15% of participants obtained the lowest or highest possible score on the total and subscale scores of the TTM-SNBS [].
All statistical calculations and analyses were performed using IBM SPSS Statistics version 21.0 (IBM Corp. Released 2012. Armonk, NY, USA: IBM Corp.) and the open-source R version 4.3.2 []. In R, the “psych” [], “lavaan” [], and “semPlot” [] packages were used. The level of statistical significance was set at p < 0.05.

3. Results

3.1. Item Pool and Content Validity

For content validity, consensus was reached in the third round of expert review for a total of 75 items. Items that reached consensus in earlier rounds were excluded from subsequent evaluations, whereas items without consensus were revised based on expert recommendations. This process resulted in the refinement, removal, or addition of items. The content validity index (CVI) values for the entire scale ranged between 0.78 and 1.00. The final number of items per dimension, as determined by consensus, is presented in Table 1. Additionally, the items were reviewed by 10 students to assess comprehensibility, and positive feedback was received.
Table 1. Number of Items with Expert Consensus and Content Validity Indices for Each Subscale of the TTM-SNBS.

3.2. Preliminary Study Results

Following the preliminary evaluation of 50 students, the median completion time for the TTM-SNBS was 16 min (Q1 = 12, Q3 = 20). The internal consistency for all scales ranged between 0.70 and 0.94, indicating adequate reliability (Table 2). The item “I take care not to waste food and beverages” showed a negative correlation with the total score, thereby impairing summability. Similarly, in the CS-DB subscale, the item “I enjoy consuming sugary and fizzy drinks when I am thirsty” exhibited a low and negative correlation with the total score. Consequently, items demonstrating low or negative item–total correlations within the C-PCS and CS-DB subscales were removed. In total, 73 items were retained for the validity analyses.
Table 2. Internal Consistency Values Obtained from the Preliminary Study (n = 50).

3.3. Study Sample Characteristics

The study was completed with responses from 978 students, 53.8% of whom were male. The mean age of the participants was 15.9 ± 0.9 years, and the mean BMI was 21.1 ± 3.6 kg/m2 (Table 3).
Table 3. Descriptive Characteristics of the Participants (n = 978).

3.4. Internal Construct Validity

Item–total correlation and factor structure analyses were performed separately for each subscale of the TTM-SBDS. Decisions to retain or remove items were based on item misfit in the item response theory model, low factor loadings in EFA (<0.30), and evaluations of model performance and reliability with or without the item. KMO values above 0.60 confirmed that the sample size was adequate for factor analysis. Bartlett’s test of sphericity was significant for all scales (p < 0.001), indicating sufficient inter-item correlations. The explained variance of the scales ranged from 37.8% to 60.2%, while internal consistency values ranged from 0.617 to 0.915. The final item numbers for all subscales, together with the EFA and CFA results, are presented in Table 4. The C-PCS was structured into three factors, the B-PCS into four factors, and the PS-DB, CS-DB, and SES each into a single factor.
Table 4. Results of Construct Validity Analysis.
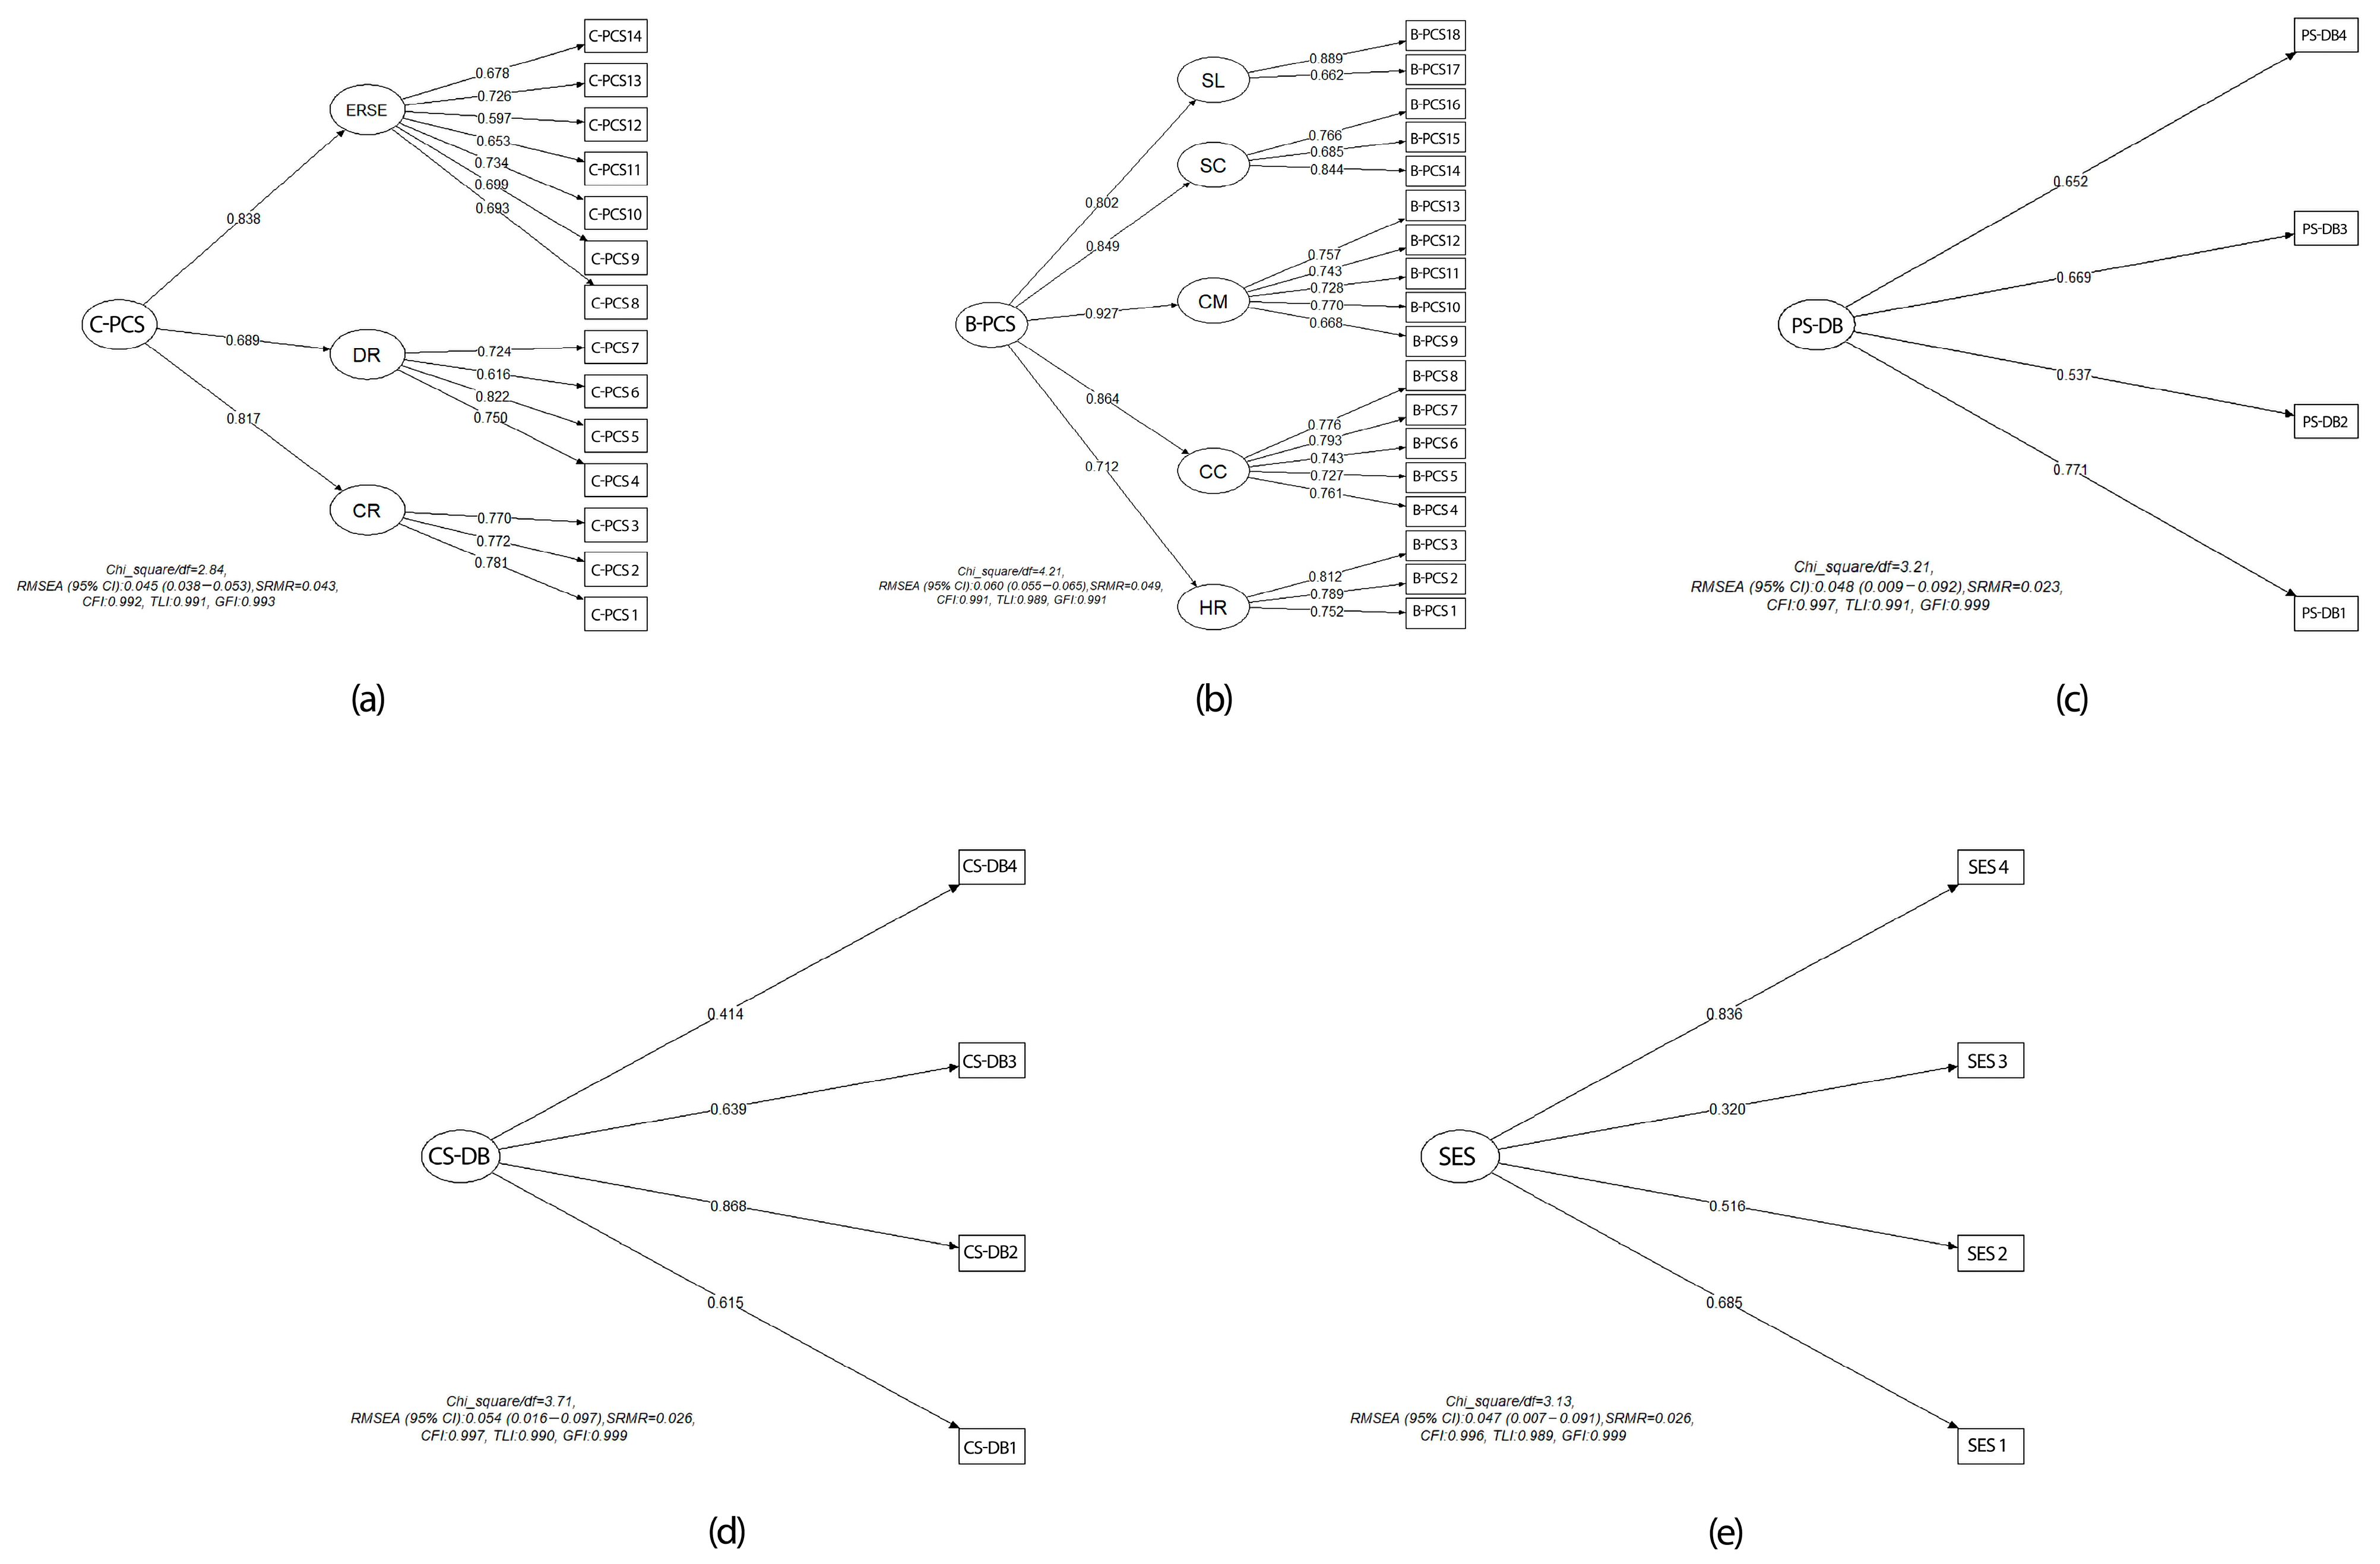
CFA was performed to validate the structure identified through EFA. Model fit indices and factor loadings obtained from CFA are presented in Figure 3a–e for each subscale. The χ2/df values were lower than the accepted limit value in the literature (<3 indicates a good fit, <5 indicates an acceptable fit). The CFI, TLI, and GFI values exceeded 0.95, indicating good model fit. The RMSEA value was below 0.08 for all subscales, further supporting model adequacy.
Figure 3. Confirmatory Factor Analysis (CFA) models of the TTM-SNBS subscales. (a) Second-order factor model of the Cognitive Change Process Scale (C-PCS). Environmental Reevaluation and Self-evaluation (ERSE), Dramatic Relief (DR), Consciousness Raising (CR); (b) Second-order factor model of the Behavioral Change Process Scale (B-PCS). Self Liberation (SL), Stimulus Control (SC), Contingency Management (CM), Counter Conditioning (CC), Helping Relationship (HR); (c) First-order factor model of the Pros of Decisional Balance (PS-DB); (d) Second-order factor model of the Cons of Decisional Balance (CS-DB); (e) Second-order factor model of the Self-Efficacy Scale (SES). Chi_square/df: Chi-square divided by degrees of freedom; RMSEA: Root Mean Square Error of Approximation; SRMR: Standardized Root Mean Square Residual; CFI: Comparative Fit Index; TLI: Tucker–Lewis Index; GFI: Goodness-of-Fit Index.
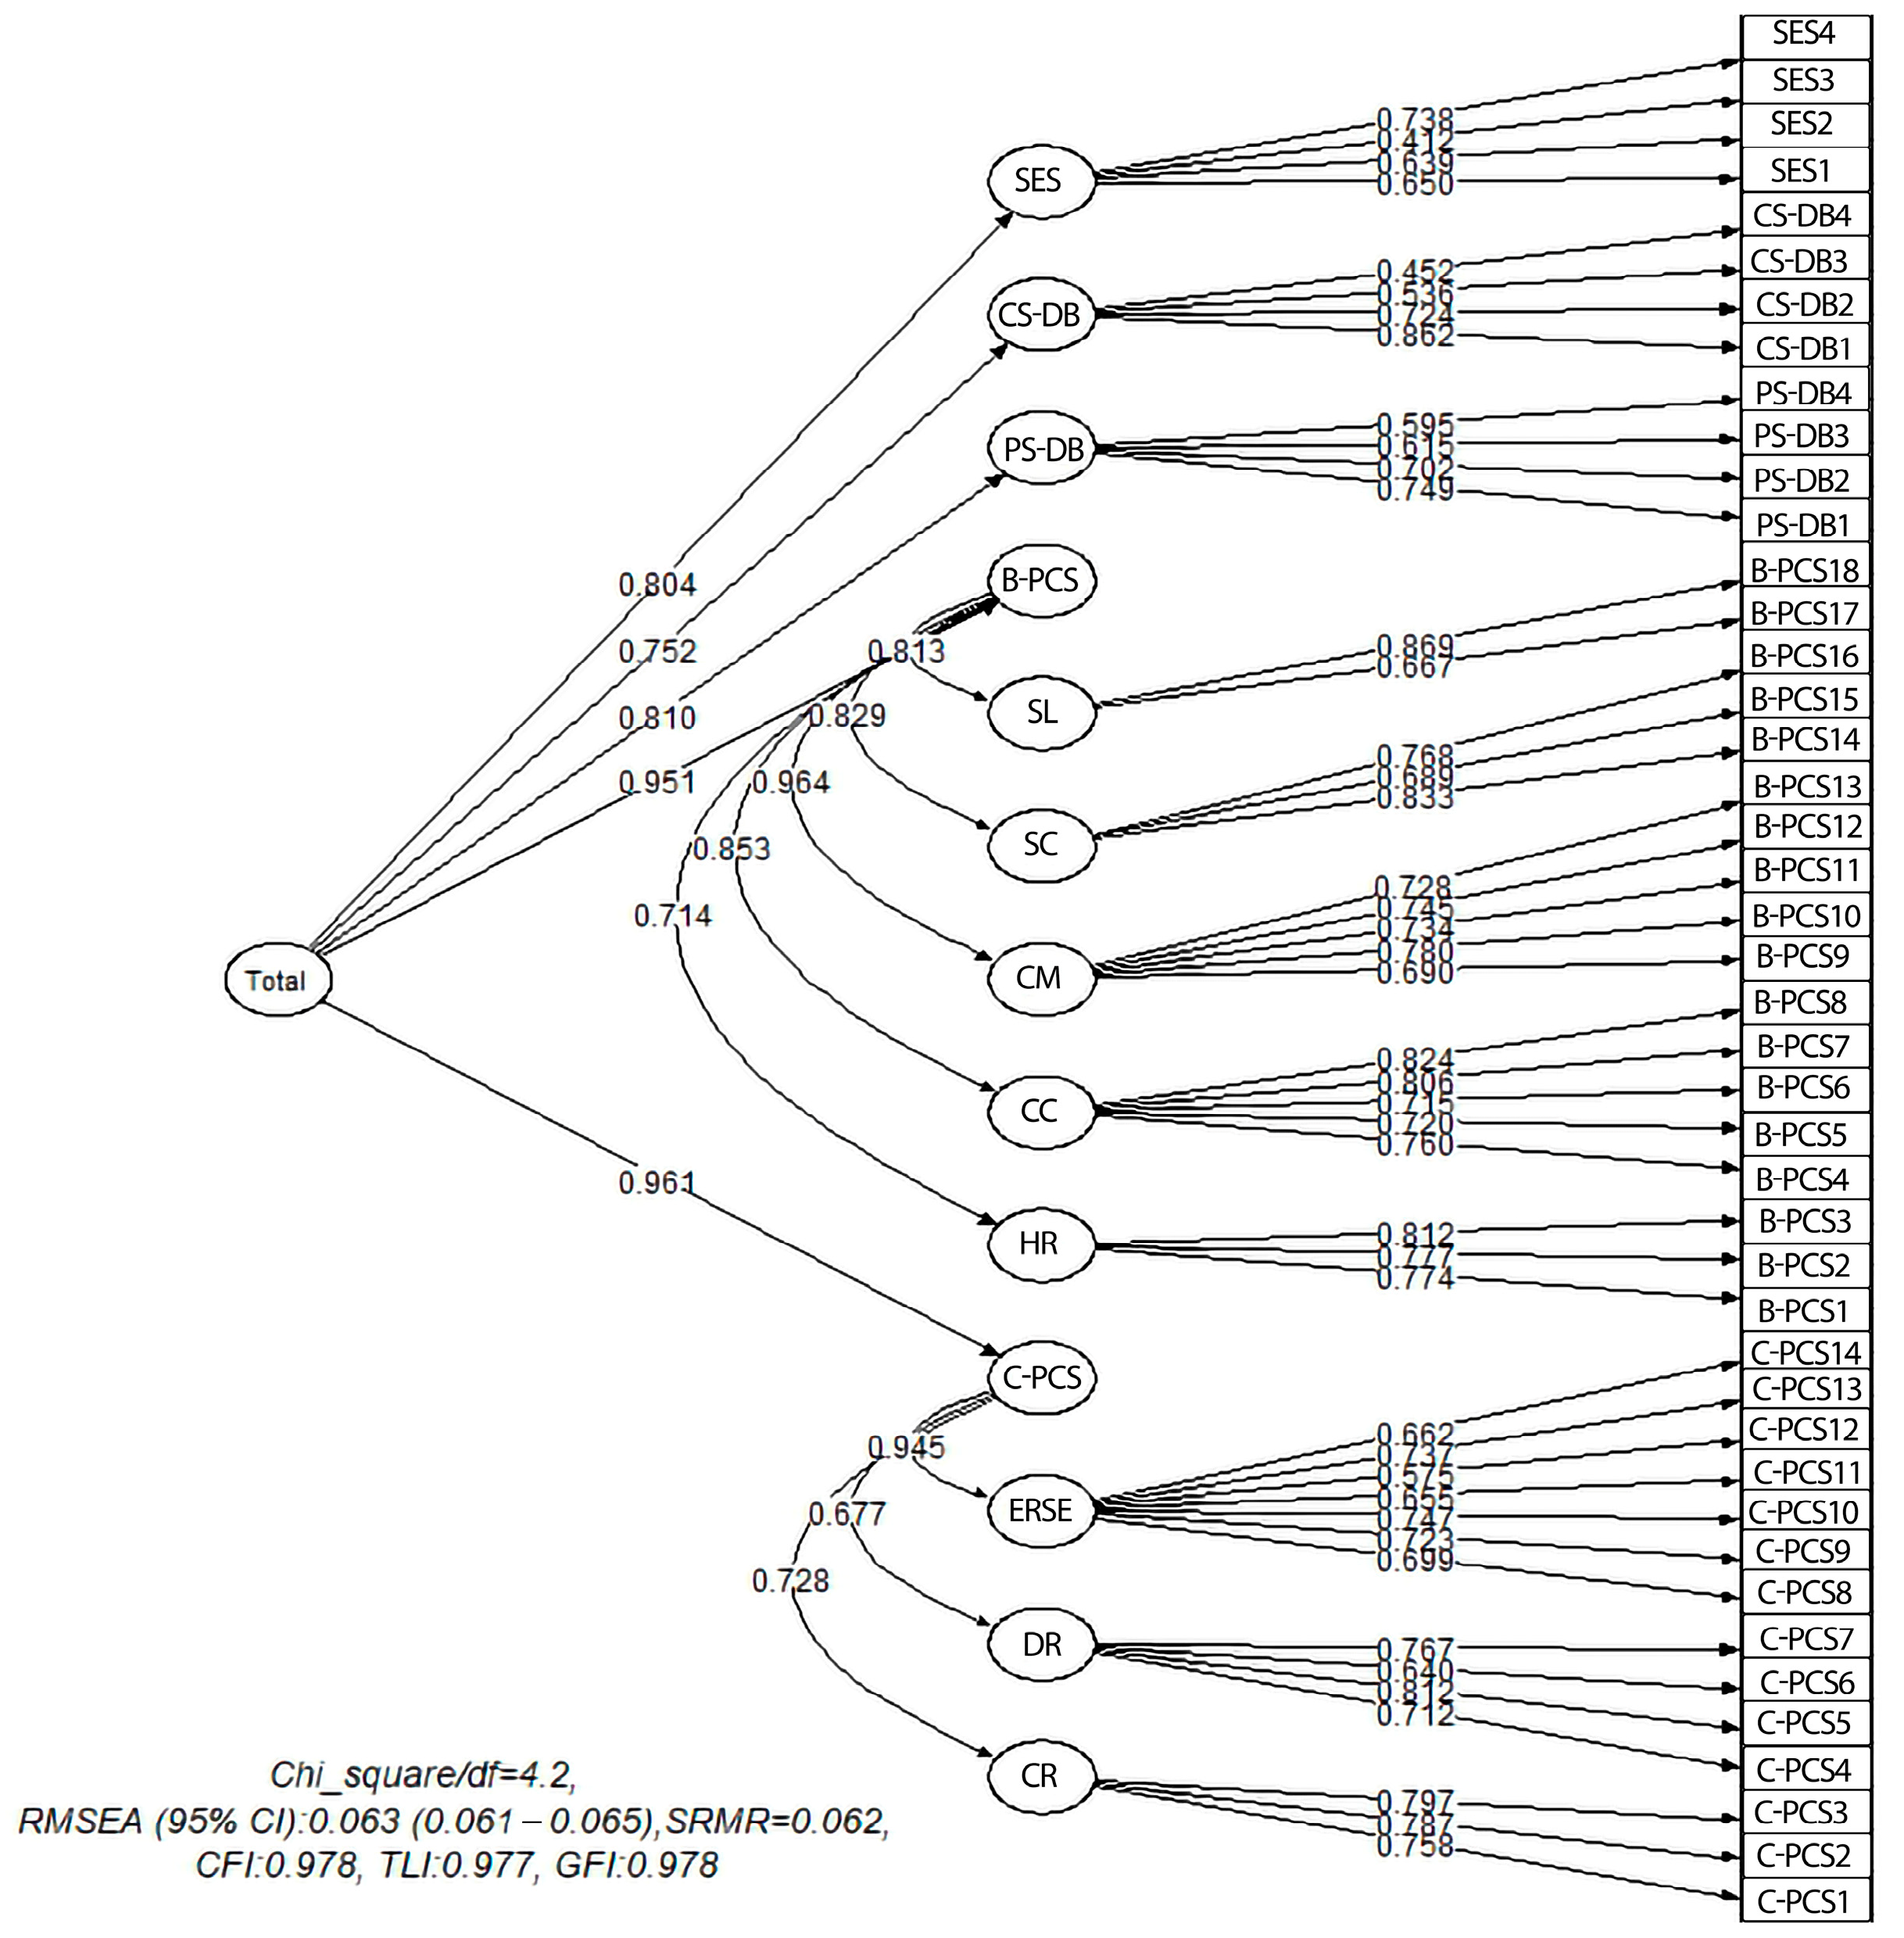
A factor analysis based on total scores across the C-CPS, B-CPS, PS-DB, CS-DB, and SES items indicated that the overall model demonstrated good fit. The corresponding model and fit index values are displayed in Figure 4.
Figure 4. Third-order factor model in Confirmatory Factor Analysis of the total score. SES: Self-Efficacy Scale; CS-DB: Cons of Decisional Balance; PS-DB: Pros of Decisional Balance; B-PCS: Behavioral Change Process Scale; SL: Self Liberation; SC: Stimulus Control; CM: Contingency Management; CC: Counter Conditioning; HR: Helping Relationship; C-PCS: Cognitive Change Process Scale; ERSE: Environmental Reevaluation and Self-evaluation; DR: Dramatic Relief; CR: Consciousness Raising; Chi_square/df: Chi-square divided by degrees of freedom; RMSEA: Root Mean Square Error of Approximation; SRMR: Standardized Root Mean Square Residual; CFI: Comparative Fit Index; TLI: Tucker–Lewis Index; GFI: Goodness-of-Fit Index.
To assess test–retest reliability, the scales were re-administered to students after one week. Inconsistent responses were excluded. The resulting ICCs indicated moderate-to-excellent repeatability (Table 5).
Table 5. Test–retest reliability.
Convergent validity (external construct validity) was examined by analyzing the correlations between the total score of the TTM-SNBS and the subscales of the SHEBS (Table 6). All correlation coefficients were statistically significant (p < 0.001). The observed correlations ranged from r = 0.455 to r = 0.588, indicating low-to-moderate positive relationships between sustainable nutrition behaviors and sustainable and healthy eating behaviors. These findings provide empirical support for the convergent validity of the TTM-SNBS.
Table 6. The correlation coefficient between TTM-SNBS and the SHEBS (external validity).
Floor and ceiling effects for all scales were below 15% (Table 7). For known-group validity, the top 27% (n = 262) and bottom 27% of participants were compared based on total scores. The differences between these two groups were statistically significant (p < 0.001). Students in the top 27% group had higher TTM-SNBS total scores compared with those in the bottom 27% group.
Table 7. Floor and ceiling effect.
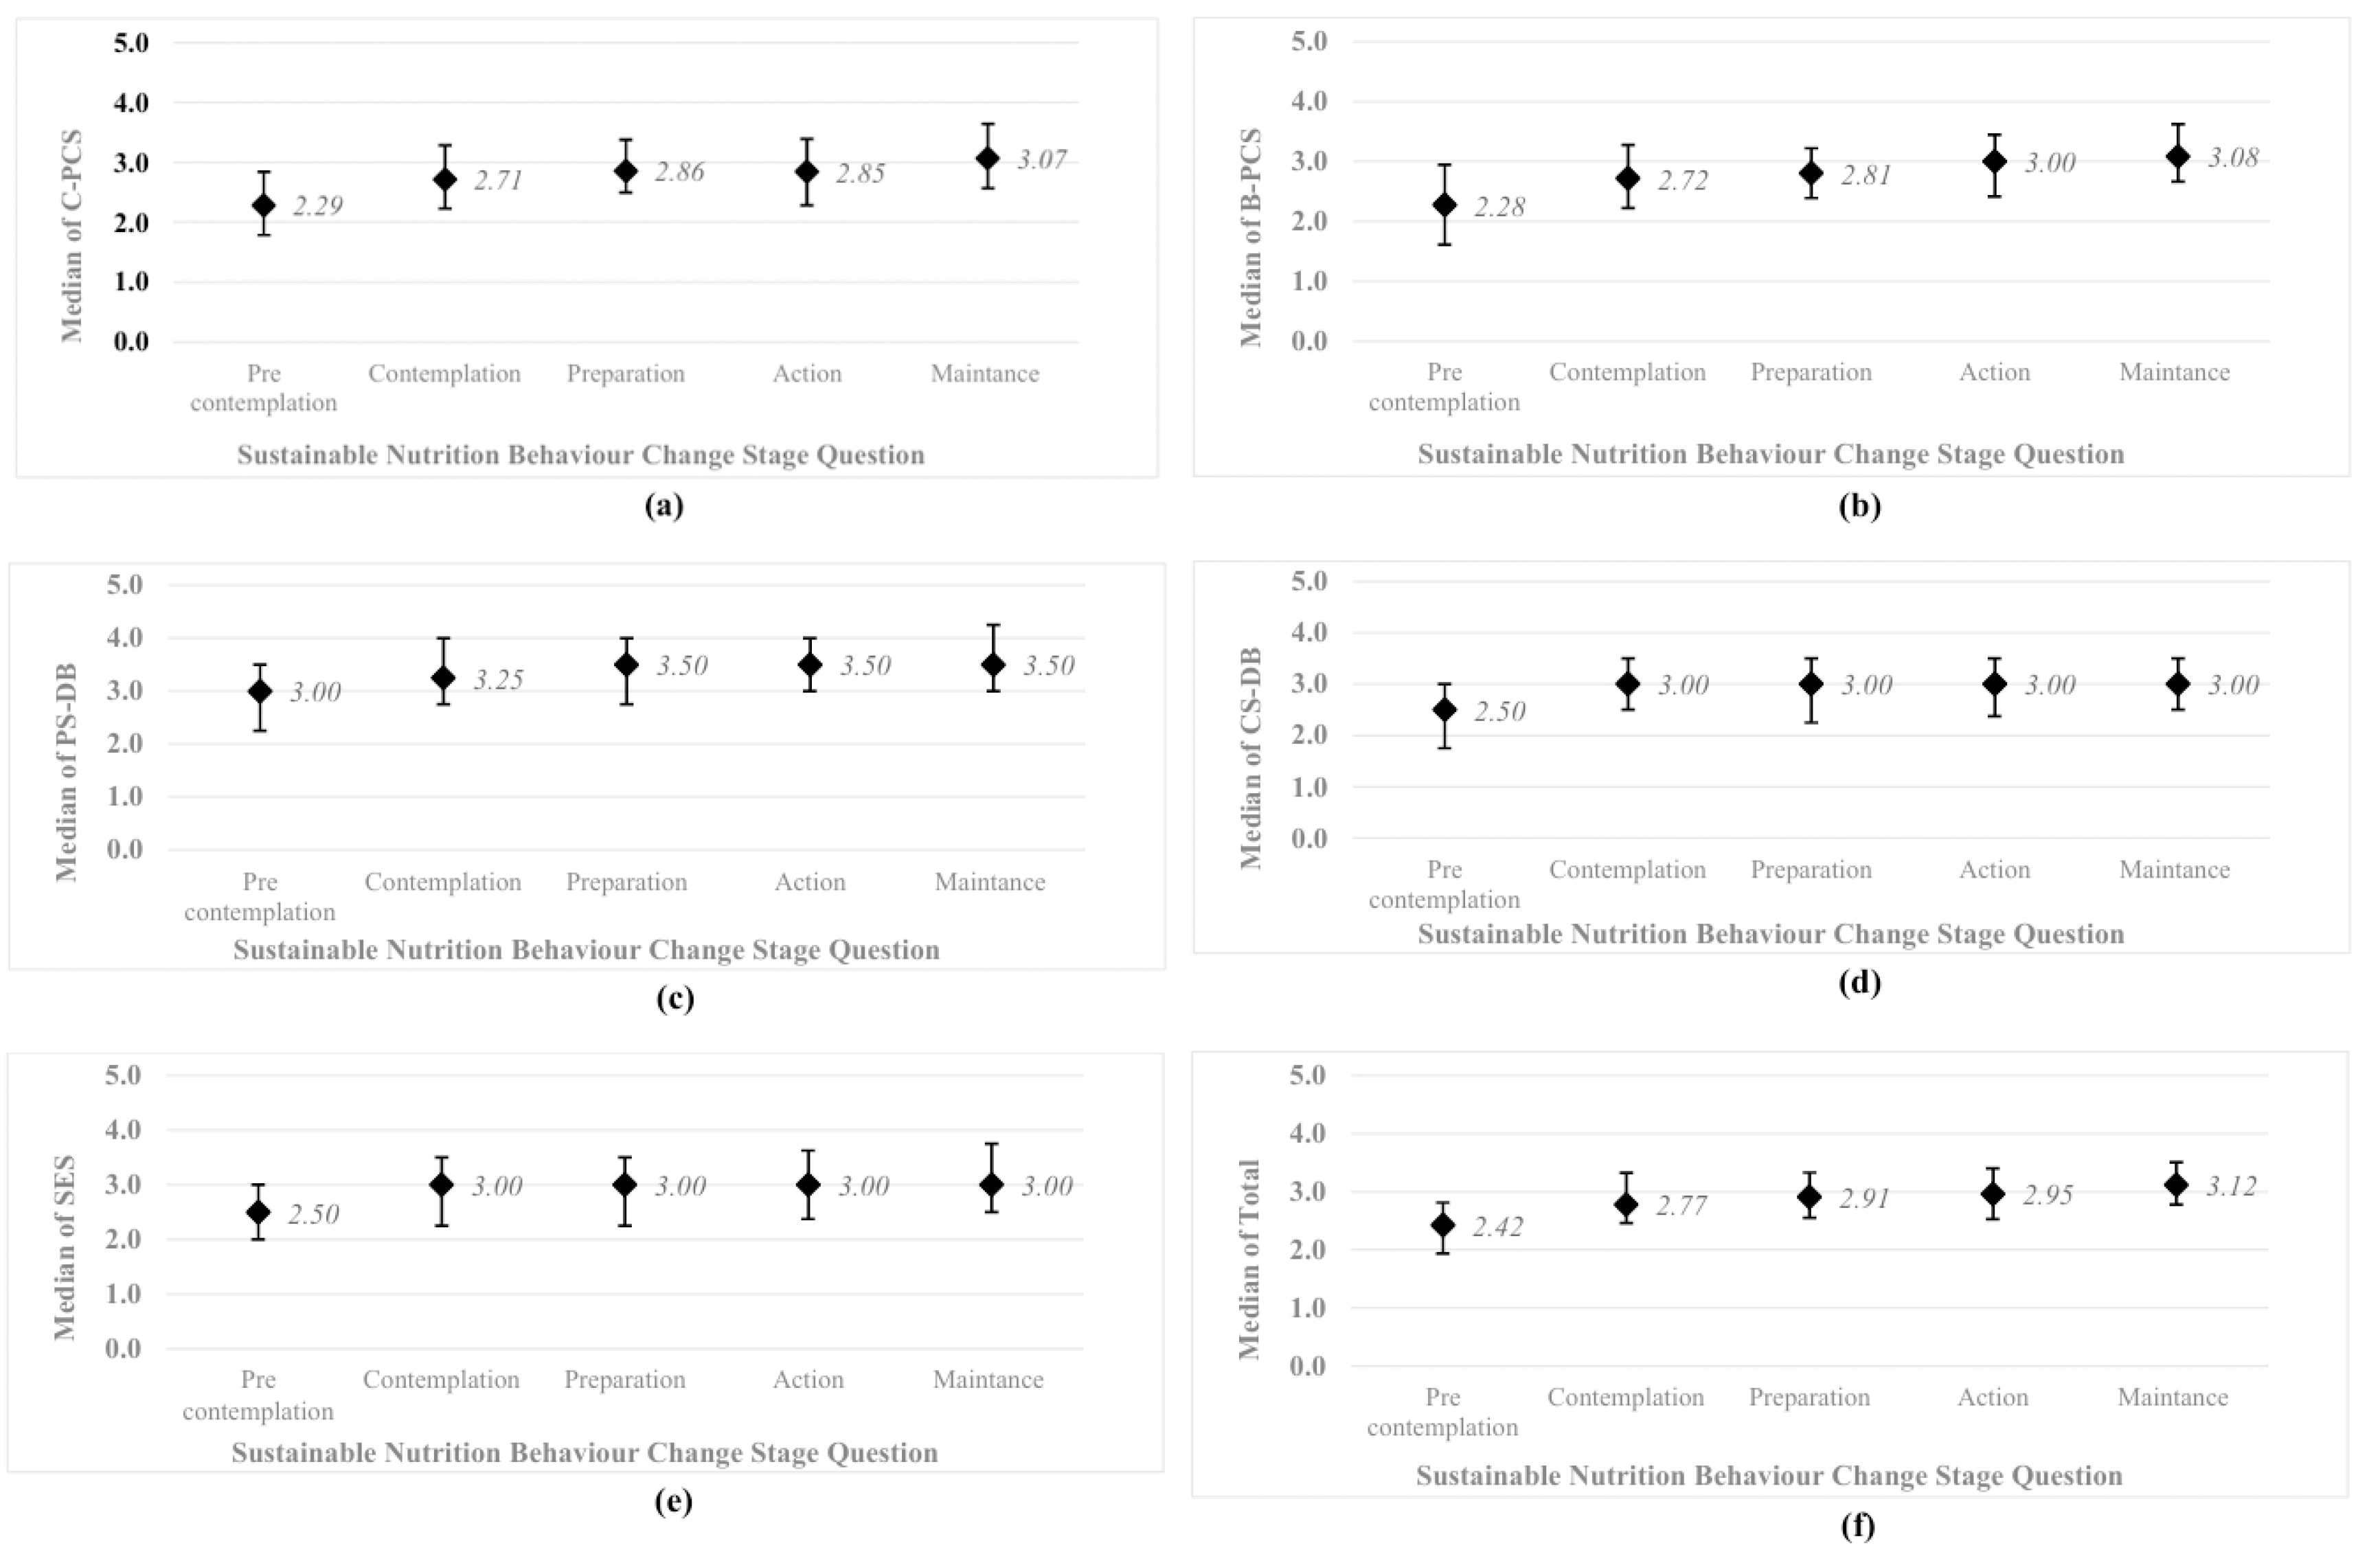
Analysis of responses to the Sustainable Nutrition Change Stage question revealed that 27.8% of students reported not following sustainable eating patterns and not planning to change within the next six months, whereas 16.0% reported maintaining sustainable eating habits for more than six months. The distribution of total and subscale scores based on stage-of-change responses is presented in Figure 5. Statistical comparisons indicated that at least one response category differed significantly from another (all p < 0.001).
Figure 5. Median scores and interquartile range values of the Sustainable Nutrition Behavior Change question response categories: (a) Cognitive Processes of Change Scales (C-PCS); (b) Behavioral Processes of Change Scales (B-PCS); (c) Pros Scale of Decisional Balance (PS-DB); (d) Cons Scale of Decisional Balance (CS-DB); (e) Self-Efficacy Scale (SES); (f) TTM-SNBS Total Score.

4. Discussion

This study aimed to develop and validate an original scale based on the transtheoretical model in Turkish that comprehensively assesses sustainable eating behaviors and evaluates its psychometric properties. Systematic reviews examining model-based interventions targeting nutrition behaviors indicate that the TTM is frequently used, particularly for tools related to the stages of change. However, reliable and valid measurement instruments for other constructs—processes of change, decisional balance, and self-efficacy—remain limited. The TTM-SNBS addresses this methodological gap by incorporating all four core components of the TTM.

4.1. Content Validation

Several studies have employed the Delphi technique to ensure content validity during scale development [,,]. Similarly, in this study, the Delphi technique was applied, and item clarity was enhanced through linguistic review and student feedback following iterative rounds. The CVI values ranged from 0.78 to 1.00 across all subscales, exceeding recommended thresholds []. While similar scales in the literature have often relied solely on expert opinion [,,,], the TTM-SNBS demonstrated stronger content validity by combining a systematic Delphi process with feedback from the target population. Furthermore, in a preliminary assessment involving 50 students, the scale’s comprehensibility and appropriate administration time were confirmed, and items with low correlations were removed, resulting in a 73-item version for subsequent analyses.

4.2. Structural Validity

Both EFA and CFA confirmed the construct validity of the TTM-SNBS. KMO values (0.66–0.93) and Bartlett’s test results (p < 0.001) indicated suitability for factor analysis, with explained variance ranging from 37.8% to 60.2%. The analyses revealed a multidimensional factor structure reflecting the four TTM constructs (processes of change, decisional balance, self-efficacy, and stages). The meaningful and theoretically consistent factor loadings across subscales indicate that the model aligns with the conceptual framework of the TTM.
Previous studies have shown that TTM-based scales are often designed to measure a single construct [,]. For example, Erol et al. [] developed a “process of change” scale for fruit and vegetable consumption among adolescents, while Kadıoğlu et al. [] focused solely on self-efficacy. The TTM-SNBS uniquely contributes to the literature as the first Turkish scale to simultaneously validate all four core constructs of the TTM.

4.3. Internal Consistency

The reliability of the TTM-SNBS was evaluated in terms of internal consistency and temporal stability. Cronbach’s α coefficients ranged from 0.75 to 0.93 across subscales, with items showing low (<0.30) or negative item-total correlations removed to enhance homogeneity. These coefficients fall within the good-to-excellent range based on accepted thresholds [] and demonstrate stronger internal consistency than those reported in previous studies [,].
Test–retest analysis showed significant stability across all subscales, with ICC values ranging from moderate to good and strong reliability observed for the total score []. Whereas most previous studies reported reliability only for the stage construct in TTM-based scales [], this study also provided reliability evidence for the decisional balance, processes, and self-efficacy dimensions.

4.4. External Validity, Known Groups, and Ceiling/Floor Effects

External validity was examined using the SHEBS, which measures sustainable and healthy eating behaviors. Significant correlations in the expected direction were found between the TTM-SNBS and the SHEBS subscales (r = 0.26–0.58), supporting conceptual overlap while also highlighting the unique structure of the TTM-SNBS. While the literature generally reports only moderate correlations for stage-related constructs in TTM-based scales [,,], the present findings provide evidence for the external validity of all four constructs.
Known-group validity analyses revealed significant differences between the lowest and highest 27% groups (p < 0.001). In addition, the ceiling and floor effects remained below 15% for all subscales, indicating that the scale retained strong discriminative ability and sensitivity across score distributions.

4.5. Contributions, Limitations, and Future Studies

This scale not only serves a descriptive purpose but also provides a dynamic tool for tracking behavioral change and planning interventions. In this respect, it fills a critical gap, particularly in education-based behavior change programs.
A major strength of this study is its adherence to COSMIN guidelines. The use of multiple validity assessments combined with a large sample size enhances the reliability and generalizability of the findings.
However, several limitations should be acknowledged. Since the sample was limited to high school students, there is a risk of selection bias, which restricts generalization to other age groups or socioeconomic backgrounds. Additionally, self-reported measures may introduce social desirability bias, and caution should be exercised when generalizing these findings.
Another potential limitation is that the concept of sustainable nutrition may vary across sociocultural contexts. As the TTM-SNBS was developed and validated among Turkish adolescents, future studies should examine its cross-cultural applicability and measurement invariance in different adolescent populations. Further studies are encouraged to validate the scale in other populations and conduct additional reliability and validity analyses across diverse cultural settings.
In practical terms, the TTM-SNBS offers a valuable instrument for educators, researchers, and policymakers to design, implement, and evaluate theory-based interventions promoting sustainable dietary behaviors among adolescents. This study demonstrates that the proposed framework can effectively guide nutrition education and public health initiatives aimed at fostering sustainability.

5. Conclusions

This study developed and validated the TTM-SNBS for adolescents. The scale demonstrated strong psychometric properties, including robust content, construct, and external validity, along with good reliability across subscales. Unlike previous instruments focusing on a single construct, the TTM-SNBS provides a comprehensive framework for assessing sustainable nutrition behaviors by integrating all four core components of the TTM—stages of change, processes of change, decisional balance, and self-efficacy. By offering a reliable and valid instrument, this study fills a methodological gap and contributes to advancing theory-based assessment in nutrition behavior research. Future studies should investigate the applicability of the TTM-SNBS across diverse populations and cultural contexts to further strengthen its generalizability and practical utility in intervention planning.

Author Contributions

Conceptualization, Z.C.A., O.B., and O.M.; methodology, P.D., Z.C.A., and O.M.; software, P.D.; validation, P.D.; formal analysis, P.D.; data curation, P.D.; writing—original draft preparation, O.M.; writing—review and editing, Z.C.A. and P.D.; visualization, P.D. and O.M.; project administration, Z.C.A. and O.B. All authors have read and agreed to the published version of the manuscript.

Funding

This research received no external funding.

Institutional Review Board Statement

The study was conducted in accordance with the Declaration of Helsinki and approved by the Erciyes University Social and Human Sciences Ethics Committee (approval date: 29 November 2022, number: 549).

Data Availability Statement

The data presented in this study are available on request from the corresponding author. The data are not publicly available due to ethical restrictions.

Acknowledgments

We thank the school principal and teachers for their valuable support in facilitating the meetings with students. During the preparation of this manuscript, we utilized DeepL Translator (2025), ChatGPT (OpenAI, GPT-5, 2025), Consensus (consensus.app accessed between January and November 2025), and Litmaps (litmaps.com, an AI-powered literature search tool; accessed between January and November 2025) for language editing support, grammar improvement, and literature cross-checking. The authors have reviewed and edited the output and take full responsibility for the content of this publication.

Conflicts of Interest

The authors declare no conflicts of interest.

Abbreviations

The following abbreviations are used in this manuscript
SDGsSustainable Development Goals
WHOWorld Health Organization
FAOFood and Agriculture Organization
TTMTranstheoretical Model
TTM-SNBSTranstheoretical Model-based Sustainable Nutrition Behavior Scale
CVRContent Validity Ratio
REDCapResearch Electronic Data Capture
COSMINCOnsensus-based Standards for the selection of health Measurement INstruments
SHEBSSustainable and Healthy Eating Behaviors Scale
EFAExploratory Factor Analysis
CFAConfirmatory Factor Analysis
CFIComparative Fit Index
SEMStructural Equation Modeling
ICCIntraclass Correlation Coefficient
SCQStages of Change Questionnaire
C-PCSCognitive Processes of Change Scale
ERSEEnvironmental Reevaluation and Self-evaluation
DRDramatic Relief
CRConsciousness Raising
B-PCSBehavioral Processes of Change Scale
SLSelf Liberation
SCStimulus Control
CMContingency Management
CCCounter Conditioning
HRHelping Relationship
PS-DBPros Subscale of Decisional Balance
CS-DBCons Subscale of Decisional Balance
SESSelf-Efficacy Scale
Chi_square/dfChi-square divided by degrees of freedom
RMSEARoot Mean Square Error of Approximation
SRMRStandardized Root Mean Square Residual
TLITucker–Lewis Index
GFIGoodness-of-Fit Index

Appendix A

Data Collection Form

This appendix presents a detailed structure of the tools used in the study, including item counts, scale type, scoring, and subdimensions.
General Information Section
DescriptionNumber of Items/QuestionsScale TypeSubdimensions/Notes
General InformationCollects demographic and anthropometric data.10 questionsNominal/
Continuous
Gender, age, date of birth, height, weight, household, parental info
Scales Section
SHEBS
(Köksal et al., 2023) []
Sustainable and Healthy Eating Behaviors Scale 34 items
(in 8 factors)
7-point Likert8 factors: Healthy nutrition, Quality marks, Meat reduction, Local food, Low fat, Avoiding waste, Animal health, Seasonal food
TTM-SNBSTranstheoretical Model-Based Sustainable Nutrition Behavior Scale1 question & 75 items
(After three Delphi sessions)
Categorical & 5-point LikertStructured according to TTM dimensions: stage of change question, change process (cognitive & behavioral), decision balance (pros & cons), and self-efficacy.
Subdimensions of the TTM-SNBS
SCQStages of Change Questionnaire1 questionCategorical
(5 stages)
Stages: Precontemplation, Contemplation, Preparation, Action, Maintenance
C-PCSCognitive Processes of Change Scale31 items5-point LikertHigher scores indicate greater awareness.
B-PCSBehavioral Processes of Change Scale27 items5-point LikertHigher scores indicate stronger behavioral engagement.
PS-DBPros Subscale of Decisional Balance4 items5-point LikertHigher scores reflect higher perceived benefits
CS-DBCons Subscale of Decisional Balance7 items5-point LikertHigher scores reflect higher perceived barriers
SESSelf-Efficacy Scale6 items5-point LikertHigher scores indicate stronger self-efficacy

References

  1. Grosso, G.; Mateo, A.; Rangelov, N.; Buzeti, T.; Birt, C. Nutrition in the Context of the Sustainable Development Goals. Eur. J. Public Health 2020, 30, i19–i23. [Google Scholar] [CrossRef] [PubMed]
  2. FAO and WHO. Sustainable Healthy Diets Guiding Principles; WHO: Geneva, Switzerland, 2019. [Google Scholar]
  3. WHO. Global Accelerated Action for the Health of Adolescents (AA-HA!): Guidance to Support Country Implementation, 2nd ed.; World Health Organization: Geneva, Switzerland, 2023. [Google Scholar]
  4. Lanham, A.R.; van der Pols, J.C. Toward Sustainable Diets—Interventions and Perceptions Among Adolescents: A Scoping Review. Nutr. Rev. 2025, 83, e694–e710. [Google Scholar] [CrossRef] [PubMed]
  5. Macit-Çelebi, M.S.; Bozkurt, O.; Kocaadam-Bozkurt, B.; Köksal, E. Evaluation of Sustainable and Healthy Eating Behaviors and Adherence to the Planetary Health Diet Index in Turkish Adults: A Cross-Sectional Study. Front. Nutr. 2023, 10, 1180880. [Google Scholar] [CrossRef] [PubMed]
  6. Aksoy Canyolu, B.; Martini, D.; Şen, N. Determining Sustainable Food Choice Motives: Validity and Reliability of the Sustainable Food Choice Questionnaire (SUS-FCQ) in Turkish Adults. Sustainability 2024, 16, 3519. [Google Scholar] [CrossRef]
  7. Garipoglu, G.; Meral Koc, B.; Ozlu, T. Behaviors Scale towards Sustainable Nutrition: Development and Validity-Reliability Analysis. Nutr. Food Sci. 2023, 53, 1332–1343. [Google Scholar] [CrossRef]
  8. Duradoni, M.; Valdrighi, G.; Donati, A.; Fiorenza, M.; Puddu, L.; Guazzini, A. Development and Validation of the Readiness to Change Scale (RtC) for Sustainability. Sustainability 2024, 16, 4519. [Google Scholar] [CrossRef]
  9. Yüksel, A.; Parmaksız, A.; Yılmaz Önal, H.; Kalkan, I.; Ercan, A. Turkish Adaptation of Sustainable and Healthy Eating Behavior Scale: A Validity and Reliability Study on Young Adults. Turk. Klin. J. Health Sci. 2024, 9, 237–246. [Google Scholar] [CrossRef]
  10. Żakowska-Biemans, S.; Pieniak, Z.; Kostyra, E.; Gutkowska, K. Searching for a Measure Integrating Sustainable and Healthy Eating Behaviors. Nutrients 2019, 11, 95. [Google Scholar] [CrossRef]
  11. Hilary, S.; Safi, S.; Sabir, R.; Numan, A.B.; Zidan, S.; Platat, C. Development and Validation of a Tool to Assess Knowledge, Attitudes, and Practices toward Diet Sustainability. Front. Sustain. Food Syst. 2024, 8, 1432057. [Google Scholar] [CrossRef]
  12. Köksal, E.; Bilici, S.; Çıtar Dazıroğlu, M.E.; Erdoğan Gövez, N. Validity and Reliability of the Turkish Version of the Sustainable and Healthy Eating Behaviors Scale. Br. J. Nutr. 2023, 129, 1398–1404. [Google Scholar] [CrossRef]
  13. Pieniak, Z.; Zakowska-Biemans, S.; Kostyra, E.; Raats, M. Sustainable Healthy Eating Behaviour of Young Adults: Towards a Novel Methodological Approach. BMC Public Health 2016, 16, 577. [Google Scholar] [CrossRef] [PubMed]
  14. Prochaska, J.O.; Velicer, W.F.; Rossi, J.S.; Goldstein, M.G.; Marcus, B.H.; Rakowski, W.; Fiore, C.; Harlow, L.L.; Redding, C.A.; Rosenbloom, D.; et al. Stages of Change and Decisional Balance for 12 Problem Behaviors. Health Psychol. 1994, 13, 39–46. [Google Scholar] [CrossRef] [PubMed]
  15. Prochaska, J.O.; Velicer, W.F. The Transtheoretical Model of Health Behavior Change. Am. J. Health Promot. 1997, 12, 38–48. [Google Scholar] [CrossRef]
  16. Spencer, L.; Wharton, C.; Moyle, S.; Adams, T. The Transtheoretical Model as Applied to Dietary Behaviour and Outcomes. Nutr. Res. Rev. 2007, 20, 46–73. [Google Scholar] [CrossRef]
  17. Erol, S.; Erdoğan, S. Application of Transtheoretic Model for Improving and Changing Health Behaviours. Atatürk Univ. Sch. Nurs. J. 2007, 10, 86–94. [Google Scholar]
  18. Boateng, G.O.; Neilands, T.B.; Frongillo, E.A.; Melgar-Quiñonez, H.R.; Young, S.L. Best Practices for Developing and Validating Scales for Health, Social, and Behavioral Research: A Primer. Front. Public Health 2018, 6, 149. [Google Scholar] [CrossRef]
  19. Gagnier, J.J.; de Arruda, G.T.; Terwee, C.B.; Mokkink, L.B.; Elsman, E.B.M.; Firth, A.D.; Mehdipour, A.; Coon, C.D.; Bjorner, J.B.; Peipert, J.D.; et al. COSMIN Reporting Guideline for Studies on Measurement Properties of Patient-reported Outcome Measures: Version 2.0. Qual. Life Res. 2025, 34, 1901–1911. [Google Scholar] [CrossRef]
  20. Hu, L.; Bentler, P.M. Cutoff Criteria for Fit Indexes in Covariance Structure Analysis: Conventional Criteria versus New Alternatives. Struct. Equ. Model. 1999, 6, 1–55. [Google Scholar] [CrossRef]
  21. Champion, K.E.; Parmenter, B.; McGowan, C.; Spring, B.; Wafford, Q.E.; Gardner, L.A.; Thornton, L.; McBride, N.; Barrett, E.L.; Teesson, M.; et al. Effectiveness of School-Based EHealth Interventions to Prevent Multiple Lifestyle Risk Behaviours among Adolescents: A Systematic Review and Meta-Analysis. Lancet Digit. Health 2019, 1, e206–e221. [Google Scholar] [CrossRef]
  22. Di Noia, J.; Schinke, S.P.; Prochaska, J.O.; Contento, I.R. Application of the Transtheoretical Model to Fruit and Vegetable Consumption among Economically Disadvantaged African-American Adolescents: Preliminary Findings. Am. J. Health Promot. 2006, 20, 342–348. [Google Scholar] [CrossRef] [PubMed]
  23. Erol, S.; Ergün, A.; Kadıoğlu, H. Reliability and Validity of the Turkish Version of the Process of Change Scale for Fruit and Vegetable Consumption in Adolescents. J. Health Sci. Prof. 2016, 3, 106–114. [Google Scholar] [CrossRef]
  24. Gur, K.; Erol, S.; Kadioglu, H.; Ergun, A.; Boluktas, R. The Impact on Adolescents of a Transtheoretical Model-Based Programme on Fruit and Vegetable Consumption. Public Health Nutr. 2019, 22, 2500–2508. [Google Scholar] [CrossRef]
  25. Han, H.; Gabriel, K.P.; Kohl, H.W. Application of the Transtheoretical Model to Sedentary Behaviors and Its Association with Physical Activity Status. PLoS ONE 2017, 12, e0176330. [Google Scholar] [CrossRef]
  26. Kadioglu, H.; Erol, S.; Ergun, A. Reliability and Validity of the Turkish Version of the Situational Self-Efficacy Scale for Fruit and Vegetable Consumption in Adolescents. Am. J. Health Promot. 2015, 29, 273–275. [Google Scholar] [CrossRef] [PubMed]
  27. Nakabayashi, J.; Melo, G.R.; Toral, N. Transtheoretical Model-Based Nutritional Interventions in Adolescents: A Systematic Review. BMC Public Health 2020, 20, 1543. [Google Scholar] [CrossRef] [PubMed]
  28. Zebrowski, P.M.; Rodgers, N.H.; Gerlach, H.; Paiva, A.L.; Robbins, M.L. Applying the Transtheoretical Model to Stuttering Management among Adolescents: Part I. Scale Development. Am. J. Speech Lang. Pathol. 2021, 30, 2492–2509. [Google Scholar] [CrossRef]
  29. Aksoydan, E. Why Sustainability? About Sustainable Living. In Sustainable Living Guide; Aksoydan, E., Yaman, Ö., Eds.; Yeni İnsan Yayınları: İstanbul, Turkey, 2021; pp. 11–31. [Google Scholar]
  30. Bastian, G.E.; Buro, D.; Palmer-Keenan, D.M. Recommendations for Integrating Evidence-Based, Sustainable Diet Information into Nutrition Education. Nutrients 2021, 13, 4170. [Google Scholar] [CrossRef]
  31. Malan, H.; Challamel, G.A.; Silverstein, D.; Hoffs, C.; Spang, E.; Pace, S.A.; Malagueño, B.L.R.; Gardner, C.D.; Wang, M.C.; Slusser, W.; et al. Impact of a Scalable, Multi-Campus “Foodprint” Seminar on College Students’ Dietary Intake and Dietary Carbon Footprint. Nutrients 2020, 12, 2890. [Google Scholar] [CrossRef]
  32. Nelson, M.E.; Hamm, M.W.; Hu, F.B.; Abrams, S.A.; Griffin, T.S. Alignment of Healthy Dietary Patterns and Environmental Sustainability: A Systematic Review. Adv. Nutr. 2016, 7, 1005–1025. [Google Scholar] [CrossRef]
  33. Willett, W.; Rockström, J.; Loken, B.; Springmann, M.; Lang, T.; Vermeulen, S.; Garnett, T.; Tilman, D.; DeClerck, F.; Wood, A.; et al. Food in the Anthropocene: The EAT–Lancet Commission on Healthy Diets from Sustainable Food Systems. Lancet 2019, 393, 447–492. [Google Scholar] [CrossRef]
  34. World Wildlife Fund Livewell: Choosing Sustainable Diets. Available online: https://www.wwf.org.uk/better-basket (accessed on 7 October 2025).
  35. Menekli, T.; Fadıloğlu, Ç. Reliability and Validity of Nutritional Changes Processes Scale. Fac. Health Sci. Nurs. J. 2012, 19, 1–21. [Google Scholar]
  36. Cangöl, S. An Analysis of the Determinants of Obesity in Early Adolescence Based on the Behavior Change Phases of the Transtheoretical Model. Ph.D. Dissertation, Institute of Health Sciences, Istanbul University, İstanbul, Turkey, 2016. [Google Scholar]
  37. Erdem, Ö.; Erol, S. Safe Bicycle Riding Scales Based on the Transtheoretical Model for Adolescents: Development and Validation. J. Transp. Health 2021, 20, 101006. [Google Scholar] [CrossRef]
  38. Gümüş Şekerci, Y. The Impact of Training Applied with The Stages of Change Model on Exercise of Adult Diabetic Women. Ph.D. Dissertation, Institute of Health Sciences, Gazi University, Ankara, Turkey, 2016. [Google Scholar]
  39. Mansuroğlu, S. The Effect of Psychoeducation Based on the Transtheoretical Model on Healthy Lifestyle Behaviours in Individuals Diagnosed with Schizophrenia. Ph.D. Dissertation, Istanbul University Cerrahpaşa Institute of Postgraduate Education, İstanbul, Turkey, 2021. [Google Scholar]
  40. Baysal, H.Y.; Hacialioglu, N. The Effect of Transtheoretical Model-Based Education and Follow-up on Providing Overweight Women with Exercise Behavior. Int. J. Caring Sci. 2017, 10, 897–906. [Google Scholar]
  41. Ayre, C.; Scally, A.J. Critical Values for Lawshe’s Content Validity Ratio. Meas. Eval. Couns. Dev. 2014, 47, 79–86. [Google Scholar] [CrossRef]
  42. Harris, P.A.; Taylor, R.; Thielke, R.; Payne, J.; Gonzalez, N.; Conde, J.G. Research Electronic Data Capture (REDCap)—A Metadata-Driven Methodology and Workflow Process for Providing Translational Research Informatics Support. J. Biomed. Inform. 2009, 42, 377–381. [Google Scholar] [CrossRef]
  43. Harris, P.A.; Taylor, R.; Minor, B.L.; Elliott, V.; Fernandez, M.; O’Neal, L.; McLeod, L.; Delacqua, G.; Delacqua, F.; Kirby, J.; et al. The REDCap Consortium: Building an International Community of Software Platform Partners. J. Biomed. Inform. 2019, 95, 103208. [Google Scholar] [CrossRef]
  44. Hertzog, M.A. Considerations in Determining Sample Size for Pilot Studies. Res. Nurs. Health 2008, 31, 180–191. [Google Scholar] [CrossRef]
  45. Tabachnick, B.G.; Fidell, L.S. Using Multivariate Statistics; Allyn and Bacon: Boston, MA, USA, 2001; p. 588. [Google Scholar]
  46. Bujang, M.A.; Baharum, N. A Simplified Guide to the Determination of Sample Size Requirements for Estimating the Value of Intraclass Correlation Coefficient: A Review. Arch. Orofac. Sci. 2017, 12, 1–11. [Google Scholar]
  47. Bujang, M.A.; Baharum, N. Sample Size Guideline for Correlation Analysis. World J. Soc. Sci. Res. 2016, 3, 37–46. [Google Scholar] [CrossRef]
  48. Hair, J.F.; Black, W.C.; Babin, B.J.; Anderson, R.E. Multivariate Data Analysis, 8th ed.; Annabel Ainscow: Southampton, UK, 2018. [Google Scholar]
  49. Schreiber, J.B. Issues and Recommendations for Exploratory Factor Analysis and Principal Component Analysis. Res. Soc. Adm. Pharm. 2021, 17, 1004–1011. [Google Scholar] [CrossRef]
  50. George, D.; Mallery, P. SPSS for Windows Step by Step: A Simple Guide and Reference, 11.0 Update, 4th ed.; Allyn & Bacon: Boston, MA, USA, 2003. [Google Scholar]
  51. Koo, T.K.; Li, M.Y. A Guideline of Selecting and Reporting Intraclass Correlation Coefficients for Reliability Research. J. Chiropr. Med. 2016, 15, 155–163. [Google Scholar] [CrossRef] [PubMed]
  52. Mukaka, M.M. Statistics Corner: A Guide to Appropriate Use of Correlation Coefficient in Medical Research. Malawi Med. J. 2012, 24, 69–71. [Google Scholar]
  53. Terwee, C.B.; Bot, S.D.M.; de Boer, M.R.; van der Windt, D.A.W.M.; Knol, D.L.; Dekker, J.; Bouter, L.M.; de Vet, H.C.W. Quality Criteria Were Proposed for Measurement Properties of Health Status Questionnaires. J. Clin. Epidemiol. 2007, 60, 34–42. [Google Scholar] [CrossRef] [PubMed]
  54. R Foundation for Statistical Computing. R Core Team_R: A Language and Environment for Statistical Computing_. Available online: https://www.R-project.org/ (accessed on 20 June 2025).
  55. Revelle, W. Psych: Procedures for Psychological, Psychometric, and Personality Research. CRAN: Contributed Packages. 2024. Available online: https://www.scholars.northwestern.edu/en/publications/psych-procedures-for-personality-and-psychological-research/ (accessed on 7 October 2025).
  56. Rosseel, Y. Lavaan: An R Package for Structural Equation Modeling. J. Stat. Softw. 2012, 48, 1–36. [Google Scholar] [CrossRef]
  57. Epskamp, S. SemPlot: Path Diagrams and Visual Analysis of Various SEM Packages’ Output. CRAN: Contributed Packages. 2022. Available online: https://sachaepskamp.r-universe.dev/semPlot (accessed on 7 October 2025).
  58. Gül, U.; EFE, E.; Bektaş, M. Development and Psychometric Evaluation of the Father-Preterm Infant Bonding Scale. J. Pediatr. Nurs. 2025, 84, 57–65. [Google Scholar] [CrossRef] [PubMed]
  59. Yoshida, T.; Otaka, Y.; Kitamura, S.; Ushizawa, K.; Kumagai, M.; Kurihara, Y.; Yaeda, J.; Osu, R. Development and Validation of New Evaluation Scale for Measuring Stroke Patients’ Motivation for Rehabilitation in Rehabilitation Wards. PLoS ONE 2022, 17, e0265214. [Google Scholar] [CrossRef]
  60. Polit, D.F.; Beck, C.T.; Owen, S.V. Is the CVI an Acceptable Indicator of Content Validity? Appraisal and Recommendations. Res. Nurs. Health 2007, 30, 459–467. [Google Scholar] [CrossRef]
  61. Tavakol, M.; Dennick, R. Making Sense of Cronbach’s Alpha. Int. J. Med. Educ. 2011, 2, 53–55. [Google Scholar] [CrossRef]
Disclaimer/Publisher’s Note: The statements, opinions and data contained in all publications are solely those of the individual author(s) and contributor(s) and not of MDPI and/or the editor(s). MDPI and/or the editor(s) disclaim responsibility for any injury to people or property resulting from any ideas, methods, instructions or products referred to in the content.

Article Metrics

Citations

Article Access Statistics

Article metric data becomes available approximately 24 hours after publication online.