Abstract
Background: Dietary sodium restriction in people with chronic kidney disease (CKD) may improve blood pressure and cardiovascular outcomes. However, little is known about body sodium levels (and dietary sodium restriction) on patient-reported health-related quality of life (HRQOL) in CKD. The primary aim of this study was to assess potential relationships between routinely used sodium measurements in clinical practice and acceptance of diet and fluid restrictions with HRQOL outcomes in people with CKD. Methods: We conducted a cross-sectional pilot study in 53 people with CKD, including those on dialysis, to explore relationships between HRQOL outcomes using the Kidney Disease Quality of Life-36 (KDQOL-36) questionnaire and measures of dietary sodium intake and urinary sodium excretion. Results: Participants with low 24 h urinary sodium excretion reported poorer HRQOL in kidney-specific domains with lower KDQOL-36 component scores for effects of kidney disease (p = 0.03) and a trend towards lower scores in burden of kidney disease and symptoms of kidney disease (both p = 0.06). Those who had lower acceptance of fluid and diet restriction had poorer HRQOL in kidney-specific domains with lower KDQOL-36 component scores for burden of kidney disease and effects of kidney disease (all p ≤ 0.01). Conclusions: Low 24 h urinary sodium excretion and lower acceptance of fluid and diet restriction in people with CKD are associated with poorer HRQOL scores in domains that assess level of kidney disease interference with life. Further studies exploring underlying mechanisms between urinary sodium excretion and HRQOL in CKD are needed. Efforts to increase acceptance of diet and fluid restrictions in people with CKD may improve HRQOL outcomes.
1. Introduction
Excess intake of dietary salt (sodium chloride) is a leading but modifiable risk factor in high blood pressure [1]. Globally, just over half of adults with hypertension are diagnosed, only 42% are receiving treatment, and only 21% have achieved their blood pressure goal [2]. Sodium exerts effects on blood pressure and contributes to cardiovascular, cerebrovascular, and kidney disease [3]. This occurs via multiple pathways including extracellular volume expansion (in the intravascular space), via tissue interstitial storage (such as in skin and muscle), and through disruption of inflammation and metabolic profiles [4,5].
Body sodium is increased in people with chronic kidney disease (CKD) and the negative impact of sodium on health outcomes is intensified in this cohort. The kidneys have a decreased ability to excrete sodium with progressive kidney function decline [6]. Increased circulating aldosterone levels [7], activation of the intrarenal renin–angiotensin system [7] and metabolic acidosis also stimulate sodium reabsorption [8]. Sodium is also implicated in uremia-related changes in metabolism and muscle mass [9], influencing oxidative stress pathways leading to inflammation, endothelial cell injury, and proteinuria [10,11]. These high salt diet-driven metabolic consequences can lead to sarcopenia with associated insulin resistance and obesity, accentuated in people with CKD [12].
As the prevalence of CKD continues to rise globally [13], improving the management of sodium imbalance is particularly important to mitigate adverse health outcomes in the CKD population. Guidelines recommend adults with CKD limit sodium intake to less than 2–2.3 g/day [14,15] but sodium consumption in most countries exceed this target [16]. Lowering sodium consumption in Australia could deliver substantial CKD health and economic benefits [17].
Furthermore, people with CKD, especially those on dialysis, carry a substantial physiological and psychological symptom burden, leading to poor health-related quality of life (HRQOL) [18]. Promoting better HRQOL is increasingly recognized for its role in improving patient satisfaction and engagement with healthcare [19]; and poor HRQOL is associated with adverse clinical outcomes, including cardiovascular events, CKD progression, and death [20,21,22].
Although many studies have emphasized the considerable symptom burden and poor HRQOL in people with CKD [18], little is known about the interaction between body sodium levels (evaluated by dietary intake and urinary excretion) and patient acceptance of diet and fluid restrictions on overall HRQOL in people across the spectrum of CKD, including those on dialysis. A tele-counseling application program with a dietician was reported in one study to improve sodium intake and blood pressure parameters [23] but there was no assessment on HRQOL. Another study that implemented a self-managed sodium restriction program (comprising education, motivational interviewing, coaching, and self-monitoring of blood pressure and sodium) demonstrated improvement in sodium measures and office blood pressure readings but with no change in HRQOL [24].
Management of body sodium balance with diet and fluid restriction is central to clinical care and HRQOL of people with CKD, but more research is needed to explore potential relationships between these factors. To address the current literature gap, the aims of this small, cross-sectional study were to assess relationships between HRQOL outcomes, participants’ acceptance of diet and fluid restriction, and routinely used body sodium measurements used in clinical practice for people with CKD.
2. Materials and Methods
2.1. Design
This small cross-sectional study assessed associations between sodium measurements and HRQOL outcomes in people with CKD, including those on hemodialysis (HD) and peritoneal dialysis (PD), in an Australian setting.
2.2. Participants and Procedures
Study participants were recruited from The Royal Melbourne Hospital Nephrology Outpatient Department between November 2022 and July 2023. Study participants were ≥18 years of age and provided written informed consent. Participants were recruited into three cohorts: (i) people with CKD stages 3–5 not on dialysis (according to the Kidney Disease: Improving Global Outcomes [KDIGO] guidelines [25]), (ii) those on chronic thrice-weekly HD, and (iii) those on PD. Both HD and PD patients had been established on their respective dialysis modality for at least 3 months.
2.3. Assessment of Quality of Life and Symptoms
HRQOL was assessed using the Kidney Disease Quality of Life (KDQOL)-36 instrument [26] where higher scores indicate better HRQOL and differences in more than 3.0 points are considered clinically significant [27]. This includes two composite HRQOL scales from the short form (SF)-12 version, namely the mental component score (MCS) and physical component score (PCS) [26], derived from the Medical Outcomes Study SF-12 (a generic HRQOL survey instrument used in healthy individuals and across many disease states [28]). The KDQOL-36 was used to assess kidney disease-targeted domains with component scores for “symptoms of kidney disease”, “burden of kidney disease”, and “effects of kidney disease”. Scales were scored by transforming all items linearly on a 100-point scale and averaging items in the scale [26]. A paper KDQOL-36 form was self-completed by participants after verbal instructions from study personnel, unless reading or comprehension problems precluded self-administration, in which case study personnel assisted participants in form completion.
People with CKD are routinely provided with dietary advice and advised of the importance of fluid management by their clinicians. People with CKD may be prescribed diet and fluid restrictions by their clinicians or engage in self-regulation of diet and fluid intake as part of their CKD management. As part of the KDQOL-36, we assessed patient acceptance of diet and fluid restrictions. We recorded on a Likert scale how bothered participants were by their restrictions where 1 = not at all bothered, 2 = somewhat bothered, 3 = moderately bothered, 4 = very much bothered, and 5 = extremely bothered. These five possible responses were collapsed into two categories, where not or somewhat bothered was classified as having “higher level of acceptance” of the restriction, and moderately to extremely bothered was classified as having a “lower level of acceptance” as previously used [29]. The component score “effects of kidney disease” includes an item to assess how bothered participants were by their diet and fluid restriction. In assessment of high vs. low acceptance of dietary and fluid restriction, the scores for how bothered participants were by their “diet restriction” and “fluid restriction” were removed from the component score “effects of kidney disease”.
2.4. Assessment of Sodium Intake and Excretion
To assess dietary sodium, we conducted the following: (a) a scored sodium questionnaire (SSQ) that has been validated in the Australian CKD population [30]; and (b) a 24 h dietary food record. For the SSQ, participants scored points on frequency and type of sodium-containing food intake (total of 215 points where larger values indicate higher sodium consumption and where ≥65 points indicates a high sodium consumer). For the 24 h dietary record, participants were prompted to include an estimation of amount or weight of foods consumed (e.g., as cups, handful, number). Participants were asked if there were any additional snacks or fluid consumption, and to estimate this quantity. Twenty-four-hour dietary sodium quantification was calculated using Foodworks Online [31]. Foodworks Online calculates sodium in foods from AusFoods (an expanded set of food descriptions with nutrient data from AUSNUT 2011-13 and the new Australian Food Composition Database) and AusBrands (contains nutrient data for commercial food products sold in Australia) [32]. Twenty-four hour and spot urine sodium collections were used to assess sodium excretion. The 24 h urinary sodium excretion (in mg/day) was calculated by the product of 24 h urinary sodium and urinary volume by 23 (molecular weight of sodium). The 24 h urine samples and spot urine tests were conducted in the same 24 h period as the dietary record in all but 5 participants (3 people with CKD and 2 people on PD who conducted the tests within 3 months of completing the KDQOL-36).
2.5. Outcomes and Statistical Analysis
Statistical analysis was performed using SPSS for Mac version 30.0 (IBM, Armonk, NY, USA). Parametric distribution was assessed both graphically and with the Shapiro–Wilk test. Continuous variables were presented as mean ± standard deviation (SD) if normally distributed and median [interquartile range (IQR)] if non-normally distributed. Categorical variables were expressed as proportions and percentages. All available data variables were analyzed, and no participant was removed. Differences between CKD groups were determined using one-way ANOVA, Kruskal–Wallis, and Chi-squared test or Fisher’s exact test for normally distributed continuous, non-normally distributed continuous, and categorical variables, respectively. Differences between groups of fluid and diet restriction acceptance were determined using independent-samples t-test and Mann–Whitney U test for normally distributed and non-normally distributed continuous variables, respectively. Ninety-five percent confidence intervals were computed and p < 0.05 was considered statistically significant.
3. Results
3.1. Baseline Characteristics and Medications
Data for a total of 53 participants (28 people with CKD, 13 on HD, and 12 on PD) were collected (Table 1). The CKD group consisted of patients with Stage 3a (n = 3), Stage 3b (n = 11), Stage 4 (n = 9), and Stage 5 (n = 5) CKD. Median age, sex, and body mass index distribution were comparable between the CKD, HD, and PD groups. There was no difference in prescribed medications between the three groups. Participants were considered anuric if they self-estimated their urinary volume < 200 mL/day if on HD (n = 5) or collected < 200 mL/day on a 24 h urine collection if on PD (n = 1); with two people with CKD, one person on PD, and two people on HD opting not to undertake a 24 h urine collection. For people on HD, mean dialysate sodium was 137.9 ± 2.0 mmol/L, median ultrafiltration rate was 480 mL/h [IQR 370–639], and median interdialytic weight gain was 1500 g [850–2000]. Of the 12 people on PD, 1 was on continuous ambulatory PD and 11 on automated PD. Glucose-based and icodextrin-based PD solutions contained a sodium concentration of 132 mmol/L. Peritoneal dialysis patients had a median total dwell volume of 6480 mL/day [4012.5–8648.75] and a mean ultrafiltration volume of 308.3 ± 267 mL/day. For people on PD, total median Kt/V was 2.14 [1.76–2.52] and residual kidney function median Kt/V was 1.25 [0.91–1.56].

Table 1.
Demographics, co-morbidities, and medications of participants.
Table 2 shows sodium measurements using routinely used measures of dietary intake and urinary excretion in clinical practice.
Table 2.
Sodium and volume measures of participants.
3.2. Associations Between Sodium Measurements and HRQOL
Table 3 shows KDQOL-36 composite and component scores for each group of CKD, HD, and PD. There were differences between participants with CKD, those on HD, and those on PD for KDQOL-36 components of burden of kidney disease (p = 0.03) and effects of kidney disease (p = 0.05). Those with CKD (n = 28) compared to those on dialysis (n = 25) had better HRQOL indicated by higher KDQOL-36 component scores for burden of kidney disease (p = 0.01) and effects of kidney disease (p = 0.02). Further evaluation of the CKD cohort separated into Stage 3a, 3b, 4, or 5 CKD, or comparing those on diuretics vs. not, and on sodium-glucose co-transporter 2-inhibitors (SGLT2-i) vs. not, showed no difference in kidney disease specific component scores but numbers were small in each group.
Table 3.
KDQOL-36 components stratified by CKD group.
Table 4A–C show median scores for each KDQOL-36 component scores stratified by high and low sodium consumers defined by dietary SSQ (<65 vs. ≥65 points, respectively), 24 h dietary record (<2.3 g/day vs. ≥2.3 g/day, respectively), and high vs. low 24 h urinary sodium excretion (<2.3 g/day vs. ≥2.3 g/day, respectively), respectively. No difference was seen in KDQOL-36 component scores stratified by high vs. low sodium intake as per SSQ or 24 h dietary recall (Table 4A,B). However, participants with low 24 h urinary sodium excretion (<2.3 g/day) had lower KDQOL-36 component scores for effects of kidney disease (p = 0.03) and a trend towards lower scores in burden of kidney disease (p = 0.06) and symptoms of kidney disease (p = 0.06) (Table 4C). This indicates low 24 h urinary sodium excretion was associated with poorer HRQOL in these kidney-specific domains.
Table 4.
(A) KDQOL-36 stratified by high vs. low dietary scored sodium questionnaire. (B) KDQOL-36 stratified by high vs. low 24 h dietary record. (C) KDQOL-36 stratified by high vs. low 24 h urinary sodium excretion.
Analysis of HRQOL outcomes stratified by acceptance of diet and fluid restriction was undertaken. Of a total of 53 participants, 40 (75.5%) were classified as having high acceptance of their dietary restriction, and 43 (81.1%) as having high acceptance of their fluid restriction. Table 5A shows median scores for each KDQOL-36 component score according to the level of acceptance of diet restriction. Those who had lower acceptance of diet restriction (classified as moderately to extremely bothered by diet restriction), compared to patients who had higher acceptance of fluid restriction (classified as not at all or somewhat bothered by diet restriction), had lower scores in burden of kidney disease and effects of kidney disease (both p ≤ 0.01). Table 5B shows median scores for each KDQOL-36 component according to the level of acceptance of fluid restriction. Similarly, those who had lower acceptance of fluid restriction (classified as moderately to extremely bothered by fluid restriction), compared to patients who had higher acceptance of fluid restriction (classified as not at all or somewhat bothered by fluid restriction), had lower scores in burden of kidney disease and effects of kidney disease (both p ≤ 0.01).
Table 5.
(A) KDQOL-36 scores stratified by level of acceptance of diet restriction. (B) KDQOL-36 scores stratified by level of acceptance of fluid restriction.
These results indicate that those less accepting of their diet and fluid restrictions felt their kidney disease interfered more with, or represented more burden in, their lives (Figure 1). Further analysis showed there was no difference in kidney-specific HRQOL domains or level of fluid and diet restriction acceptance between those who were anuric compared to those on HD who collected a 24 h urine volume > 200 mL/day.
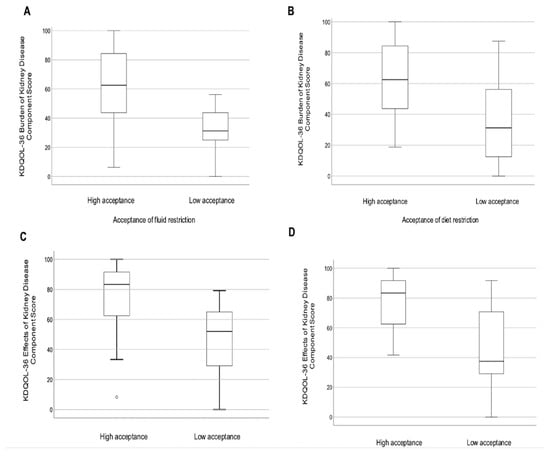
Figure 1.
Boxplots of KDQOL-36 kidney-specific component scores for burden of kidney disease stratified by (A) acceptance of fluid restriction and (B) acceptance of diet restriction; and for effects of kidney disease stratified by (C) acceptance of fluid restriction and (D) acceptance of diet restriction.
4. Discussion
We report, to our knowledge, the first study exploring relationships between body sodium measurements and prescribed diet and fluid restrictions, with HRQOL outcomes across the spectrum of CKD, including those on dialysis. Those with low urinary sodium excretion of <2.3 g sodium/day demonstrated poorer HRQOL (lower component scores for effects of kidney disease, and a trend towards lower scores in burden and symptoms of kidney disease). These findings are consistent with a large Korean cross-sectional study, which reported low estimated 24 h urine sodium associated with poorer HRQOL, even after adjusting for CKD [33]. This could be explained by inadequate nutrition or activation of poor metabolic profiles in people with low urinary sodium excretion (reflective of lower sodium dietary intake) [33].
Lack of differences in kidney specific HRQOL scores when participants were stratified based on two different measurements of dietary sodium intake (SSQ and 24 h dietary record) may be explained by the inherent difficulty in quantifying body sodium in those with CKD. Although 24 h urine sodium excretion is considered the gold-standard method to estimate dietary sodium intake, people with CKD have disrupted sodium physiology with decreased urinary sodium excretion [4] and increased sodium tissue storage [5]. Food frequency questionnaires and 24 h dietary records are prone to recall bias and are subject to considerable daily variation in food intake [4]. Several possible reasons why low urinary sodium excretion in our cohort was associated with poorer HRQOL parameters include the following: (i) greater restricted sodium and fluid intake that impacts the psychosocial dietary experience (supported by our finding of those with low 24 h urinary sodium excretion (<2.3 g/day) being less accepting of their fluid restriction); (ii) a higher burden of medications and medical therapies that alter urinary sodium excretory capacity, e.g., diuretics and SGLT2-i, have variable natriuretic effects [34,35]; and/or (iii) increased sodium storage in the tissue interstitial compartments of people with CKD which has been shown to be associated with adverse clinical outcomes [5].
Our study found those with lower acceptance of fluid and diet restriction have poorer HRQOL, particularly experiencing higher levels of burden and effects of kidney disease. Potential explanations include sensation of thirst and dry mouth [36] from such restrictions which can cause distress [37,38] and induce difficulty in adhering to prescribed fluid restrictions [39] further exacerbating excessive fluid states and unpleasant symptoms associated with this (e.g., shortness of breath and oedema). Patients often perceive prescribed fluid restrictions as burdensome, and as contributing to anxiety, fatigue, and limitations in daily functioning and social engagement [40,41]. A Brazilian study of patients on HD with negligible or absent urine output (≤200 mL/day), who were less accepting of their fluid restriction, had poorer HRQOL outcomes compared to those who were more accepting of their fluid restriction [29]. This may in part be due to less aggressive fluid restriction prescriptions for those who have higher residual urine volume and consequent capacity to have better management of their fluid balance, removal of uremic toxins, and control of electrolytes through this urinary route compared to people who have less residual urinary function [42,43]. Although our study showed no difference in level of acceptance of fluid and diet restriction between people with residual urine output > 200 mL/day and those ≤200 mL/day (n = 6) in the full study cohort (replicated in our HD only cohort), our study numbers may not be large enough to detect a difference between these two groups. Furthermore, renal diets are complex and difficult to navigate for people with CKD who are already faced with socio-economic challenges and a burden of chronic disease [44,45]. These factors compound psychosocial distress and lower emotional well-being, making understanding and acceptance of, and adherence to, diet and fluid restrictions more challenging for the CKD cohort [46].
Interventions to increase acceptance and adherence to fluid and diet restriction can be implemented with benefits to HRQOL and fluid management outcomes. These include education, cognitive, and behavioral strategies to enhance self-management of fluid consumption, which have been shown to improve fluid restriction adherence with no adverse effects on psychosocial function [47]. Individual-based cognitive behavioral therapies may improve HRQOL and markers of fluid status in people on HD [48] and PD [49]. Motivational interviewing has also been reported to improve sodium intake and urinary sodium excretion [23,24]. This highlights how addressing issues with emotional well-being can be important to patient perception of and adherence to fluid and dietary advice. Technological adjuncts, including text/short messaging service/application-messages, in addition to face-to-face delivery can enhance accessibility to dietetic education and support in a timely manner [50]. Use of symptom-augmenting adjuncts such as chewing gum and saliva substitutes may alleviate thirst and reduce xerostomia [51]. Addressing HRQOL with consideration of body sodium measures and patient acceptance of diet and fluid restrictions could improve the patient experience of kidney disease, which is inherently linked to clinical outcomes including mortality and hospitalization [52,53].
We acknowledge some limitations of this study. Self-reported data was collected, including for 24 h dietary sodium intake, which may lead to recall bias. Binary classification in this study of “lower level of acceptance” versus “higher level of acceptance” of fluid and diet restrictions was used as this was a cross-sectional pilot study with small numbers; and such categorization may mask the effects of gradations in acceptance. Future studies with larger numbers could evaluate differences in gradations further. The small participant numbers may also limit generalizability. Although associations were identified, the observational nature meant we could not restrict dietary sodium intake or assess adherence to prescribed dietary and sodium restrictions. Future studies could explore relationships between acceptance of and adherence to such clinician-prescribed restrictions. There may be residual confounding factors such as socio-cultural economic practices and accessibility to healthcare therapies that could affect HRQOL that were not explored in this study. However, to our knowledge, this is the first study to explore differences between dietary sodium intake and urinary sodium excretion measures and HRQOL in people across the spectrum of CKD.
5. Conclusions
People with CKD with low 24 h urinary sodium excretion and lower acceptance of diet and fluid restriction have poorer HRQOL in kidney-disease specific domains. Further studies exploring the underlying mechanism between urinary sodium excretion and HRQOL in CKD are needed. Diet and fluid management in CKD is typically focused on reinforcement of restrictions to achieve clinical outcomes and biochemical targets; however, more attention should be directed to assessing, understanding, and addressing patient acceptance of these restrictions. Concurrent HRQOL, dietary sodium intake, and urinary excretion assessments, and adoption of strategies to enhance patient acceptance of fluid and diet restrictions, could empower both healthcare providers and patients to improve HRQOL and clinical outcomes in people with CKD.
Author Contributions
Conception, K.M. and N.D.T.; methodology, K.M., S.-J.T., T.D.H. and N.D.T.; data curation and formal analysis, K.M.; writing—original draft preparation, K.M.; writing—review and editing, S.-J.T., T.D.H. and N.D.T.; supervision, S.-J.T., T.D.H. and N.D.T.; funding acquisition, K.M., S.-J.T., T.D.H. and N.D.T. All authors have read and agreed to the published version of the manuscript.
Funding
K.M. is supported by the University of Melbourne Professional and Practice-Based Research Training Program Scholarship, The Priscilla Kincaid-Smith Research Fund, Hayden and Henrietta Williams Memorial Trust, and The Royal Melbourne Hospital Margaret Henderson Women in Research Fellowship.
Institutional Review Board Statement
The study protocol was approved by the Melbourne Health Research Ethics Committee (HREC 2021.027, date of approval: 29 March 2021) and performed in accordance with the Declaration of Helsinki.
Informed Consent Statement
Informed consent was obtained from all subjects involved in the study.
Data Availability Statement
The data underlying this article will be shared on reasonable request to the corresponding author. The data are not publicly available due to privacy reasons.
Conflicts of Interest
The authors declare no conflicts of interest.
Correction Statement
This article has been republished with a minor correction to resolve spelling errors. This change does not affect the scientific content of the article.
References
- Lim, S.S.; Vos, T.; Flaxman, A.D.; Danaei, G.; Shibuya, K.; Adair-Rohani, H.; Amann, M.; Anderson, H.R.; Andrews, K.G.; Aryee, M.; et al. A comparative risk assessment of burden of disease and injury attributable to 67 risk factors and risk factor clusters in 21 regions, 1990–2010: A systematic analysis for the Global Burden of Disease Study 2010. Lancet 2012, 380, 2224–2260. [Google Scholar] [CrossRef]
- Kario, K.; Okura, A.; Hoshide, S.; Mogi, M. The WHO Global report 2023 on hypertension warning the emerging hypertension burden in globe and its treatment strategy. Hypertens. Res. 2024, 47, 1099–1102. [Google Scholar] [CrossRef]
- He, F.J.; Tan, M.; Ma, Y.; MacGregor, G.A. Salt Reduction to Prevent Hypertension and Cardiovascular Disease: JACC State-of-the-Art Review. J. Am. Coll. Cardiol. 2020, 75, 632–647. [Google Scholar] [CrossRef] [PubMed]
- Martin, K.; Tan, S.J.; Toussaint, N.D. Total Body Sodium Balance in Chronic Kidney Disease. Int. J. Nephrol. 2021, 2021, 7562357. [Google Scholar] [CrossRef] [PubMed]
- Martin, K.; Tan, S.J.; Toussaint, N.D. Magnetic resonance imaging determination of tissue sodium in patients with chronic kidney disease. Nephrology 2022, 27, 117–125. [Google Scholar] [CrossRef] [PubMed]
- Shemin, D.; Dworkin, L.D. Sodium balance in renal failure. Curr. Opin. Nephrol. Hypertens. 1997, 6, 128–132. [Google Scholar] [CrossRef]
- Siragy, H.M.; Carey, R.M. Role of the intrarenal renin-angiotensin-aldosterone system in chronic kidney disease. Am. J. Nephrol. 2010, 31, 541–550. [Google Scholar] [CrossRef]
- Wesson, D.E.; Buysse, J.M.; Bushinsky, D.A. Mechanisms of Metabolic Acidosis-Induced Kidney Injury in Chronic Kidney Disease. J. Am. Soc. Nephrol. 2020, 31, 469–482. [Google Scholar] [CrossRef]
- Kitada, K.; Daub, S.; Zhang, Y.; Klein, J.D.; Nakano, D.; Pedchenko, T.; Lantier, L.; LaRocque, L.M.; Marton, A.; Neubert, P.; et al. High salt intake reprioritizes osmolyte and energy metabolism for body fluid conservation. J. Clin. Investig. 2017, 127, 1944–1959. [Google Scholar] [CrossRef]
- Ritz, E.; Dikow, R.; Morath, C.; Schwenger, V. Salt--a potential ‘uremic toxin’? Blood Purif. 2006, 24, 63–66. [Google Scholar] [CrossRef]
- Dekker, M.J.; Marcelli, D.; Canaud, B.; Konings, C.J.; Leunissen, K.M.; Levin, N.W.; Carioni, P.; Maheshwari, V.; Raimann, J.G.; van der Sande, F.M.; et al. Unraveling the relationship between mortality, hyponatremia, inflammation and malnutrition in hemodialysis patients: Results from the international MONDO initiative. Eur. J. Clin. Nutr. 2016, 70, 779–784. [Google Scholar] [CrossRef] [PubMed]
- Srikanthan, P.; Hevener, A.L.; Karlamangla, A.S. Sarcopenia exacerbates obesity-associated insulin resistance and dysglycemia: Findings from the National Health and Nutrition Examination Survey III. PLoS ONE 2010, 5, e10805. [Google Scholar] [CrossRef] [PubMed]
- Hill, N.R.; Fatoba, S.T.; Oke, J.L.; Hirst, J.A.; O’Callaghan, C.A.; Lasserson, D.S.; Hobbs, F.D. Global Prevalence of Chronic Kidney Disease—A Systematic Review and Meta-Analysis. PLoS ONE 2016, 11, e0158765. [Google Scholar] [CrossRef]
- Ikizler, T.A.; Burrowes, J.D.; Byham-Gray, L.D.; Campbell, K.L.; Carrero, J.J.; Chan, W.; Fouque, D.; Friedman, A.N.; Ghaddar, S.; Goldstein-Fuchs, D.J.; et al. KDOQI Clinical Practice Guideline for Nutrition in CKD: 2020 Update. Am. J. Kidney Dis. 2020, 76 (Suppl. S1), S1–S107. [Google Scholar] [CrossRef]
- Cheung, A.K.; Chang, T.I.; Cushman, W.C.; Furth, S.L.; Hou, F.F.; Ix, J.H.; Knoll, G.A.; Muntner, P.; Pecoits-Filho, R.; Sarnak, M.J.; et al. KDIGO 2021 clinical practice guideline for the management of blood pressure in chronic kidney disease. Kidney Int. 2021, 99, S1–S87. [Google Scholar] [CrossRef]
- Mozaffarian, D.; Fahimi, S.; Singh, G.M.; Micha, R.; Khatibzadeh, S.; Engell, R.E.; Lim, S.; Danaei, G.; Ezzati, M.; Powles, J.; et al. Global sodium consumption and death from cardiovascular causes. N. Engl. J. Med. 2014, 371, 624–634. [Google Scholar] [CrossRef]
- Aminde, L.N.; Wanjau, M.N.; Cobiac, L.J.; Veerman, J.L. Estimated Impact of Achieving the Australian National Sodium Reduction Targets on Blood Pressure, Chronic Kidney Disease Burden and Healthcare Costs: A Modelling Study. Nutrients 2023, 15, 318. [Google Scholar] [CrossRef]
- Fletcher, B.R.; Damery, S.; Aiyegbusi, O.L.; Anderson, N.; Calvert, M.; Cockwell, P.; Ferguson, J.; Horton, M.; Paap, M.C.S.; Sidey-Gibbons, C.; et al. Symptom burden and health-related quality of life in chronic kidney disease: A global systematic review and meta-analysis. PLoS Med. 2022, 19, e1003954. [Google Scholar] [CrossRef]
- Tang, E.; Yantsis, A.; Ho, M.; Hussain, J.; Dano, S.; Aiyegbusi, O.L.; Peipert, J.D.; Mucsi, I. Patient-Reported Outcome Measures for Patients with CKD: The Case for Patient-Reported Outcomes Measurement Information System (PROMIS) Tools. Am. J. Kidney Dis. 2024, 83, 508–518. [Google Scholar] [CrossRef]
- Porter, A.; Fischer, M.J.; Wang, X.; Brooks, D.; Bruce, M.; Charleston, J.; Cleveland, W.H.; Dowie, D.; Faulkner, M.; Gassman, J.; et al. Quality of life and outcomes in African Americans with CKD. J. Am. Soc. Nephrol. 2014, 25, 1849–1855. [Google Scholar] [CrossRef]
- Tsai, Y.C.; Hung, C.C.; Hwang, S.J.; Wang, S.L.; Hsiao, S.M.; Lin, M.Y.; Kung, L.F.; Hsiao, P.N.; Chen, H.C. Quality of life predicts risks of end-stage renal disease and mortality in patients with chronic kidney disease. Nephrol. Dial. Transpl. 2010, 25, 1621–1626. [Google Scholar] [CrossRef]
- Porter, A.C.; Lash, J.P.; Xie, D.; Pan, Q.; DeLuca, J.; Kanthety, R.; Kusek, J.W.; Lora, C.M.; Nessel, L.; Ricardo, A.C.; et al. Predictors and Outcomes of Health-Related Quality of Life in Adults with CKD. Clin. J. Am. Soc. Nephrol. 2016, 11, 1154–1162. [Google Scholar] [CrossRef] [PubMed]
- Chang, A.R.; Bailey-Davis, L.; Hetherington, V.; Ziegler, A.; Yule, C.; Kwiecen, S.; Graboski, E.; Melough, M.M.; Collins, C.; Anderson, C. Remote Dietary Counseling Using Smartphone Applications in Patients with Stages 1-3a Chronic Kidney Disease: A Mixed Methods Feasibility Study. J. Ren. Nutr. 2020, 30, 53–60. [Google Scholar] [CrossRef] [PubMed]
- Meuleman, Y.; Hoekstra, T.; Dekker, F.W.; Navis, G.; Vogt, L.; van der Boog, P.J.M.; Bos, W.J.W.; van Montfrans, G.A.; van Dijk, S.; Group, E.S. Sodium Restriction in Patients with CKD: A Randomized Controlled Trial of Self-management Support. Am. J. Kidney Dis. 2017, 69, 576–586. [Google Scholar] [CrossRef] [PubMed]
- Stevens, P.E.; Ahmed, S.B.; Carrero, J.J.; Foster, B.; Francis, A.; Hall, R.K.; Herrington, W.G.; Hill, G.; Inker, L.A.; Kazancıoğlu, R. KDIGO 2024 Clinical Practice Guideline for the Evaluation and Management of Chronic Kidney Disease. Kidney Int. 2024, 105, S117–S314. [Google Scholar] [CrossRef]
- Hays, R.D.; Kallich, J.D.; Mapes, D.L.; Coons, S.J.; Amin, N.; Carter, W.B.; Kamberg, D. Kidney Disease Quality of Life Short Form (KDQOL-SFTM); Rand: Santa Monica, CA, USA, 1997. [Google Scholar]
- Samsa, G.; Edelman, D.; Rothman, M.L.; Williams, G.R.; Lipscomb, J.; Matchar, D. Determining clinically important differences in health status measures: A general approach with illustration to the Health Utilities Index Mark II. Pharmacoeconomics 1999, 15, 141–155. [Google Scholar] [CrossRef]
- Ware, J., Jr.; Kosinski, M.; Keller, S.D. A 12-Item Short-Form Health Survey: Construction of scales and preliminary tests of reliability and validity. Med. Care 1996, 34, 220–233. [Google Scholar] [CrossRef]
- Silva, L.F.; Lopes, G.B.; Cunha, T.O.; Protasio, B.M.; Pisoni, R.L.; James, S.A.; Lopes, A.A. Coping with fluid restriction and the quality of life in hemodialysis patients with very low or no daily urine output. Int. J. Artif. Organs 2014, 37, 427–435. [Google Scholar] [CrossRef]
- Mason, B.; Ross, L.; Gill, E.; Healy, H.; Juffs, P.; Kark, A. Development and validation of a dietary screening tool for high sodium consumption in Australian renal patients. J. Ren. Nutr. 2014, 24, 123–134. [Google Scholar] [CrossRef]
- Foodworks.online, version 2.0. Professional Computer Software, Internet. Xyris Pty Ltd.: Brisbane, Australia, 2024.
- Food Standards Australia New Zealand. AUSNUT 2011–13–Australian Food Composition Database; FSANZ: Canberra, Australia, 2014. Available online: www.foodstandards.gov.au (accessed on 29 November 2024).
- Choi, H.M.; Lee, K.B.; Kim, H.; Hyun, Y.Y. Sodium excretion and health-related quality of life: The results from the Korea National Health and Nutrition Examination Survey 2010–2011. Eur. J. Clin. Nutr. 2018, 72, 1490–1496. [Google Scholar] [CrossRef]
- Tang, J.; Ye, L.; Yan, Q.; Zhang, X.; Wang, L. Effects of Sodium-Glucose Cotransporter 2 Inhibitors on Water and Sodium Metabolism. Front. Pharmacol. 2022, 13, 800490. [Google Scholar] [CrossRef] [PubMed]
- Agarwal, R.; Verma, A.; Georgianos, P.I. Diuretics in patients with chronic kidney disease. Nat. Rev. Nephrol. 2025, 21, 264–278. [Google Scholar] [CrossRef] [PubMed]
- Fan, W.F.; Zhang, Q.; Luo, L.H.; Niu, J.Y.; Gu, Y. Study on the clinical significance and related factors of thirst and xerostomia in maintenance hemodialysis patients. Kidney Blood Press. Res. 2013, 37, 464–474. [Google Scholar] [CrossRef] [PubMed]
- Porcu, M.; Fanton, E.; Zampieron, A. Thirst distress and interdialytic weight gain: A study on a sample of haemodialysis patients. J. Ren. Care 2007, 33, 179–181. [Google Scholar] [CrossRef]
- Bots, C.P.; Brand, H.S.; Veerman, E.C.; Valentijn-Benz, M.; Van Amerongen, B.M.; Valentijn, R.M.; Vos, P.F.; Bijlsma, J.A.; Bezemer, P.D.; Ter Wee, P.M.; et al. Interdialytic weight gain in patients on hemodialysis is associated with dry mouth and thirst. Kidney Int. 2004, 66, 1662–1668. [Google Scholar] [CrossRef]
- Beto, J.A.; Ramirez, W.E.; Bansal, V.K. Medical nutrition therapy in adults with chronic kidney disease: Integrating evidence and consensus into practice for the generalist registered dietitian nutritionist. J. Acad. Nutr. Diet. 2014, 114, 1077–1087. [Google Scholar] [CrossRef]
- Leshem, M. Low dietary sodium is anxiogenic in rats. Physiol. Behav. 2011, 103, 453–458. [Google Scholar] [CrossRef]
- Bjorklund, G.; Dadar, M.; Pen, J.J.; Chirumbolo, S.; Aaseth, J. Chronic fatigue syndrome (CFS): Suggestions for a nutritional treatment in the therapeutic approach. Biomed. Pharmacother. 2019, 109, 1000–1007. [Google Scholar] [CrossRef]
- Tanriover, C.; Ucku, D.; Basile, C.; Tuttle, K.R.; Kanbay, M. On the importance of the interplay of residual renal function with clinical outcomes in end-stage kidney disease. J. Nephrol. 2022, 35, 2191–2204. [Google Scholar] [CrossRef]
- Soi, V.; Yee, J. Sodium Homeostasis in Chronic Kidney Disease. Adv. Chronic Kidney Dis. 2017, 24, 325–331. [Google Scholar] [CrossRef]
- Trigueros-Flores, X.B.; Luna-Hernandez, G.; Santos-Lopez, M.F.; Perez-Galvan, L.; Flores-Camacho, K.J.; Diaz-Canchola, L.M.; Cueto-Manzano, A.M.; Chavez-Chavez, H.E.; Cerrillos-Gutierrez, J.I.; Rojas-Campos, E.; et al. Barriers and Facilitators to Adherence to a Healthy Diet Across the Spectrum of Chronic Kidney Disease. Patient Prefer. Adherence 2025, 19, 123–137. [Google Scholar] [CrossRef] [PubMed]
- Cardol, C.K.; Boslooper-Meulenbelt, K.; van Middendorp, H.; Meuleman, Y.; Evers, A.W.M.; van Dijk, S. Psychosocial barriers and facilitators for adherence to a healthy lifestyle among patients with chronic kidney disease: A focus group study. BMC Nephrol. 2022, 23, 205. [Google Scholar] [CrossRef] [PubMed]
- Palmer, S.C.; Hanson, C.S.; Craig, J.C.; Strippoli, G.F.; Ruospo, M.; Campbell, K.; Johnson, D.W.; Tong, A. Dietary and fluid restrictions in CKD: A thematic synthesis of patient views from qualitative studies. Am. J. Kidney Dis. 2015, 65, 559–573. [Google Scholar] [CrossRef] [PubMed]
- Sharp, J.; Wild, M.R.; Gumley, A.I.; Deighan, C.J. A cognitive behavioral group approach to enhance adherence to hemodialysis fluid restrictions: A randomized controlled trial. Am. J. Kidney Dis. 2005, 45, 1046–1057. [Google Scholar] [CrossRef]
- Cukor, D.; Ver Halen, N.; Asher, D.R.; Coplan, J.D.; Weedon, J.; Wyka, K.E.; Saggi, S.J.; Kimmel, P.L. Psychosocial intervention improves depression, quality of life, and fluid adherence in hemodialysis. J. Am. Soc. Nephrol. 2014, 25, 196–206. [Google Scholar] [CrossRef]
- Hare, J.; Clark-Carter, D.; Forshaw, M. A randomized controlled trial to evaluate the effectiveness of a cognitive behavioural group approach to improve patient adherence to peritoneal dialysis fluid restrictions: A pilot study. Nephrol. Dial. Transpl. 2014, 29, 555–564. [Google Scholar] [CrossRef][Green Version]
- Beer, J.; Lambert, K.; Lim, W.; Keane, C.; Boudville, N. Can Telehealth Improve Access to Dietary Management in Patients Receiving Dialysis? Insights from Consumers. Nutrients 2023, 16, 105. [Google Scholar] [CrossRef]
- Bots, C.P.; Brand, H.S.; Veerman, E.C.; Korevaar, J.C.; Valentijn-Benz, M.; Bezemer, P.D.; Valentijn, R.M.; Vos, P.F.; Bijlsma, J.A.; ter Wee, P.M.; et al. Chewing gum and a saliva substitute alleviate thirst and xerostomia in patients on haemodialysis. Nephrol. Dial. Transpl. 2005, 20, 578–584. [Google Scholar] [CrossRef]
- Lowrie, E.G.; Curtin, R.B.; LePain, N.; Schatell, D. Medical outcomes study short form-36: A consistent and powerful predictor of morbidity and mortality in dialysis patients. Am. J. Kidney Dis. 2003, 41, 1286–1292. [Google Scholar] [CrossRef]
- Mapes, D.L.; Lopes, A.A.; Satayathum, S.; McCullough, K.P.; Goodkin, D.A.; Locatelli, F.; Fukuhara, S.; Young, E.W.; Kurokawa, K.; Saito, A.; et al. Health-related quality of life as a predictor of mortality and hospitalization: The Dialysis Outcomes and Practice Patterns Study (DOPPS). Kidney Int. 2003, 64, 339–349. [Google Scholar] [CrossRef]
Disclaimer/Publisher’s Note: The statements, opinions and data contained in all publications are solely those of the individual author(s) and contributor(s) and not of MDPI and/or the editor(s). MDPI and/or the editor(s) disclaim responsibility for any injury to people or property resulting from any ideas, methods, instructions or products referred to in the content. |
© 2025 by the authors. Licensee MDPI, Basel, Switzerland. This article is an open access article distributed under the terms and conditions of the Creative Commons Attribution (CC BY) license (https://creativecommons.org/licenses/by/4.0/).