
Protein Intake and Diet Quality Mediate the Relationship Between Sleep and Handgrip Strength in Adults in the HANDLS Study

 , , ,
, , ,
Abstract

1. Introduction
1.1. Background of Sleep, Handgrip Strength, and Diet
1.2. Background on Sleep, Handgrip Strength, and Activity
2. Methods
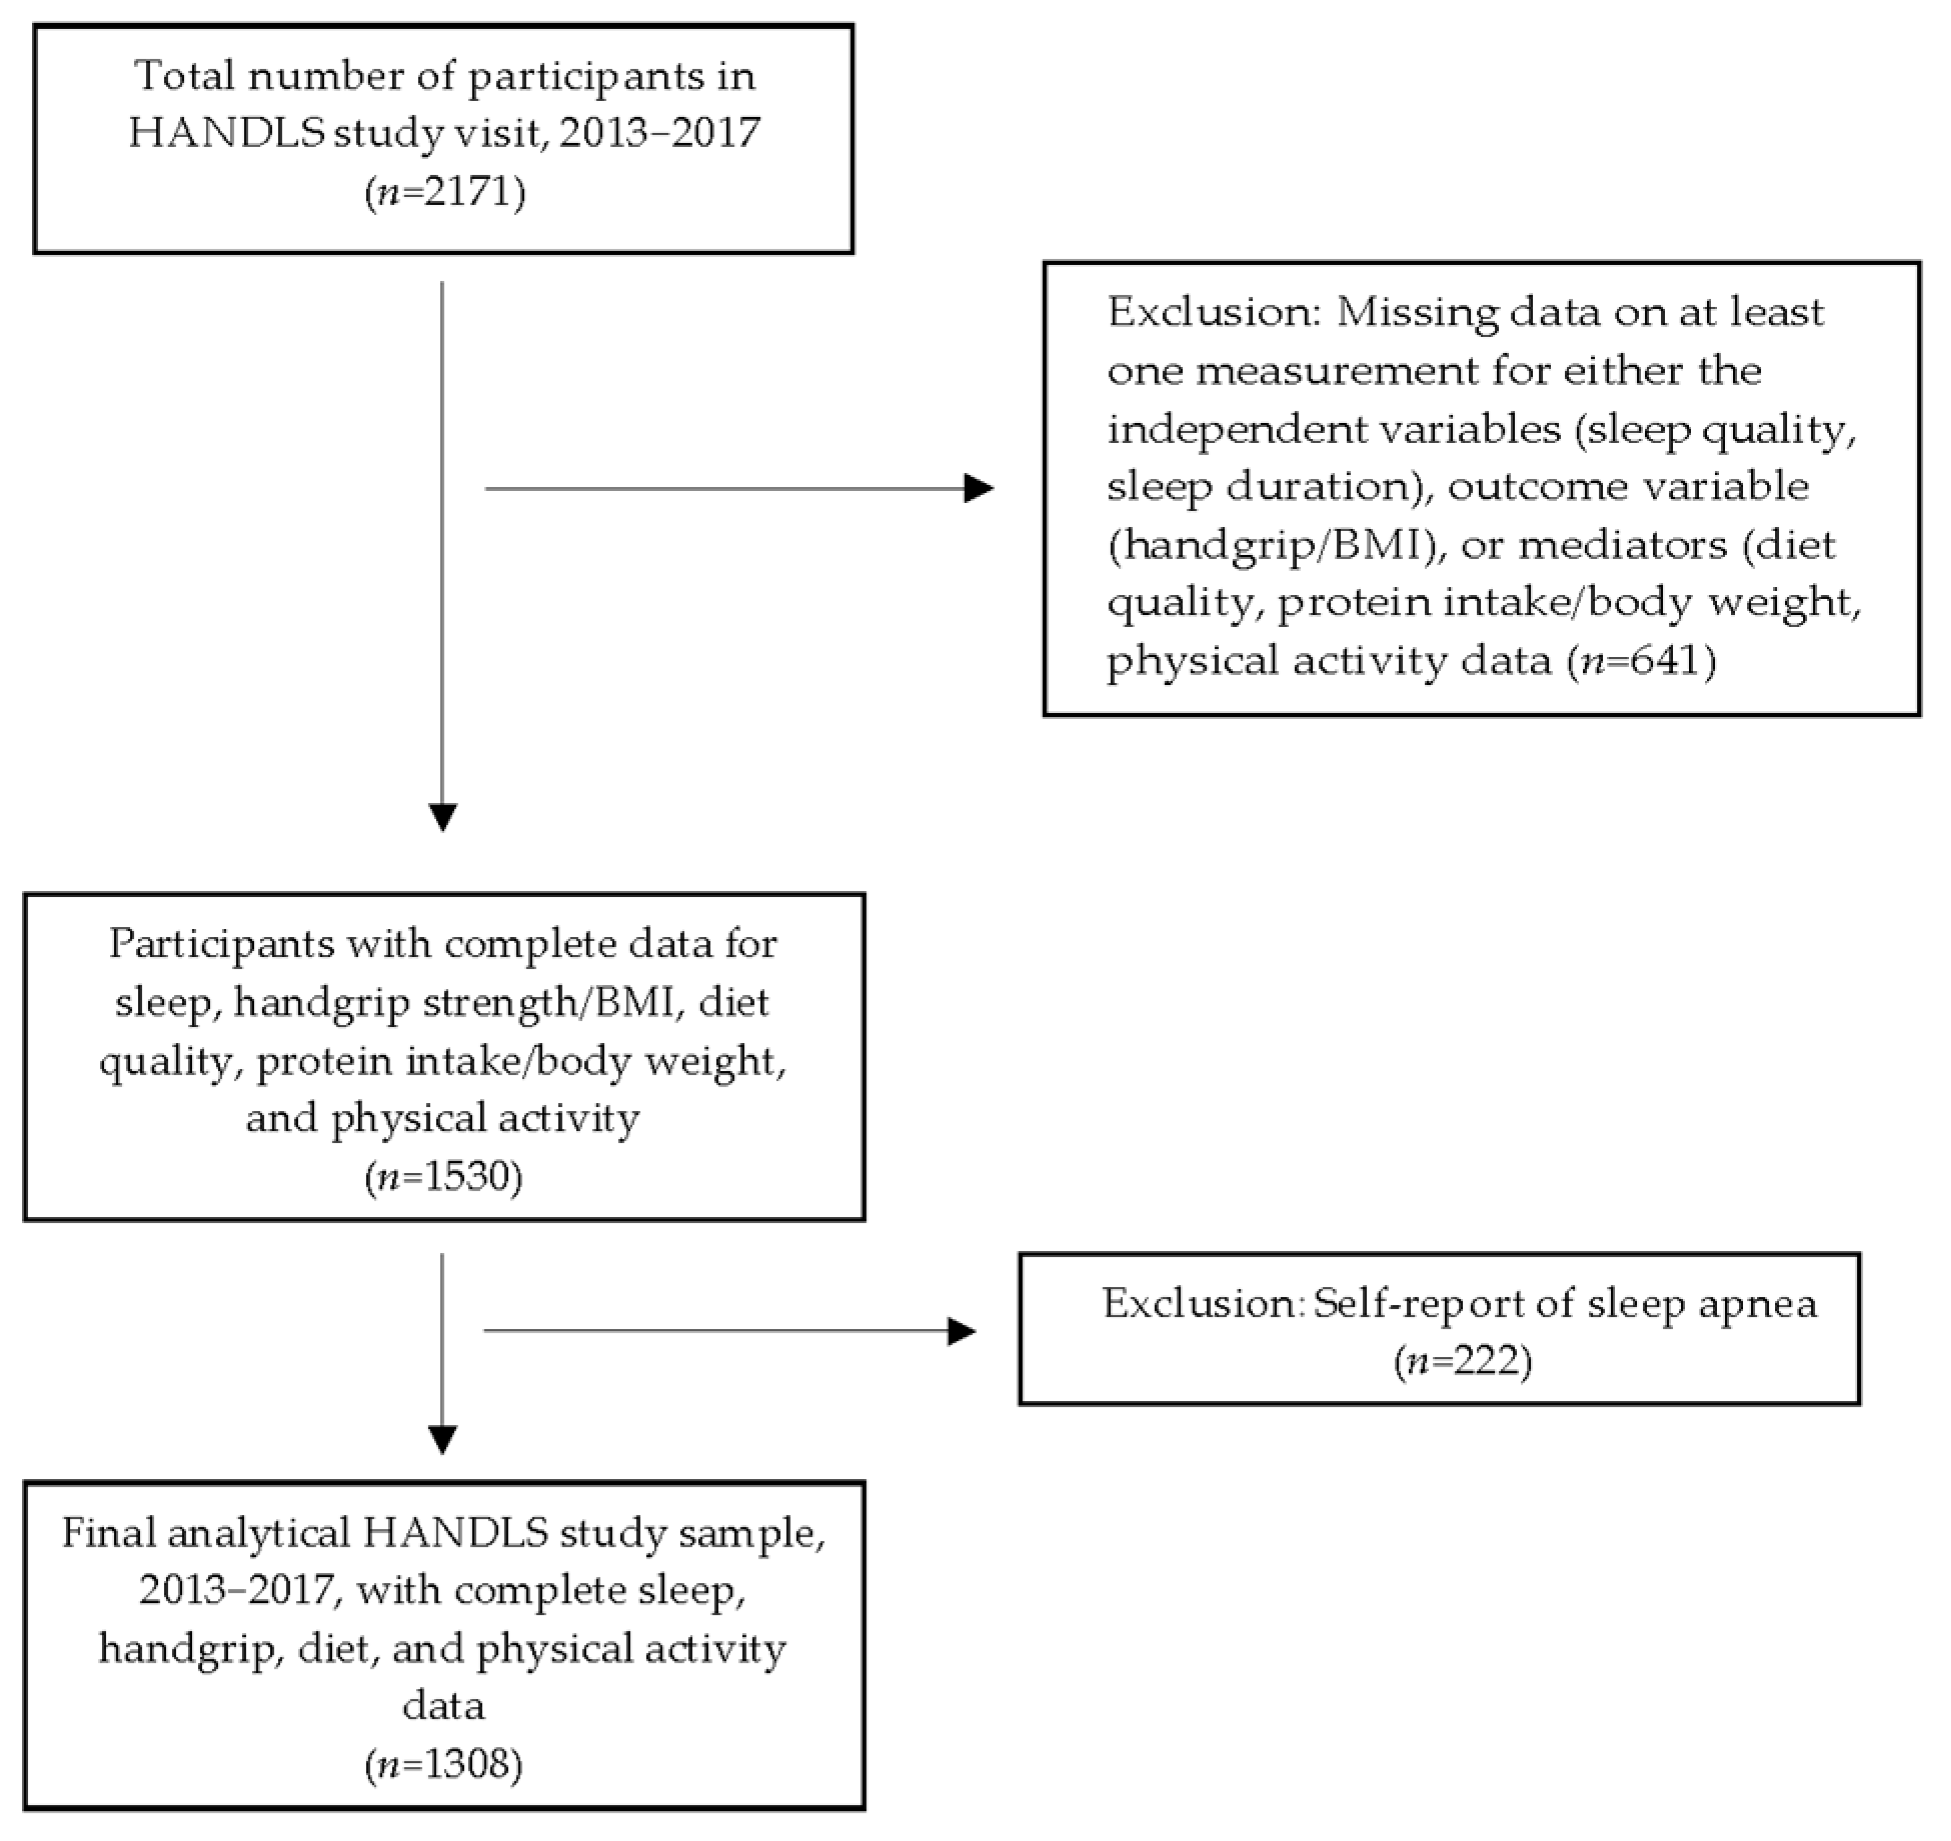
2.1. Sample
2.2. Predictor Variable: Sleep Quality and Duration
2.3. Dietary Measures: Quality and Protein Intake
2.4. Physical Activity
2.5. Covariates
2.6. Outcome Variable: Handgrip Strength
2.7. Statistical Analysis
3. Results
3.1. The Characteristics of the Sample
3.1.1. Overall Sample Characteristics
3.1.2. Characteristics of Sample Categorized by Sleep Quality
3.2. Summary of Mediational Analyses
3.2.1. Sleep Quality
3.2.2. Sleep Duration
3.2.3. Significant Covariates
4. Discussion
5. Conclusions
Supplementary Materials
Author Contributions
Funding
Institutional Review Board Statement
Informed Consent Statement
Data Availability Statement
Acknowledgments
Conflicts of Interest
Abbreviations
| DGA | Dietary Guidelines for Americans |
| e-DII | Energy-Adjusted Dietary Inflammatory Index |
| HANDLS | Healthy Aging in Neighborhoods of Diversity across the Life Span |
| HEI | Healthy Eating Index |
| HG/BMI | Handgrip Strength/Body Mass Index |
| LS7 | Life Simple 7 |
| NS | Nonsignificant |
| Pr/BW | Protein Intake/Body Weight (g/kg) |
| PSQI | Pittsburgh Sleep Quality Index |
| SE | Standard Error |
| USDA | United States Department of Agriculture |
References
- Ramar, K.; Malhotra, R.K.; Carden, K.A.; Martin, J.L.; Abbasi-Feinberg, F.; Aurora, R.N.; Kapur, V.K.; Olson, E.J.; Rosen, C.L.; Rowley, J.A.; et al. Sleep is essential to health: An American Academy of Sleep Medicine position statement. J. Clin. Sleep Med. 2021, 17, 2115–2119. [Google Scholar] [CrossRef] [PubMed]
- National Center for Health Statistics. QuickStats: Percentage of Adults Aged ≥ 18 Years Who Sleep <7 Hours on Average in a 24-Hour Period, by Sex and Age Group—National Health Interview Survey, United States, 2020. MMWR Morb. Mortal. Wkly. Rep. 2022, 71, 393. [Google Scholar] [CrossRef]
- St-Onge, M.P.; Cherta-Murillo, A.; Darimont, C.; Mantantzis, K.; Martin, F.P.; Owen, L. The interrelationship between sleep, diet, and glucose metabolism. Sleep Med. Rev. 2023, 69, 101788. [Google Scholar] [CrossRef]
- Vaishya, R.; Misra, A.; Vaish, A.; Ursino, N.; D’Ambrosi, R. Hand grip strength as a proposed new vital sign of health: A narrative review of evidences. J. Health Popul. Nutr. 2024, 43, 7. [Google Scholar] [CrossRef]
- Hamasaki, H. The association between handgrip strength and sleep duration in Japanese patients with type 2 diabetes. Diabetes Metab. 2019, 45, 306–307. [Google Scholar] [CrossRef] [PubMed]
- Liu, J.; Zhang, T.; Luo, J.; Chen, S.; Zhang, D. Association between Sleep Duration and Grip Strength in U.S. Older Adults: An NHANES Analysis (2011–2014). Int. J. Environ. Res. Public Health 2023, 20, 3416. [Google Scholar] [CrossRef]
- Pana, A.; Sourtzi, P.; Kalokairinou, A.; Pastroudis, A.; Chatzopoulos, S.T.; Velonaki, V.S. Association between muscle strength and sleep quality and duration among middle-aged and older adults: A systematic review. Eur. Geriatr. Med. 2021, 12, 27–44. [Google Scholar] [CrossRef]
- Lee, G.; Baek, S.; Park, H.W.; Kang, E.K. Sleep Quality and Attention May Correlate with Hand Grip Strength: FARM Study. Ann. Rehabil. Med. 2018, 42, 822–832. [Google Scholar] [CrossRef]
- Laredo-Aguilera, J.A.; Carmona-Torres, J.M.; Cobo-Cuenca, A.I.; Garcia-Pinillos, F.; Latorre-Roman, P.A. Handgrip Strength is Associated with Psychological Functioning, Mood and Sleep in Women over 65 Years. Int. J. Environ. Res. Public Health 2019, 16, 873. [Google Scholar] [CrossRef]
- Zuraikat, F.M.; St-Onge, M.-P. Chapter 22—The Influence of Diet on Sleep. In Neurological Modulation of Sleep; Watson, R.R., Preedy, V.R., Eds.; Academic Press: New York, NY, USA, 2020; pp. 205–215. [Google Scholar] [CrossRef]
- Pot, G.K. Sleep and dietary habits in the urban environment: The role of chrono-nutrition. Proc. Nutr. Soc. 2018, 77, 189–198. [Google Scholar] [CrossRef]
- Godos, J.; Grosso, G.; Castellano, S.; Galvano, F.; Caraci, F.; Ferri, R. Association between diet and sleep quality: A systematic review. Sleep Med. Rev. 2021, 57, 101430. [Google Scholar] [CrossRef] [PubMed]
- Dashti, H.S.; Scheer, F.A.; Jacques, P.F.; Lamon-Fava, S.; Ordovas, J.M. Short sleep duration and dietary intake: Epidemiologic evidence, mechanisms, and health implications. Adv. Nutr. 2015, 6, 648–659. [Google Scholar] [CrossRef] [PubMed]
- Zhou, J.; Kim, J.E.; Armstrong, C.L.; Chen, N.; Campbell, W.W. Higher-protein diets improve indexes of sleep in energy-restricted overweight and obese adults: Results from 2 randomized controlled trials. Am. J. Clin. Nutr. 2016, 103, 766–774. [Google Scholar] [CrossRef] [PubMed]
- Wilson, K.; St-Onge, M.P.; Tasali, E. Diet Composition and Objectively Assessed Sleep Quality: A Narrative Review. J. Acad. Nutr. Diet. 2022, 122, 1182–1195. [Google Scholar] [CrossRef]
- Burrows, T.; Fenton, S.; Duncan, M. Diet and sleep health: A scoping review of intervention studies in adults. J. Hum. Nutr. Diet. 2020, 33, 308–329. [Google Scholar] [CrossRef]
- St-Onge, M.P.; Grandner, M.A.; Brown, D.; Conroy, M.B.; Jean-Louis, G.; Coons, M.; Bhatt, D.L. Sleep Duration and Quality: Impact on Lifestyle Behaviors and Cardiometabolic Health: A Scientific Statement from the American Heart Association. Circulation 2016, 134, e367–e386. [Google Scholar] [CrossRef] [PubMed]
- Shahdadian, F.; Boozari, B.; Saneei, P. Association between short sleep duration and intake of sugar and sugar-sweetened beverages: A systematic review and meta-analysis of observational studies. Sleep Health 2023, 9, 159–176. [Google Scholar] [CrossRef]
- Fanelli Kuczmarski, M.; Pohlig, R.T.; Stave Shupe, E.; Zonderman, A.B.; Evans, M.K. Dietary Protein Intake and Overall Diet Quality Are Associated with Handgrip Strength in African American and White Adults. J. Nutr. Health Aging 2018, 22, 700–709. [Google Scholar] [CrossRef]
- Kuczmarski, M.F.; Beydoun, M.A.; Zonderman, A.B.; Evans, M.K. Intakes of Total and Branched-Chain Essential Amino Acids are Positively Associated with Handgrip Strength in African American and White Urban Younger and Older Adults. J. Nutr. Gerontol. Geriatr. 2022, 41, 140–159. [Google Scholar] [CrossRef]
- Pikosky, M.A.; Cifelli, C.J.; Agarwal, S.; Fulgoni III, V.L. Association of Dietary Protein Intake and Grip Strength Among Adults Aged 19+ Years: NHANES 2011–2014 Analysis. Front. Nutr. 2022, 9, 873512. [Google Scholar] [CrossRef]
- Kim, M.H.; Choi, M.K.; Bae, Y.J. Relationship between protein intake and grip strength in qualitative and quantitative aspects among the elderly in Korea: Results from the Korea National Health and Nutrition Examination Survey. BMC Geriatr. 2023, 23, 330. [Google Scholar] [CrossRef]
- Jun, S.; Cowan, A.E.; Dwyer, J.T.; Campbell, W.W.; Thalacker-Mercer, A.E.; Gahche, J.J.; Bailey, R.L. Dietary Protein Intake Is Positively Associated with Appendicular Lean Mass and Handgrip Strength among Middle-Aged US Adults. J. Nutr. 2021, 151, 3755–3763. [Google Scholar] [CrossRef] [PubMed]
- Alnawwar, M.A.; Alraddadi, M.I.; Algethmi, R.A.; Salem, G.A.; Salem, M.A.; Alharbi, A.A. The Effect of Physical Activity on Sleep Quality and Sleep Disorder: A Systematic Review. Cureus 2023, 15, e43595. [Google Scholar] [CrossRef]
- Atoui, S.; Chevance, G.; Romain, A.J.; Kingsbury, C.; Lachance, J.P.; Bernard, P. Daily associations between sleep and physical activity: A systematic review and meta-analysis. Sleep Med. Rev. 2021, 57, 101426. [Google Scholar] [CrossRef] [PubMed]
- Mead, M.P.; Baron, K.; Sorby, M.; Irish, L.A. Daily Associations Between Sleep and Physical Activity. Int. J. Behav. Med. 2019, 26, 562–568. [Google Scholar] [CrossRef] [PubMed]
- Dzierzewski, J.M.; Buman, M.P.; Giacobbi, P.R., Jr.; Roberts, B.L.; Aiken-Morgan, A.T.; Marsiske, M.; McCrae, C.S. Exercise and sleep in community-dwelling older adults: Evidence for a reciprocal relationship. J. Sleep Res. 2014, 23, 61–68. [Google Scholar] [CrossRef]
- de Lima, T.R.; Silva, D.A.S.; de Castro, J.A.C.; Christofaro, D.G.D. Handgrip strength and associated sociodemographic and lifestyle factors: A systematic review of the adult population. J. Bodyw. Mov. Ther. 2017, 21, 401–413. [Google Scholar] [CrossRef]
- McGrath, R.P.; Kraemer, W.J.; Snih, S.A.; Peterson, M.D. Handgrip Strength and Health in Aging Adults. Sports Med. 2018, 48, 1993–2000. [Google Scholar] [CrossRef]
- McLeod, M.; Breen, L.; Hamilton, D.L.; Philp, A. Live strong and prosper: The importance of skeletal muscle strength for healthy ageing. Biogerontology 2016, 17, 497–510. [Google Scholar] [CrossRef]
- Rantanen, T.; Guralnik, J.M.; Foley, D.; Masaki, K.; Leveille, S.; Curb, J.D.; White, L. Midlife hand grip strength as a predictor of old age disability. JAMA 1999, 281, 558–560. [Google Scholar] [CrossRef]
- Labott, B.K.; Bucht, H.; Morat, M.; Morat, T.; Donath, L. Effects of Exercise Training on Handgrip Strength in Older Adults: A Meta-Analytical Review. Gerontology 2019, 65, 686–698. [Google Scholar] [CrossRef]
- Bilajac, L.; Juraga, D.; Žuljević, H.; Glavić, M.M.; Vasiljev, V.; Rukavina, T. The influence of physical activity on handgrip strength of elderly. Arch. Gerontol. Geriatr. Res. 2019, 4, 20–24. [Google Scholar] [CrossRef]
- Evans, M.K.; Lepkowski, J.M.; Powe, N.R.; LaVeist, T.; Kuczmarski, M.F.; Zonderman, A.B. Healthy aging in neighborhoods of diversity across the life span (HANDLS): Overcoming barriers to implementing a longitudinal, epidemiologic, urban study of health, race, and socioeconomic status. Ethn. Dis. 2010, 20, 267–275. [Google Scholar]
- Buysse, D.J.; Reynolds, C.F.; Monk, T.H.; Berman, S.R.; Kupfer, D.J. The Pittsburgh sleep quality index: A new instrument for psychiatric practice and research. Psychiatry Res. 1989, 28, 193–213. [Google Scholar] [CrossRef] [PubMed]
- DiNatale, J.C.; Azarmanesh, D.; Hébert, J.R.; Wirth, M.D.; Pearlman, J.; Crowe-White, K.M. Relationship between Non-Energy-Adjusted and Energy-Adjusted Dietary Inflammatory Index and the Healthy Eating Index-2015: An analysis of the National Health and Nutrition Examination Survey (NHANES) 2015–2018. Ann. Med. 2023, 55, 2236551. [Google Scholar] [CrossRef] [PubMed]
- Shivappa, N.; Steck, S.E.; Hurley, T.G.; Hussey, J.R.; Hebert, J.R. Designing and developing a literature-derived, population-based dietary inflammatory index. Public Health Nutr. 2014, 17, 1689–1696. [Google Scholar] [CrossRef]
- Zheng, D.; Zhuo, B.; Zheng, G.; Hua, J.; Zhang, J.; Wang, C.; Wang, Y.; Zhang, Z.; Lin, H. The associations of energy adjusted dietary inflammatory index with brain structure and cognitive function. Innov. Med. 2023, 1, 100036. [Google Scholar] [CrossRef]
- Guenther, P.M.; Kirkpatrick, S.I.; Reedy, J.; Krebs-Smith, S.M.; Buckman, D.W.; Dodd, K.W.; Casavale, K.O.; Carroll, R.J. The Healthy Eating Index-2010 is a valid and reliable measure of diet quality according to the 2010 Dietary Guidelines for Americans. J. Nutr. 2014, 144, 399–407. [Google Scholar] [CrossRef]
- Moshfegh, A.J.; Rhodes, D.G.; Baer, D.J.; Murayi, T.; Clemens, J.C.; Rumpler, W.V.; Paul, D.R.; Sebastian, R.S.; Kuczynski, K.J.; Ingwersen, L.A.; et al. The US Department of Agriculture Automated Multiple-Pass Method reduces bias in the collection of energy intakes. Am. J. Clin. Nutr. 2008, 88, 324–332. [Google Scholar] [CrossRef]
- US Department of Agriculture. Food and Nutrient Database for Dietary Studies. Available online: https://www.ars.usda.gov/northeast-area/beltsville-md-bhnrc/beltsville-human-nutrition-research-center/food-surveys-research-group/docs/fndds-download-databases/ (accessed on 3 November 2024).
- Baecke, J.A.; Burema, J.; Frijters, J.E. A short questionnaire for the measurement of habitual physical activity in epidemiological studies. Am. J. Clin. Nutr. 1982, 36, 936–942. [Google Scholar] [CrossRef]
- Beydoun, M.A.; Georgescu, M.F.; Hossain, S.; Beydoun, H.A.; Fanelli-Kuczmarski, M.T.; Evans, M.K.; Zonderman, A.B. Life’s simple 7 and its association with trajectories in depressive symptoms among urban middle-aged adults. J. Affect. Disord. 2023, 333, 447–458. [Google Scholar] [CrossRef] [PubMed]
- Hasbani, N.R.; Ligthart, S.; Brown, M.R.; Heath, A.S.; Bebo, A.; Ashley, K.E.; Boerwinkle, E.; Morrison, A.C.; Folsom, A.R.; Aguilar, D.; et al. American Heart Association’s Life’s Simple 7: Lifestyle Recommendations, Polygenic Risk, and Lifetime Risk of Coronary Heart Disease. Circulation 2022, 145, 808–818. [Google Scholar] [CrossRef]
- US Department of Health and Human Services. The 2004 HHS Poverty Guidelines. Available online: https://aspe.hhs.gov/2004-hhs-poverty-guidelines (accessed on 20 January 2025).
- Mainous, A.G., 3rd; Tanner, R.J.; Anton, S.D.; Jo, A. Grip Strength as a Marker of Hypertension and Diabetes in Healthy Weight Adults. Am. J. Prev. Med. 2015, 49, 850–858. [Google Scholar] [CrossRef] [PubMed]
- Wen, Y.; Liu, T.; Ma, C.; Fang, J.; Zhao, Z.; Luo, M.; Xia, Y.; Zhao, Y.; Ji, C. Association between handgrip strength and metabolic syndrome: A meta-analysis and systematic review. Front. Nutr. 2022, 9, 996645. [Google Scholar] [CrossRef]
- Hayes, A.F. Introduction to Mediation, Moderation, and Conditional Process Analysis: A Regression-Based Approach, 3rd ed.; Guilford Press: New York, NY, USA, 2022. [Google Scholar]
- Hayes, A.F.; Montoya, A.K.; Rockwood, N.J. The Analysis of Mechanisms and Their Contingencies: PROCESS versus Structural Equation Modeling. Australas. Mark. J. 2017, 25, 76–81. [Google Scholar] [CrossRef]
- Theorell-Haglöw, J.; Lemming, E.W.; Michaëlsson, K.; Elmståhl, S.; Lind, L.; Lindberg, E. Sleep duration is associated with healthy diet scores and meal patterns: Results from the population-based EpiHealth study. J. Clin. Sleep Med. 2020, 16, 9–18. [Google Scholar] [CrossRef] [PubMed]
- Stefan, L.; Radman, I.; Podnar, H.; Vrgoc, G. Sleep Duration and Sleep Quality Associated with Dietary Index in Free-Living Very Old Adults. Nutrients 2018, 10, 1748. [Google Scholar] [CrossRef]
- Spiegel, K.; Tasali, E.; Penev, P.; Van Cauter, E. Brief communication: Sleep curtailment in healthy young men is associated with decreased leptin levels, elevated ghrelin levels, and increased hunger and appetite. Ann. Intern. Med. 2004, 141, 846–850. [Google Scholar] [CrossRef]
- Cedernaes, J.; Fanelli, F.; Fazzini, A.; Pagotto, U.; Broman, J.-E.; Vogel, H.; Dickson, S.L.; Schiöth, H.B.; Benedict, C. Sleep restriction alters plasma endocannabinoids concentrations before but not after exercise in humans. Psychoneuroendocrinology 2016, 74, 258–268. [Google Scholar] [CrossRef]
- Stern, J.H.; Grant, A.S.; Thomson, C.A.; Tinker, L.; Hale, L.; Brennan, K.M.; Woods, N.F.; Chen, Z. Short sleep duration is associated with decreased serum leptin, increased energy intake and decreased diet quality in postmenopausal women. Obesity 2014, 22, E55–E61. [Google Scholar] [CrossRef]
- Spaeth, A.M.; Dinges, D.F.; Goel, N. Sex and race differences in caloric intake during sleep restriction in healthy adults. Am. J. Clin. Nutr. 2014, 100, 559–566. [Google Scholar] [CrossRef] [PubMed]
- Wirth, M.D.; Hebert, J.R.; Shivappa, N.; Hand, G.A.; Hurley, T.G.; Drenowatz, C.; McMahon, D.; Shook, R.P.; Blair, S.N. Anti-inflammatory Dietary Inflammatory Index scores are associated with healthier scores on other dietary indices. Nutr. Res. 2016, 36, 214–219. [Google Scholar] [CrossRef] [PubMed]
- Wu, L.; Shi, Y.; Kong, C.; Zhang, J.; Chen, S. Dietary Inflammatory Index and Its Association with the Prevalence of Coronary Heart Disease among 45,306 US Adults. Nutrients 2022, 14, 4553. [Google Scholar] [CrossRef] [PubMed]
- Zare, M.J.; Ahmadi, A.; Dehbozorgi, S.; Zare, M.; Hejazi, N. The Association Between Children’s Dietary Inflammatory Index (C-DII) and Nutrient Adequacy with Gastrointestinal Symptoms, Sleep Habits, and Autistic Traits. J. Autism Dev. Disord. 2025, 55, 1727–1736. [Google Scholar] [CrossRef]
- Werneck, A.O.; Araujo, R.H.O.; Silva, D.R.; Vancampfort, D. Handgrip strength, physical activity and incident mild cognitive impairment and dementia. Maturitas 2023, 176, 107789. [Google Scholar] [CrossRef]
- Denison, H.J.; Jameson, K.A.; Sayer, A.A.; Patel, H.P.; Edwards, M.H.; Arora, T.; Dennison, E.M.; Cooper, C.; Baird, J. Poor sleep quality and physical performance in older adults. Sleep Health 2021, 7, 205–211. [Google Scholar] [CrossRef]
- Jamal, A.; Agaki, I.T.; O’Connor, E.; King, B.A.; Kenemer, J.B.; Neff, L. Current Cigarette Smoking Among Adults—United States, 2005–2013. Morb. Mortal. Wkly. Rep. 2014, 63, 1108–1112. [Google Scholar]
- Food and Nutrition Service. US Department of Agriculture. Average Healthy Eating Index-2010 Scores for Americans by Age Group, WWEIA-NHANES 2011–2012. Available online: https://www.fns.usda.gov/sites/default/files/media/file/HEI2010_Age_Groups_2011_2012.pdf (accessed on 13 February 2025).
- National Research Council. Recommended Dietary Allowances. In Chapter: Protein and Amino Acids, 10th ed.; The National Academies Press: Washington, DC, USA, 1989. [Google Scholar]
- Carbone, J.W.; Pasiakos, S.M. Dietary Protein and Muscle Mass: Translating Science to Application and Health Benefit. Nutrients 2019, 11, 51136. [Google Scholar] [CrossRef]
- Wang, Y.C.; Bohannon, R.W.; Li, X.; Sindhu, B.; Kapellusch, J. Hand-Grip Strength: Normative Reference Values and Equations for Individuals 18 to 85 Years of Age Residing in the United States. J. Orthop. Sports Phys. Ther. 2018, 48, 685–693. [Google Scholar] [CrossRef]
- Bohannon, R.W. Grip Strength: An Indispensable Biomarker for Older Adults. Clin. Interv. Aging 2019, 14, 1681–1691. [Google Scholar] [CrossRef]
- Pan, P.J.; Hsu, N.W.; Lee, M.J.; Lin, Y.Y.; Tsai, C.C.; Lin, W.S. Physical fitness and its correlation with handgrip strength in active community-dwelling older adults. Sci. Rep. 2022, 12, 17227. [Google Scholar] [CrossRef]
- Almashaqbeh, S.F.; Al-Momani, S.; Khader, A.; Qananwah, Q.; Marabeh, S.; Maabreh, R.; Al Badarneh, A.; Abdullah, K. The Effect of Gender and Arm Anatomical Position on the Hand Grip Strength and Fatigue Resistance during Sustained Maximal Handgrip Effort. J. Biomed. Phys. Eng. 2022, 12, 171–180. [Google Scholar] [CrossRef]
- Huemer, M.-T.; Kluttig, A.; Fischer, B.; Ahrens, W.; Castell, S.; Ebert, N.; Gastell, S.; Jöckel, K.-H.; Kaaks, R.; Karch, A.; et al. Grip strength values and cut-off points based on over 200,000 adults of the German National Cohort—A comparison to the EWGSOP2 cut-off points. Age Ageing 2023, 52, afac324. [Google Scholar] [CrossRef] [PubMed]
- Ribeiro, L.W.; Berndt, S.; Mielke, G.I.; Doust, J.; Mishra, G.D. Factors associated with handgrip strength across the life course: A systematic review. J. Cachexia Sarcopenia Muscle 2024, 15, 2270–2280. [Google Scholar] [CrossRef] [PubMed]
- Cho, E.; Soh, H.S.; Lee, J.R.; Yun, J.; Bae, W.K.; Lee, H. Association between smoking status and handgrip strength in Korean male adults: Based on Korea National Health and Nutrition Examination Survey 2016–2019. Front. Med. 2023, 10, 1212946. [Google Scholar] [CrossRef]
- Jackson, C.L.; Patel, S.R.; Jackson, W.B., 2nd; Lutsey, P.L.; Redline, S. Agreement between self-reported and objectively measured sleep duration among white, black, Hispanic, and Chinese adults in the United States: Multi-Ethnic Study of Atherosclerosis. Sleep 2018, 41, zsy057. [Google Scholar] [CrossRef] [PubMed]
- Jackowska, M.; Ronaldson, A.; Brown, J.; Steptoe, A. Biological and psychological correlates of self-reported and objective sleep measures. J. Psychosom. Res. 2016, 84, 52–55. [Google Scholar] [CrossRef]
- Howes, E.M.; Parker, M.K.; Misyak, S.A.; DiFeliceantonio, A.G.; Davy, B.M.; Brown, L.E.C.; Hedrick, V.E. The Impact of Weight Bias and Stigma on the 24 h Dietary Recall Process in Adults with Overweight and Obesity: A Pilot Study. Nutrients 2024, 16, 191. [Google Scholar] [CrossRef]
- Dyrstad, S.M.; Hansen, B.H.; Holme, I.M.; Anderssen, S.A. Comparison of self-reported versus accelerometer-measured physical activity. Med. Sci. Sports Exerc. 2014, 46, 99–106. [Google Scholar] [CrossRef]


| Characteristic | Overall | Sleep Quality | |
|---|---|---|---|
| n = 1308 | Good n = 512 | Poor n = 796 | |
| Age, y, X ± SE | 56.3 ± 0.3 | 56.3 ± 0.4 | 56.4 ± 0.3 |
| Sex, % men | 41.6 | 39.4 | 45.3 |
| Race, % African American | 58.1 | 60.0 | 57.7 |
| Poverty, % <125% | 36.8 | 34.2 | 39.6 |
| Cigarette smoker, % | 40.9 | 35.4 | 47.8 |
| Drug user, % | 85.2 | 85.8 | 83.5 |
| Medical condition, % | 73.5 | 66.6 | 75.4 |
| Sleep | |||
| PSQI global score, X ± SE | 7.39 ± 0.12 | 3.2 ± 0.06 | 10.11 ± 0.12 *** |
| Quality, % poor (PSQI > 5) | 60.9 | - | - |
| PSQI Sleep disturbance component, X ± SE | 1.29 ± 0.02 | 0.96 ± 0.02 | 1.49 ± 0.02 *** |
| PSQI Sleep daytime dysfunction component, X ± SE | 0.67 ± 0.03 | 0.28 ± 0.03 | 0.92 ± 0.04 *** |
| PSQI Sleep duration component, X ± SE | 1.28 ± 0.03 | 0.49 ± 0.03 | 1.79 ± 0.04 *** |
| PSQI Sleep efficiency component, X ± SE | 1.07 ± 0.03 | 0.28 ± 0.03 | 1.59 ± 0.04 *** |
| PSQI Sleep latency component, X ± SE | 1.30 ± 0.04 | 0.48 ± 0.04 | 1.83 ± 0.04 *** |
| PSQI Sleep medication component, X ± SE | 0.55 ± 0.03 | 0.12 ± 0.02 | 0.83 ± 0.04 *** |
| PSQI Sleep subjective quality component, X ± SE | 1.21 ± 0.03 | 0.54 ± 0.03 | 1.65 ± 0.03 *** |
| Self-reported duration, hours/night, X ± SE | 5.9 ± 0.05 | 7.0 ± 0.05 | 5.2 ± 0.05 *** |
| Self-reported sleep quality: | |||
| Very good, % | 25.6 | 52.0 | 8.7 |
| Fairly good, % | 39.9 | 42.8 | 38.1 |
| Fairly bad, % | 21.9 | 4.9 | 32.9 |
| Very bad, % | 12.5 | 0.4 | 20.4 |
| Handgrip/BMI, kg, X ± SE | 1.14 ± 0.13 | 1.20 ± 0.02 | 1.10 ± 0.02 *** |
| Diet | |||
| e-DII score, X ± SE | 5.17 ± 0.03 | 5.03 ± 0.06 | 5.26 ± 0.04 ** |
| HEI-2010 score, X ± SE | 48.53 ± 0.34 | 50.3 ± 0.6 | 47.4 ± 0.4 *** |
| Protein intake/body weight, g/kg, X ± SE | 0.91 ± 0.01 | 0.96 ± 0.02 | 0.88 ± 0.02 ** |
| Energy, kcal, X ± SE | 1978 ± 23 | 2045 ± 38 | 1936 ± 28 * |
| Physical Activity | p < 0.001 | ||
| No physical activity, % | 13.9 | 9.8 | 16.6 |
| <150 min activity/week, % | 67.7 | 64.5 | 69.7 |
| ≥150 min activity/week, % | 18.4 | 25.8 | 13.7 |
| Path: Relationships | Direct Effect b | p | ||
|---|---|---|---|---|
| A: Sleep quality → e-DII | 0.029 ± 0.009 | 0.0006 | ||
| D: Sleep quality → LS7 | 0.022 ± 0.004 | <0.0001 | ||
| C: Sleep quality → HG/BMI | −0.007 ± 0.002 | 0.006 | ||
| B: e-DII → HG/BMI | −0.002 ± 0.009 | 0.062 | ||
| E: LS7 → HG/BMI | −0.037 ± 0.019 | 0.071 | ||
| Outcome: HG/BMI | Indirect Effect | Bootstrapped Confidence Interval | ||
| Lower Bound | Upper Bound | |||
| Sleep quality → e-DII → HG/BMI | −0.0001 ± 0.0003 | NS | −0.0006 | 0.0005 |
| Sleep quality → LS7 → HG/BMI | −0.0008 ± 0.0005 | NS | −0.0018 | 0.0001 |
| Path: Relationships | Direct Effect b | p | ||
|---|---|---|---|---|
| A: Sleep quality → HEI | −0.318 ± 0.080 | 0.0001 | ||
| D: Sleep quality → LS7 | 0.022 ± 0.004 | <0.0001 | ||
| C: Sleep quality → HG/BMI | −0.006 ± 0.002 | 0.009 | ||
| B: HEI-2010 → HG/BMI | 0.002 ± 0.001 | 0.038 | ||
| E: LS7 → HG/BMI | −0.031 ± 0.019 | 0.107 | ||
| Outcome: HG/BMI | Indirect Effect | Bootstrapped Confidence Interval | ||
| Lower Bound | Upper Bound | |||
| Sleep quality → HEI → HG/BMI | −0.0006 ± 0.0003 | NS | −0.0013 | 0.0000 |
| Sleep quality → LS7 → HG/BMI | −0.0007 ± 0.0005 | NS | −0.0017 | 0.0002 |
| Path: Relationships | Direct Effect b | p | ||
|---|---|---|---|---|
| A: Sleep quality→ Pr/BW | −0.006 ± 0.002 | 0.007 | ||
| D: Sleep quality → LS7 | 0.022 ± 0.004 | <0.001 | ||
| C: Sleep quality → HG/BMI | −0.005 ± 0.002 | 0.034 | ||
| B: Pr/BW → HG/BMI | 0.275 ± 0.030 | <0.0001 | ||
| E: LS7 → HG/BMI | −0.027 ± 0.018 | 0.144 | ||
| Outcome: HG/BMI | Indirect Effect | Bootstrapped Confidence Interval | ||
| Lower Bound | Upper Bound | |||
| Sleep quality → Pr/BW → HG/BMI | −0.0017 ± 0.0006 | <0.05 | −0.0030 | −0.0006 |
| Sleep quality → LS7 → HG/BMI | −0.006 ± 0.0004 | NS | −0.0015 | 0.0002 |
| Path: Relationships | Direct Effect b | p | ||
|---|---|---|---|---|
| A: Sleep duration → e-DII | −0.027 ± 0.023 | 0.237 | ||
| D: Sleep duration → LS7 | −0.039 ± 0.010 | 0.0001 | ||
| C: Sleep duration → HG/BMI | 0.009 ± 0.006 | 0.178 | ||
| B: e-DII → HG/BMI | −0.004 ± 0.009 | 0.664 | ||
| E: LS7 → HG/BMI | −0.043 ± 0.019 | 0.025 | ||
| Outcome: HG/BMI | Indirect Effect | Bootstrapped Confidence Interval | ||
| Lower Bound | Upper Bound | |||
| Sleep duration → e-DII → HG/BMI | 0.0001 ± 0.0003 | NS | −0.0004 | 0.0008 |
| Sleep duration → LS7 → HG/BMI | 0.0017 ± 0.0009 | NS | 0.0001 | 0.0037 |
| Path: Relationships | Direct Effect b | p | ||
|---|---|---|---|---|
| A: Sleep duration → HEI | 0.627 ± 0.212 | 0.0032 | ||
| D: Sleep duration → LS7 | −0.040 ± 0.010 | 0.0001 | ||
| C: Sleep duration → HG/BMI | 0.008 ± 0.006 | 0.228 | ||
| B: HEI-2010 → HG/BMI | 0.002 ± 0.001 | 0.026 | ||
| E: LS7 → HG/BMI | −0.036 ± 0.019 | 0.060 | ||
| Outcome: HG/BMI | Indirect Effect | Bootstrapped Confidence Interval | ||
| Lower Bound | Upper Bound | |||
| Sleep duration → HEI → HG/BMI | 0.0013 ± 0.0007 | <0.05 | 0.0001 | 0.0030 |
| Sleep duration → LS7 → HG/BMI | 0.0014 ± 0.0009 | NS | −0.0001 | 0.0034 |
| Path: Relationships | Direct Effect b | p | ||
|---|---|---|---|---|
| A: Sleep duration → Pr/BW | 0.021 ± 0.006 | 0.0008 | ||
| D: Sleep duration → LS7 | −0.040 ± 0.010 | 0.0001 | ||
| C: Sleep duration → HG/BMI | 0.010 ± 0.006 | 0.110 | ||
| B: Pr/BW → HG/BMI | 0.278 ± 0.030 | <0.0001 | ||
| E: LS7 → HG/BMI | −0.032 ± 0.018 | 0.079 | ||
| Outcome: HG/BMI | Indirect Effect | Bootstrapped Confidence Interval | ||
| Lower Bound | Upper Bound | |||
| Sleep duration → Pr/BW → HG/BMI | 0.0057 ± 0.0019 | <0.05 | 0.0023 | 0.0098 |
| Sleep duration → LS7 → HG/BMI | 0.0013 ± 0.0009 | NS | −0.0003 | 0.0032 |
Disclaimer/Publisher’s Note: The statements, opinions and data contained in all publications are solely those of the individual author(s) and contributor(s) and not of MDPI and/or the editor(s). MDPI and/or the editor(s) disclaim responsibility for any injury to people or property resulting from any ideas, methods, instructions or products referred to in the content. |
© 2025 by the authors. Licensee MDPI, Basel, Switzerland. This article is an open access article distributed under the terms and conditions of the Creative Commons Attribution (CC BY) license (https://creativecommons.org/licenses/by/4.0/).
Share and Cite
Kuczmarski, M.F.; Orsega-Smith, E.; Beydoun, M.A.; Evans, M.K.; Zonderman, A.B. Protein Intake and Diet Quality Mediate the Relationship Between Sleep and Handgrip Strength in Adults in the HANDLS Study. Nutrients 2025, 17, 1900. https://doi.org/10.3390/nu17111900
Kuczmarski MF, Orsega-Smith E, Beydoun MA, Evans MK, Zonderman AB. Protein Intake and Diet Quality Mediate the Relationship Between Sleep and Handgrip Strength in Adults in the HANDLS Study. Nutrients. 2025; 17(11):1900. https://doi.org/10.3390/nu17111900
Chicago/Turabian StyleKuczmarski, Marie Fanelli, Elizabeth Orsega-Smith, May A. Beydoun, Michele K. Evans, and Alan B. Zonderman. 2025. "Protein Intake and Diet Quality Mediate the Relationship Between Sleep and Handgrip Strength in Adults in the HANDLS Study" Nutrients 17, no. 11: 1900. https://doi.org/10.3390/nu17111900
APA StyleKuczmarski, M. F., Orsega-Smith, E., Beydoun, M. A., Evans, M. K., & Zonderman, A. B. (2025). Protein Intake and Diet Quality Mediate the Relationship Between Sleep and Handgrip Strength in Adults in the HANDLS Study. Nutrients, 17(11), 1900. https://doi.org/10.3390/nu17111900