
Changes in Body Mass Index and Their Associations with Psychological Distress, Worries, and Emotional Eating during the COVID-19 Pandemic: A Norwegian Cohort Study

 , , , ,
Abstract
:1. Introduction
2. Methods
2.1. Participants and Data Collection
2.2. Measures
2.3. Data Analyses
2.4. Ethics Approval and Consent to Participate
3. Results
4. Discussion
5. Conclusions
Supplementary Materials
Author Contributions
Funding
Institutional Review Board Statement
Informed Consent Statement
Data Availability Statement
Acknowledgments
Conflicts of Interest
References
- Obesity: Preventing and Managing the Global Epidemic: Report of a WHO Consultation; WHO: Geneva, Switzerland, 2000; Report No.: 0512-3054.
- Whitlock, G.; Lewington, S.; Sherliker, P.; Clarke, R.; Emberson, J.; Halsey, J.; Qizilbash, N.; Collins, R.; Peto, R. Body-mass index and cause-specific mortality in 900,000 adults: Collaborative analyses of 57 prospective studies. Lancet 2009, 373, 1083–1096. [Google Scholar] [PubMed]
- Guh, D.P.; Zhang, W.; Bansback, N.; Amarsi, Z.; Birmingham, C.L.; Anis, A.H. The incidence of co-morbidities related to obesity and overweight: A systematic review and meta-analysis. BMC Public Health 2009, 9, 88. [Google Scholar] [CrossRef] [PubMed]
- Fontaine, K.R.; Redden, D.T.; Wang, C.; Westfall, A.O.; Allison, D.B. Years of life lost due to obesity. J. Am. Med. Assoc. 2003, 289, 187–193. [Google Scholar] [CrossRef] [PubMed]
- Cava, E.; Neri, B.; Carbonelli, M.G.; Riso, S.; Carbone, S. Obesity pandemic during COVID-19 outbreak: Narrative review and future considerations. Clin. Nutr. 2021, 40, 1637–1643. [Google Scholar] [CrossRef] [PubMed]
- Di Renzo, L.; Gualtieri, P.; Pivari, F.; Soldati, L.; Attinà, A.; Cinelli, G.; Leggeri, C.; Caparello, G.; Barrea, L.; Scerbo, F.; et al. Eating habits and lifestyle changes during COVID-19 lockdown: An Italian survey. J. Transl. Med. 2020, 18, 229. [Google Scholar] [CrossRef] [PubMed]
- Coulthard, H.; Sharps, M.; Cunliffe, L.; van den Tol, A. Eating in the lockdown during the Covid 19 pandemic; self-reported changes in eating behaviour, and associations with BMI, eating style, coping and health anxiety. Appetite 2021, 161, 105082. [Google Scholar] [CrossRef]
- Pellegrini, M.; Ponzo, V.; Rosato, R.; Scumaci, E.; Goitre, I.; Benso, A.; Belcastro, S.; Crespi, C.; De Michieli, F.; Ghigo, E.; et al. Changes in Weight and Nutritional Habits in Adults with Obesity during the “Lockdown” Period Caused by the COVID-19 Virus Emergency. Nutrients 2020, 12, 2016. [Google Scholar] [CrossRef]
- Huang, Y.; Zhao, N. Generalized anxiety disorder, depressive symptoms and sleep quality during COVID-19 outbreak in China: A web-based cross-sectional survey. Psychiatry Res. 2020, 288, 112954. [Google Scholar] [CrossRef]
- Wang, C.; Pan, R.; Wan, X.; Tan, Y.; Xu, L.; Ho, C.S.; Ho, R.C. Immediate Psychological Responses and Associated Factors during the Initial Stage of the 2019 Coronavirus Disease (COVID-19) Epidemic among the General Population in China. Int. J. Environ. Res. Public Health 2020, 17, 1729. [Google Scholar] [CrossRef]
- Moccia, L.; Janiri, D.; Pepe, M.; Dattoli, L.; Molinaro, M.; De Martin, V.; Chieffo, D.; Janiri, L.; Fiorillo, A.; Sani, G.; et al. Affective temperament, attachment style, and the psychological impact of the COVID-19 outbreak: An early report on the Italian general population. Brain Behav. Immun. 2020, 87, 75–79. [Google Scholar] [CrossRef]
- Zhu, Y.; Jha, S.C.; Shutta, K.H.; Huang, T.; Balasubramanian, R.; Clish, C.B.; Hankinson, S.E.; Kubzansky, L.D. Psychological distress and metabolomic markers: A systematic review of posttraumatic stress disorder, anxiety, and subclinical distress. Neurosci. Biobehav. Rev. 2022, 143, 104954. [Google Scholar] [CrossRef] [PubMed]
- Abdelaal, M.; le Roux, C.W.; Docherty, N.G. Morbidity and mortality associated with obesity. Ann. Transl. Med. 2017, 5, 161. [Google Scholar] [CrossRef] [PubMed]
- Husky, M.M.; Mazure, C.M.; Ruffault, A.; Flahault, C.; Kovess-Masfety, V. Differential Associations between Excess Body Weight and Psychiatric Disorders in Men and Women. J. Womens Health 2018, 27, 183–190. [Google Scholar] [CrossRef]
- Scarpato, B.S.; Swardfager, W.; Eid, M.; Ploubidis, G.B.; MacIntosh, B.J.; Wu, C.Y.; Launer, L.J.; Cogo-Moreira, H. Dynamics between psychological distress and body mass index throughout adult life; evidence from 3 large cohort studies. J. Psychiatr. Res. 2021, 144, 378–388. [Google Scholar] [CrossRef]
- Barcin-Guzeldere, H.K.; Devrim-Lanpir, A. The Association between Body Mass Index, Emotional Eating and Perceived Stress during COVID-19 Partial Quarantine in Healthy Adults. Public Health Nutr. 2022, 25, 43–50. [Google Scholar] [CrossRef] [PubMed]
- Chao, A.; Grilo, C.M.; White, M.A.; Sinha, R. Food cravings mediate the relationship between chronic stress and body mass index. J. Health Psychol. 2015, 20, 721–729. [Google Scholar] [CrossRef]
- Moreno-Agostino, D.; Fisher, H.L.; Goodman, A.; Hatch, S.L.; Morgan, C.; Richards, M.; Das-Munshi, J.; Ploubidis, G.B. Long-term psychological distress trajectories and the COVID-19 pandemic in three British birth cohorts: A multi-cohort study. PLOS Med. 2023, 20, e1004145. [Google Scholar] [CrossRef]
- Ploubidis, G.B.; Sullivan, A.; Brown, M.; Goodman, A. Psychological distress in mid-life: Evidence from the 1958 and 1970 British birth cohorts. Psychol. Med. 2017, 47, 291–303. [Google Scholar] [CrossRef]
- Folkman, S. Personal control and stress and coping processes: A theoretical analysis. J. Personal. Soc. Psychol. 1984, 46, 839. [Google Scholar] [CrossRef]
- Heatherton, T.F.; Herman, C.P.; Polivy, J.; King, G.A.; McGree, S.T. The (mis) measurement of restraint: An analysis of conceptual and psychometric issues. J. Abnorm. Psychol. 1988, 97, 19. [Google Scholar] [CrossRef]
- Polivy, J.; Herman, C.P. Dieting and binging: A causal analysis. Am. Psychol. 1985, 40, 193. [Google Scholar] [CrossRef] [PubMed]
- Herman, C.P.; Polivy, J. A boundary model for the regulation of eating. Res. Publ.-Assoc. Res. Nerv. Ment. Dis. 1984, 62, 141–156. [Google Scholar] [CrossRef] [PubMed]
- Zachary, Z.; Brianna, F.; Brianna, L.; Garrett, P.; Jade, W.; Alyssa, D.; Mikayla, K. Self-quarantine and weight gain related risk factors during the COVID-19 pandemic. Obes. Res. Clin. Pract. 2020, 14, 210–216. [Google Scholar] [CrossRef] [PubMed]
- Bhutani, S.; vanDellen, M.R.; Cooper, J.A. Longitudinal Weight Gain and Related Risk Behaviors during the COVID-19 Pandemic in Adults in the US. Nutrients 2021, 13, 671. [Google Scholar] [CrossRef]
- Braden, A.; Musher-Eizenman, D.; Watford, T.; Emley, E. Eating when depressed, anxious, bored, or happy: Are emotional eating types associated with unique psychological and physical health correlates? Appetite 2018, 125, 410–417. [Google Scholar] [CrossRef] [PubMed]
- Yamamoto, K.; Okazaki, A.; Ohmori, S. The Relationship between Psychosocial Stress, Age, BMI, CRP, Lifestyle, and the Metabolic Syndrome in Apparently Healthy Subjects. J. Physiol. Anthropol. 2011, 30, 15–22. [Google Scholar] [CrossRef] [PubMed]
- Arnow, B.; Kenardy, J.; Agras, W.S. The Emotional Eating Scale: The development of a measure to assess coping with negative affect by eating. Int. J. Eat. Disord. 1995, 18, 79–90. [Google Scholar] [CrossRef]
- van Strien, T.; Cebolla, A.; Etchemendy, E.; Gutiérrez-Maldonado, J.; Ferrer-García, M.; Botella, C.; Baños, R. Emotional eating and food intake after sadness and joy. Appetite 2013, 66, 20–25. [Google Scholar] [CrossRef]
- Cecchetto, C.; Aiello, M.; Gentili, C.; Ionta, S.; Osimo, S.A. Increased emotional eating during COVID-19 associated with lockdown, psychological and social distress. Appetite 2021, 160, 105122. [Google Scholar] [CrossRef]
- Tan, C.C.; Chow, C.M. Stress and emotional eating: The mediating role of eating dysregulation. Personal. Individ. Differ. 2014, 66, 1–4. [Google Scholar] [CrossRef]
- Lazarevich, I.; Irigoyen Camacho, M.E.; Velázquez-Alva, M.d.C.; Zepeda Zepeda, M. Relationship among obesity, depression, and emotional eating in young adults. Appetite 2016, 107, 639–644. [Google Scholar] [CrossRef] [PubMed]
- Spoor, S.T.P.; Bekker, M.H.J.; Van Strien, T.; van Heck, G.L. Relations between negative affect, coping, and emotional eating. Appetite 2007, 48, 368–376. [Google Scholar] [CrossRef]
- Manna, P.; Jain, S.K. Obesity, Oxidative Stress, Adipose Tissue Dysfunction, and the Associated Health Risks: Causes and Therapeutic Strategies. Metab. Syndr. Relat. Disord. 2015, 13, 423–444. [Google Scholar] [CrossRef] [PubMed]
- Bemanian, M.; Mæland, S.; Blomhoff, R.; Rabben, Å.K.; Arnesen, E.K.; Skogen, J.C.; Fadnes, L.T. Emotional Eating in Relation to Worries and Psychological Distress Amid the COVID-19 Pandemic: A Population-Based Survey on Adults in Norway. Int J Environ. Res. Public Health 2020, 18, 130. [Google Scholar] [CrossRef]
- Strand, B.H.; Dalgard, O.S.; Tambs, K.; Rognerud, M. Measuring the mental health status of the Norwegian population: A comparison of the instruments SCL-25, SCL-10, SCL-5 and MHI-5 (SF-36). Nord J. Psychiatry 2003, 57, 113–118. [Google Scholar] [CrossRef] [PubMed]
- Kvaløy, K.; Melhus, M.; Silviken, A.; Brustad, M.; Sørlie, T.; Broderstad, A.R. Disordered eating in Sami and non-Sami Norwegian populations: The SAMINOR 2 clinical survey. Public Health Nutr. 2018, 21, 1094–1105. [Google Scholar] [CrossRef]
- Craig, C.L.; Marshall, A.L.; Sjöström, M.; Bauman, A.E.; Booth, M.L.; Ainsworth, B.E.; Pratt, M.; Ekelund, U.; Yngve, A.; Sallis, J.F.; et al. International physical activity questionnaire: 12-country reliability and validity. Med. Sci. Sports Exerc. 2003, 35, 1381–1395. [Google Scholar] [CrossRef]
- Zierle-Ghosh, A.; Jan, A. Physiology, Body Mass Index. In StatPearls; StatPearls Publishing, Copyright© 2023, StatPearls Publishing LLC.: Treasure Island, FL, USA, 2022. [Google Scholar]
- Mehmetoglu, M. Medsem: A Stata package for statistical mediation analysis. Int. J. Comput. Econ. Econom. 2018, 8, 63–78. [Google Scholar]
- Baron, R.M.; Kenny, D.A. The moderator–mediator variable distinction in social psychological research: Conceptual, strategic, and statistical considerations. J. Personal. Soc. Psychol. 1986, 51, 1173–1182. [Google Scholar] [CrossRef]
- Sobel, M.E. Asymptotic confidence intervals for indirect effects in structural equation models. Sociol. Methodol. 1982, 13, 290–312. [Google Scholar] [CrossRef]
- Konttinen, H. Emotional eating and obesity in adults: The role of depression, sleep and genes. Proc. Nutr. Soc. 2020, 79, 283–289. [Google Scholar] [CrossRef] [PubMed]
- Nolan, L.J.; Halperin, L.B.; Geliebter, A. Emotional Appetite Questionnaire. Construct validity and relationship with BMI. Appetite 2010, 54, 314–319. [Google Scholar] [CrossRef] [PubMed]
- Péneau, S.; Ménard, E.; Méjean, C.; Bellisle, F.; Hercberg, S. Sex and dieting modify the association between emotional eating and weight status. Am. J. Clin. Nutr. 2013, 97, 1307–1313. [Google Scholar] [CrossRef]
- Spence, C. Comfort food: A review. Int. J. Gastron. Food Sci. 2017, 9, 105–109. [Google Scholar] [CrossRef]
- Harvey, S.B.; Øverland, S.; Hatch, S.L.; Wessely, S.; Mykletun, A.; Hotopf, M. Exercise and the Prevention of Depression: Results of the HUNT Cohort Study. Am. J. Psychiatry 2018, 175, 28–36. [Google Scholar] [CrossRef]
- Warburton, D.E.R.; Bredin, S.S.D. Reflections on Physical Activity and Health: What Should We Recommend? Can. J. Cardiol. 2016, 32, 495–504. [Google Scholar] [CrossRef]
- Costa, M.L.; Costa, M.G.O.; de Souza, M.F.C.; da Silva, D.G.; Vieira, D.A.d.S.; Mendes-Netto, R.S. Is Physical Activity Protective against Emotional Eating Associated Factors during the COVID-19 Pandemic? A Cross-Sectional Study among Physically Active and Inactive Adults. Nutrients 2021, 13, 3861. [Google Scholar] [CrossRef] [PubMed]
- Javadi Arjmand, E.; Bemanian, M.; Vold, J.H.; Skogen, J.C.; Sandal, G.M.; Arnesen, E.K.; Mæland, S.; Fadnes, L.T. Emotional Eating and Changes in High-Sugar Food and Drink Consumption Linked to Psychological Distress and Worries: A Cohort Study from Norway. Nutrients 2023, 15, 778. [Google Scholar] [CrossRef] [PubMed]
- Dallman, M.F.; la Fleur, S.E.; Pecoraro, N.C.; Gomez, F.; Houshyar, H.; Akana, S.F. Minireview: Glucocorticoids—Food Intake, Abdominal Obesity, and Wealthy Nations in 2004. Endocrinology 2004, 145, 2633–2638. [Google Scholar] [CrossRef]
- Guerrini-Usubini, A.; Cattivelli, R.; Scarpa, A.; Musetti, A.; Varallo, G.; Franceschini, C.; Castelnuovo, G. The interplay between emotion dysregulation, psychological distress, emotional eating, and weight status: A path model. Int. J. Clin. Health Psychol. 2023, 23, 100338. [Google Scholar] [CrossRef]
- Pfattheicher, S.; Sassenrath, C. A regulatory focus perspective on eating behavior: How prevention and promotion focus relates to emotional, external, and restrained eating. Front. Psychol. 2014, 5, 1314. [Google Scholar] [CrossRef] [PubMed]
- Tice, D.M.; Bratslavsky, E.; Baumeister, R.F. Emotional distress regulation takes precedence over impulse control: If you feel bad, do it! J. Personal. Soc. Psychol. 2001, 80, 53–67. [Google Scholar] [CrossRef]
- Katterman, S.N.; Kleinman, B.M.; Hood, M.M.; Nackers, L.M.; Corsica, J.A. Mindfulness meditation as an intervention for binge eating, emotional eating, and weight loss: A systematic review. Eat 2014, 15, 197–204. [Google Scholar] [CrossRef]
- Knudsen, A.K.; Hotopf, M.; Skogen, J.C.; Overland, S.; Mykletun, A. The health status of nonparticipants in a population-based health study: The Hordaland Health Study. Am. J. Epidemiol. 2010, 172, 1306–1314. [Google Scholar] [CrossRef] [PubMed]


| Age | 18–40 | 40–60 | 60+ | Total |
|---|---|---|---|---|
| Age distribution (%) | 7131 (31) | 9328 (41) | 6489 (28) | 22,948 |
| Sex (%) | ||||
| Female | 4385 (61) | 5270 (56) | 3017 (46) | 12,672 (55) |
| Male | 2746 (39) | 4058 (44) | 3472 (54) | 10,276 (45) |
| BMI median (25–75%) | 24 (22–27) | 26 (23–28) | 25 (23–28) | 25 (23–28) |
| BMI categories (%) | ||||
| Underweight | 172 (2) | 65 (1) | 65 (1) | 302 (1) |
| Normal | 4135 (58) | 4031 (43) | 2883 (44) | 11,049 (48) |
| Overweight | 2012 (28) | 3738 (40) | 2736 (42) | 8486 (37) |
| Obese | 812 (11) | 1494 (16) | 805 (12) | 3111 (14) |
| Education level * | ||||
| Primary school | 533 (7) | 430 (5) | 610 (9) | 1573 (7) |
| High school/trade school | 1868 (26) | 2350 (25) | 2039 (39) | 6257 (27) |
| ≤3 years of higher education | 1862 (26) | 2249 (24) | 1494 (23) | 5606 (24) |
| ≥4 years of higher education | 2864 (40) | 4287 (46) | 2324 (36) | 9475 (41) |
| Employment prior to COVID-19 (%) ** | ||||
| Employed (full/part-time) | 5555 (78) | 8354 (90) | 2458 (38) | 16,367 (71) |
| Student | 1779 (25) | 126 (1) | 9 (0) | 1914 (8) |
| COVID-19 consequences in the initial period (%) ** | ||||
| Temporarily laid-off | 866 (12) | 731 (8) | 222 (3) | 1819 (8) |
| Lost employment | 132 (2) | 74 (1) | 26 (0) | 232 (1) |
| Home office | 1358 (19) | 1373 (15) | 1013 (16) | 3744 (16) |
| Placed in quarantine | 2712 (38) | 4877 (52) | 1248 (19) | 8837 (39) |
| Substantial worries (%) | ||||
| Related to personal economy | 1875 (26) | 1600 (17) | 368 (6) | 3843 (17) |
| Health-related | 3698 (52) | 4333 (46) | 2137 (33) | 10,168 (44) |
| High psychological distress (%) | 2419 (34) | 1593 (17) | 619 (10) | 4631 (20) |
| Fixed Effects | Time Trend (Per Year) | |
|---|---|---|
| Time trends per year ** | 0.15 (0.08; 0.23) | |
| Age | ||
| 18–40 | 0 (reference) | 0 (reference) |
| 40–60 | 1.53 (1.40; 1.66) | −0.10 (−0.15; −0.05) |
| 60+ | 1.17 (1.02; 1.32) | −0.24 (−0.29; −0.19) |
| Sex | ||
| Male | 0 (reference) | 0 (reference) |
| Female | −1.47 (−1.58; −1.36) | 0.07 (0.03; 0.10) |
| Health-related worries | ||
| None or some | 0 (reference) | 0 (reference) |
| Substantial | −0.02 (−0.08; 0.03) | 0.05 (0.01; 0.10) |
| Worries related to economy | ||
| None or some | 0 (reference) | 0 (reference) |
| Substantial | 0.05 (−0.02; 0.14) | −0.02 (−0.09; 0.05) |
| Psychological distress (0 = none to 1 = extreme) | 1.62 (1.27; 1.97) | 0.23 (0.10; 0.36) |
| Emotional eating (0 = never to 1 = everyday) | 0.68 (0.57; 0.79) | 0.27 (0.17; 0.37) |
| High-sugar foods and drink intake (0 = no to 1 = daily) | 0.35 (0.20; 0.49) | 0.10 (0.00; 0.20) |
| Activity level | ||
| Low | 0 (reference) | 0 (reference) |
| Moderate | −0.16 (−0.23; −0.10) | −0.01 (−0.06; 0.04) |
| High | −0.27 (−0.34; −0.20) | −0.05 (−0.11; 0,00) |
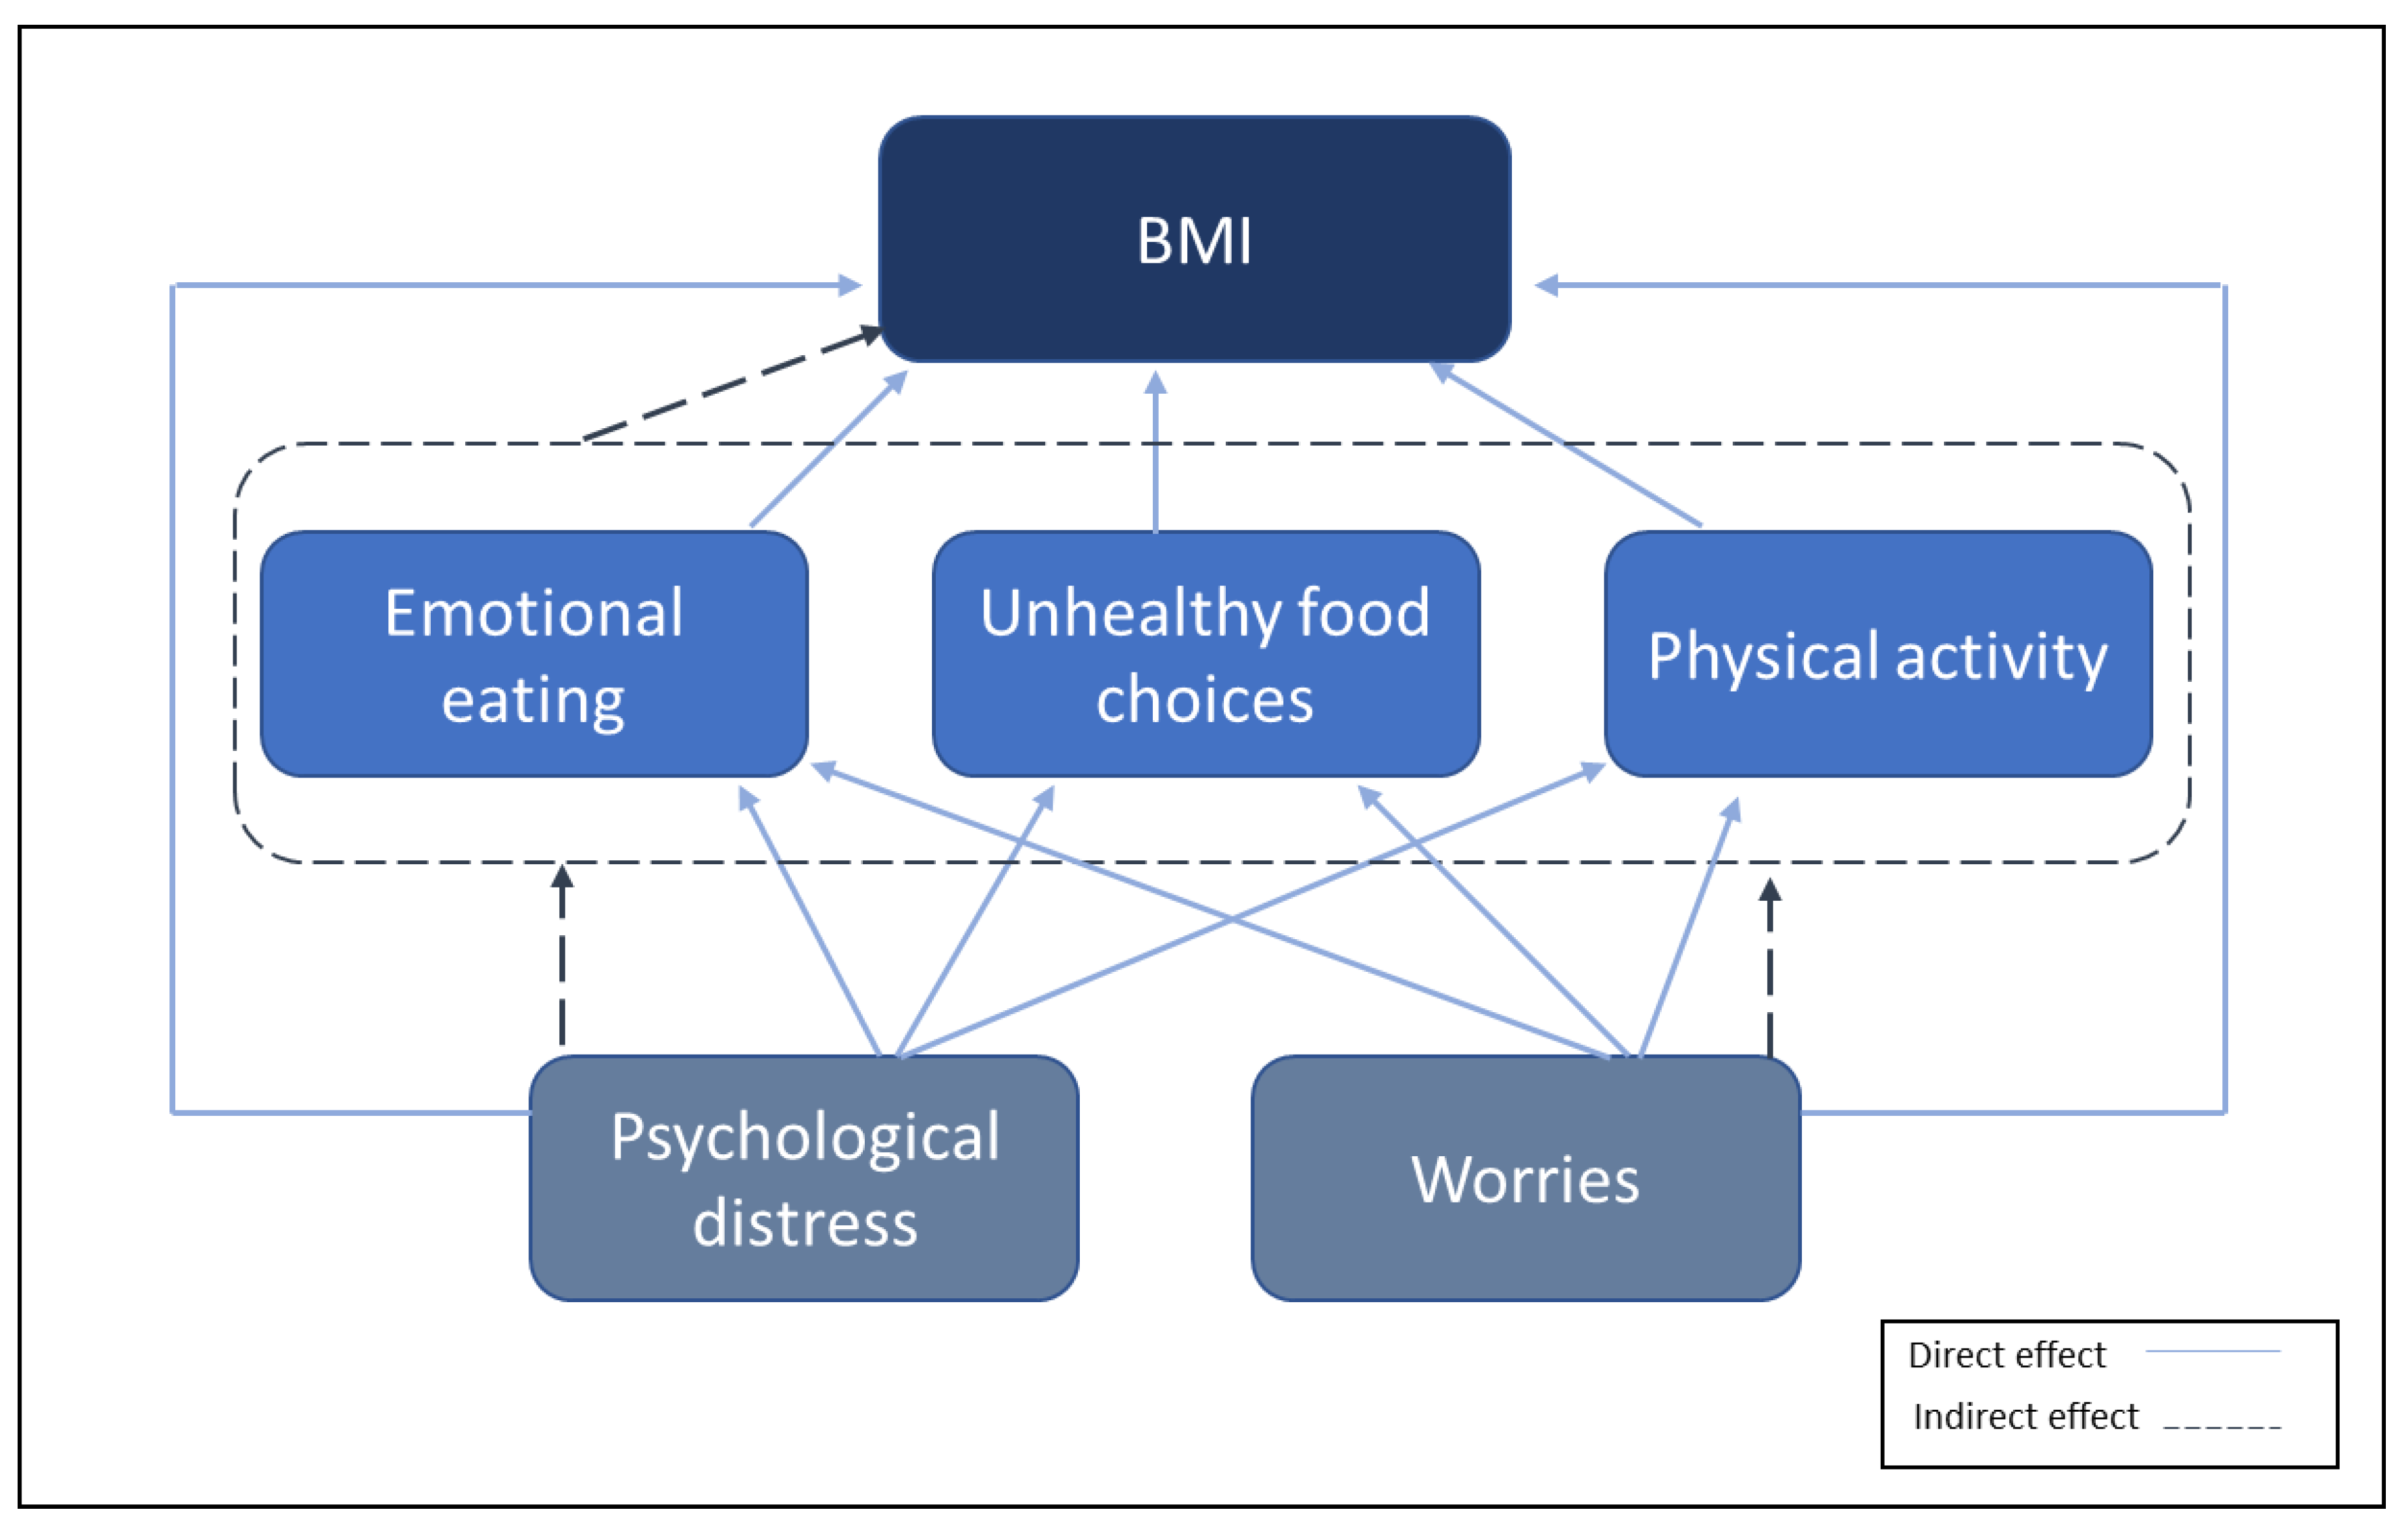
| Variable | Direct Effect | Indirect Effect | Total Effect | β |
|---|---|---|---|---|
| BMI difference | ||||
| Psychological distress | 0.17 (0.08; 0.28) | 0.06 (0.02; 0.11) | 0.24 (0.15; 0.33) | 0.04 * |
| Emotional eating | 0.04 (0.01; 0.07) | 0.04 (0.01; 0.07) | 0.03 * | |
| High-sugar foods and drink intake | −0.01 (−0.03; 0.02) | −0.01 (−0.03; 0.02) | −0.004 | |
| Physical activity | −0.01 (−0.07; 0.05) | −0.01 (−0.07; 0.05) | −0.004 | |
| Emotional eating | ||||
| Psychological distress | 1.55 (1.49; 1.62) | 1.55 (1.49; 1.62) | 0.47 * | |
| High-sugar foods and drink intake | ||||
| Psychological distress | 0.49 (0.41; 0.56) | 0.49 (0.41; 0.56) | 0.14 * | |
| Physical activity | ||||
| Psychological distress | −0.18 (−0.21; −0.14) | −0.18 (−0.21; −0.14) | −0.12 * | |
Disclaimer/Publisher’s Note: The statements, opinions and data contained in all publications are solely those of the individual author(s) and contributor(s) and not of MDPI and/or the editor(s). MDPI and/or the editor(s) disclaim responsibility for any injury to people or property resulting from any ideas, methods, instructions or products referred to in the content. |
© 2023 by the authors. Licensee MDPI, Basel, Switzerland. This article is an open access article distributed under the terms and conditions of the Creative Commons Attribution (CC BY) license (https://creativecommons.org/licenses/by/4.0/).
Share and Cite
Arjmand, E.J.; Skogen, J.C.; Vold, J.H.; Alpers, S.E.; Arnesen, E.K.; Mæland, S.; Fadnes, L.T. Changes in Body Mass Index and Their Associations with Psychological Distress, Worries, and Emotional Eating during the COVID-19 Pandemic: A Norwegian Cohort Study. Nutrients 2023, 15, 3834. https://doi.org/10.3390/nu15173834
Arjmand EJ, Skogen JC, Vold JH, Alpers SE, Arnesen EK, Mæland S, Fadnes LT. Changes in Body Mass Index and Their Associations with Psychological Distress, Worries, and Emotional Eating during the COVID-19 Pandemic: A Norwegian Cohort Study. Nutrients. 2023; 15(17):3834. https://doi.org/10.3390/nu15173834
Chicago/Turabian StyleArjmand, Elaheh Javadi, Jens Christoffer Skogen, Jørn Henrik Vold, Silvia Eiken Alpers, Erik Kristoffer Arnesen, Silje Mæland, and Lars Thore Fadnes. 2023. "Changes in Body Mass Index and Their Associations with Psychological Distress, Worries, and Emotional Eating during the COVID-19 Pandemic: A Norwegian Cohort Study" Nutrients 15, no. 17: 3834. https://doi.org/10.3390/nu15173834
APA StyleArjmand, E. J., Skogen, J. C., Vold, J. H., Alpers, S. E., Arnesen, E. K., Mæland, S., & Fadnes, L. T. (2023). Changes in Body Mass Index and Their Associations with Psychological Distress, Worries, and Emotional Eating during the COVID-19 Pandemic: A Norwegian Cohort Study. Nutrients, 15(17), 3834. https://doi.org/10.3390/nu15173834