
Dietary Intake, Body Composition and Performance of Professional Football Athletes in Slovenia


Abstract
1. Introduction
- Evaluate the nutritional intake (energy, macronutrient and micronutrient intake) of professional football players of a football club playing in the First Slovenian League.
- Investigate possible correlations between dietary intake and body composition.
- Explore possible correlations between nutritional intake and physical performance.
- Present the importance of a nutritional consultant and the monitoring of nutritional intake as a method for optimizing the performance of football players and preventing relative energy deficiency syndrome (RED-S).
- Hypothesis 1: Football players consuming the recommended amount of protein (1.6–2.2 g/kg BW) and carbohydrates (4–8 g/kg BW) will have a body composition with a higher percentage of lean BW.
- Hypothesis 2: Football players who consume the recommended amount of protein (1.6–2.2 g/kg BW) and carbohydrates (4–8 g/kg BW) will cover a longer distance in the Cooper performance test.
- Hypothesis 3: Football players with an energy availability ≥30 kcal/kg fat free mass (FFM) will cover a longer distance in the Cooper test.
2. Materials and Methods
2.1. Subjects
2.2. Nutritional Assessment
2.3. Physical Activity Evaluation
2.4. Body Composition Assessment
2.5. Performance Assessment
2.6. Statistical Analysis
3. Results
3.1. Sample Characteristics
3.2. Dietary Intake Evaluation
3.2.1. Energy Availability
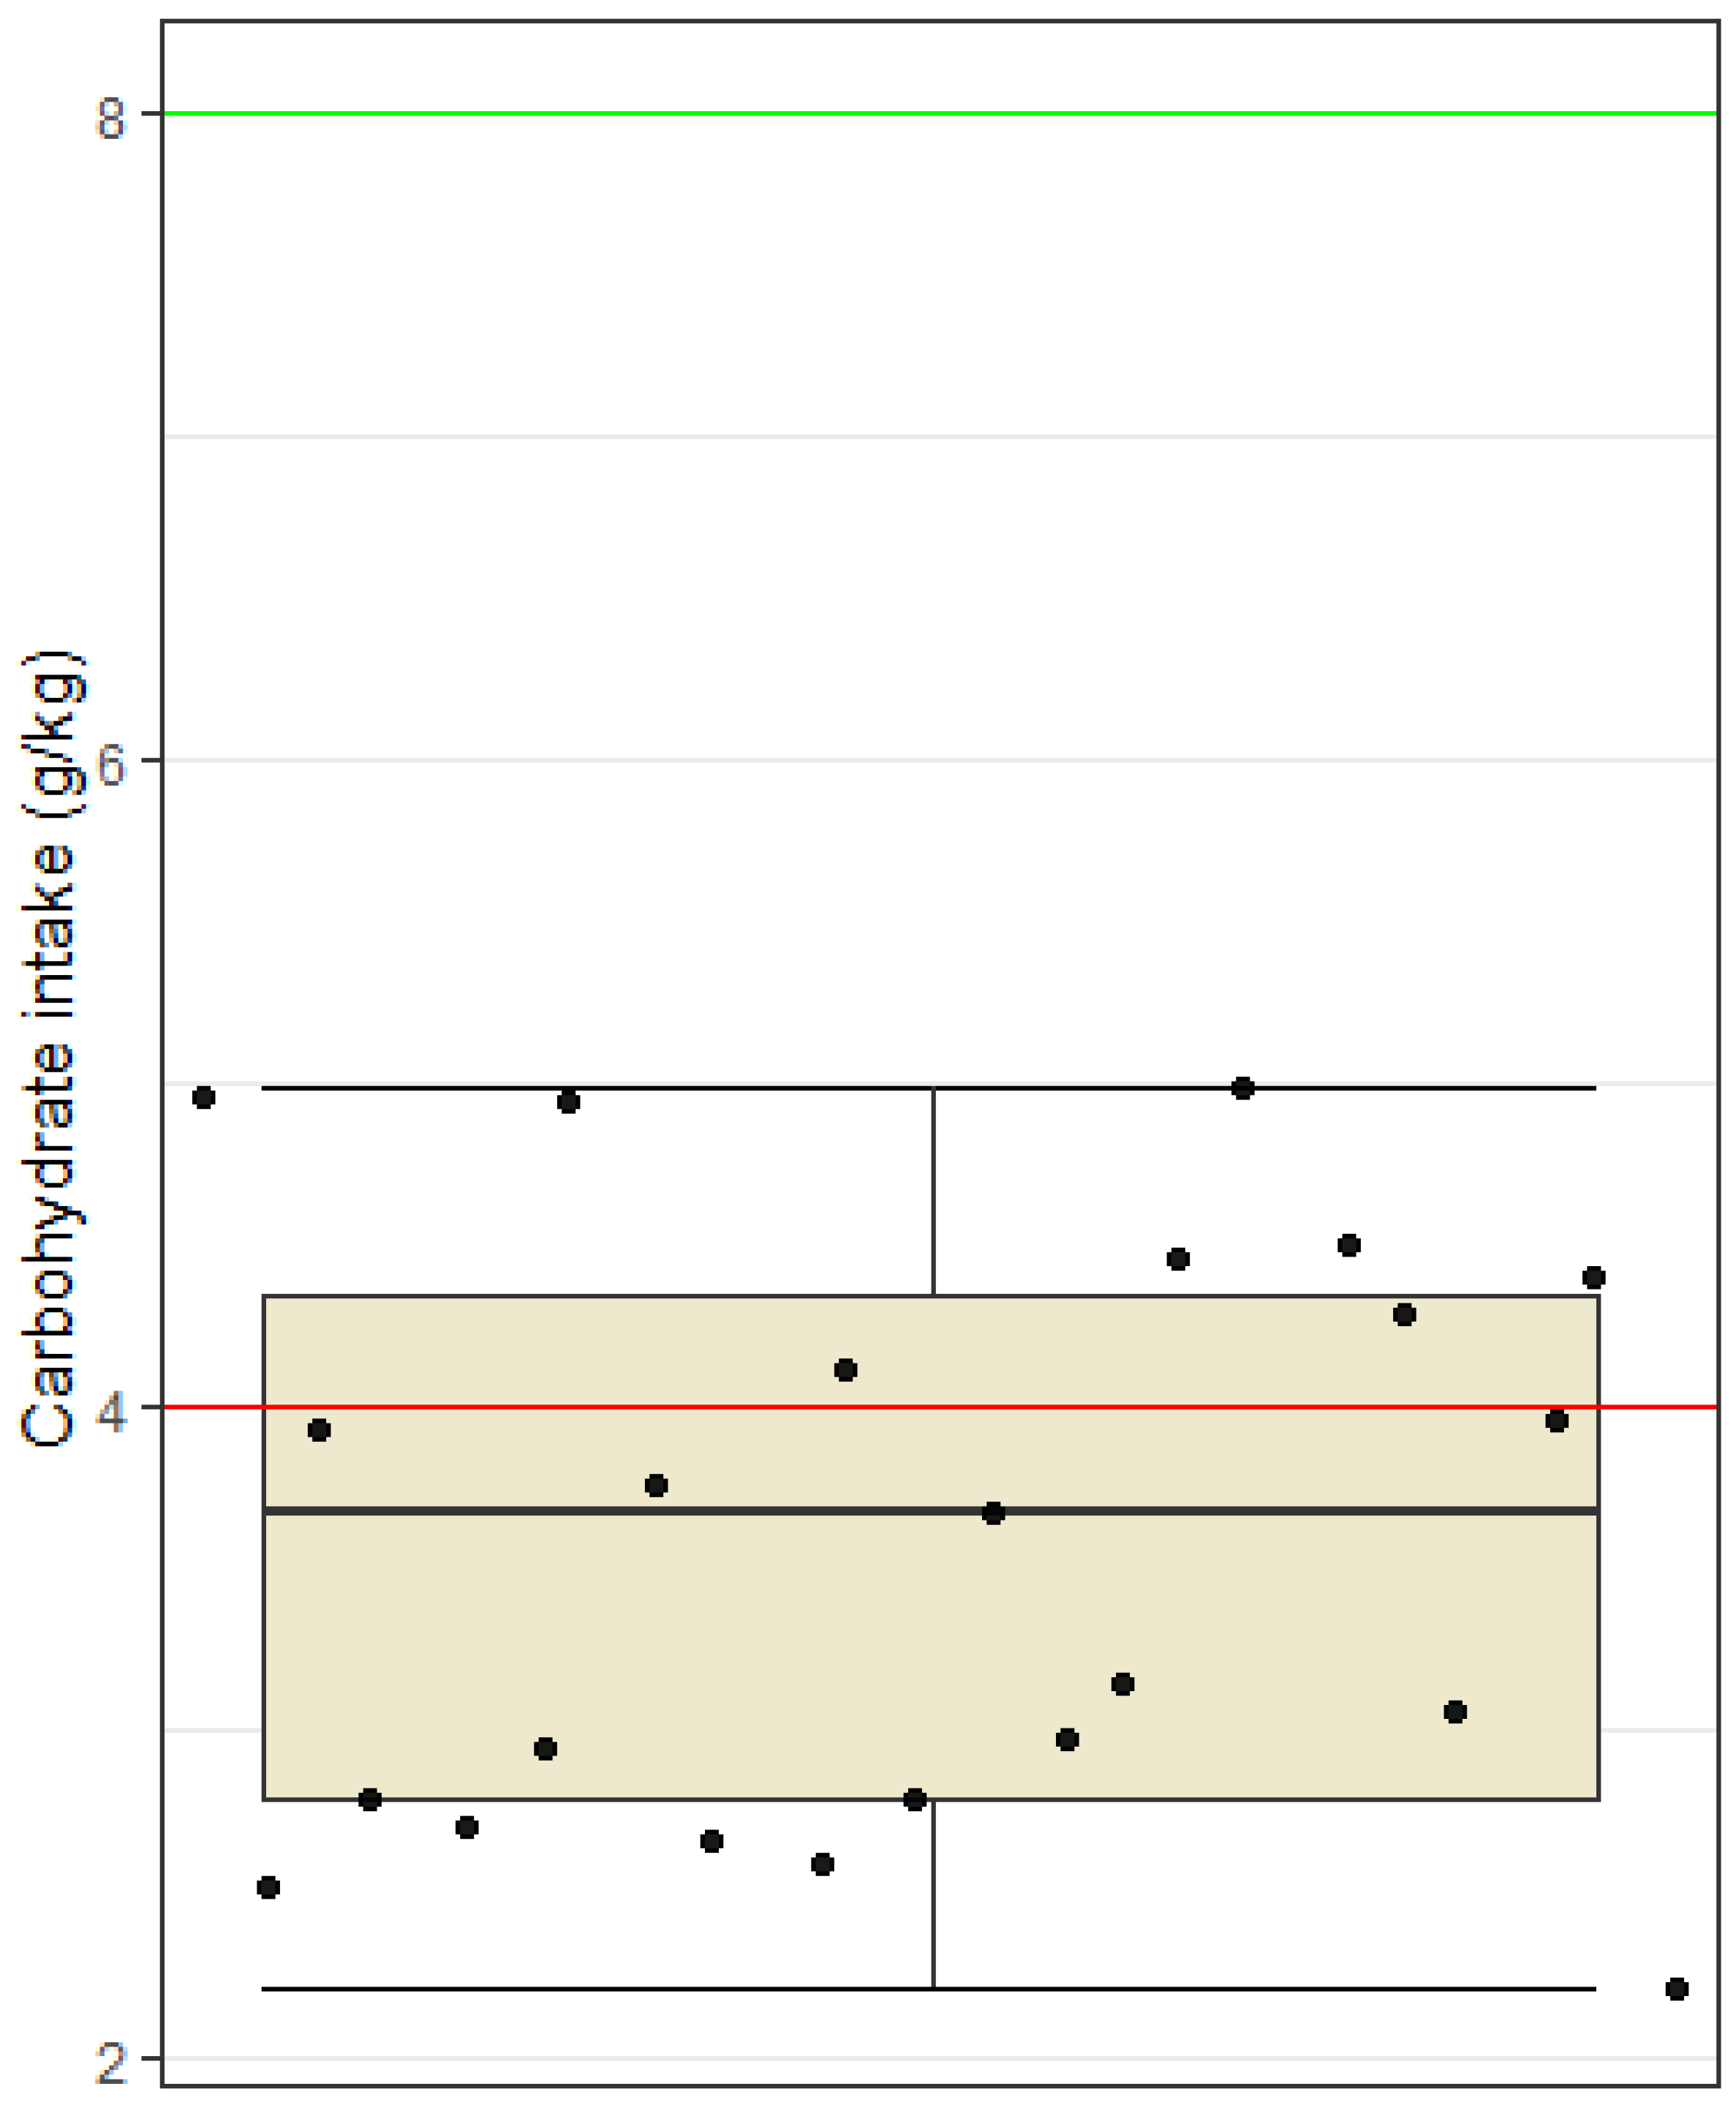
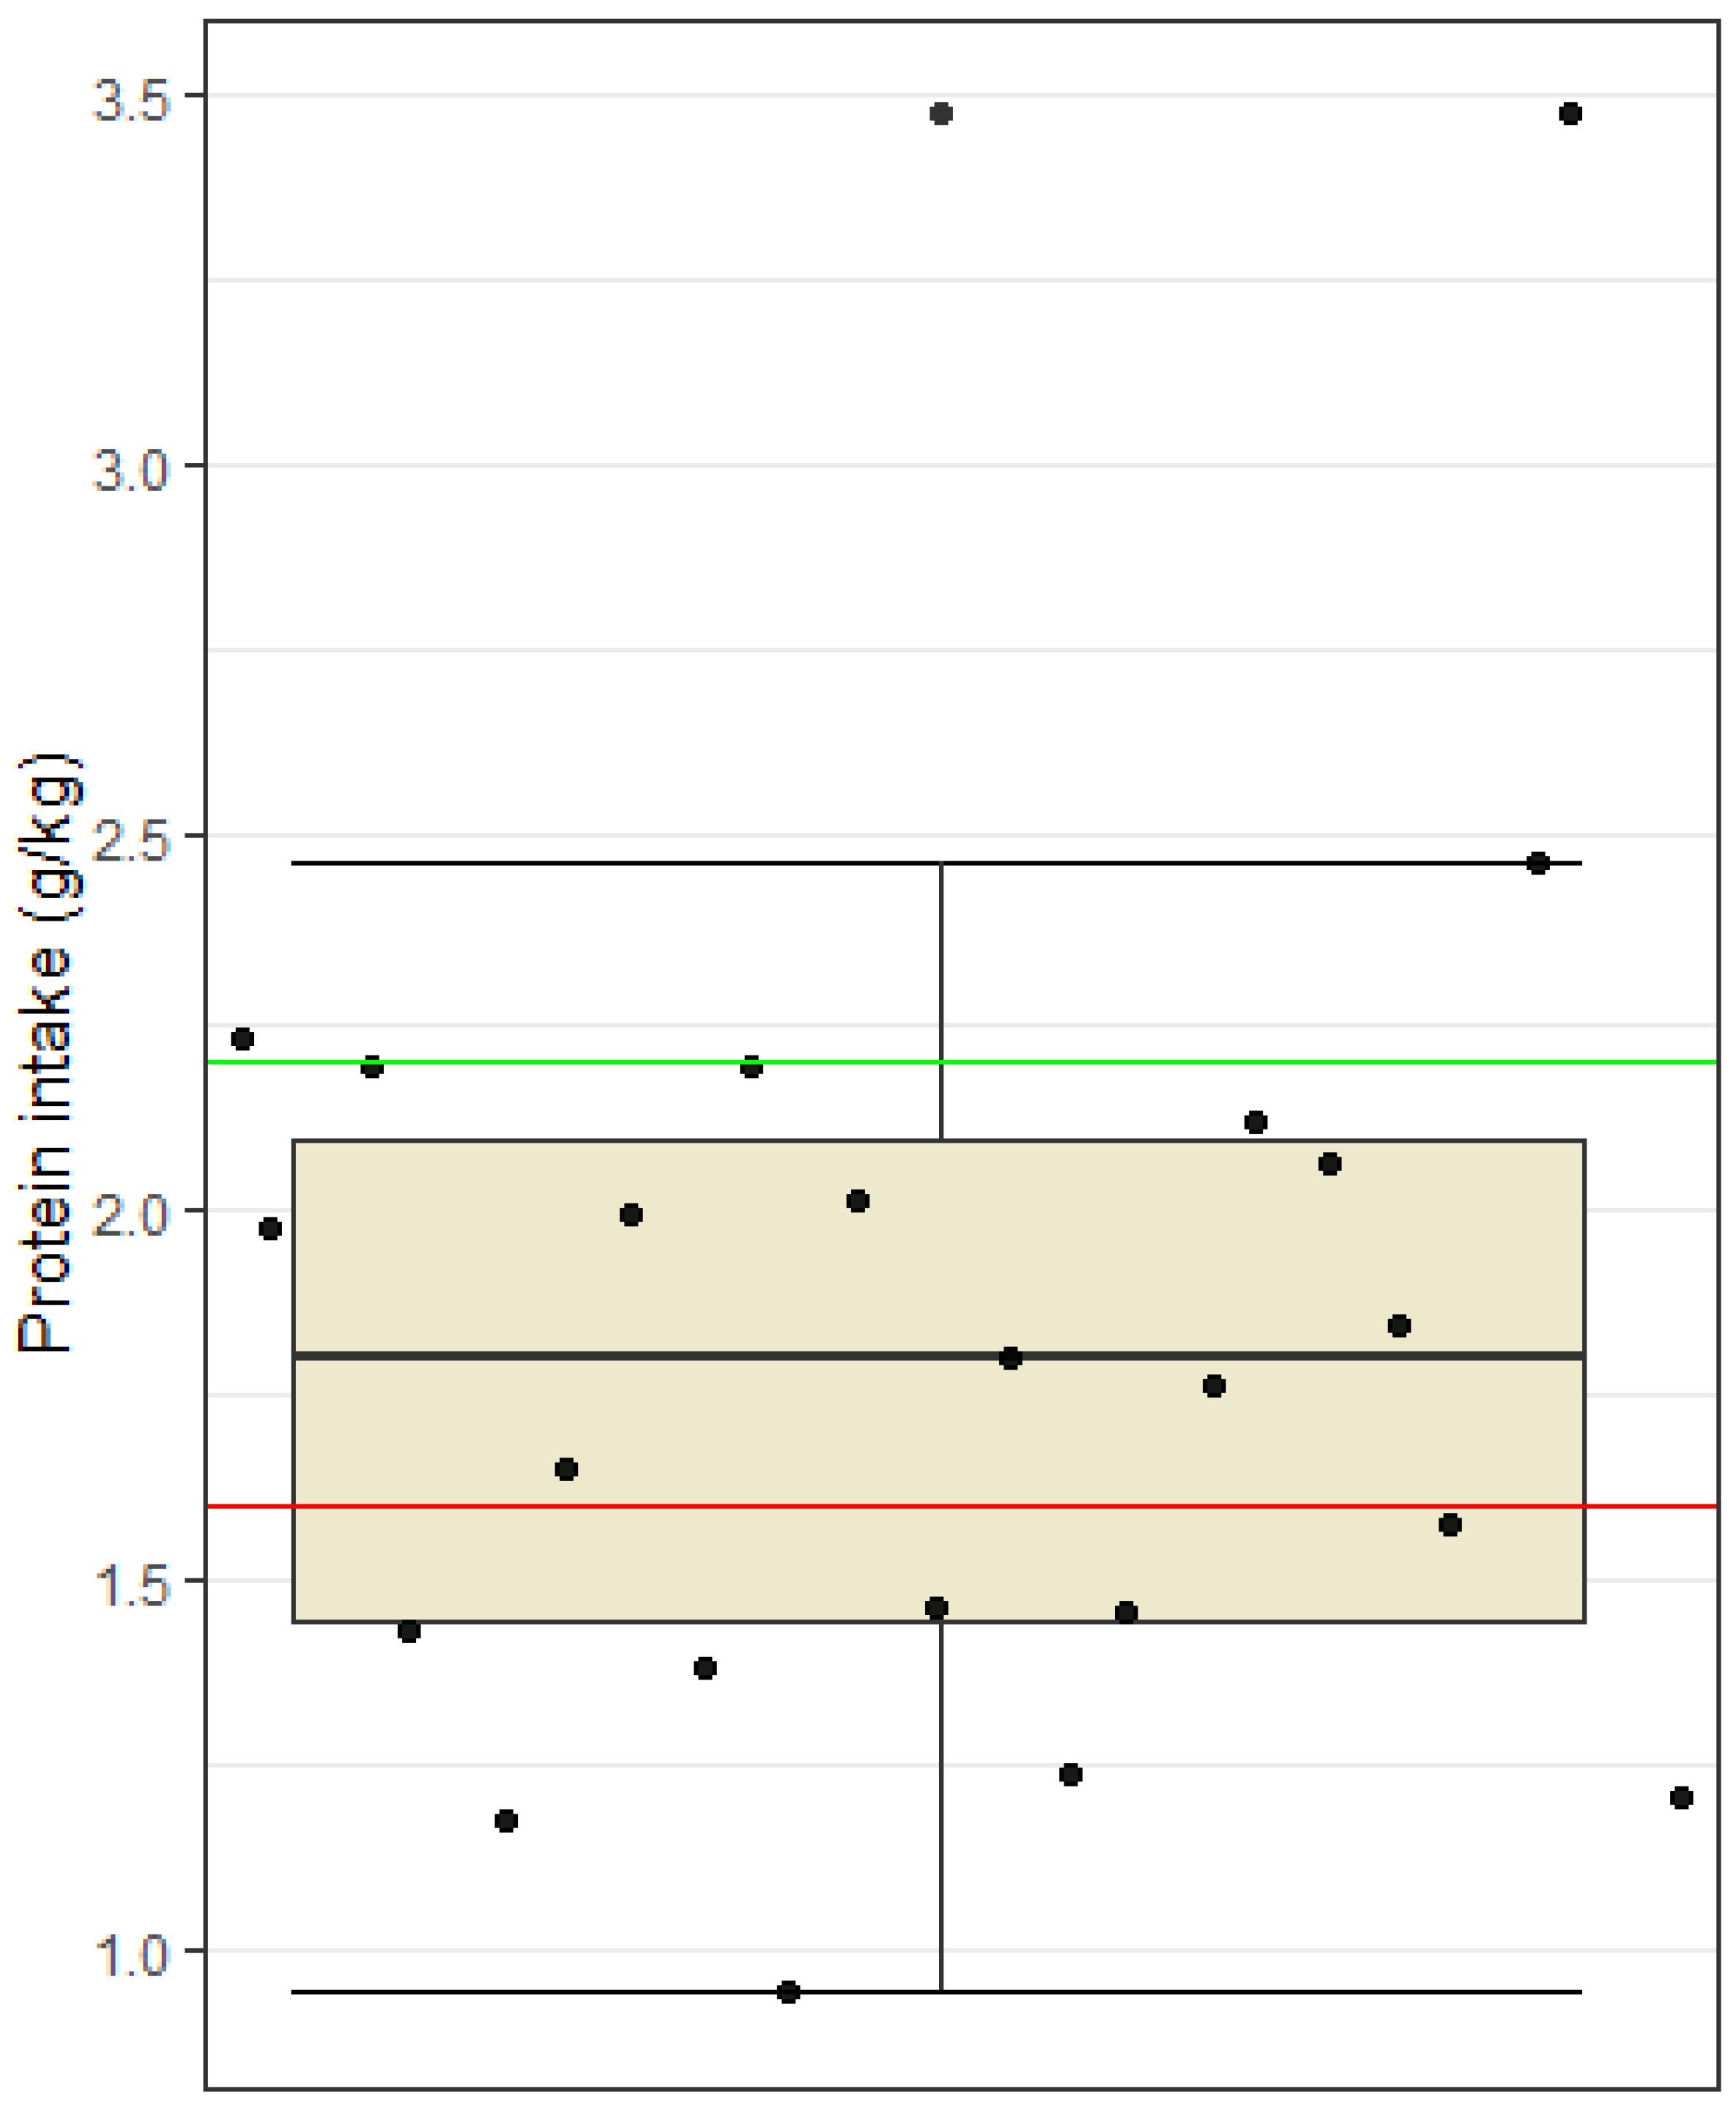
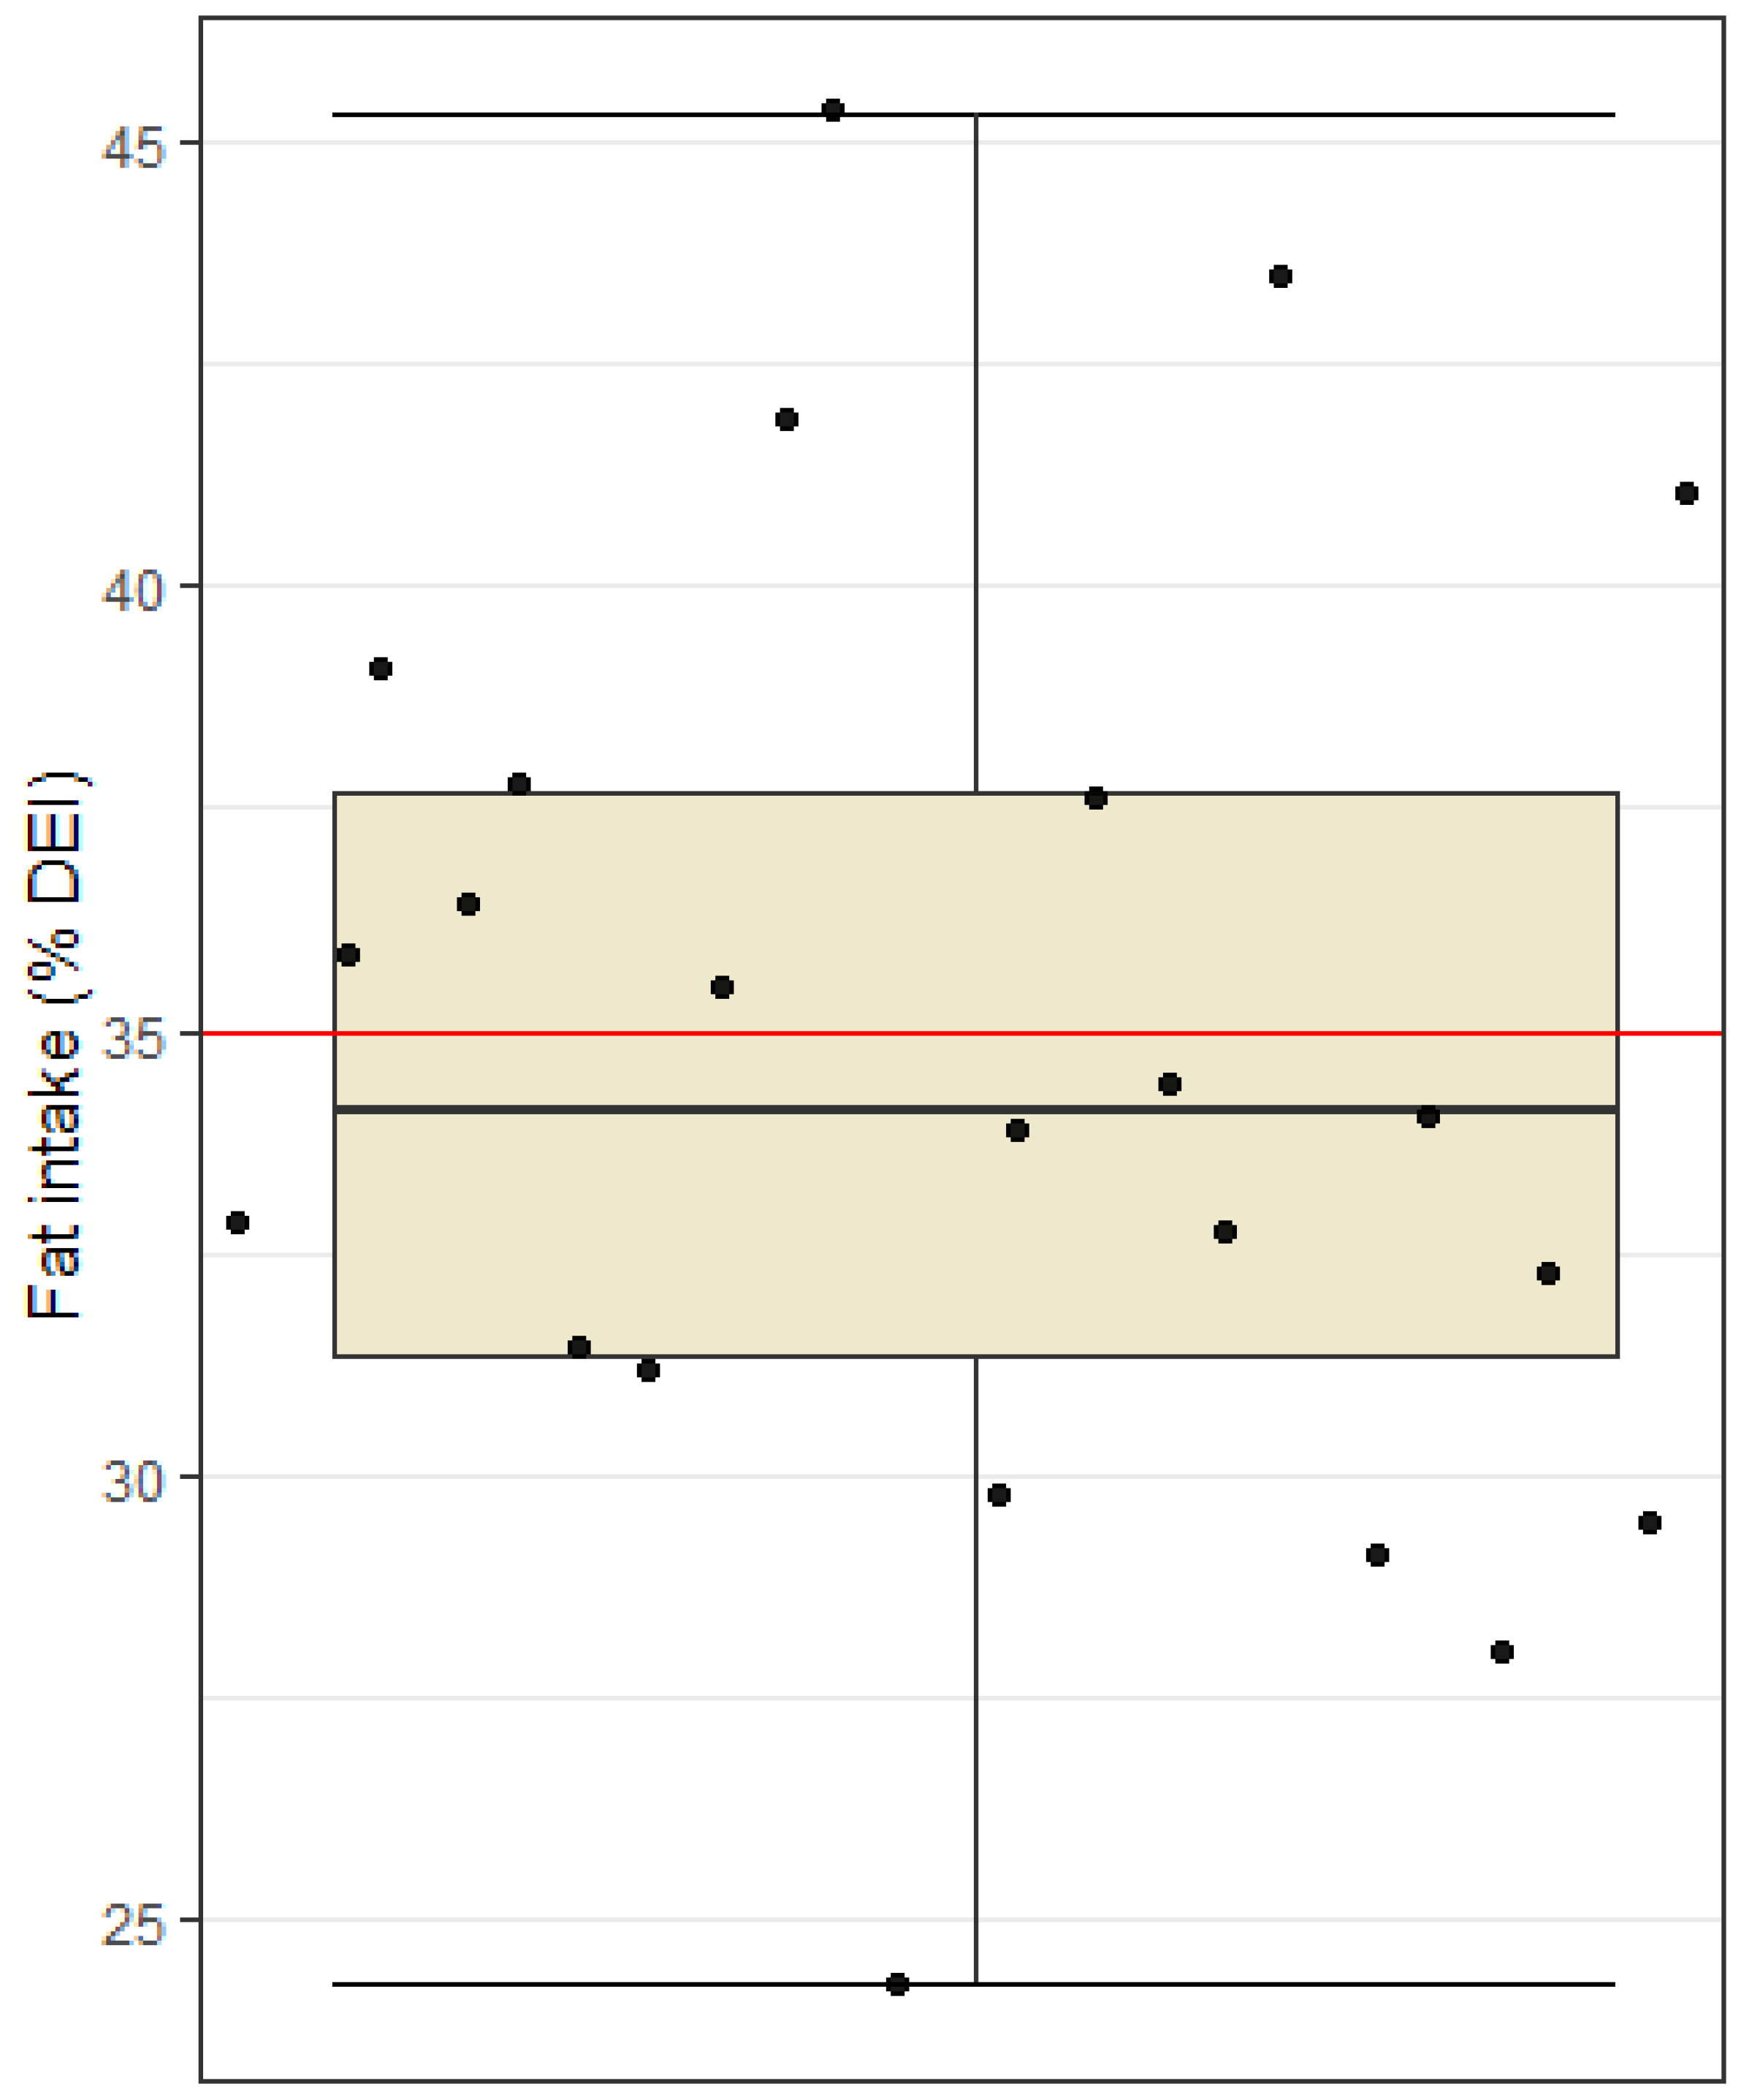
3.2.2. Macronutrient Intake
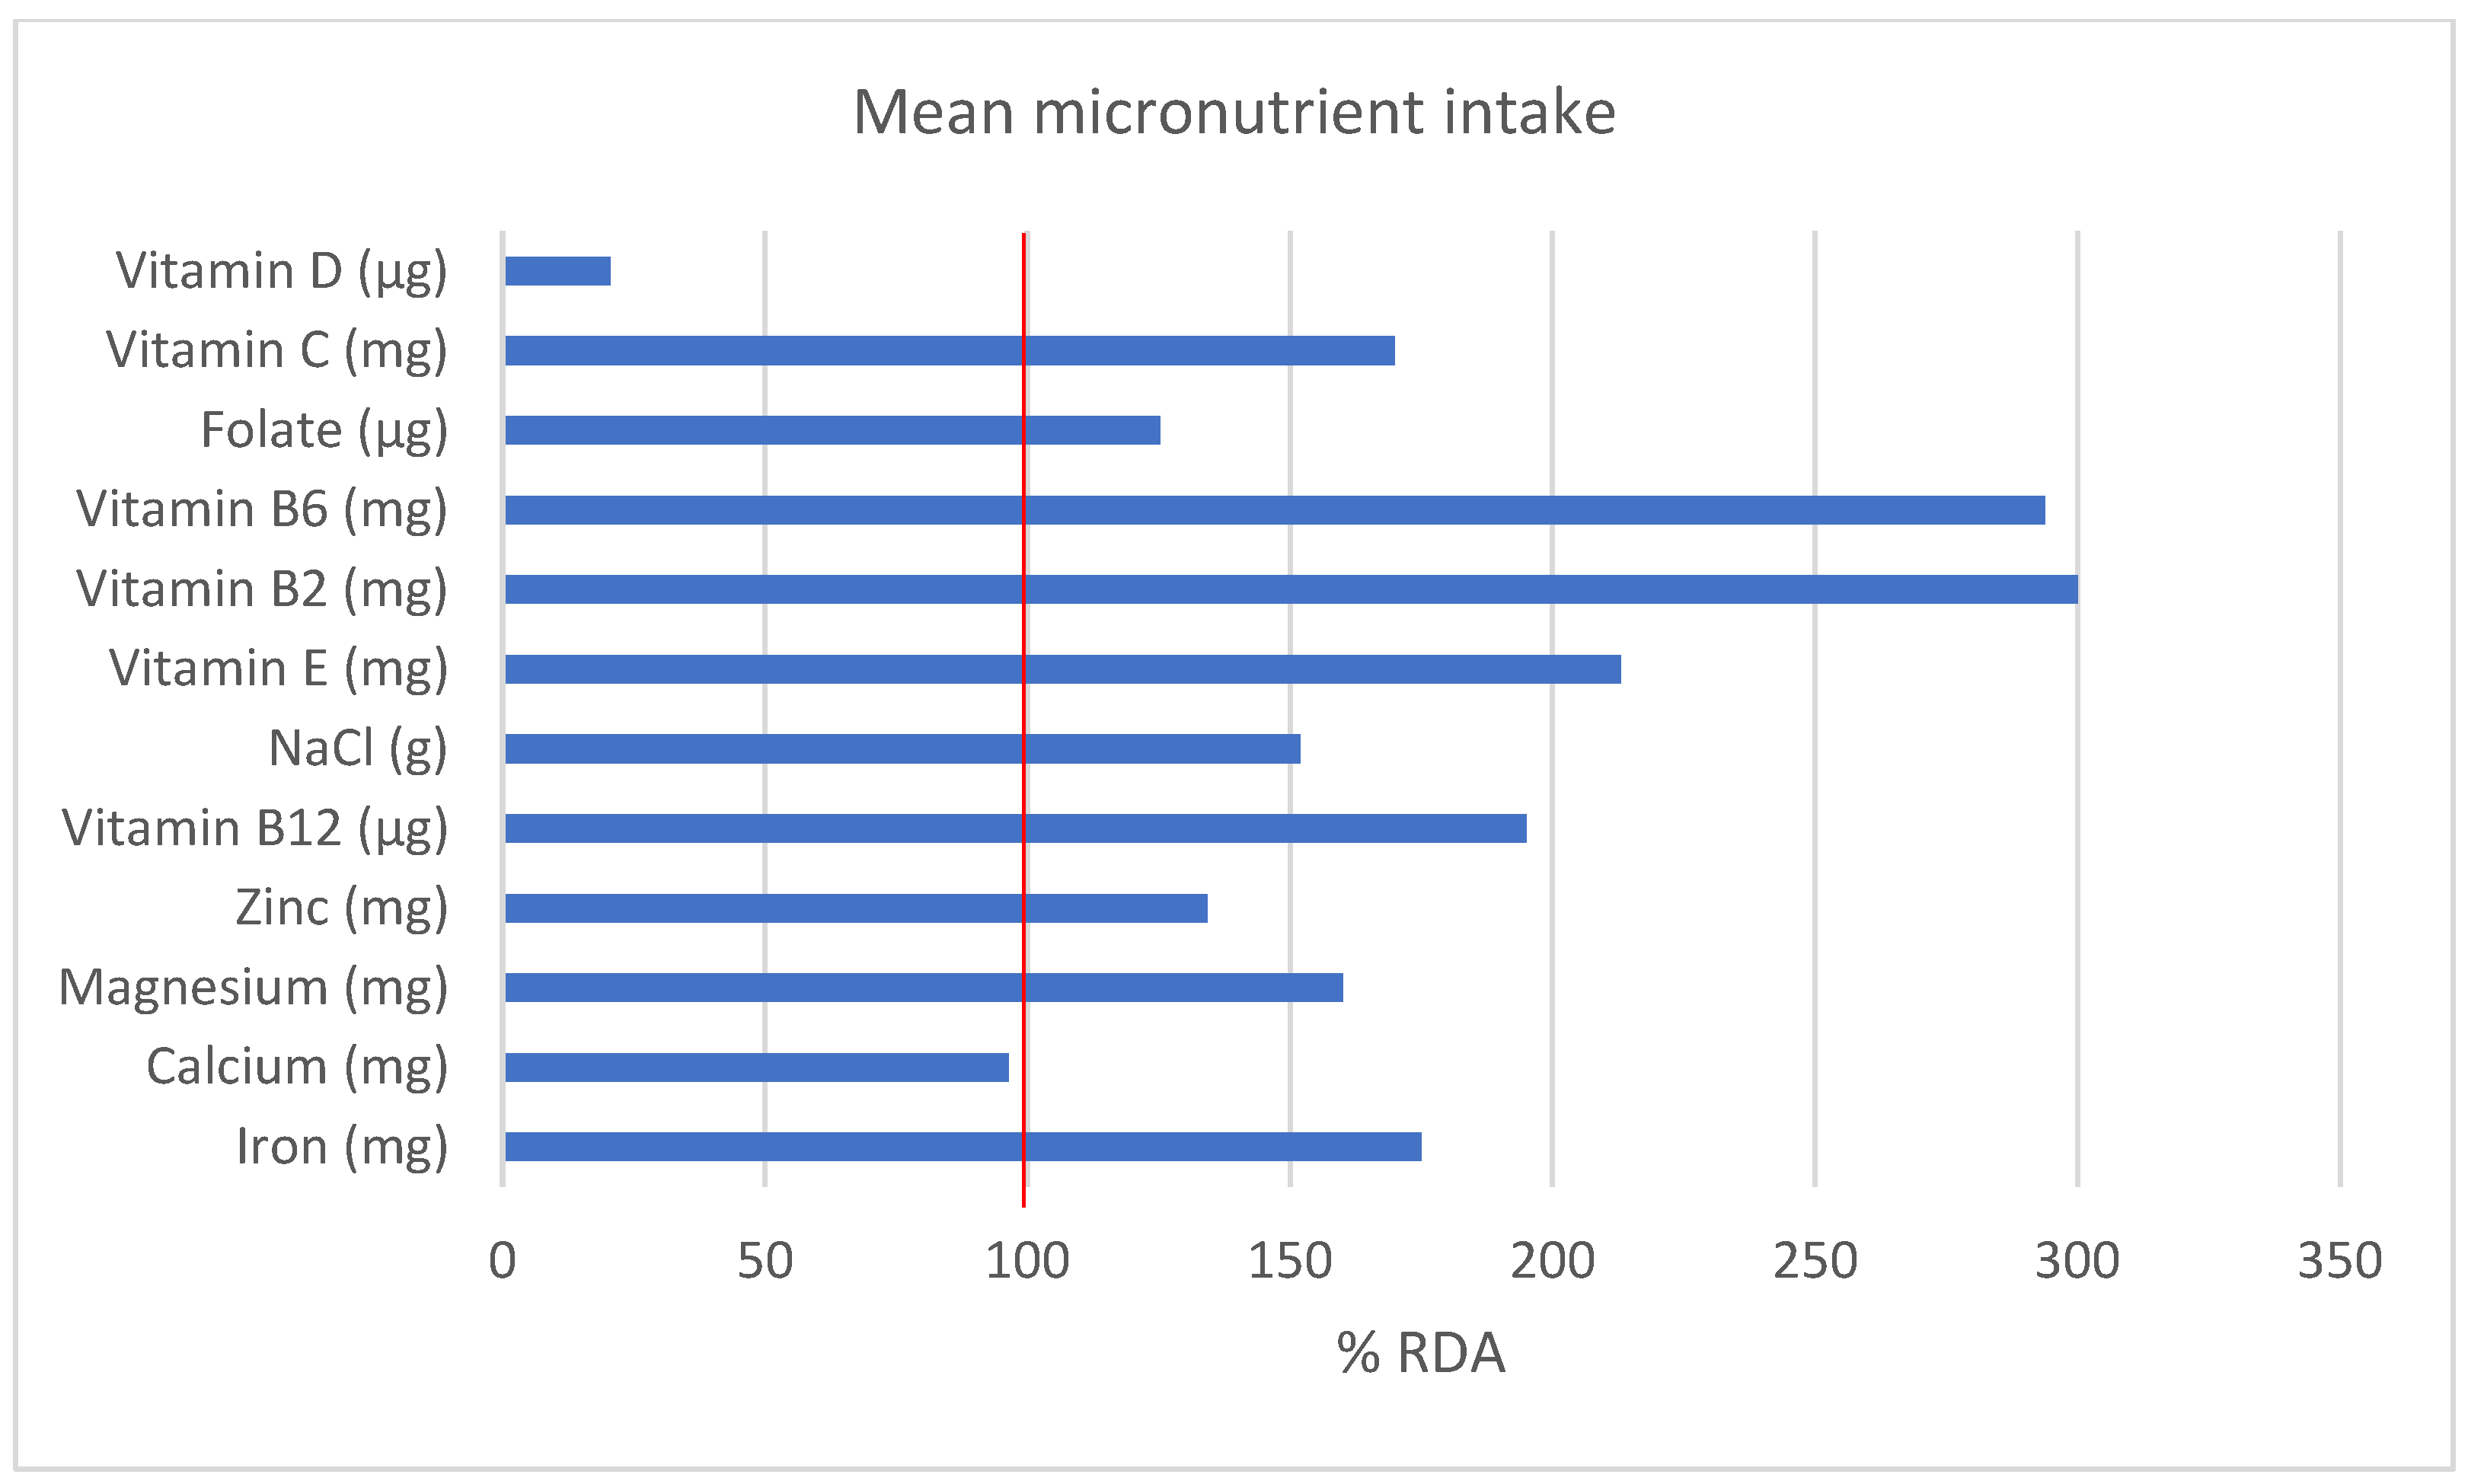
3.2.3. Micronutrient Intake and Supplementation
3.3. Comparison of Absolute Values of Dietary Intake and Body Composition
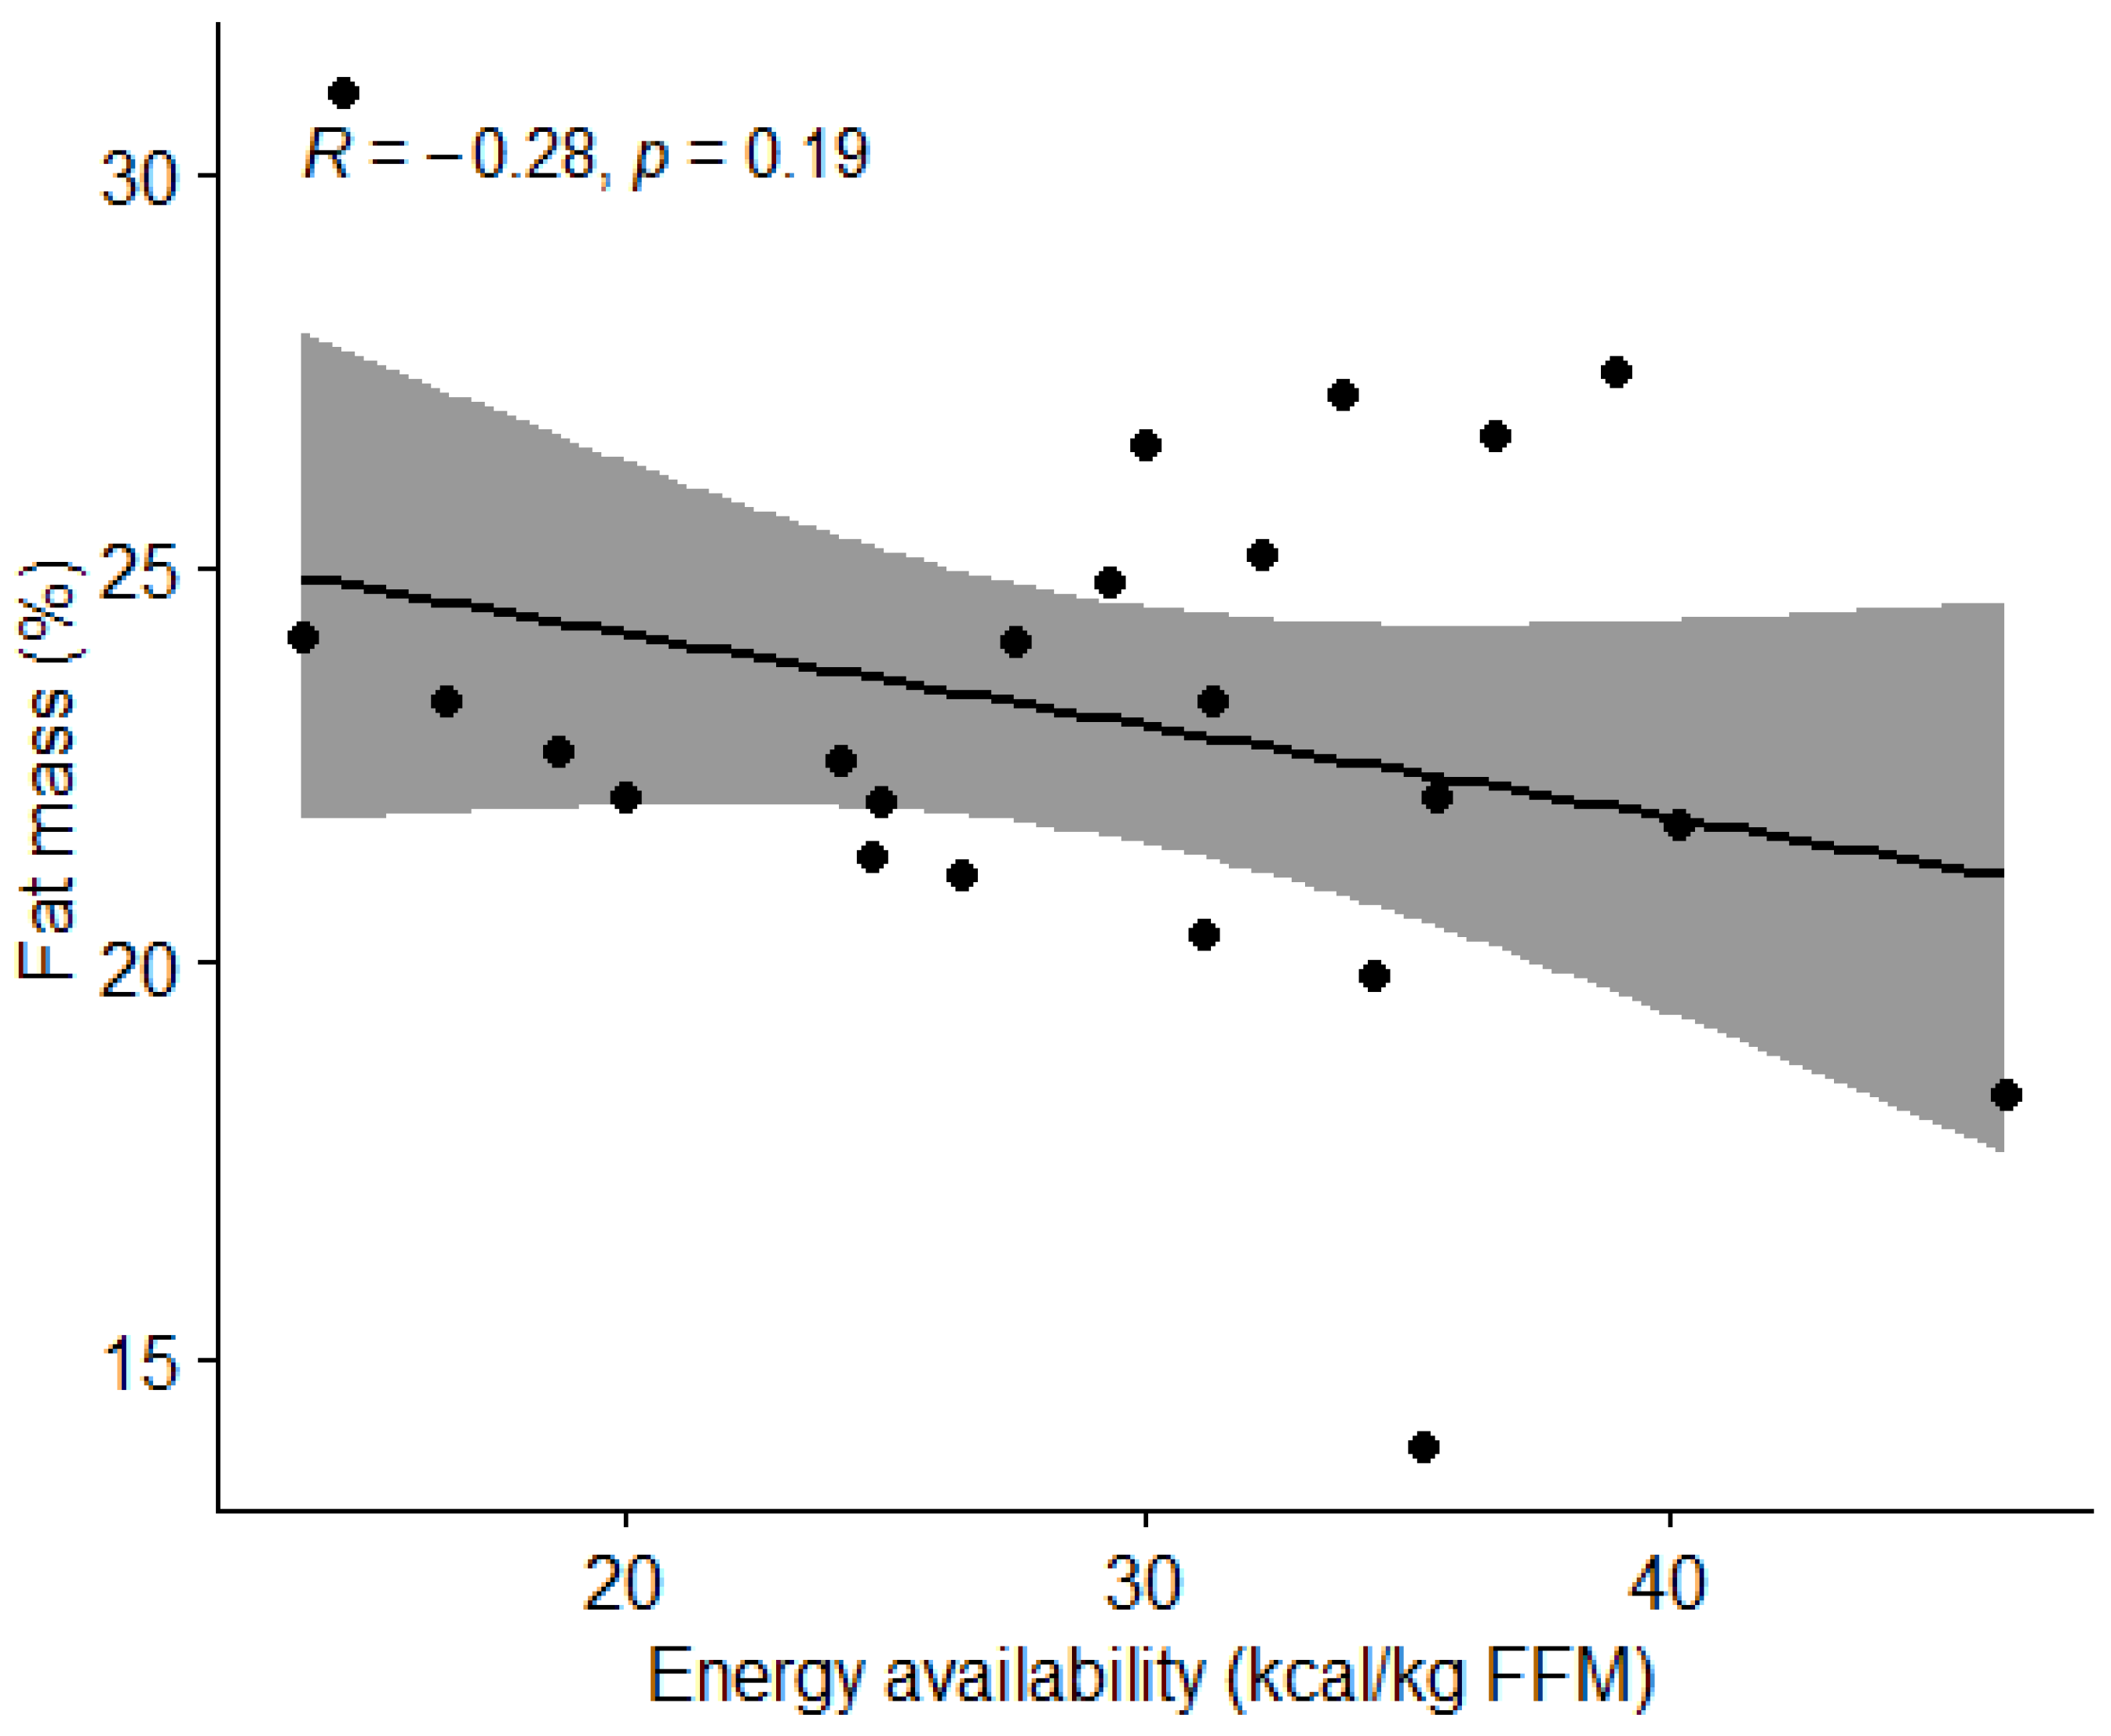
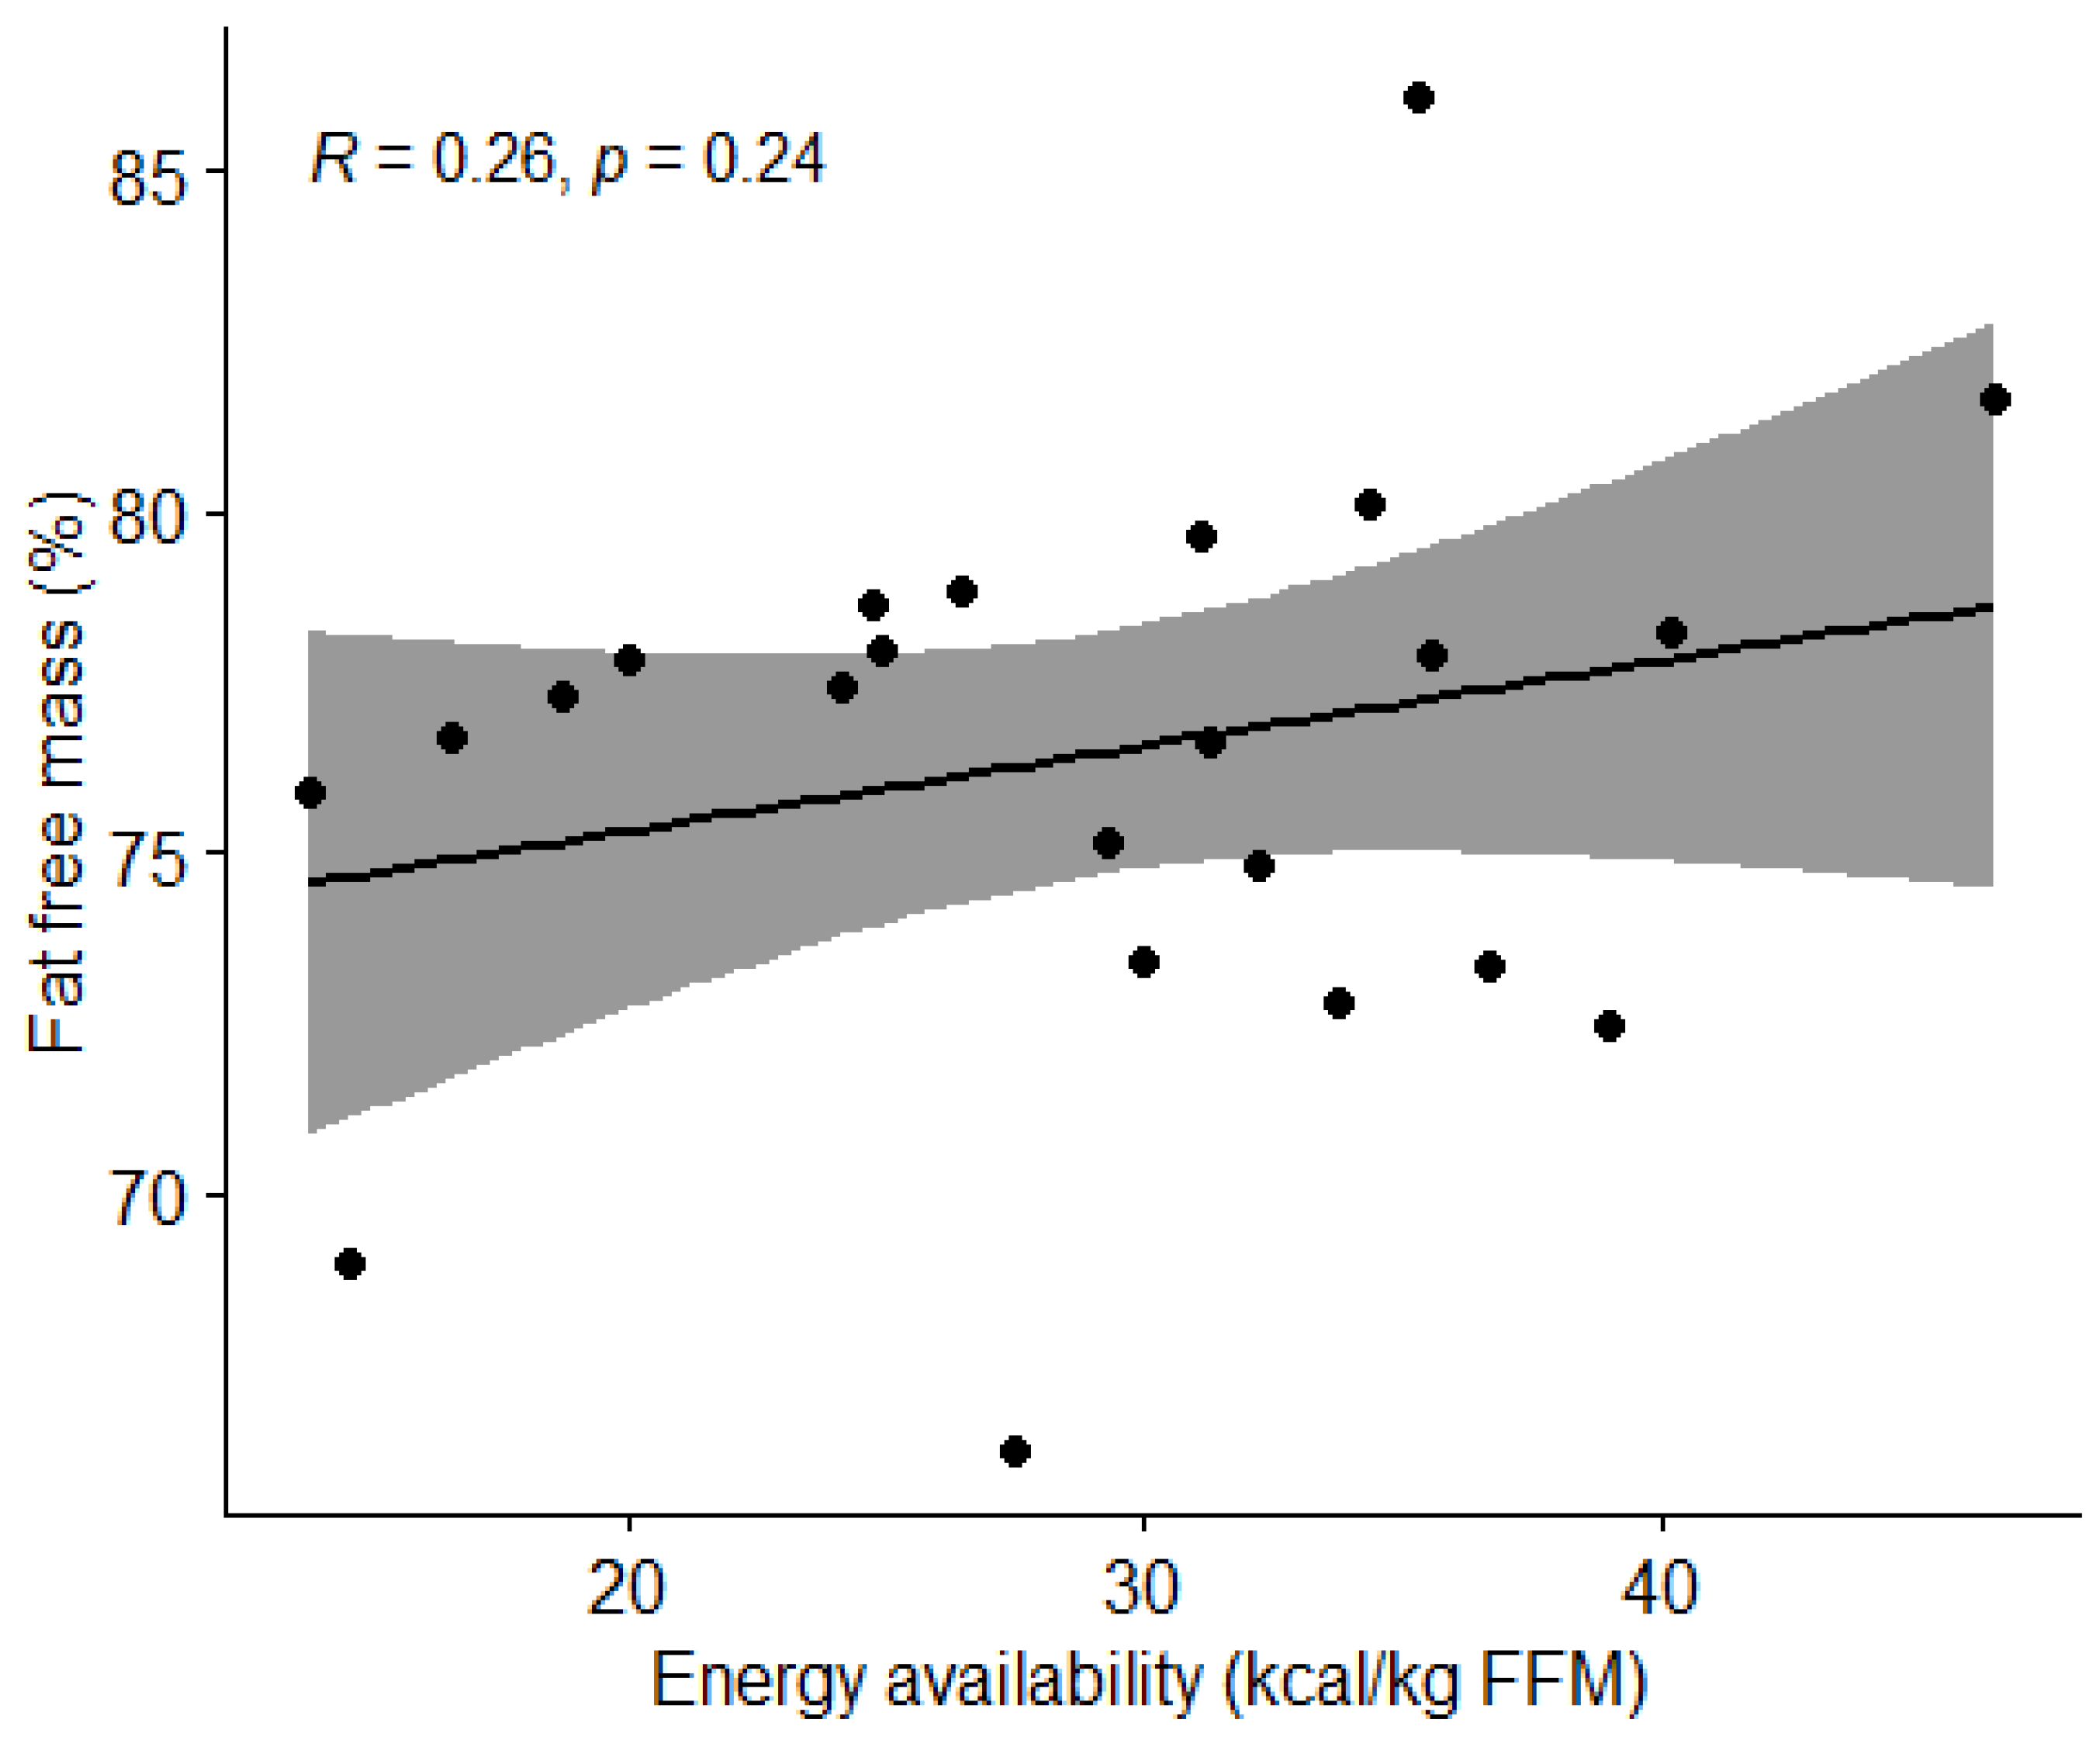
3.3.1. Energy Availability and Body Composition
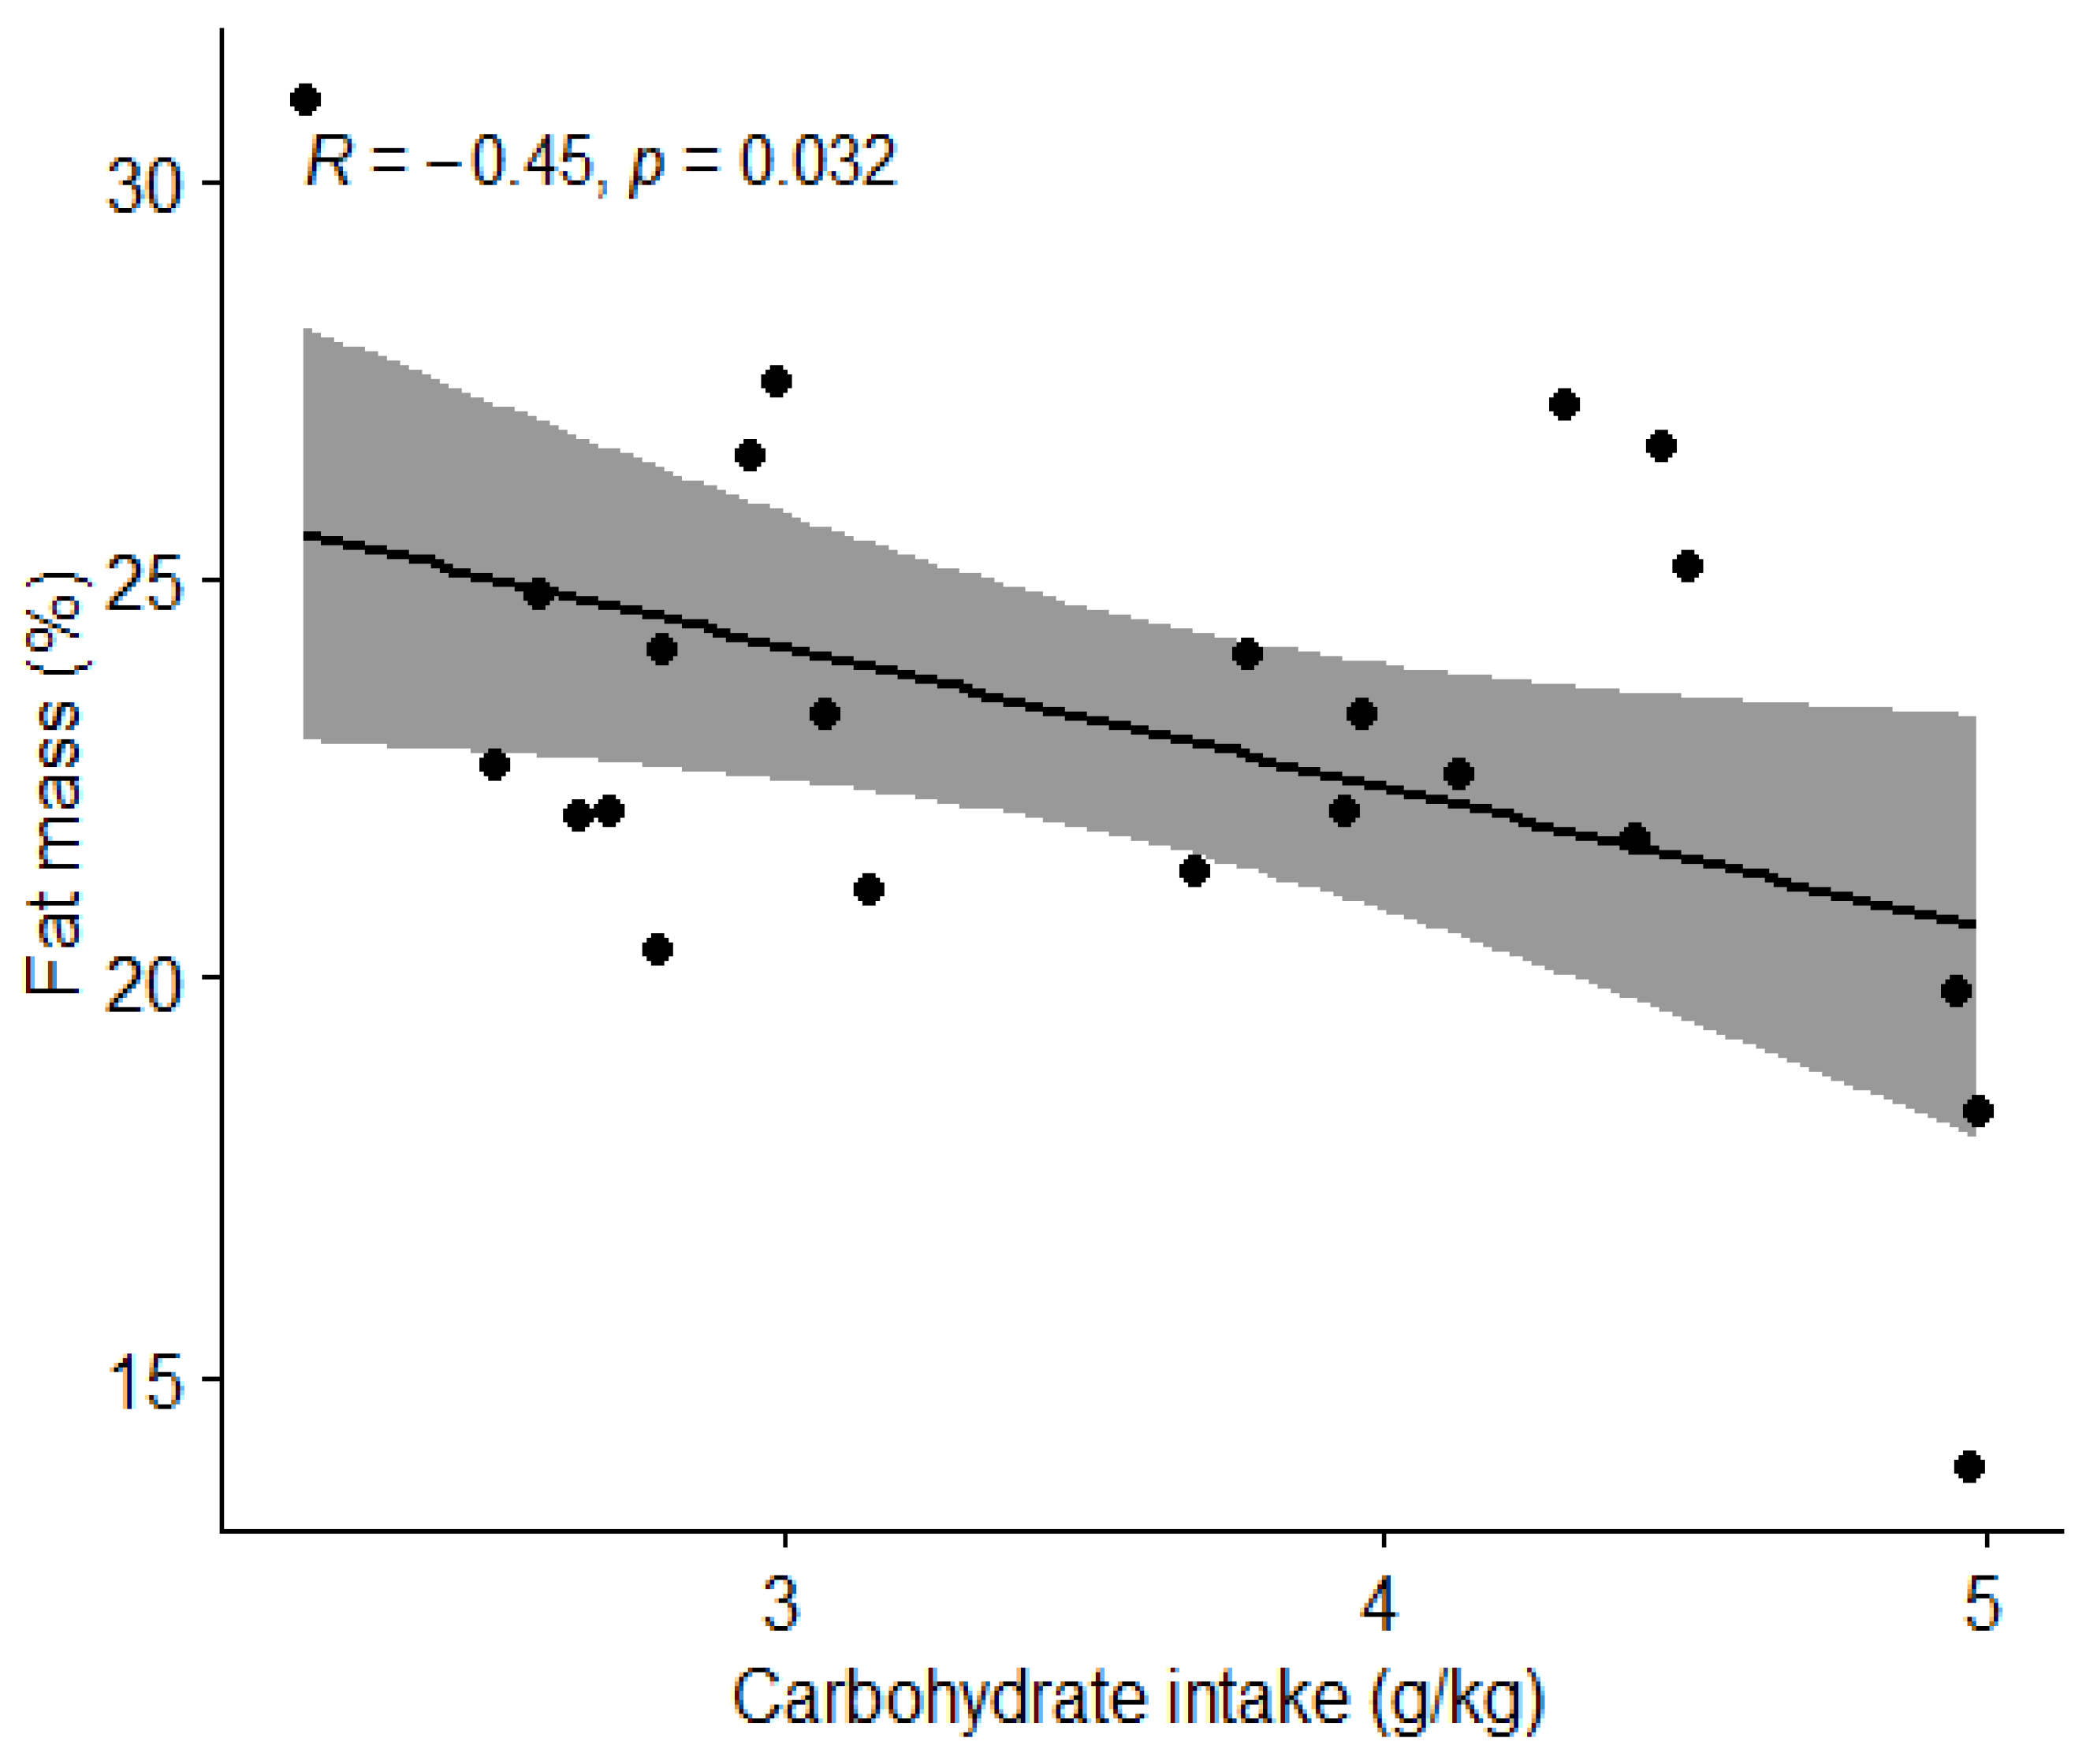
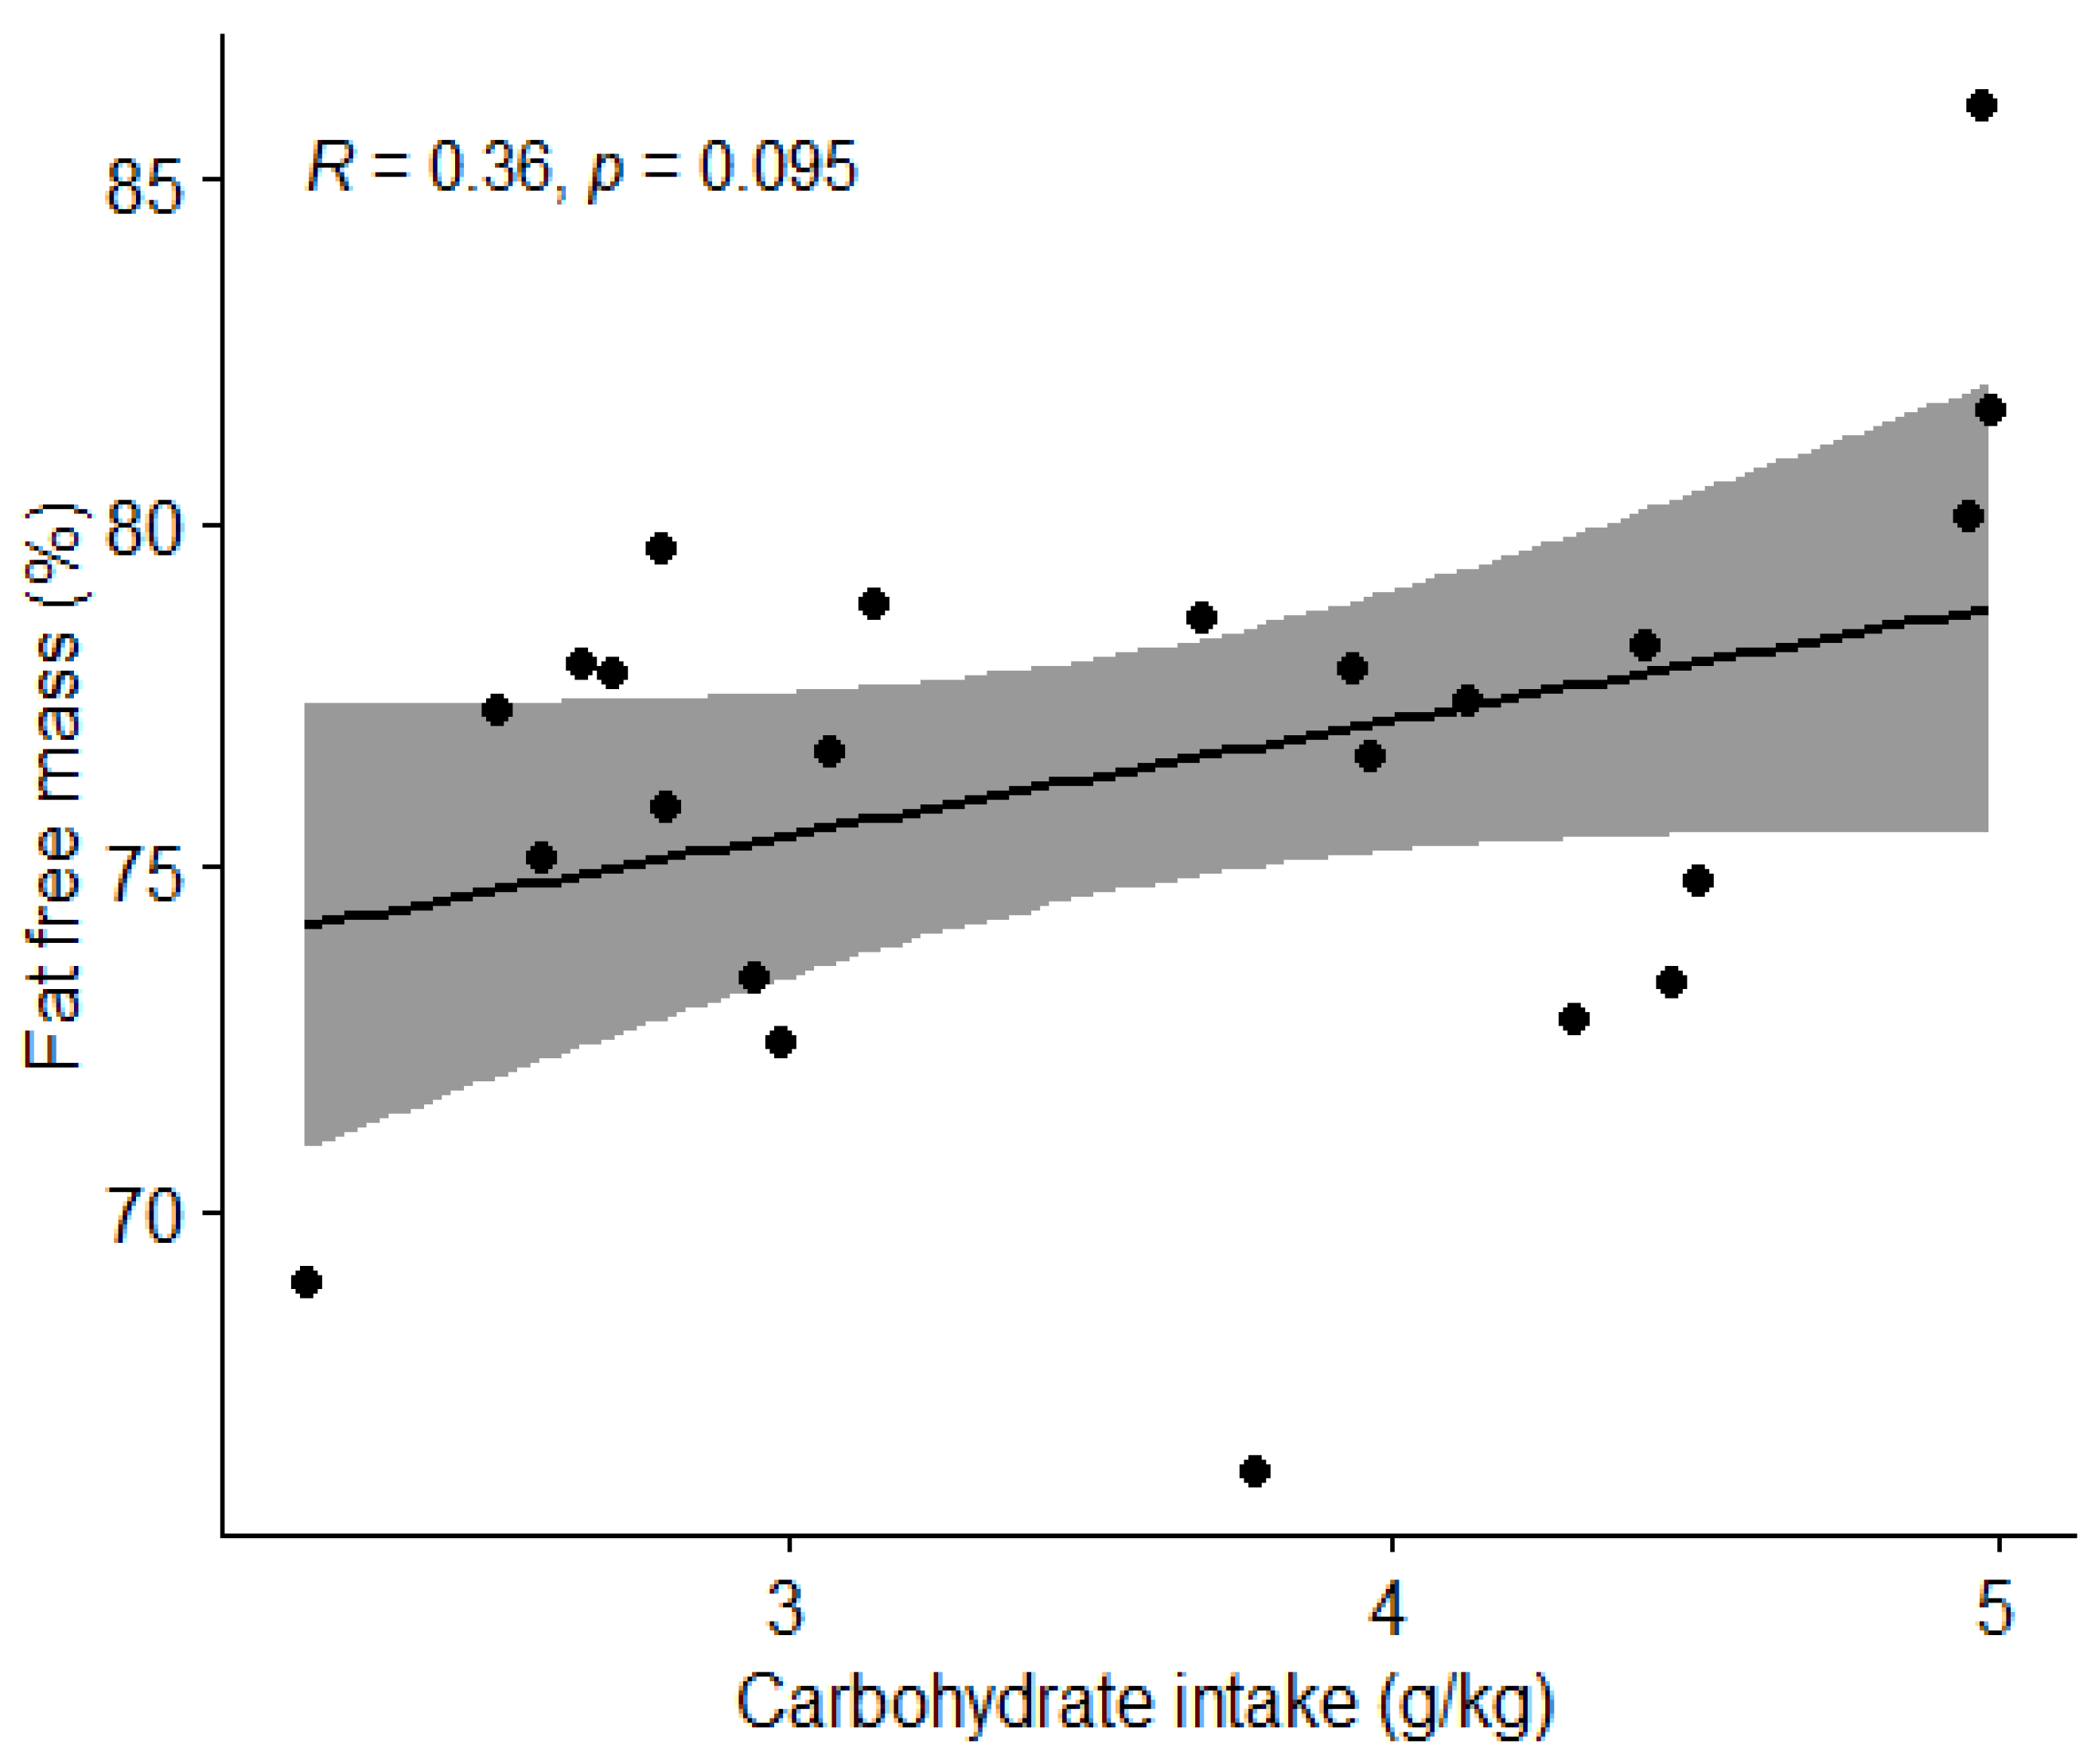
3.3.2. Carbohydrate Intake and Body Composition
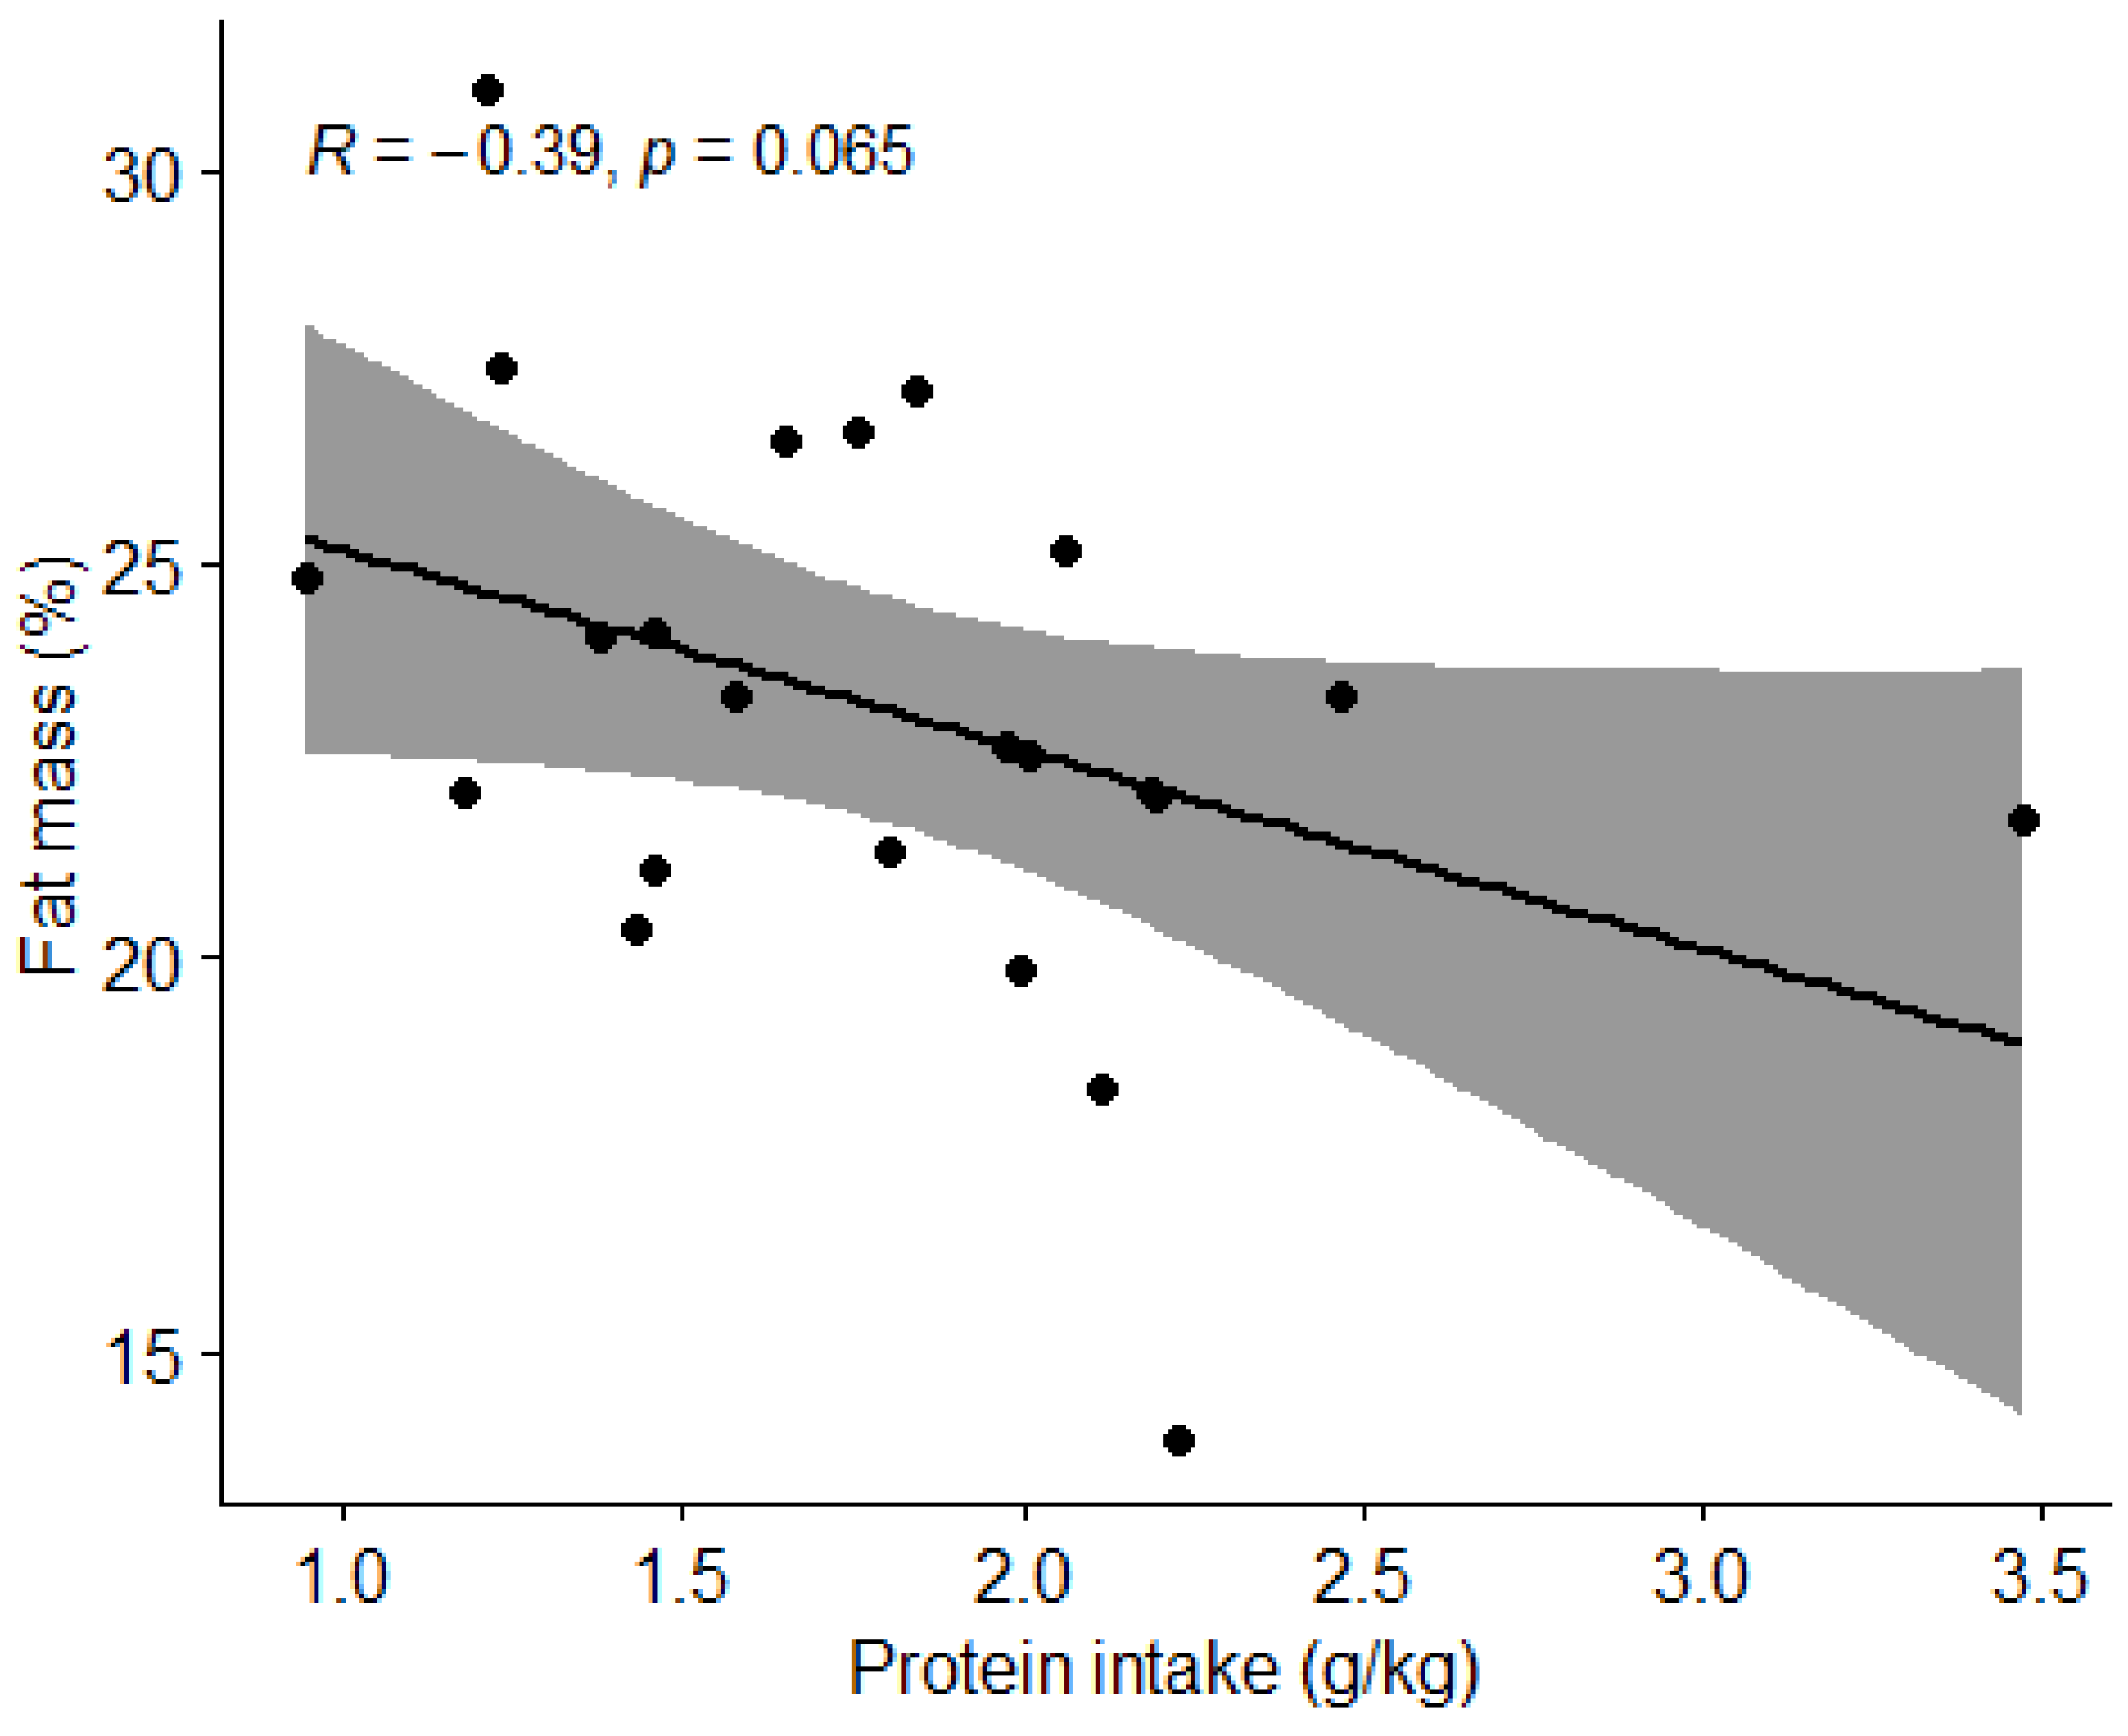
3.3.3. Protein Intake and Body Composition
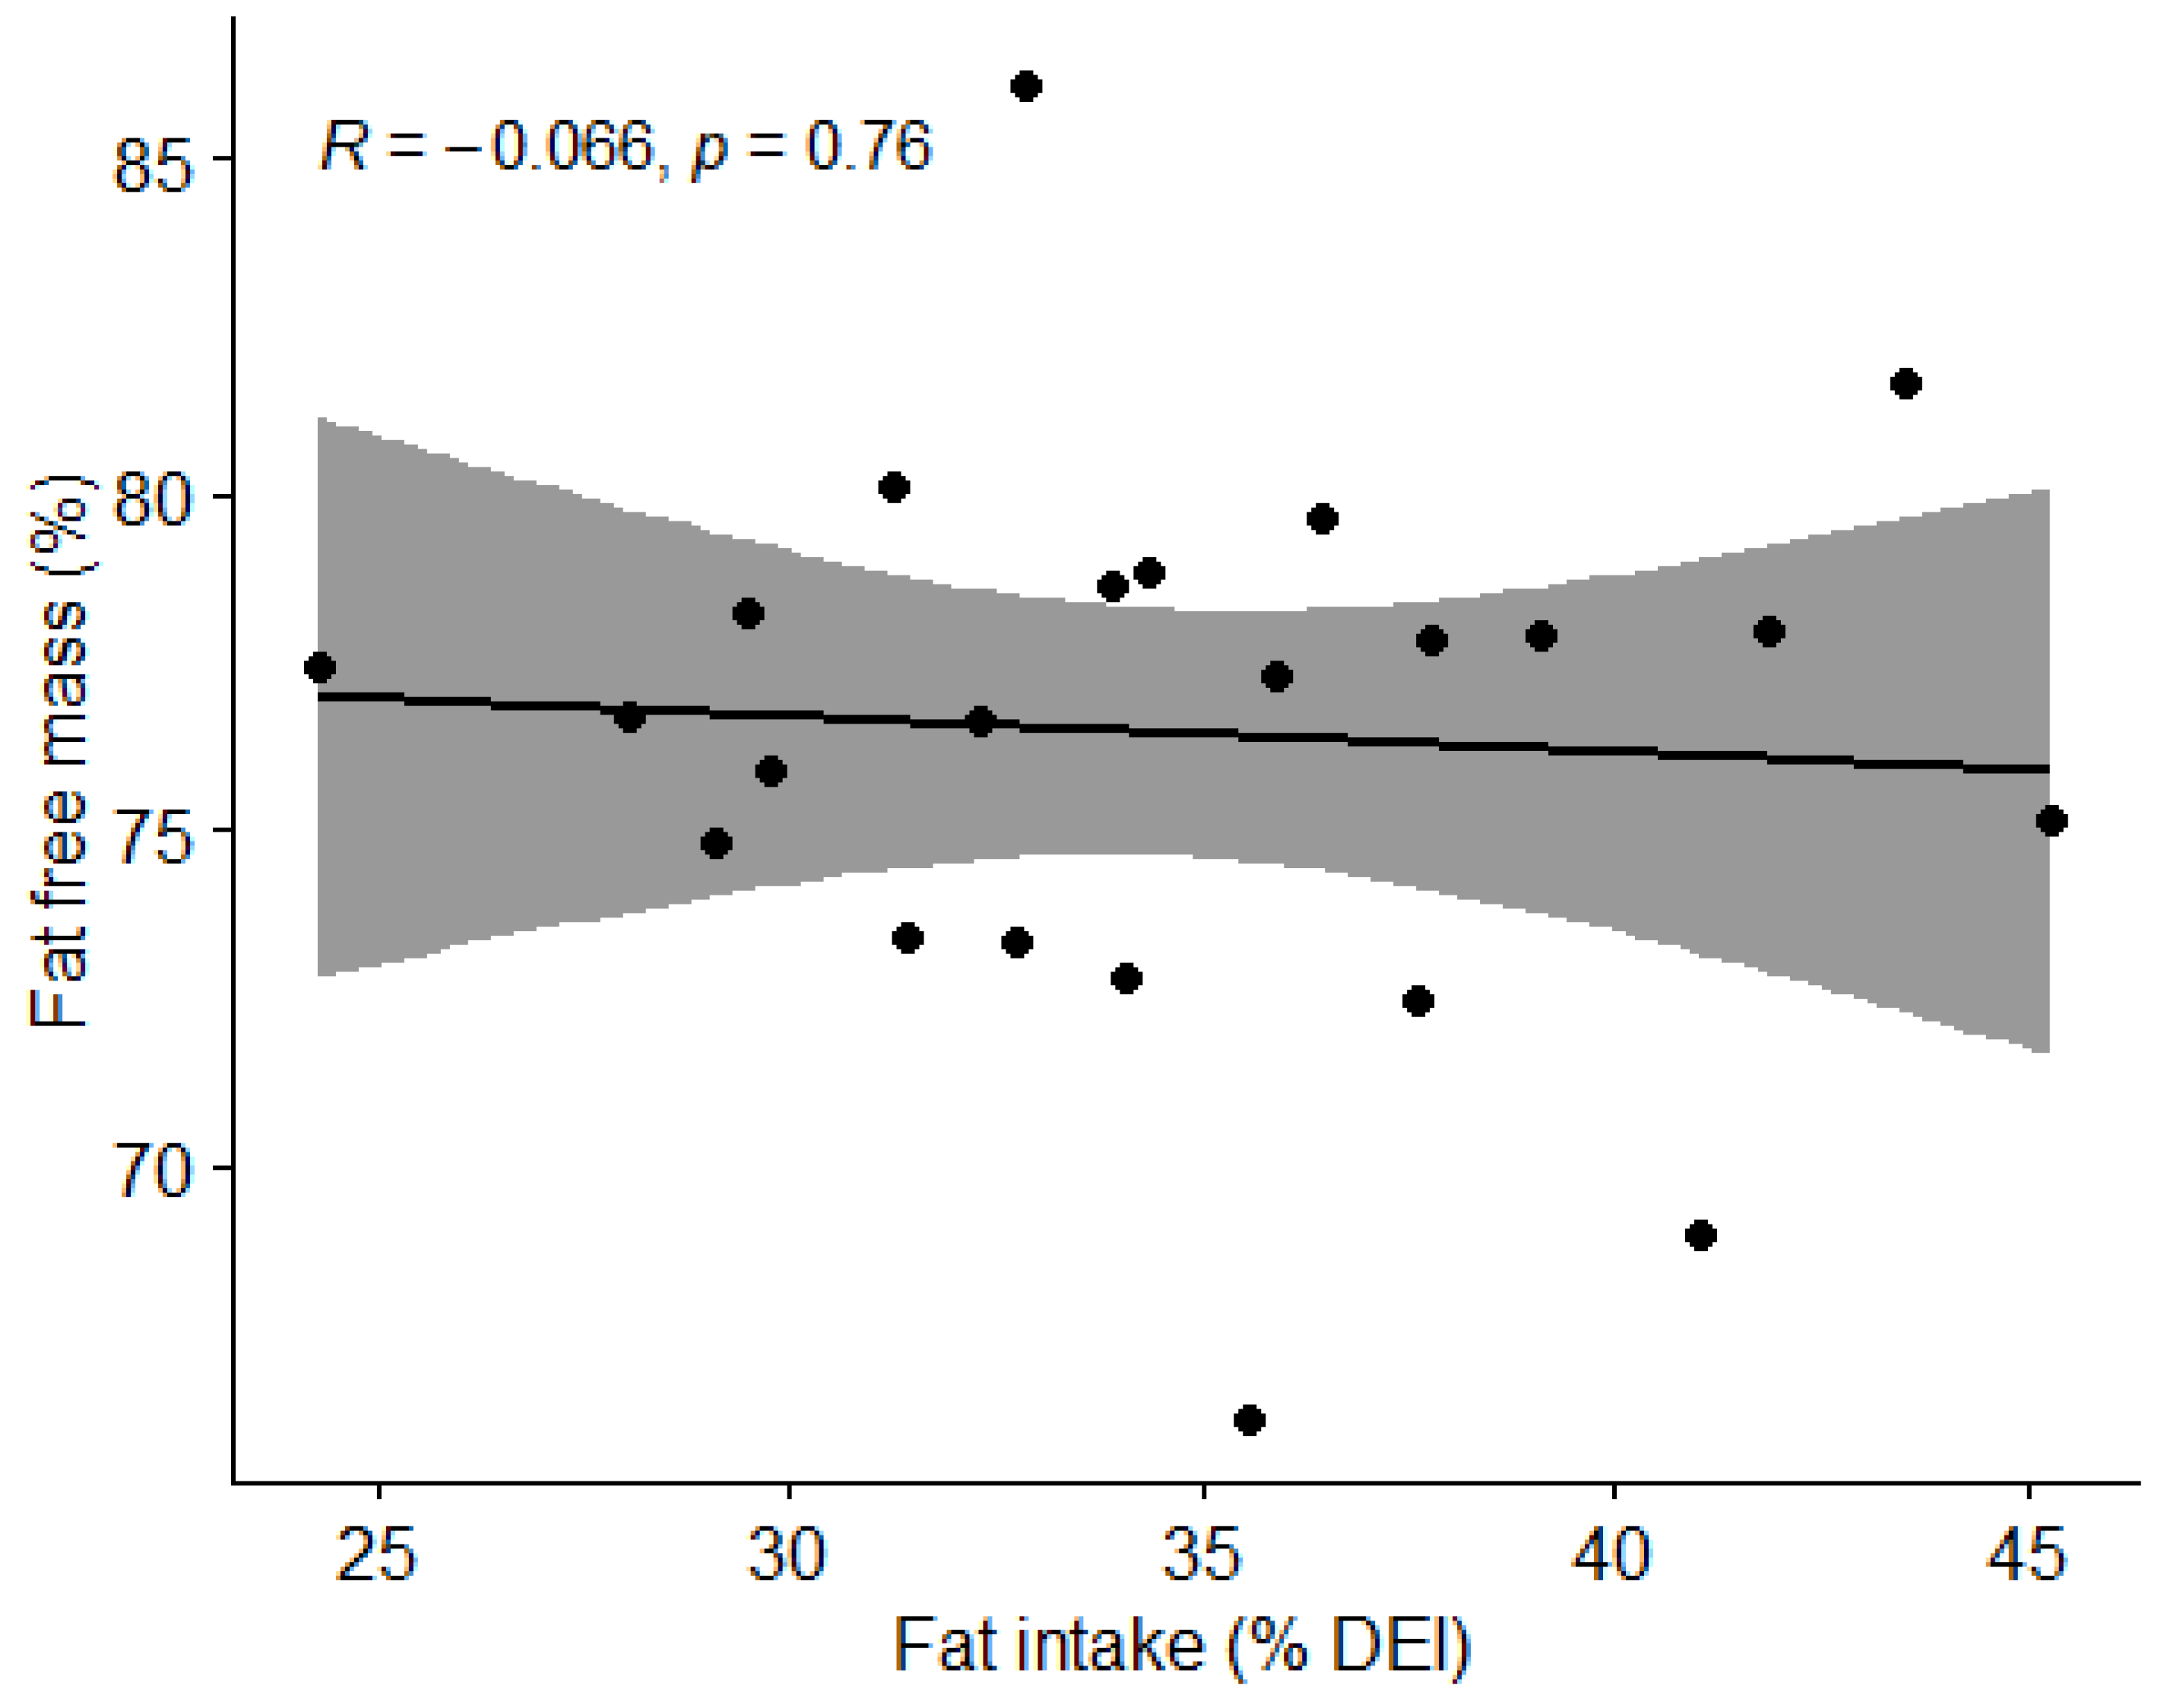
3.3.4. Fat Intake and Body Composition
3.4. Comparison of Absolute Values of Food Intake and Physical Performance
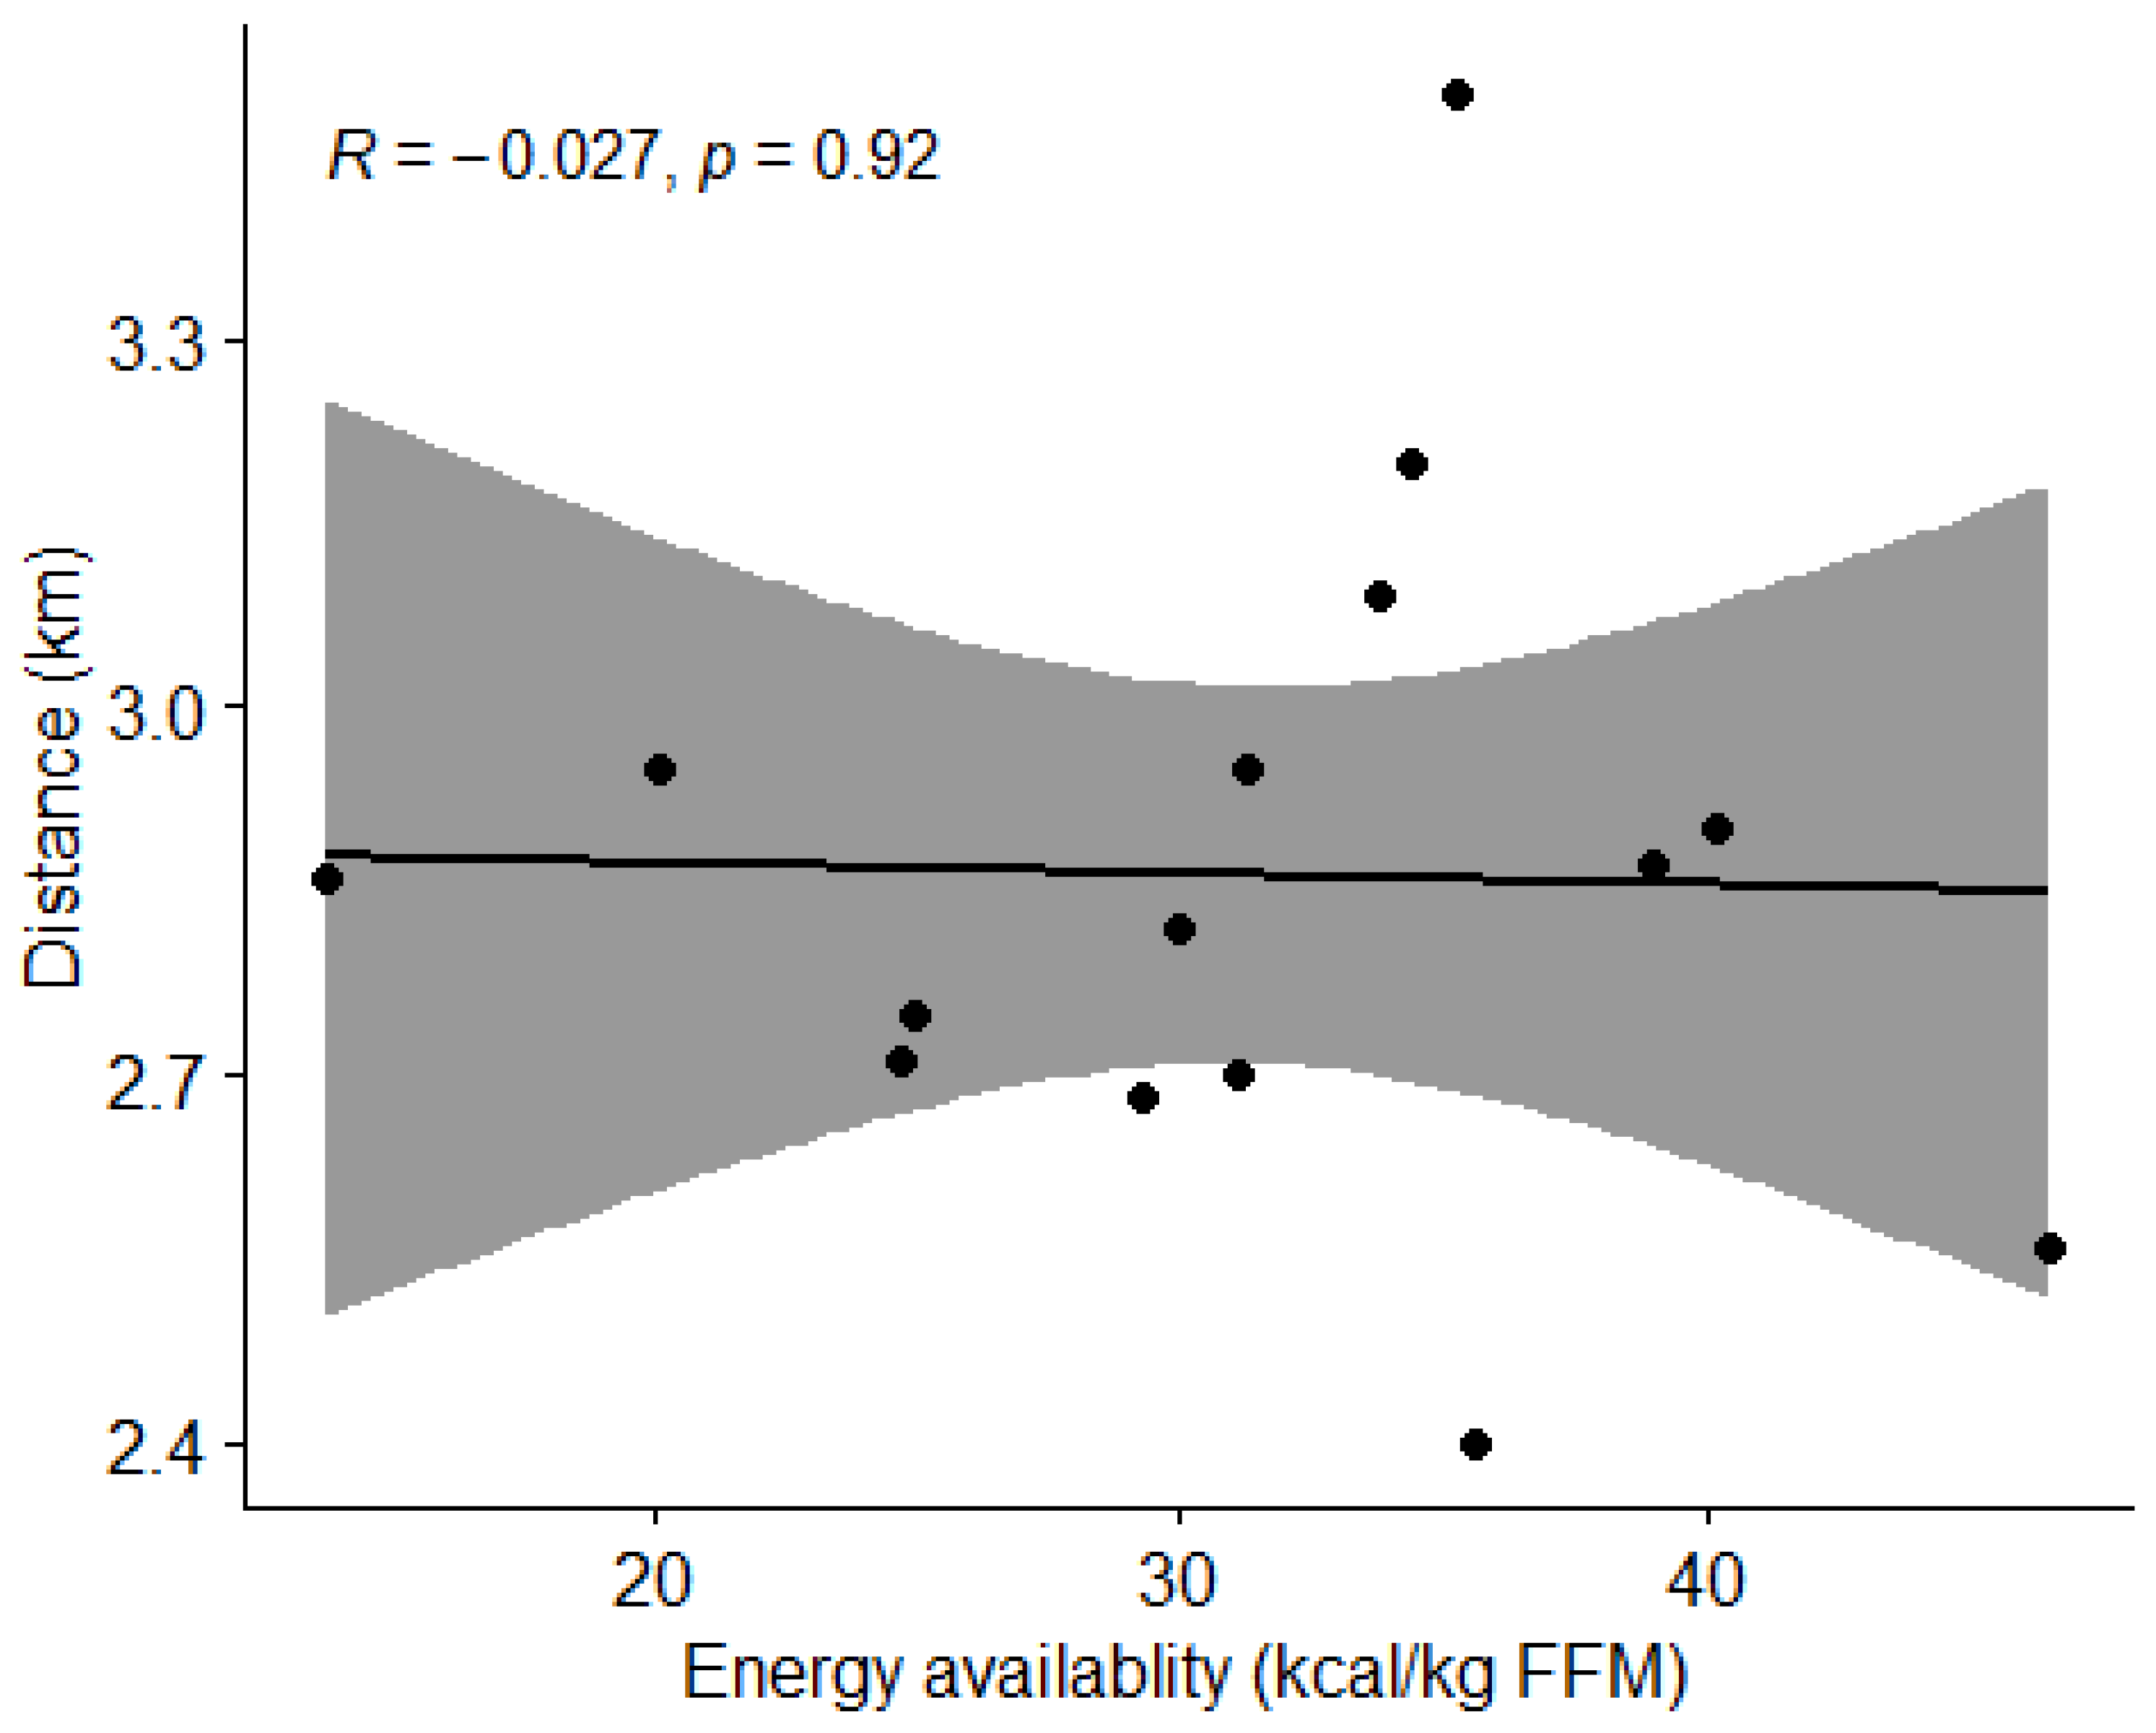
3.4.1. Energy Availability and Physical Performance
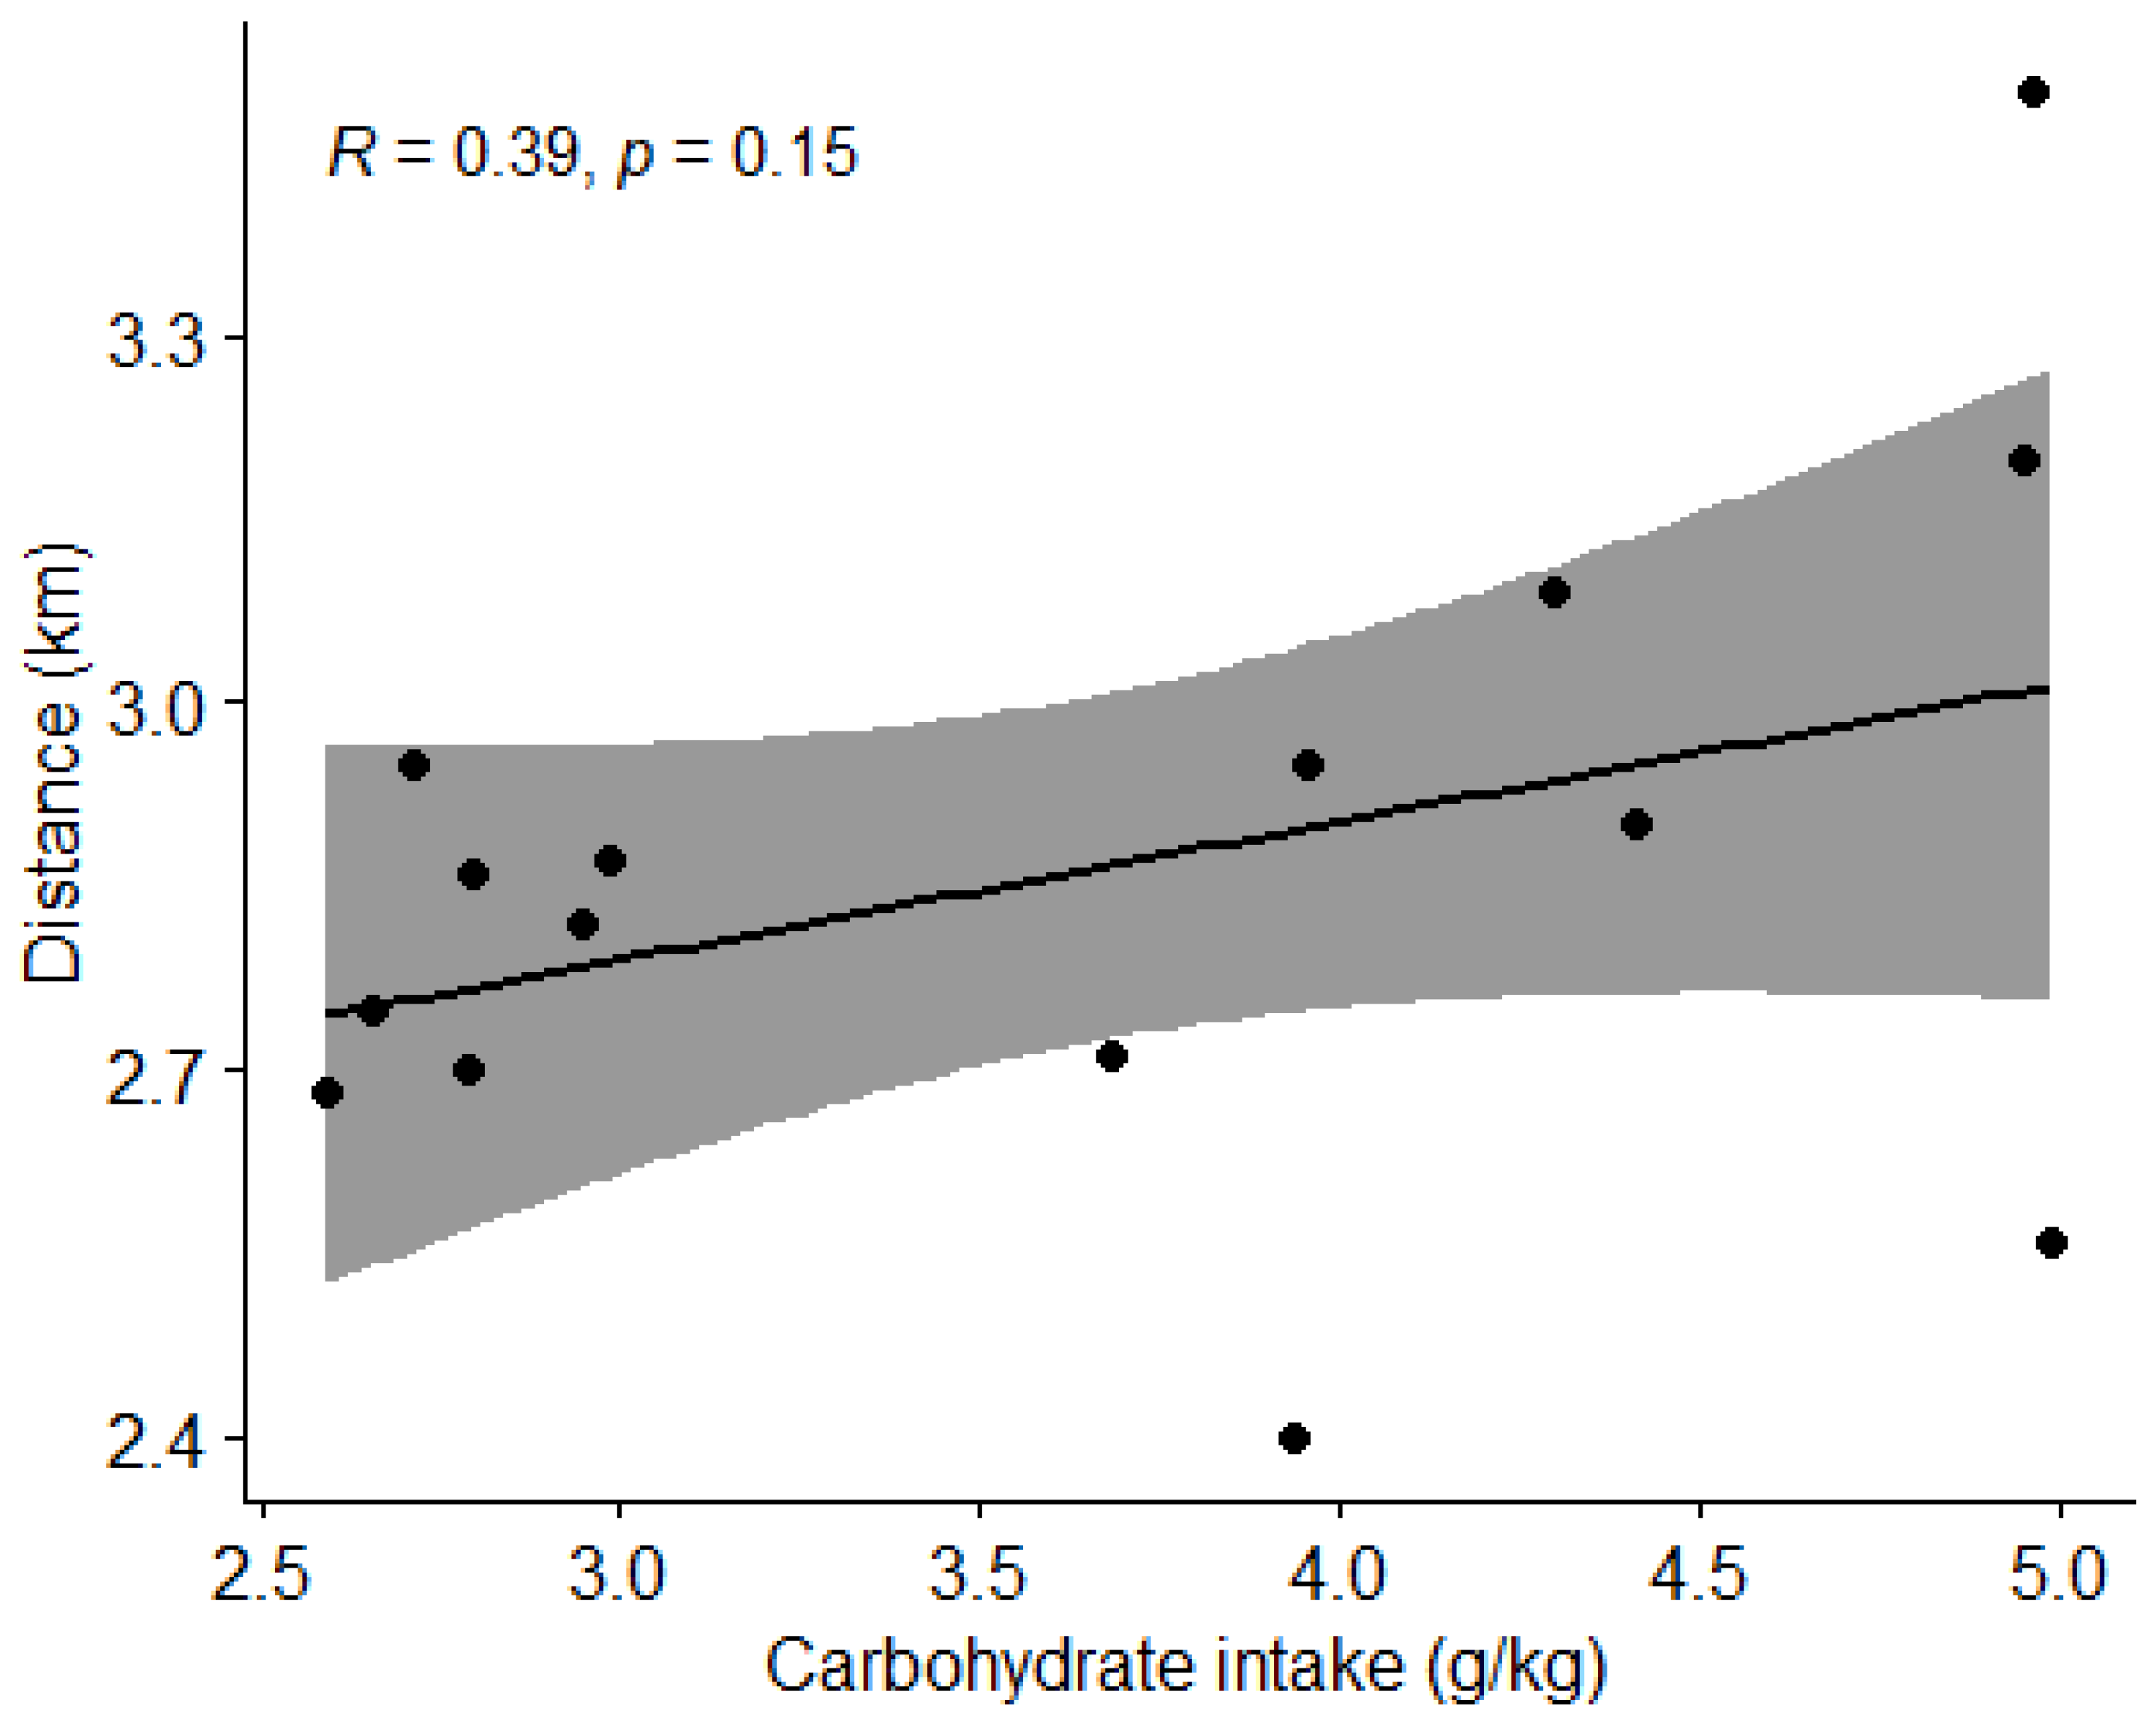
3.4.2. Carbohydrate Intake and Physical Performance
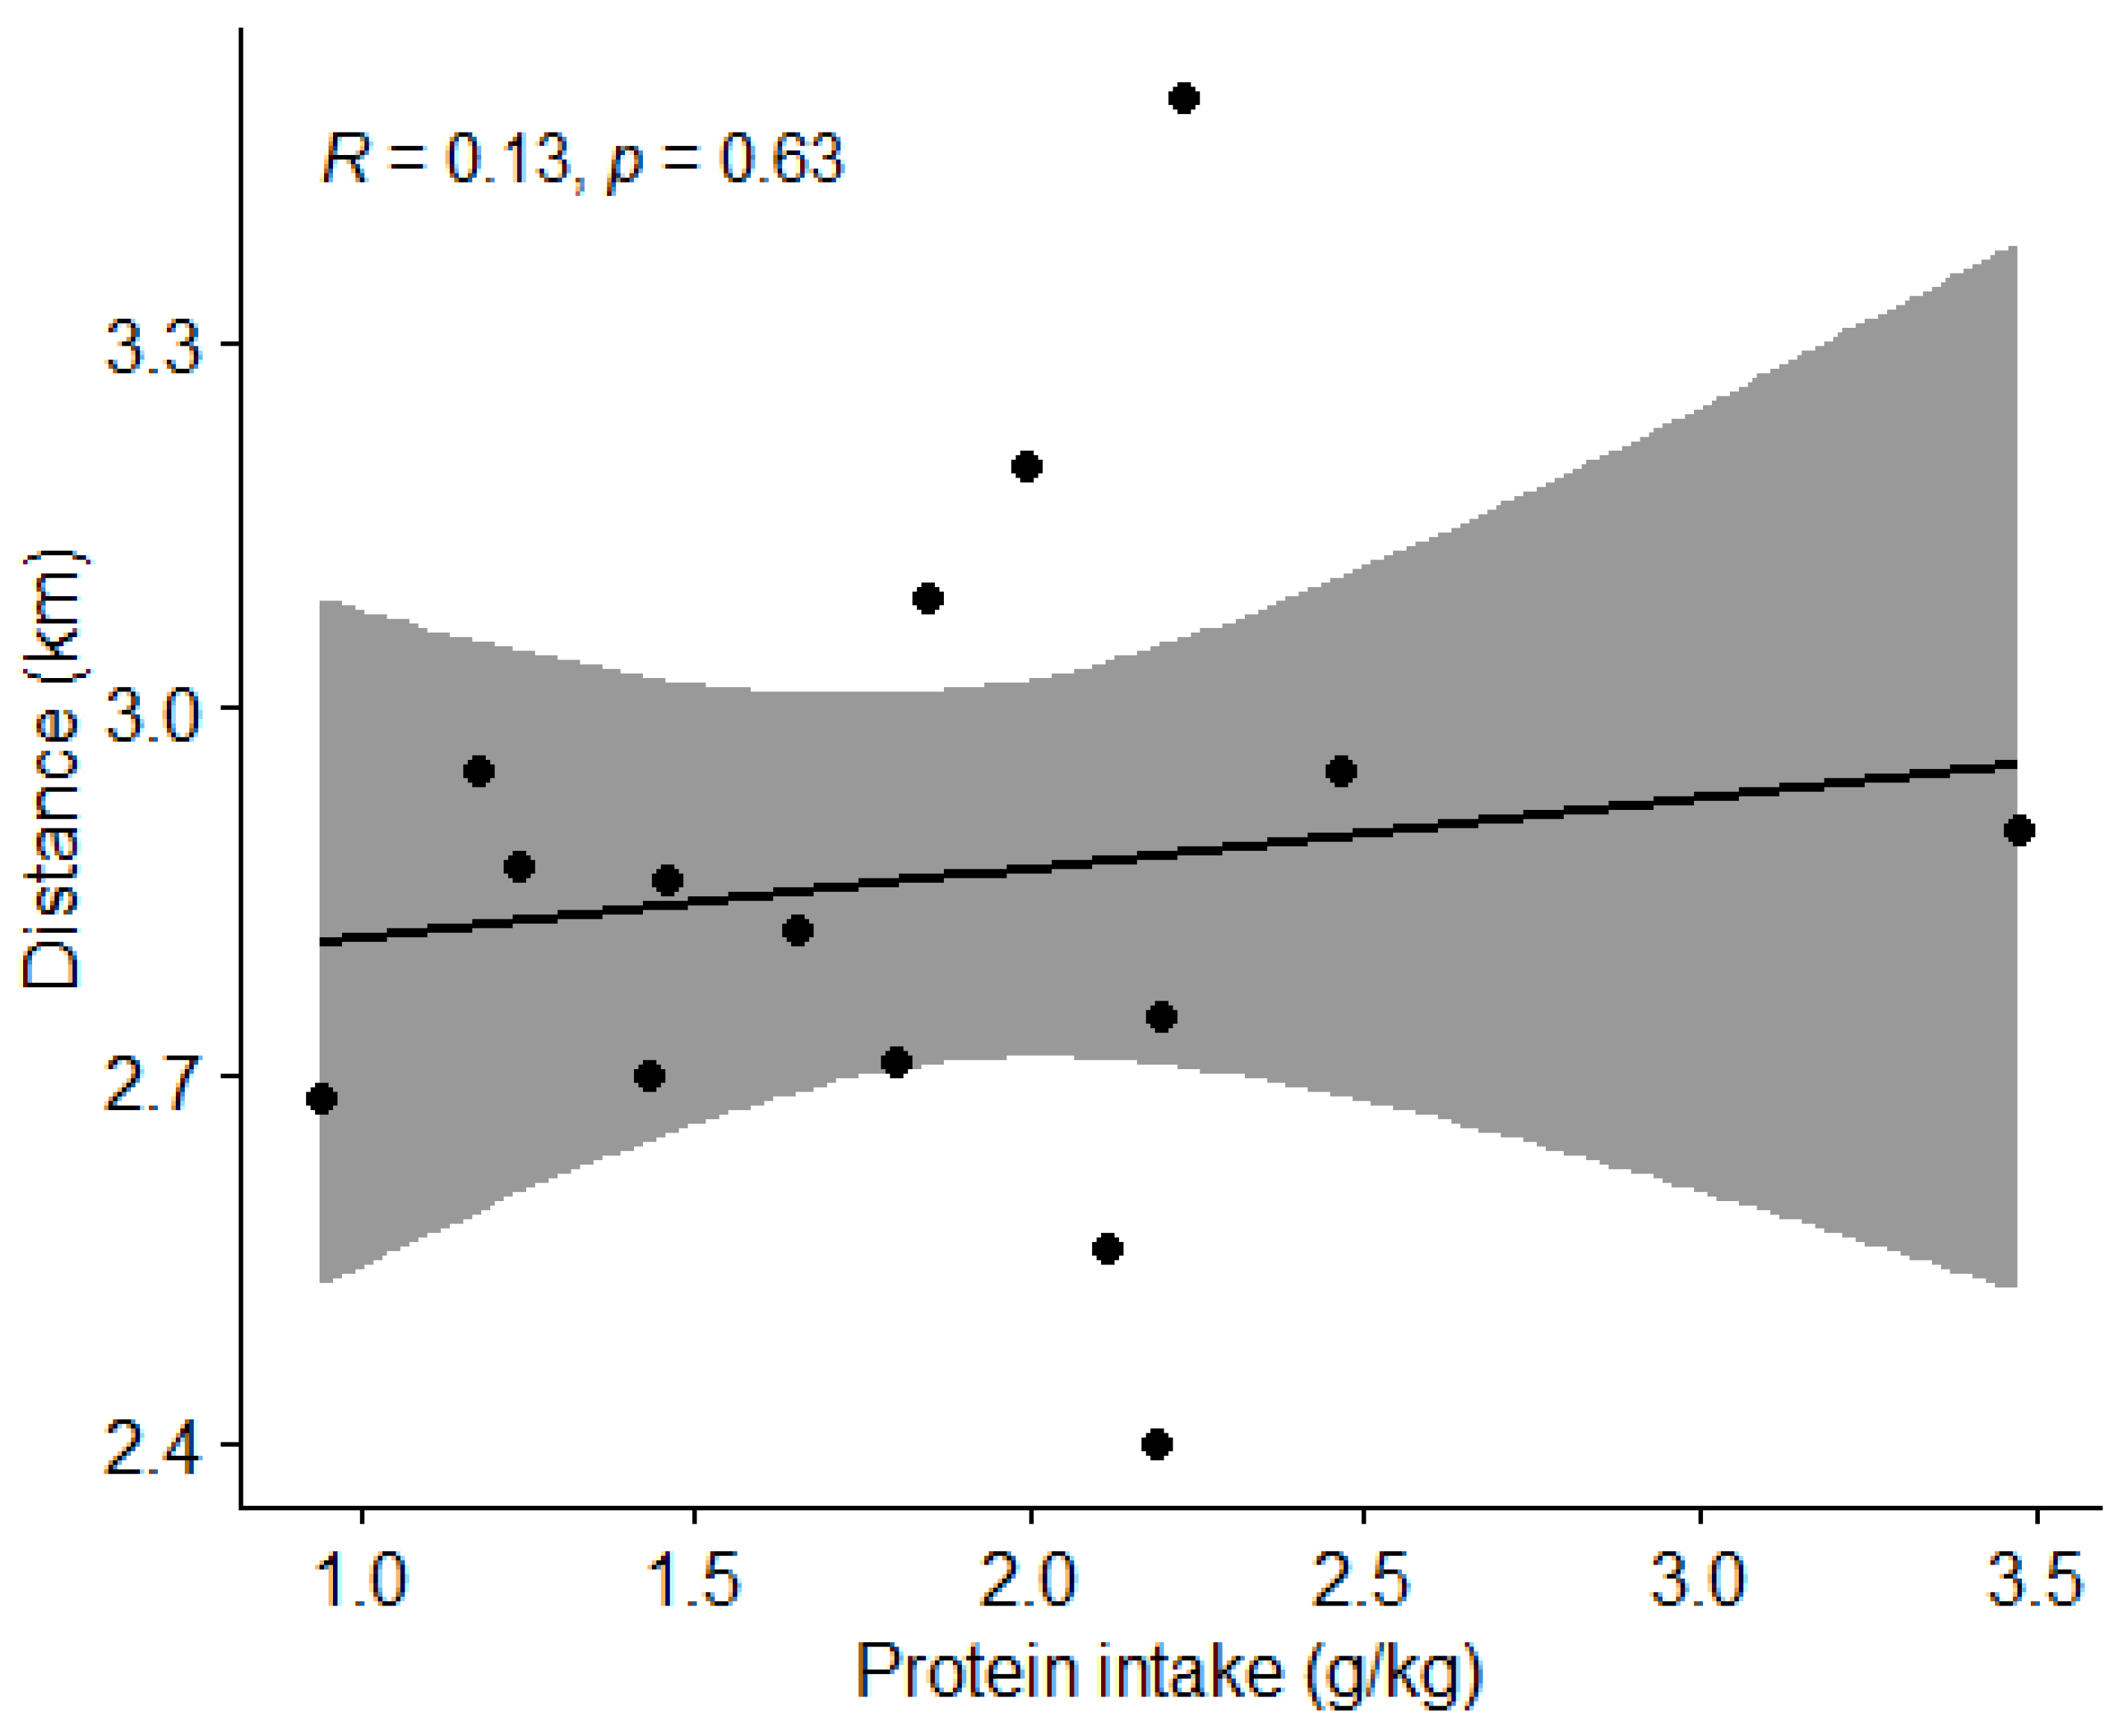
3.4.3. Protein Intake and Physical Performance
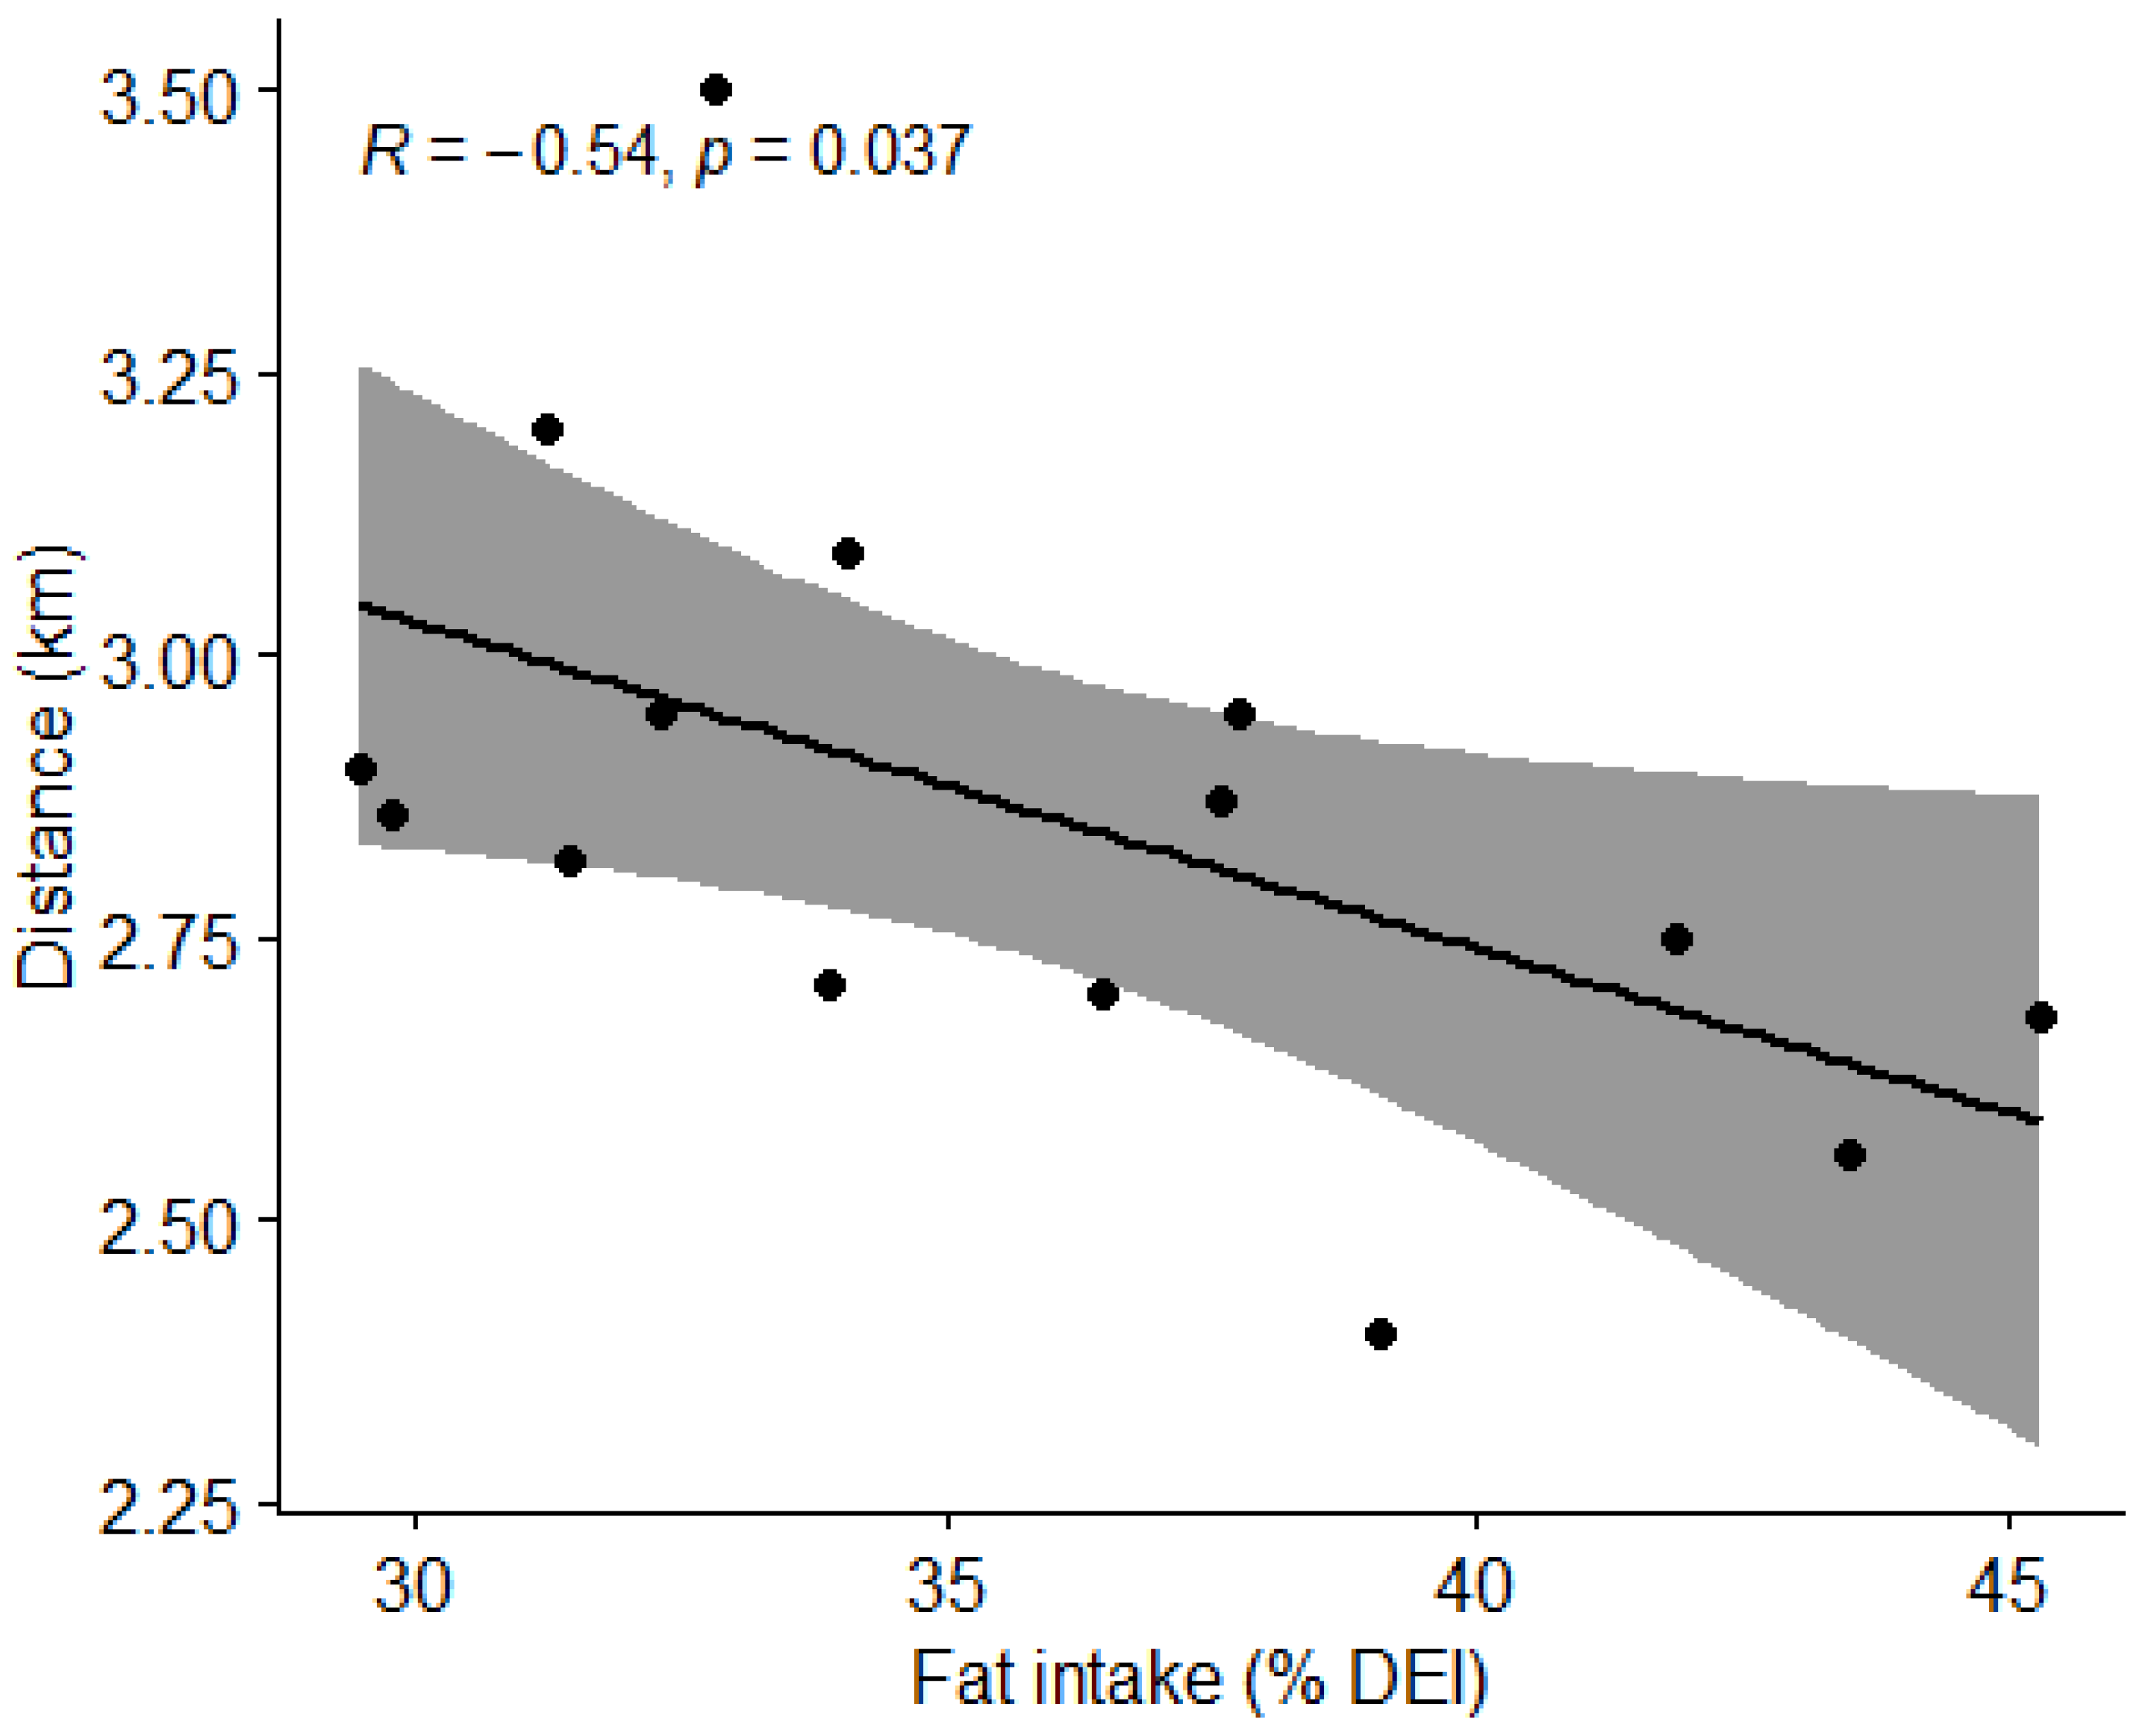
3.4.4. Fat Intake and Physical Performance
3.5. Results of Hypothesis Testing
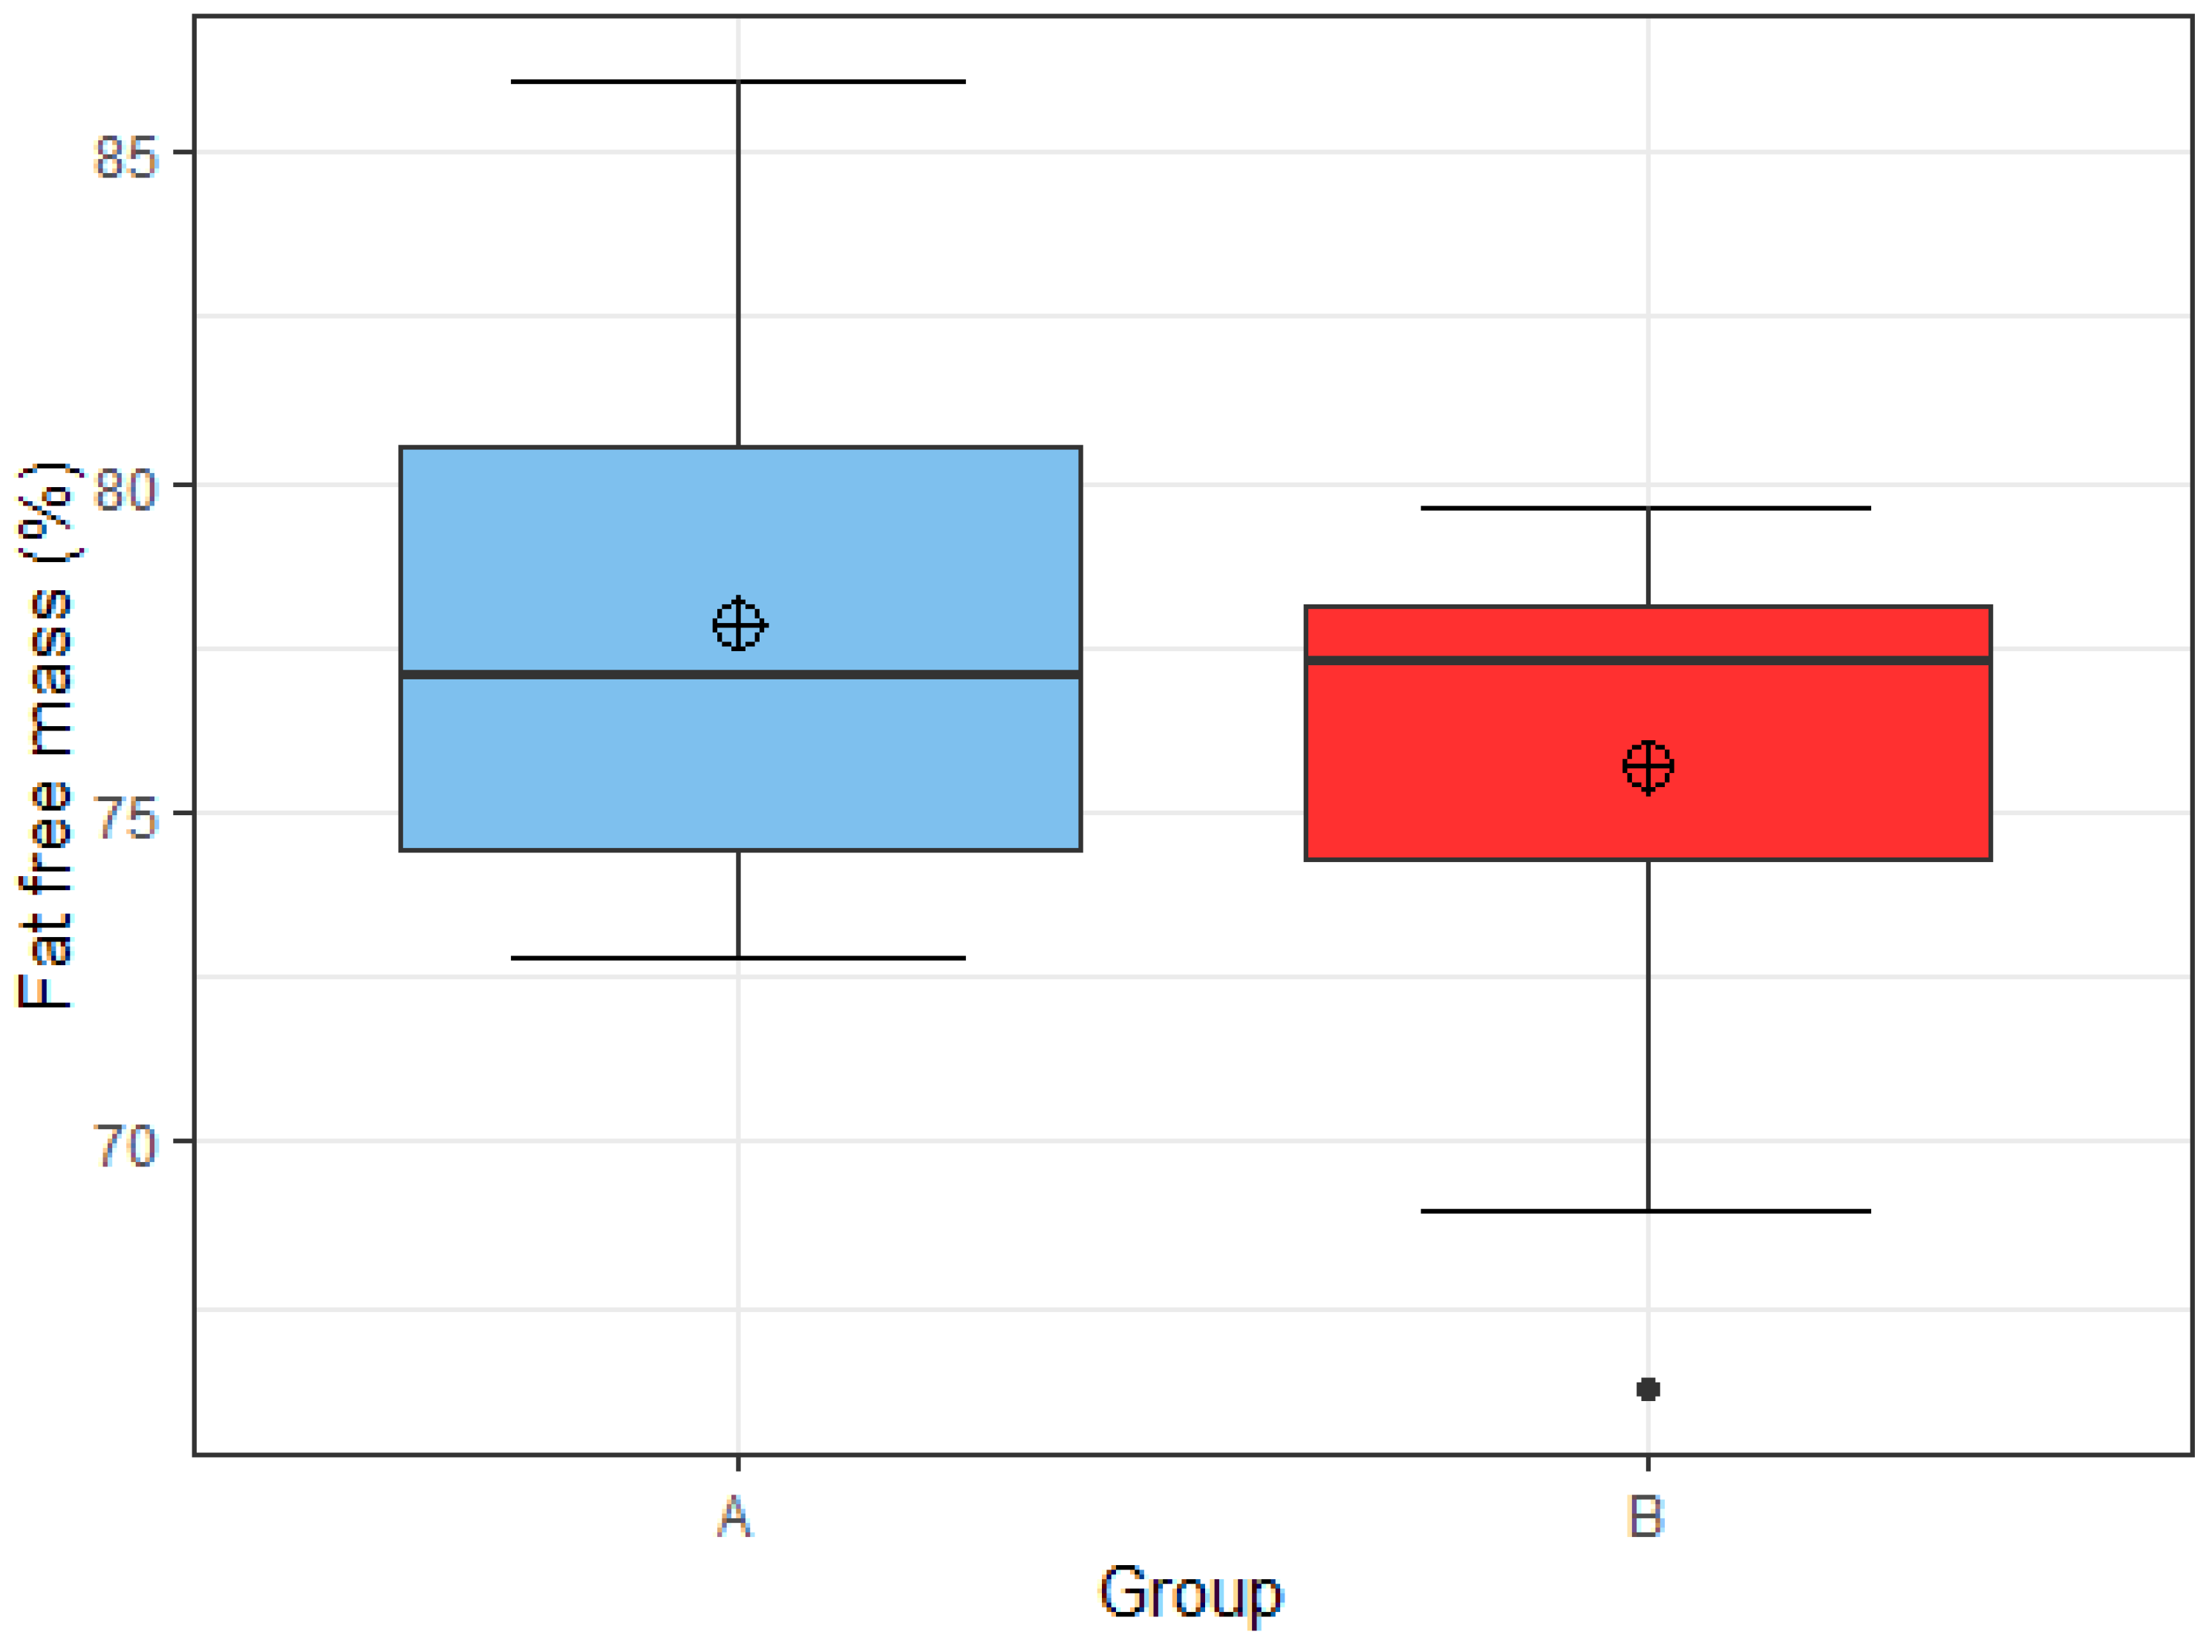
3.5.1. Hypothesis 1
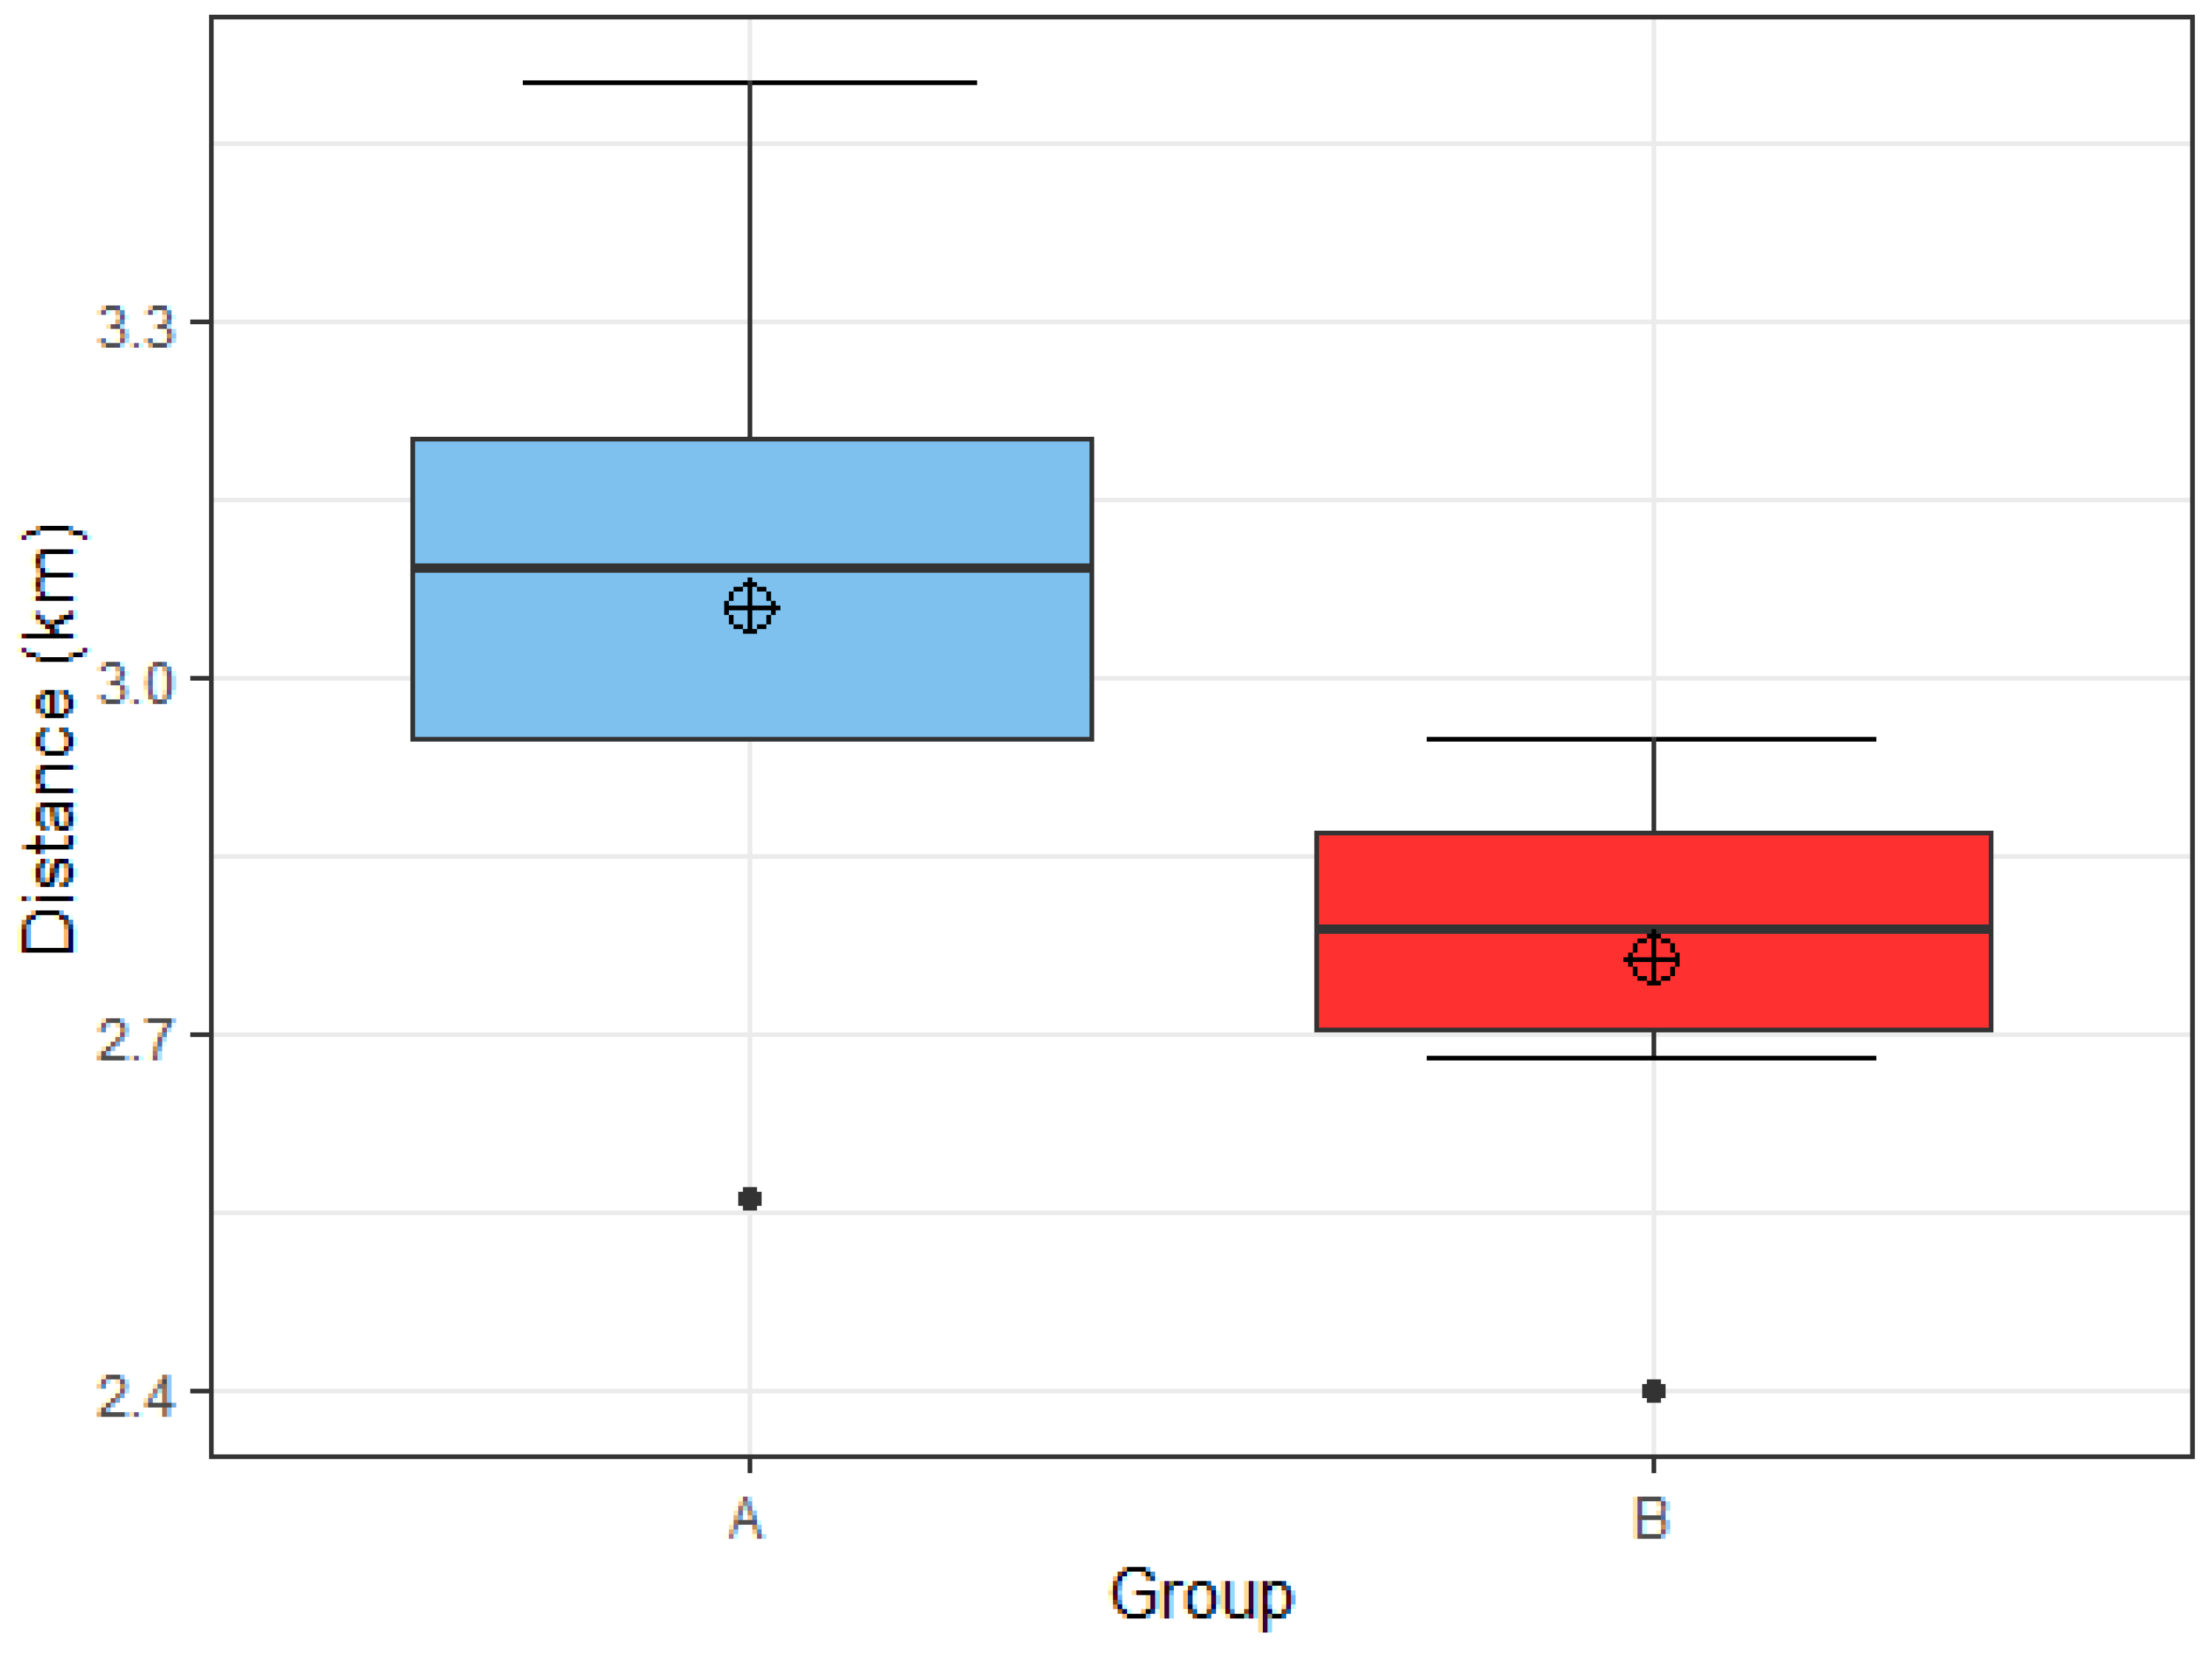
3.5.2. Hypothesis 2
3.5.3. Hypothesis 3
4. Discussion
5. Conclusions
Author Contributions
Funding
Institutional Review Board Statement
Informed Consent Statement
Data Availability Statement
Acknowledgments
Conflicts of Interest
Appendix A

Appendix B

References
- Steffl, M.; Kinkorova, I.; Kokstejn, J.; Petr, M. Macronutrient intake in soccer players-a meta-analysis. Nutrients 2019, 11, 1305. [Google Scholar] [CrossRef] [PubMed]
- Bloomfield, J.; Polman, R.; O’Donoghue, P. Physical Demands of Different Positions in FA Premier League Soccer. J. Sports Sci. Med. 2007, 6, 63–70. [Google Scholar] [PubMed]
- Castillo-Rodríguez, A.; Cano-Cáceres, F.J.; Figueiredo, A.; Fernández-García, J.C. Train Like You Compete? Physical and Physiological Responses on Semi-Professional Soccer Players. Int. J. Environ. Res. Public Health 2020, 17, 756. [Google Scholar] [CrossRef] [PubMed]
- Jenner, S.L.; Buckley, G.L.; Belski, R.; Devlin, B.L.; Forsyth, A.K. Dietary intakes of professional and semi-professional team sport athletes do not meet sport nutrition recommendations-a systematic literature review. Nutrients 2019, 11, 1160. [Google Scholar] [CrossRef] [PubMed]
- Saeidi, A.; Khodamoradi, A. Physical and Physiological Demand of Soccer Player Based on Scientific Research. Int. J. Phys. Sci. 2017, 1, 1–12. [Google Scholar]
- Stellingwerff, T.; Morton, J.P.; Burke, L.M. A framework for periodized nutrition for athletics. Int. J. Sport Nutr. Exerc. Metab. 2019, 29, 141–151. [Google Scholar] [CrossRef]
- Collins, J.; Maughan, R.J.; Gleeson, M.; Bilsborough, J.; Jeukendrup, A.; Morton, J.P.; Phillips, S.M.; Armstrong, L.; Burke, L.M.; Close, G.L.; et al. UEFA expert group statement on nutrition in elite football. Current evidence to inform practical recommendations and guide future research. Br. J. Sports Med. 2021, 55, 416. [Google Scholar] [CrossRef]
- Beck, K.L.; Thomson, J.S.; Swift, R.J.; von Hurst, P.R. Role of nutrition in performance enhancement and postexercise recovery. Open Access J. Sports Med. 2015, 6, 259–267. [Google Scholar] [CrossRef]
- Jeukendrup, A.E. Periodized Nutrition for Athletes. Sports Med. 2017, 47 (Suppl. 1), 51–63. [Google Scholar] [CrossRef]
- Książek, A.; Zagrodna, A.; Słowińska-Lisowska, M. Assessment of the dietary intake of high-rank professional male football players during a preseason training week. Int. J. Environ. Res. Public Health 2020, 17, 8567. [Google Scholar] [CrossRef]
- Larson-Meyer, D.E.; Woolf, K.; Burke, L. Assessment of nutrient status in athletes and the need for supplementation. Int. J. Sport Nutr. Exerc. Metab. 2018, 28, 139–158. [Google Scholar] [CrossRef] [PubMed]
- Marius, B.; Rimantas, S.; Linas, T.; Kęstutis, Ž.; Genė, Š.; Edmundas, Š.; Vincentas, R.G.; Valerij, D.; Jonas, A.A. Nutritional habits among high-performance endurance athletes. Medicina 2015, 51, 351–362. [Google Scholar] [CrossRef]
- Mascherini, G.; Petri, C.; Ermini, E.; Pizzi, A.; Ventura, A.; Galanti, G. Eating Habits and Body Composition of International Elite Soccer Referees. J. Hum. Kinet. 2020, 71, 145–153. [Google Scholar] [CrossRef] [PubMed]
- García-Rovés, P.M.; García-Zapico, P.; Patterson, Á.M.; Iglesias-Gutiérrez, E. Nutrient Intake and Food Habits of Soccer Players: Analyzing the Correlates of Eating Practice. Nutrients 2014, 6, 2697–2717. [Google Scholar] [CrossRef]
- Ainsworth, B.E.; Haskell, W.L.; Herrmann, S.D.; Meckes, N.; Bassett, D.R., Jr.; Tudor-Locke, C.; Greer, J.L.; Vezina, J.; Whitt-Glover, M.C.; Leon, A.S. 2011 Compendium of physical activities: A second update of codes and MET values. Med. Sci. Sports Exerc. 2011, 43, 1575–1581. [Google Scholar] [CrossRef]
- Loucks, A.B.; Kiens, B.; Wright, H.H. Energy availability in athletes. J. Sports Sci. 2011, 29, 7–15. [Google Scholar] [CrossRef]
- Cooper, K.H. A means of assessing maximal oxygen uptake. JAMA 1968, 203, 201–204. [Google Scholar] [CrossRef]
- Murphy, M.; Eliot, K.; Heuertz, R.M.; Weiss, E. Whole beetroot consumption acutely improves running performance. J. Acad. Nutr. Diet. 2012, 112, 548–552. [Google Scholar] [CrossRef]
- Melin, A.K.; Heikura, I.A.; Tenforde, A.; Mountjoy, M. Energy availability in athletics: Health, performance, and physique. Int. J. Sport Nutr. Exerc. Metab. 2019, 29, 152–164. [Google Scholar] [CrossRef]
- Casazza, G.A.; Tovar, A.P.; Richardson, C.E.; Cortez, A.N.; Davis, B.A. Energy Availability, Macronutrient Intake, and Nutritional Supplementation for Improving Exercise Performance in Endurance Athletes. Curr. Sports Med. Rep. 2018, 17, 215–223. [Google Scholar] [CrossRef]
- Nacionalni Inštitut za Javno Zdravje (NIJZ). Referenčne Vrednosti za Energijski Vnos ter Vnos Hranil: Tabelarična Priporočila za Otroke (Od 1. Leta Starosti Naprej), Mladostnike, Odrasle, Starejše Odrasle, Nosečnice ter Doječe Matere. 2020. Available online: https://www.nijz.si/sl/referencne-vrednosti-za-energijski-vnos-ter-vnos-hranil (accessed on 29 September 2022).
- Maughan, R.J.; Burke, L.M.; Dvorak, J.; Larson-Meyer, D.E.; Peeling, P.; Phillips, S.M.; Rawson, E.S.; Walsh, N.P.; Garthe, I.; Geyer, H.; et al. IOC consensus statement: Dietary supplements and the high-performance athlete. Br. J. Sports Med. 2018, 52, 439–455. [Google Scholar] [CrossRef] [PubMed]
- Jenner, S.L.; Trakman, G.; Coutts, A.; Kempton, T.; Ryan, S.; Forsyth, A.; Belski, R. Dietary intake of professional Australian football athletes surrounding body composition assessment. J. Int. Soc. Sports Nutr. 2018, 15, 43. [Google Scholar] [CrossRef] [PubMed]
- Pramuková, B.; Szabadosová, V.; Soltésová, A. Current knowledge about sports nutrition. Australas. Med. J. 2011, 4, 107–110. [Google Scholar] [CrossRef] [PubMed]
- Dreher, M.L. Overview of the Health Benefits of Adequate Fiber Intake. In Dietary Fiber in Health and Disease; Nutrition and Health; Humana Press: Cham, Switzerland, 2018. [Google Scholar] [CrossRef]
- Valentine, V. The Importance of Salt in the Athlete’s Diet. Curr. Sports Med. Rep. 2007, 6, 237–240. [Google Scholar] [CrossRef]
- de la Puente Yagüe, M.; Collado Yurrita, L.; Ciudad Cabañas, M.J.; Cuadrado Cenzual, M.A. Role of Vitamin D in Athletes and Their Performance: Current Concepts and New Trends. Nutrients 2020, 12, 579. [Google Scholar] [CrossRef]
- Castizo-Olier, J.; Irurtia, A.; Jemni, M.; Carrasco-Marginet, M.; Fernández-García, R.; Rodríguez, F.A. Bioelectrical impedance vector analysis (BIVA) in sport and exercise: Systematic review and future perspectives. PLoS ONE 2018, 13, e0197957. [Google Scholar] [CrossRef]
- Nana, A.; Slater, G.J.; Stewart, A.D.; Burke, L.M. Methodology review: Using dual-energy X-ray absorptiometry (DXA) for the assessment of body composition in athletes and active people. Int. J. Sport Nutr. Exerc. Metab. 2015, 25, 198–215. [Google Scholar] [CrossRef]
- Suter, P.M. The B-vitamins. In Essential and Toxic Trace Elements and Vitamins in Human Health; Prasad, A.S., Brewer, G., Eds.; Academic Press: Cambridge, MA, USA, 2020; pp. 217–239. [Google Scholar]


| Variable | Mean ± SD | Range |
|---|---|---|
| Age (year) | 24 ± 3.4 | 19–31 |
| Height (cm) | 182 ± 6.2 | 169–192 |
| Body mass (kg) | 78 ± 7.4 | 60.5–88 |
| BMI (kg/m2) | 23.4 ± 1.2 | 20.5–25.2 |
| FFM (kg) | 59.4 ± 4.8 | 49.4–66.7 |
| FFM (%) | 76.4 ± 4.1 | 66.3–86.1 |
| FM (kg) | 18.2 ± 3.8 | 8.7–24.8 |
| MET | 23.1 ± 3.5 | 13.9–31.0 |
| EEE (kcal) | 12.8 ± 4.5 | 0.6–15.1 |
| Variable | Mean ± SD | Range |
|---|---|---|
| Energy intake (kcal) | 2694 ± 494 | NA |
| Energy availability (kcal/kg FFM) | 29.0 ± 8.5 | ≥40 |
| Carbohydrate intake (g/kg BM) | 3.6 ± 0.9 | 4–8 |
| Protein intake (g/kg BM) | 1.8 ± 0.5 | 1.6–2.2 |
| Fat intake (% daily energy intake) | 34.7 ± 5.2 | <35 |
| Saturated fat intake (% daily energy intake) | 10.5 ± 3.8 | <10 |
| Fiber intake (g) | 27.4 ± 10.2 | >30 |
| Variable | Mean ± SD | RDA [7,21] |
|---|---|---|
| Iron (mg) | 17.5 ± 11.8 | 10 |
| Calcium (mg) | 964.2 ± 298.8 | 1000 oz. 1500 |
| Magnesium (mg) | 560.5 ± 175.4 | 350–400 |
| Zinc (mg) | 18.8 ± 7.5 | 11–16 |
| Vitamin C (mg) | 186.9 ± 216.8 | 110 |
| Vitamin B2 (mg) | 3.9 ± 6.0 | 1.3 |
| Vitamin B6 (mg) | 4.7 ± 4.4 | 1.6 |
| Folate (µg) | 375.6 ± 227.9 | 300 |
| Vitamin B12 (µg) | 7.8 ± 3.6 | 4 |
| Vitamin E (mg) | 27.7 ± 36.3 | 13 |
| Vitamin D (µg) | 4.1 ± 3.1 | 20 |
| NaCl (g) | 7.6 ± 2.4 | <5 |
Disclaimer/Publisher’s Note: The statements, opinions and data contained in all publications are solely those of the individual author(s) and contributor(s) and not of MDPI and/or the editor(s). MDPI and/or the editor(s) disclaim responsibility for any injury to people or property resulting from any ideas, methods, instructions or products referred to in the content. |
© 2022 by the authors. Licensee MDPI, Basel, Switzerland. This article is an open access article distributed under the terms and conditions of the Creative Commons Attribution (CC BY) license (https://creativecommons.org/licenses/by/4.0/).
Share and Cite
Macuh, M.; Levec, J.; Kojić, N.; Knap, B. Dietary Intake, Body Composition and Performance of Professional Football Athletes in Slovenia. Nutrients 2023, 15, 82. https://doi.org/10.3390/nu15010082
Macuh M, Levec J, Kojić N, Knap B. Dietary Intake, Body Composition and Performance of Professional Football Athletes in Slovenia. Nutrients. 2023; 15(1):82. https://doi.org/10.3390/nu15010082
Chicago/Turabian StyleMacuh, Matjaž, Jana Levec, Nenad Kojić, and Bojan Knap. 2023. "Dietary Intake, Body Composition and Performance of Professional Football Athletes in Slovenia" Nutrients 15, no. 1: 82. https://doi.org/10.3390/nu15010082
APA StyleMacuh, M., Levec, J., Kojić, N., & Knap, B. (2023). Dietary Intake, Body Composition and Performance of Professional Football Athletes in Slovenia. Nutrients, 15(1), 82. https://doi.org/10.3390/nu15010082