
Application of the Nutrient-Rich Food Index 9.3 and the Dietary Inflammatory Index for Assessing Maternal Dietary Quality in Japan: A Single-Center Birth Cohort Study

 , ,
, ,
Abstract
1. Introduction
2. Materials and Methods
2.1. Study Population and Design
2.2. Data Collection
2.3. Dietary Data
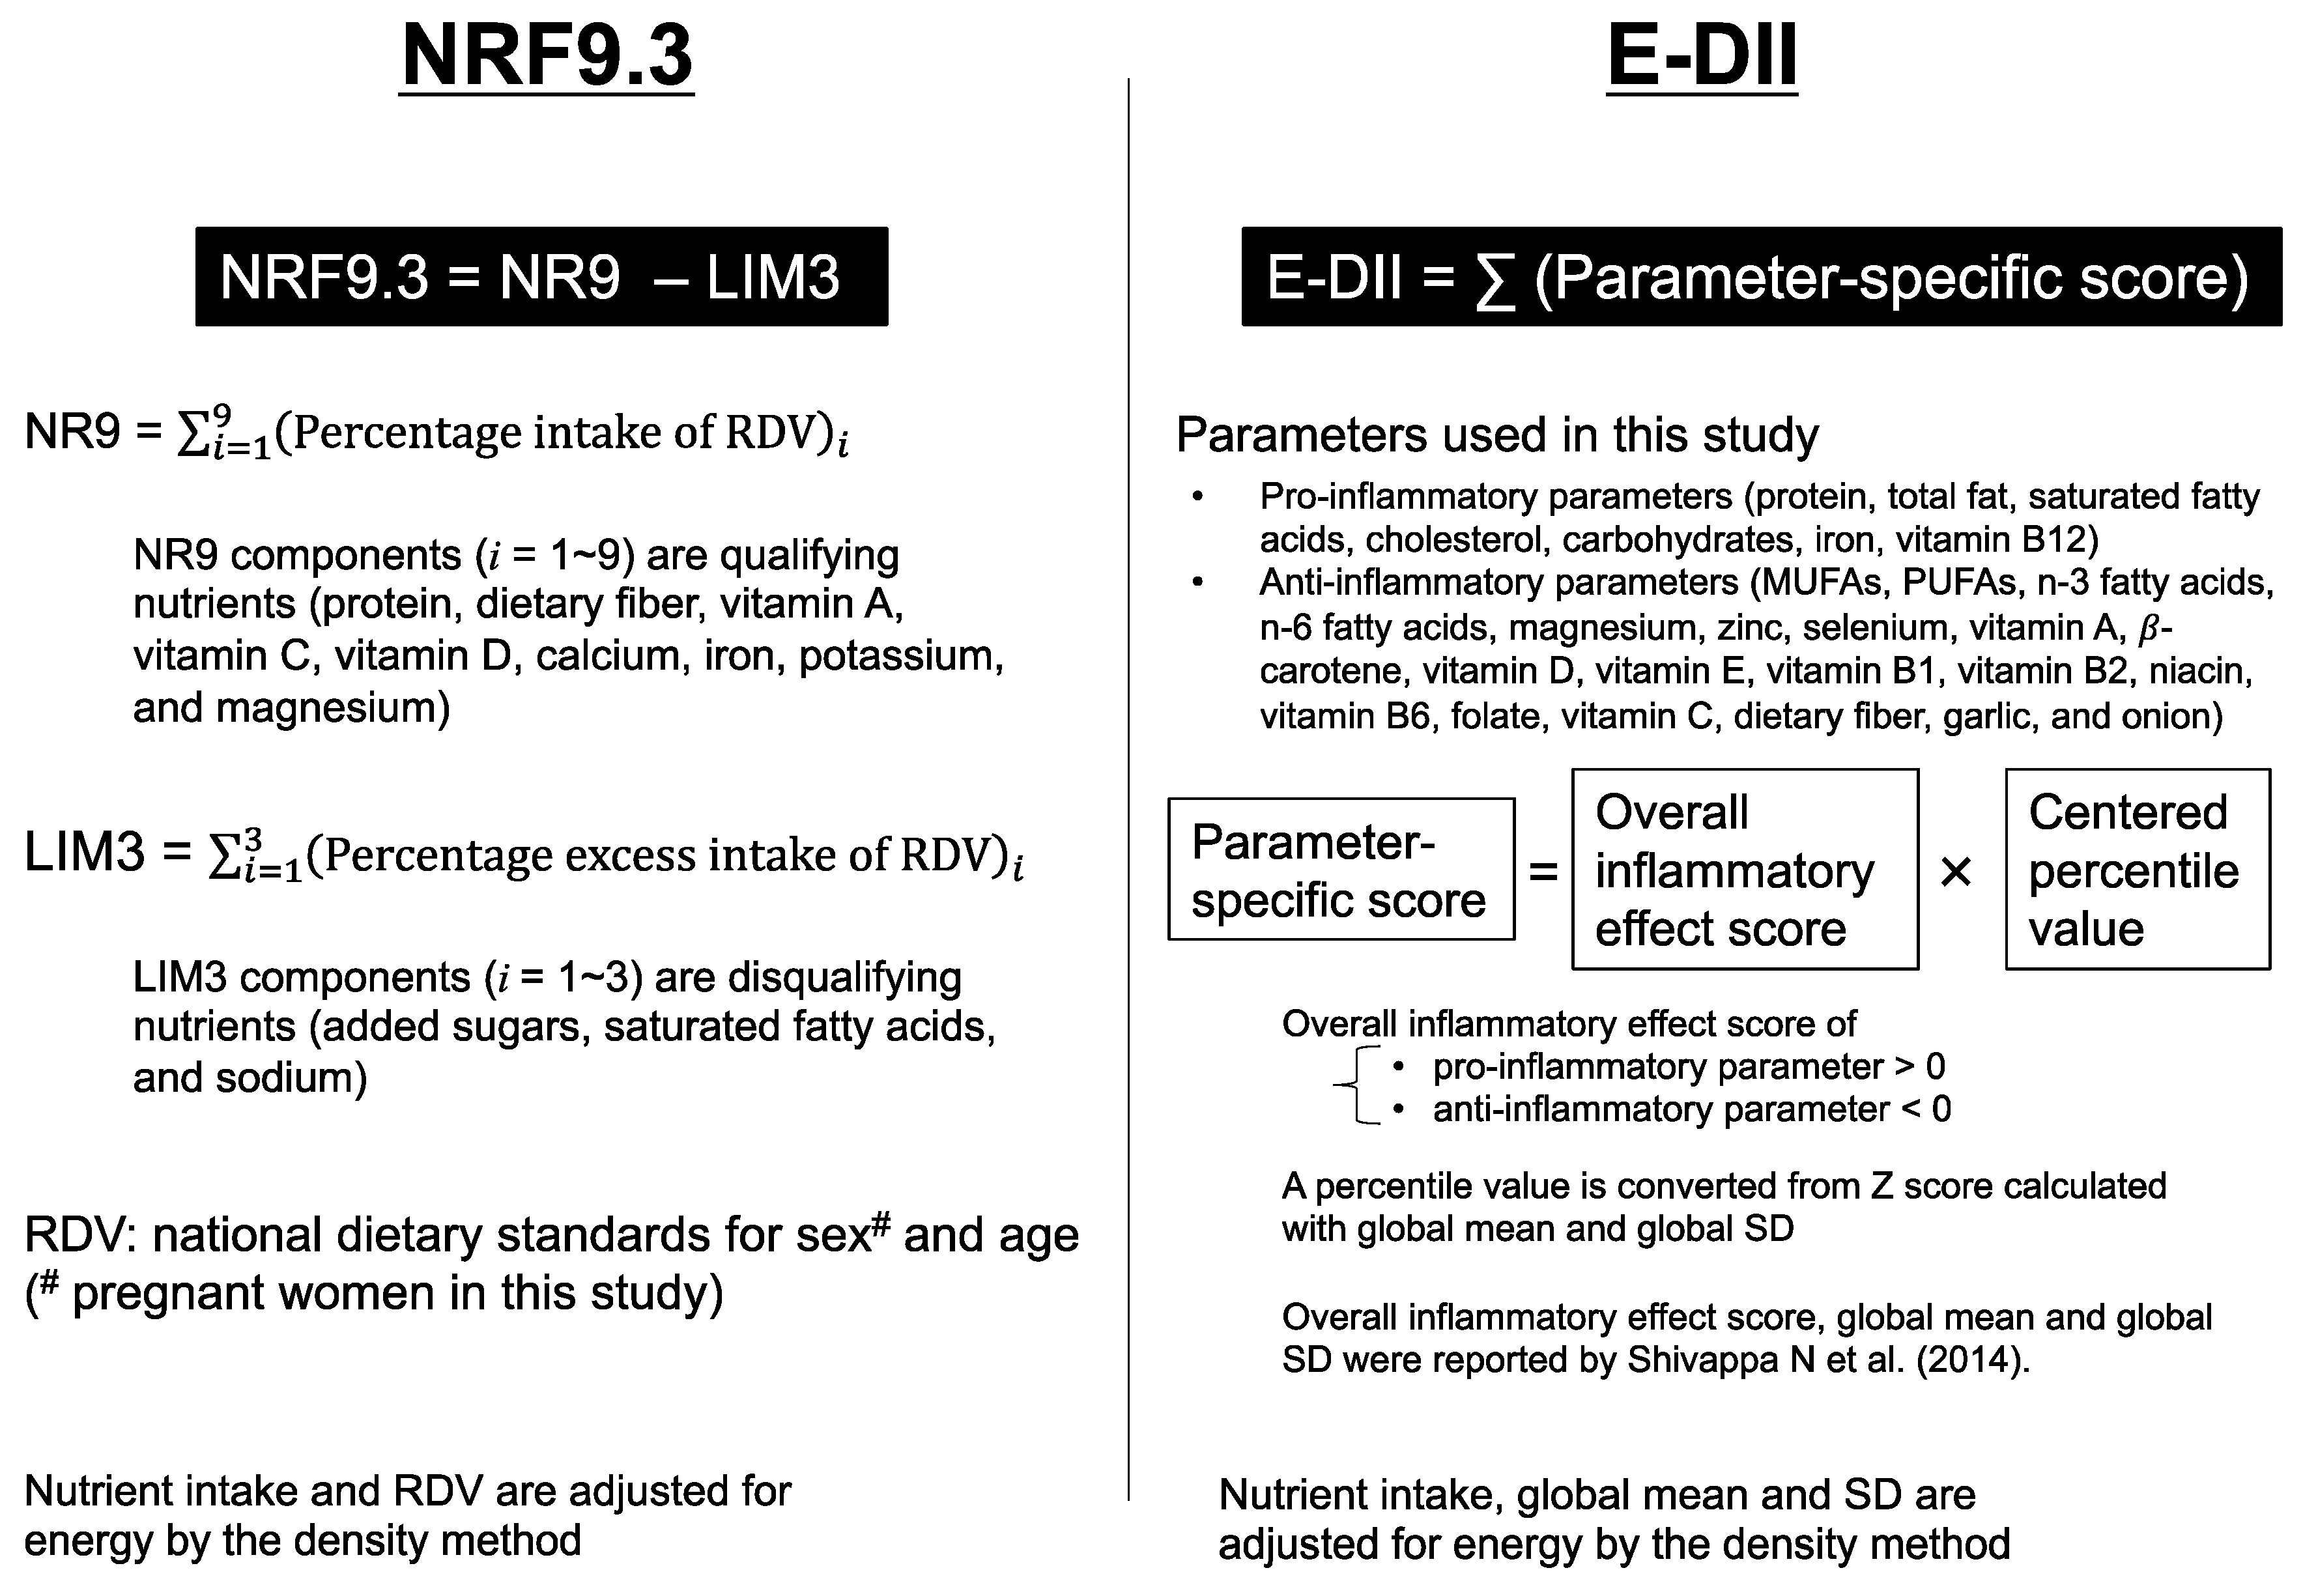
2.4. NRF9.3
2.5. E-DII (Energy Adjusted-DII)
2.6. Nutrient Intake Comparison between the BC-GENIST Participants and the NHNS Pregnant Women Cohort
2.7. Statistical Analysis
2.8. Misreported Energy Intake (EI) and Sensitivity Analysis
3. Results
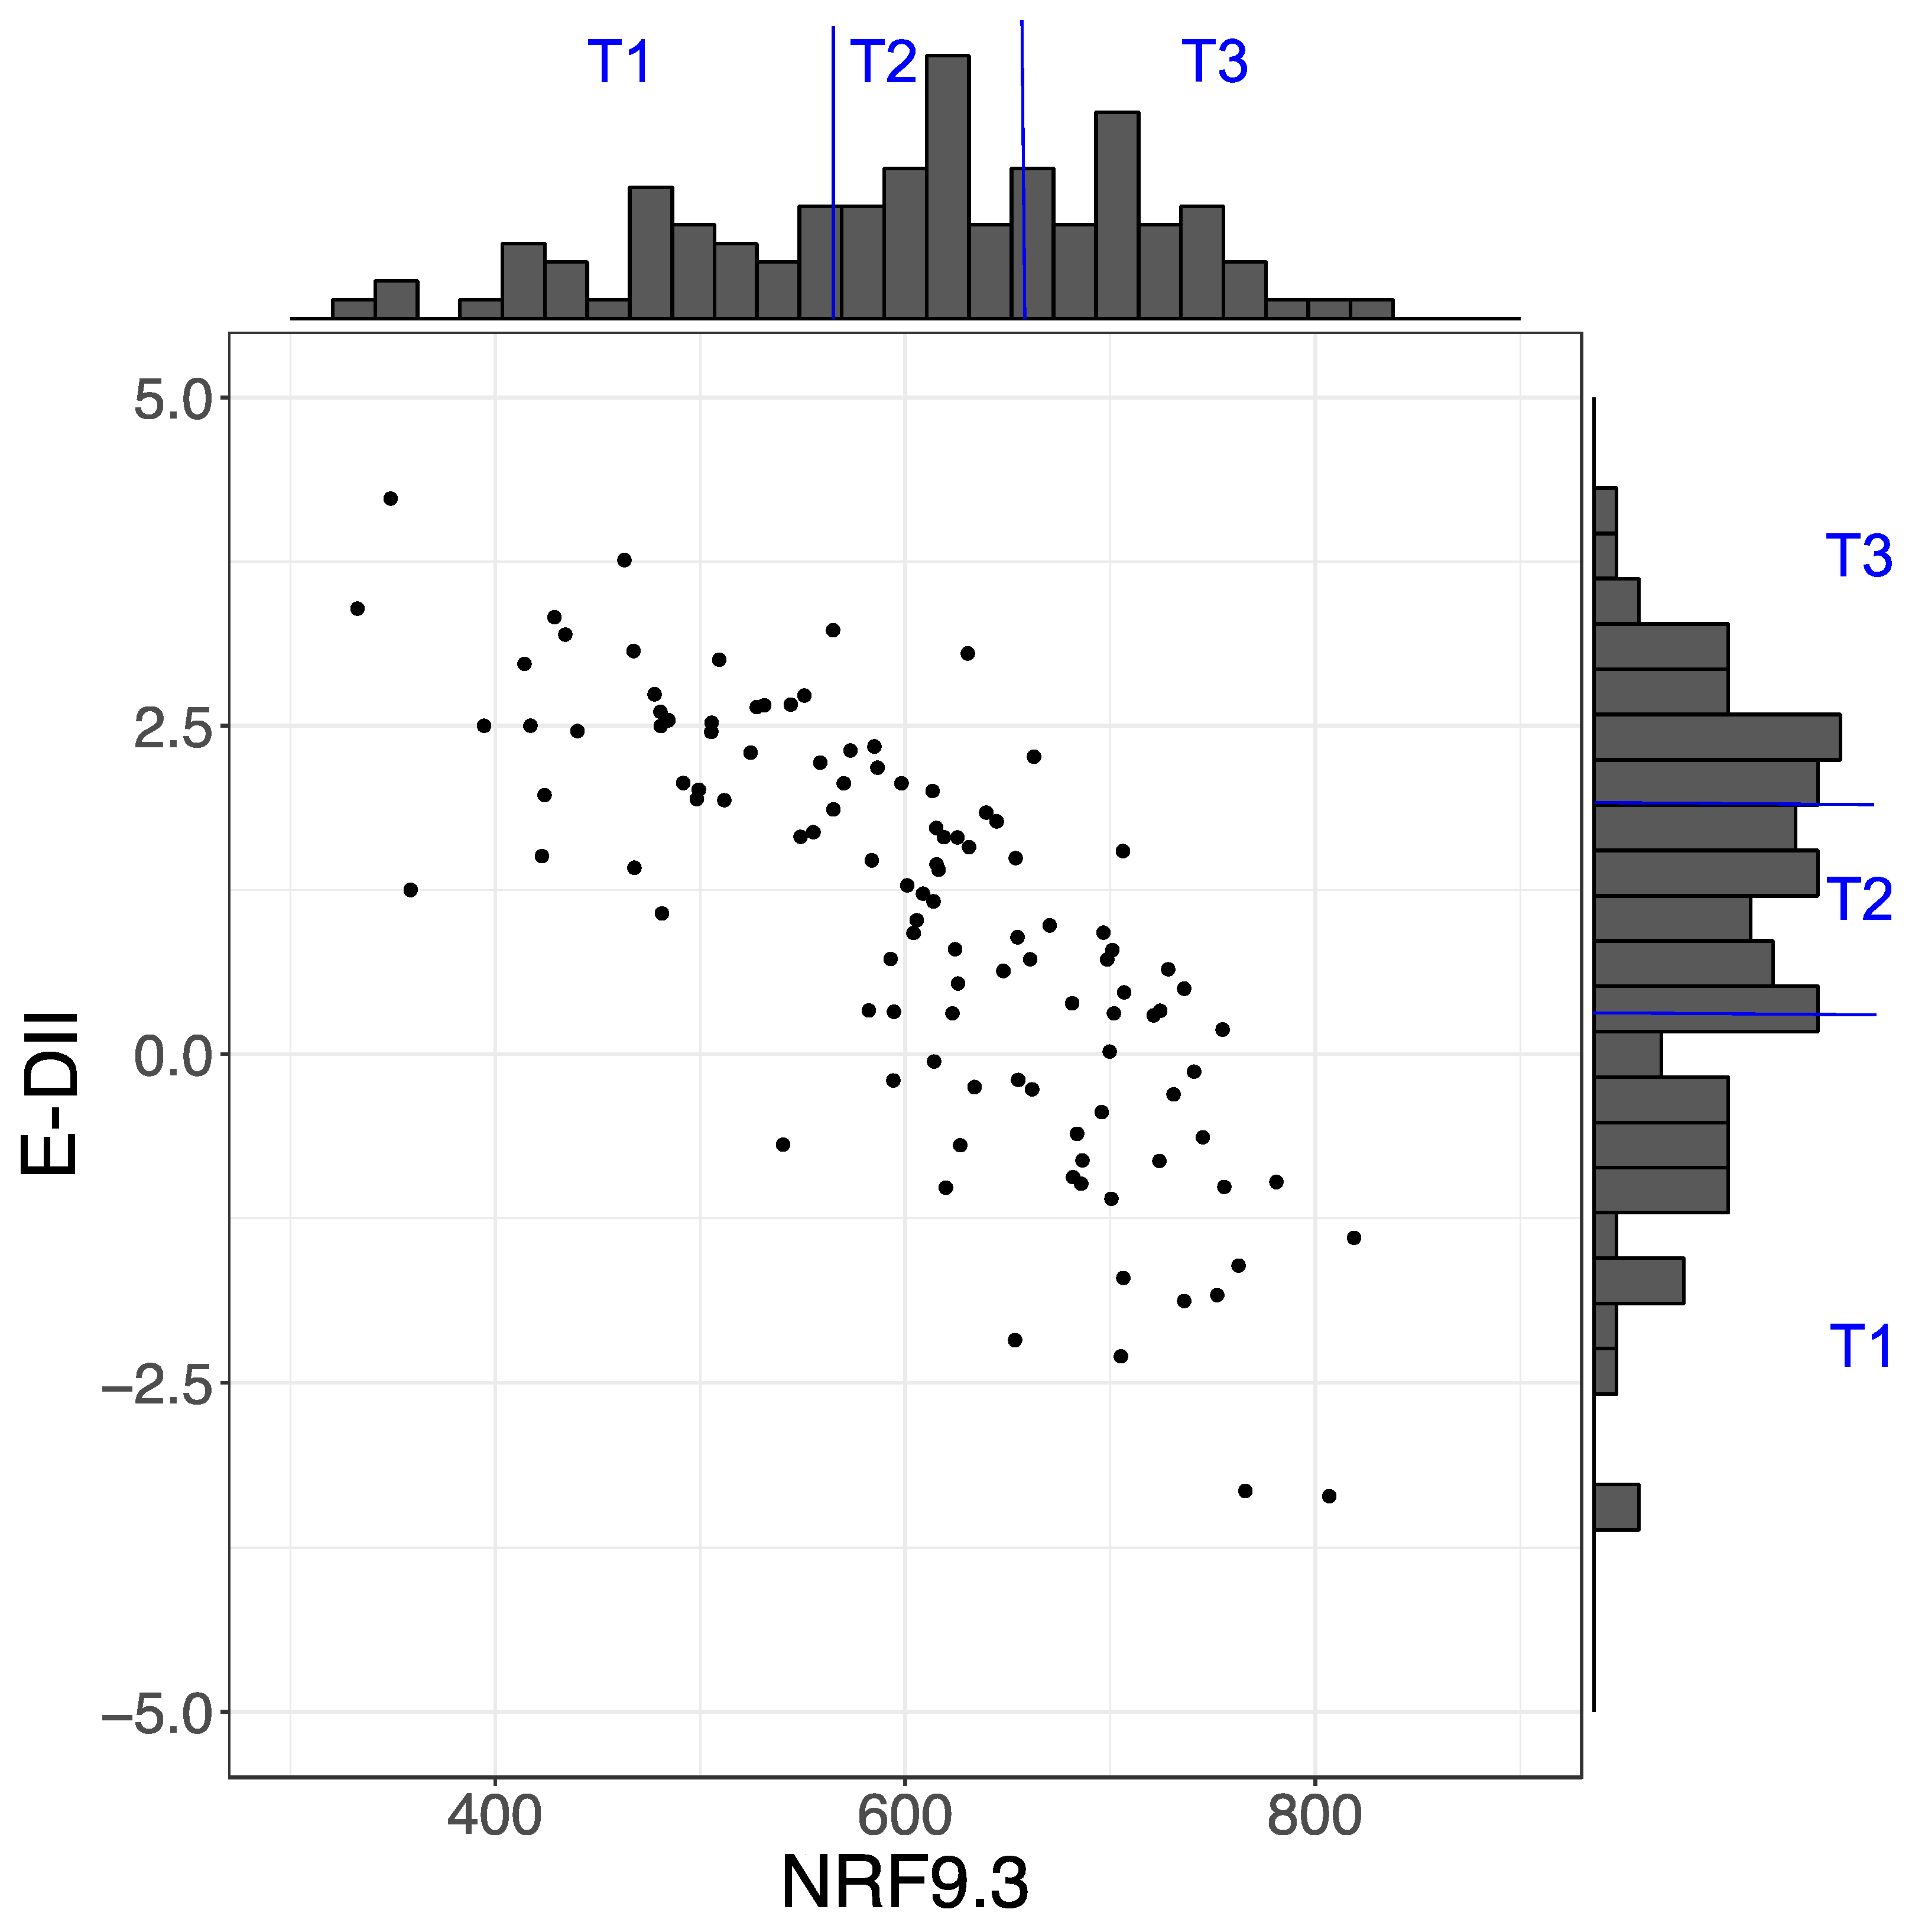
3.1. Characteristics of Participants According to Tertile Category Groups of Each Dietary Index
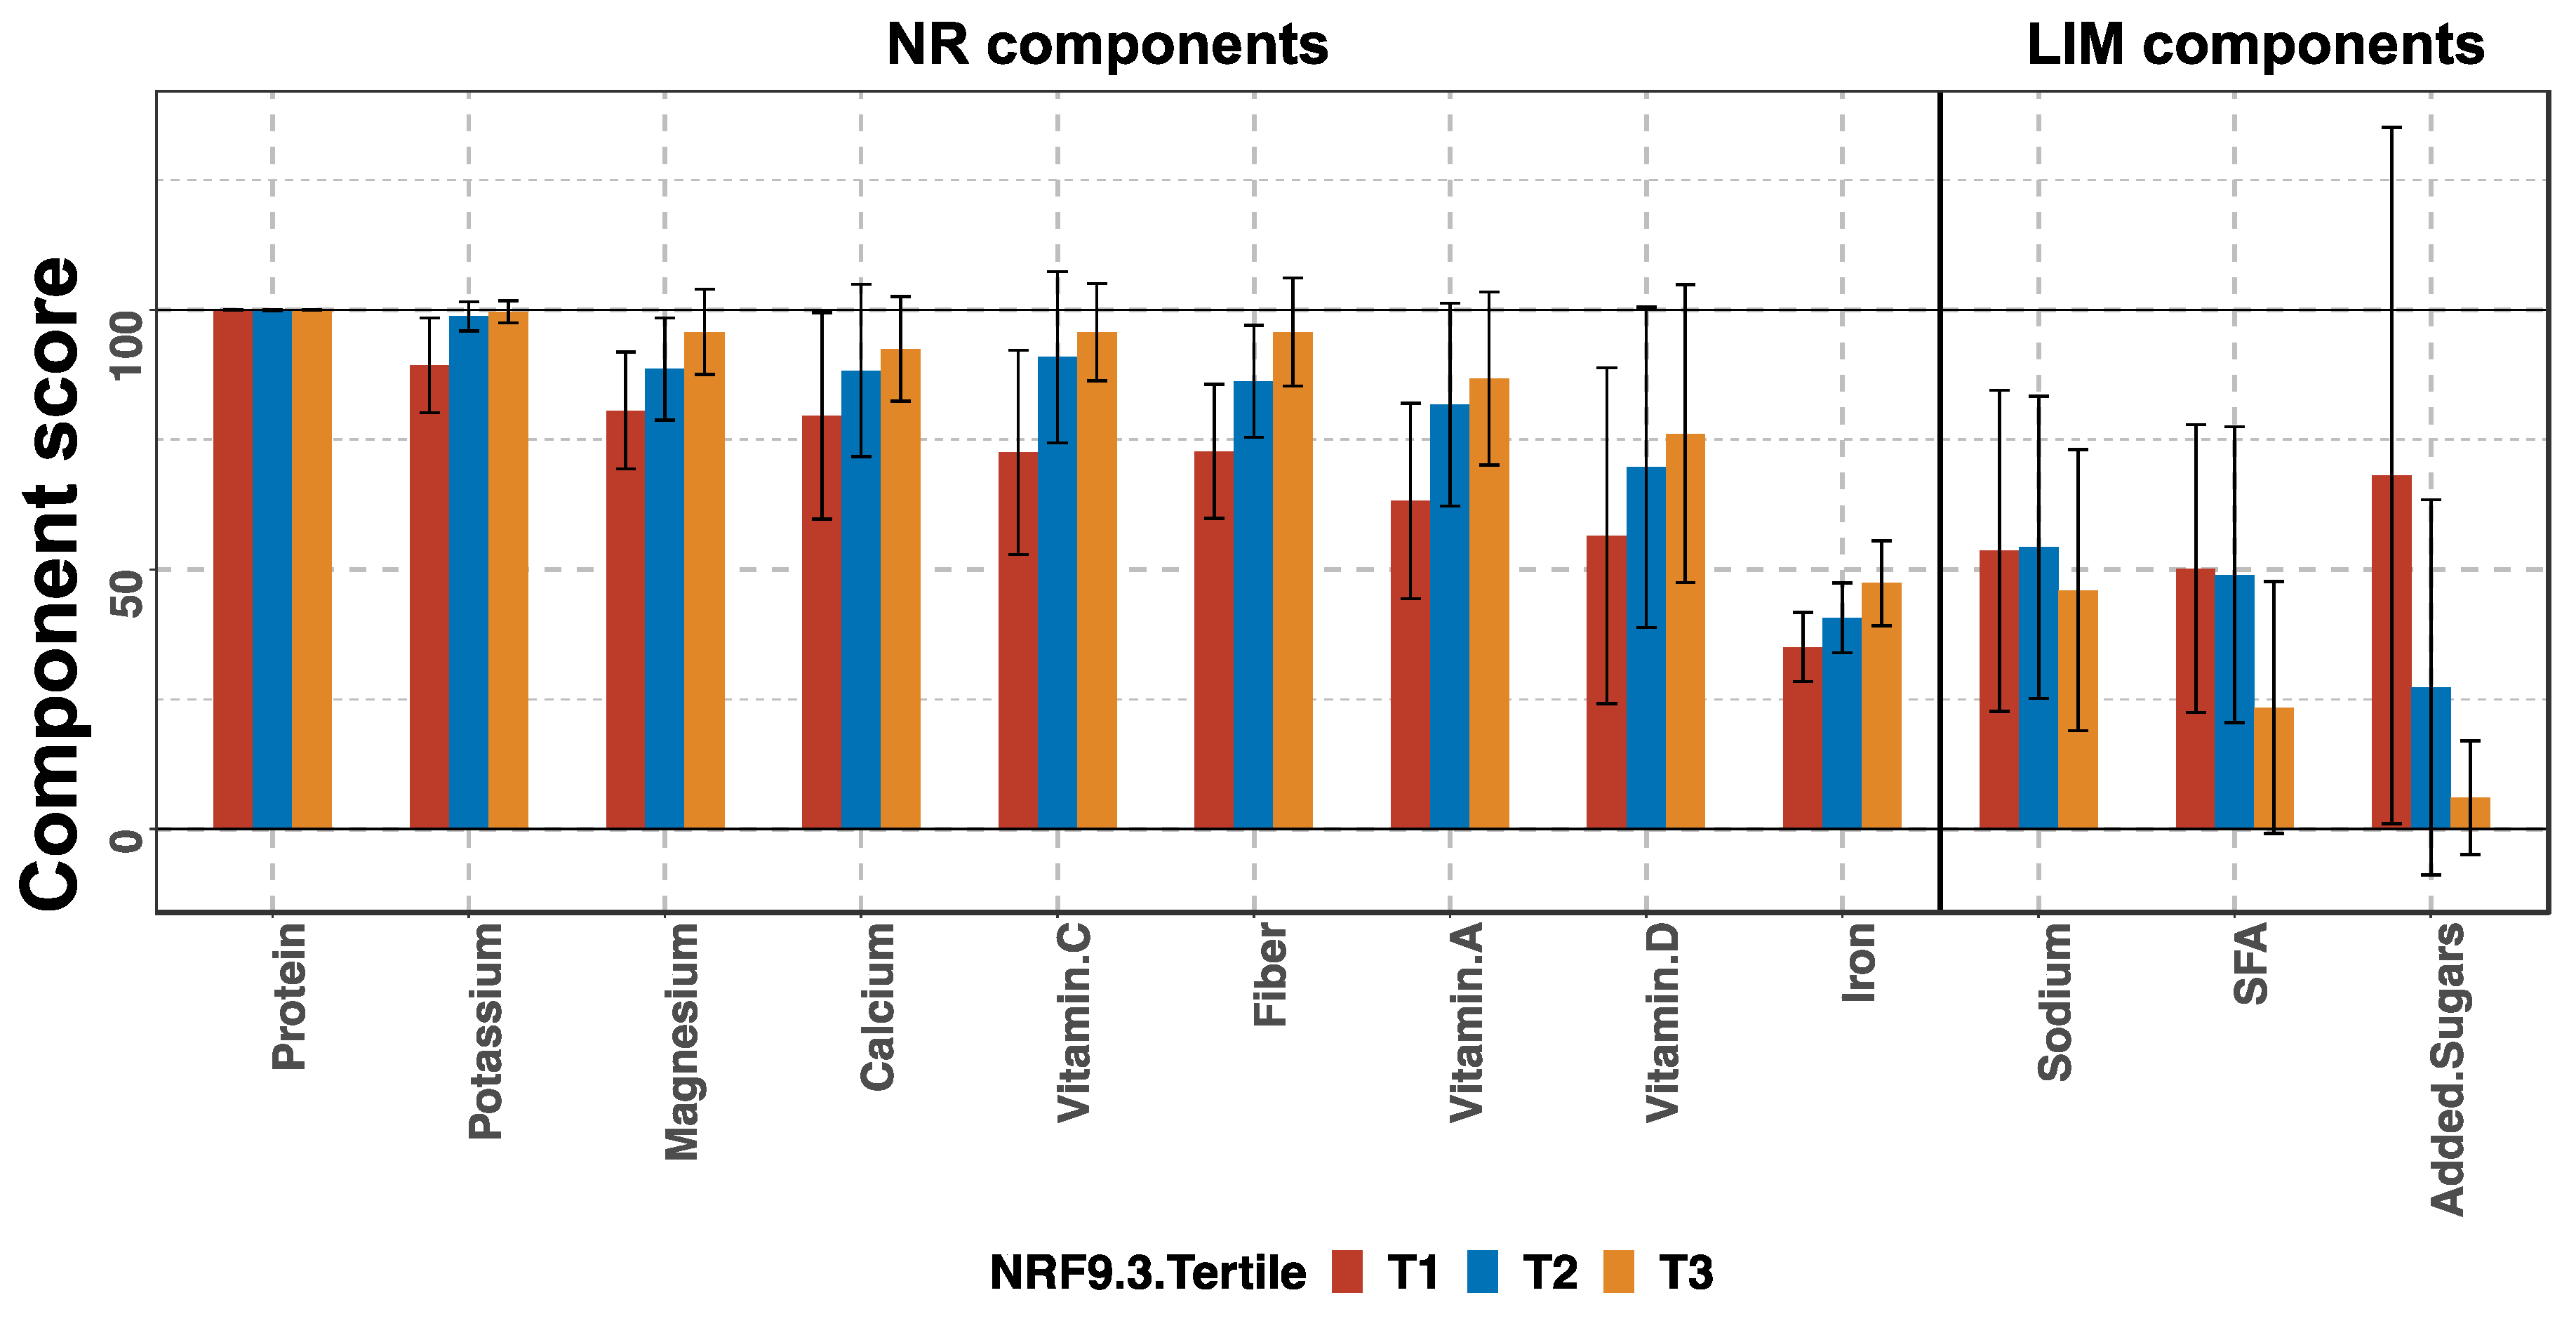
3.2. Breakdown of NRF9.3 Score into Component Scores by Tertile Groups
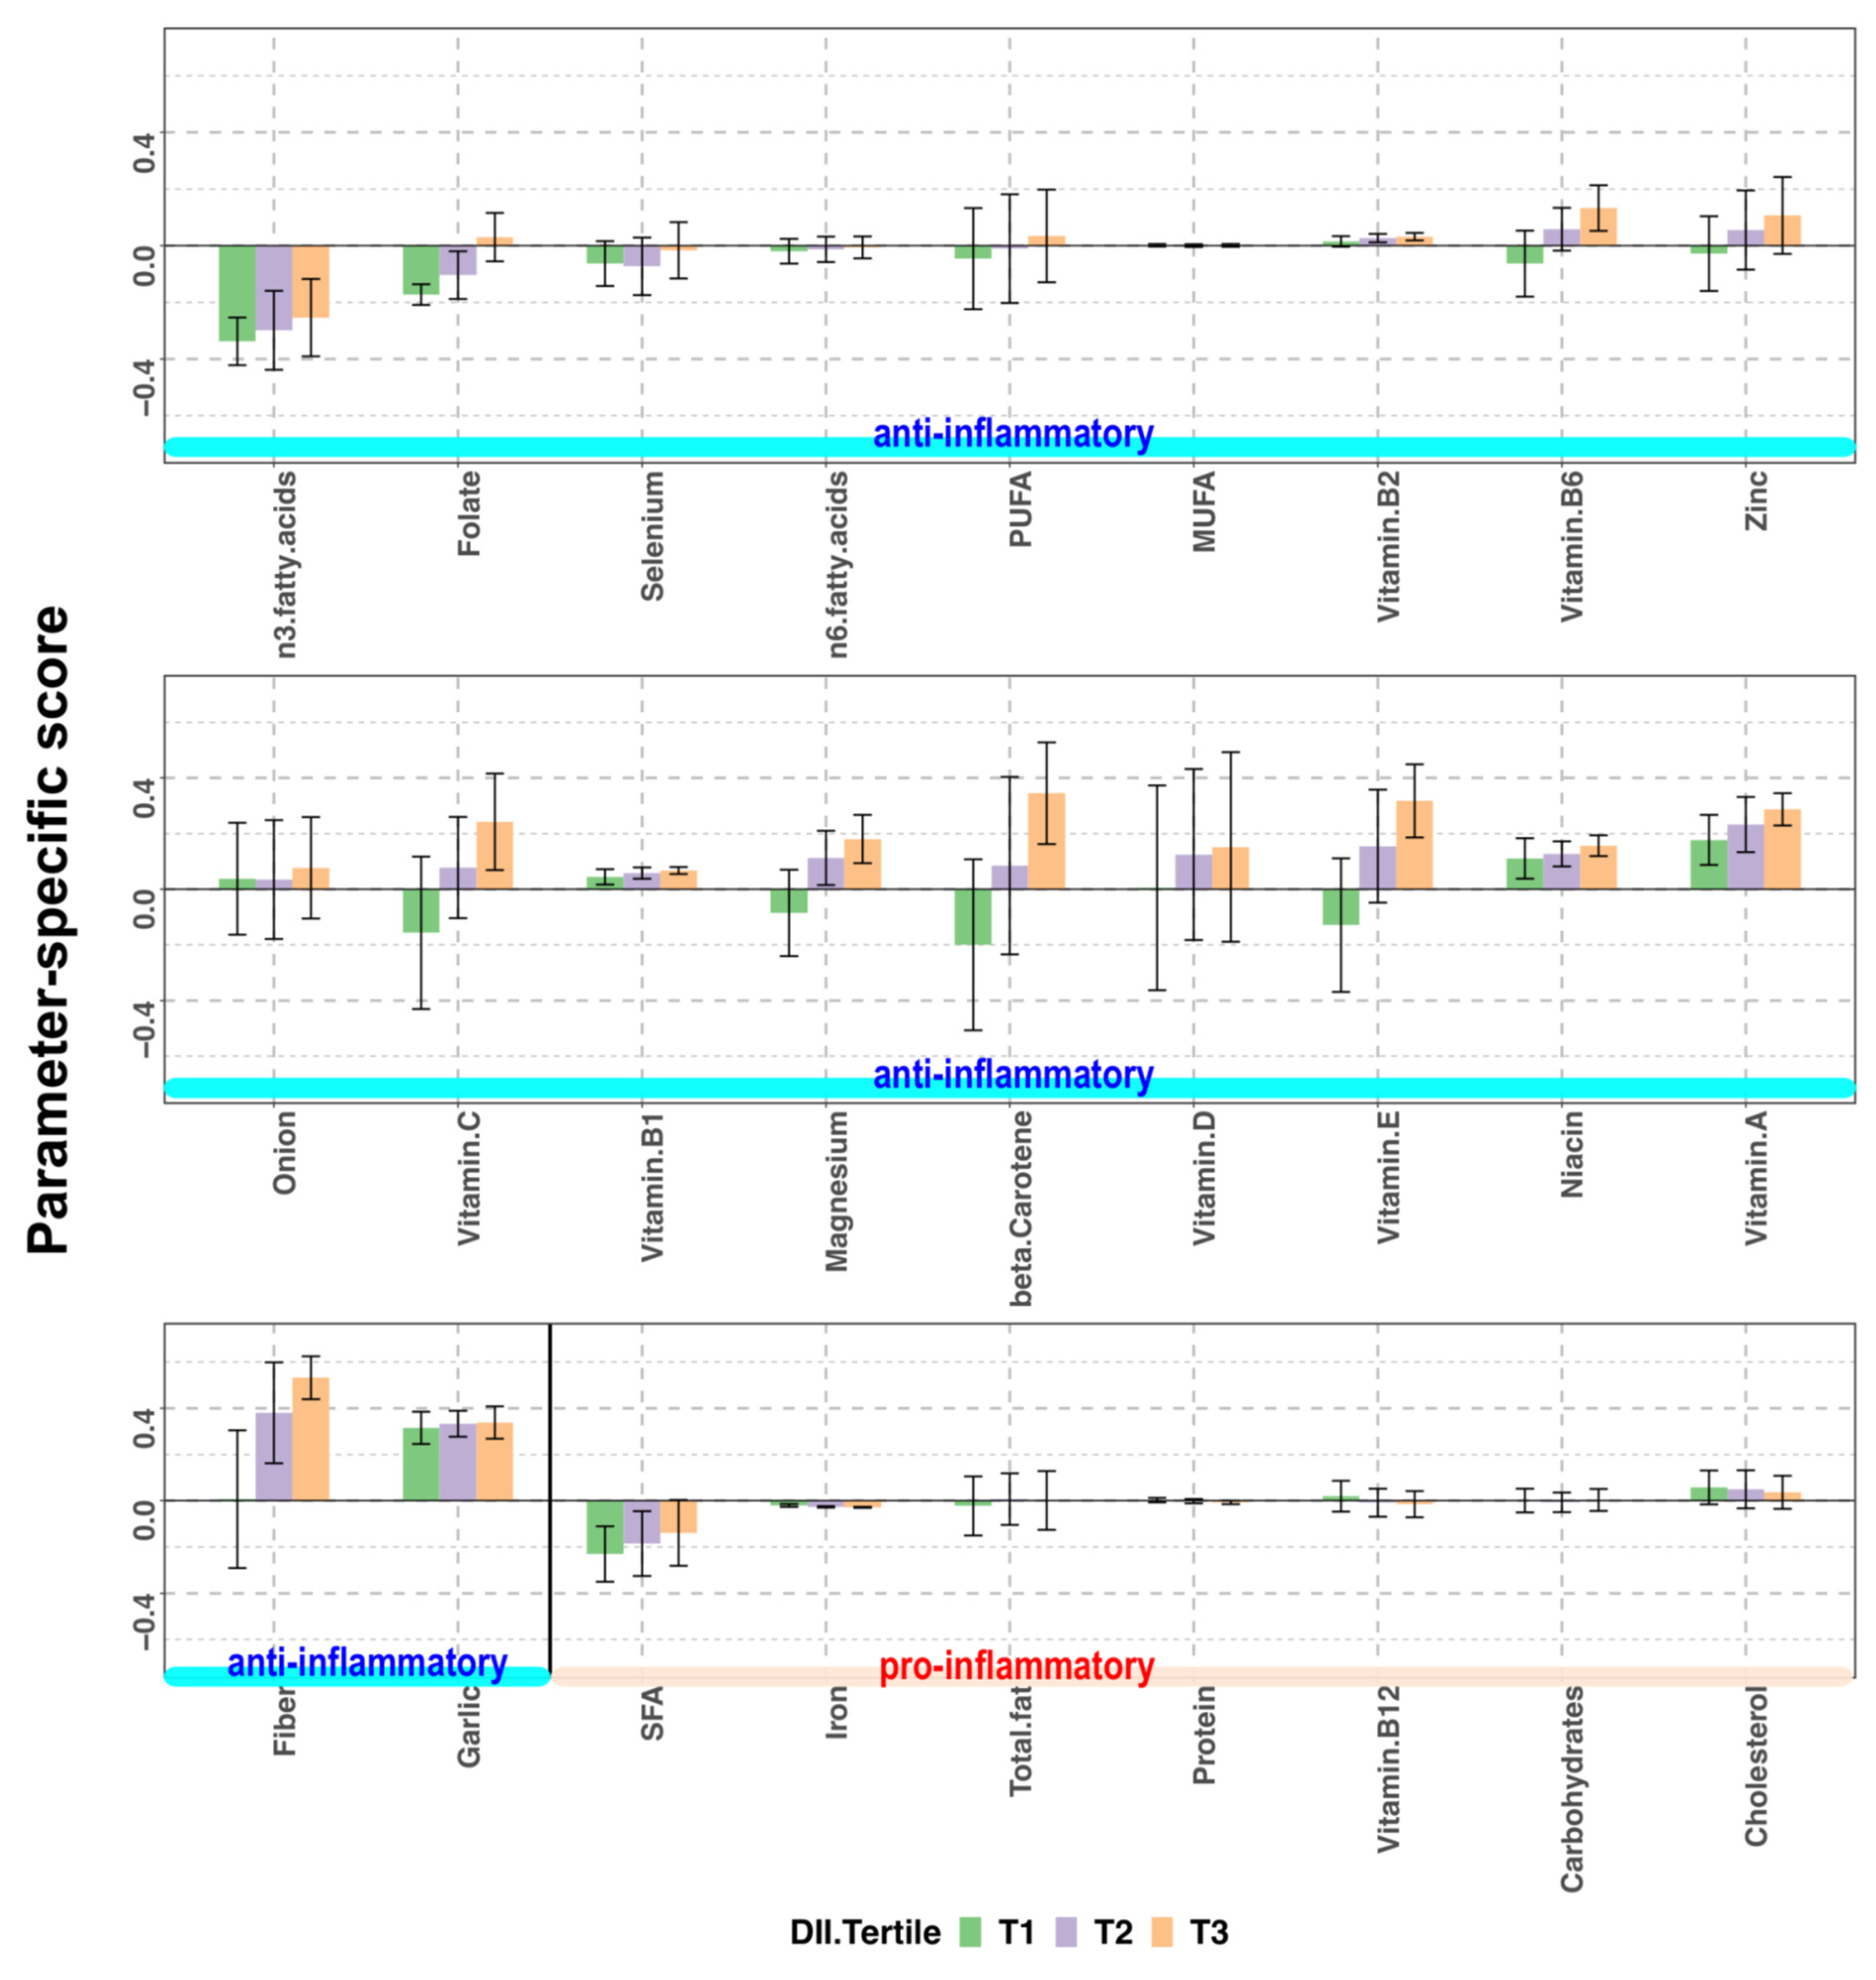
3.3. Breakdown of E-DII into Parameter-Specific Scores by Tertile Groups
3.4. Food Group Intake Profiles by Tertiles of NRF9.3 and E-DII Scores
3.5. Sensitivity Analysis
4. Discussion
5. Conclusions
Supplementary Materials
Author Contributions
Funding
Institutional Review Board Statement
Informed Consent Statement
Data Availability Statement
Acknowledgments
Conflicts of Interest
References
- Barker, D.J.; Hales, C.N.; Fall, C.H.; Osmond, C.; Phipps, K.; Clark, P.M. Type 2 (non-insulin-dependent) diabetes mellitus, hypertension and hyperlipidaemia (syndrome X): Relation to reduced fetal growth. Diabetologia 1993, 36, 62–67. [Google Scholar] [CrossRef] [PubMed]
- Barker, D.J. The origins of the developmental origins theory. J. Intern. Med. 2007, 261, 412–417. [Google Scholar] [CrossRef] [PubMed]
- Hanson, M.A.; Gluckman, P.D. Early developmental conditioning of later health and disease: Physiology or pathophysiology? Physiol. Rev. 2014, 94, 1027–1076. [Google Scholar] [CrossRef]
- Abu-Saad, K.; Fraser, D. Maternal nutrition and birth outcomes. Epidemiol. Rev. 2010, 32, 5–25. [Google Scholar] [CrossRef] [PubMed]
- Eshak, E.S.; Okada, C.; Baba, S.; Kimura, T.; Ikehara, S.; Sato, T.; Shirai, K.; Iso, H. Maternal total energy, macronutrient and vitamin intakes during pregnancy associated with the offspring’s birth size in the Japan Environment and Children’s Study. Br. J. Nutr. 2020, 124, 558–566. [Google Scholar] [CrossRef]
- Morisaki, N.; Nagata, C.; Yasuo, S.; Morokuma, S.; Kato, K.; Sanefuji, M.; Shibata, E.; Tsuji, M.; Senju, A.; Kawamoto, T.; et al. Optimal protein intake during pregnancy for reducing the risk of fetal growth restriction: The Japan Environment and Children’s Study. Br. J. Nutr. 2018, 120, 1432–1440. [Google Scholar] [CrossRef]
- McKee, S.E.; Reyes, T.M. Effect of supplementation with methyl-donor nutrients on neurodevelopment and cognition: Considerations for future research. Nutr. Rev. 2018, 76, 497–511. [Google Scholar] [CrossRef]
- Massari, M.; Novielli, C.; Mandò, C.; Di Francesco, S.; Della Porta, M.; Cazzola, R.; Panteghini, M.; Savasi, V.; Maggini, S.; Schaefer, E.; et al. Multiple Micronutrients and Docosahexaenoic Acid Supplementation during Pregnancy: A Randomized Controlled Study. Nutrients 2020, 12, 2432. [Google Scholar] [CrossRef]
- Chia, A.R.; Tint, M.T.; Han, C.Y.; Chen, L.W.; Colega, M.; Aris, I.M.; Chua, M.C.; Tan, K.H.; Yap, F.; Shek, L.P.; et al. Adherence to a healthy eating index for pregnant women is associated with lower neonatal adiposity in a multiethnic Asian cohort: The Growing Up in Singapore Towards healthy Outcomes (GUSTO) Study. Am. J. Clin. Nutr. 2018, 107, 71–79. [Google Scholar] [CrossRef]
- Rifas-Shiman, S.L.; Rich-Edwards, J.W.; Kleinman, K.P.; Oken, E.; Gillman, M.W. Dietary quality during pregnancy varies by maternal characteristics in Project Viva: A US cohort. J. Am. Diet. Assoc. 2009, 109, 1004–1011. [Google Scholar] [CrossRef]
- Chen, L.W.; Aubert, A.M.; Shivappa, N.; Bernard, J.Y.; Mensink-Bout, S.M.; Geraghty, A.A.; Mehegan, J.; Suderman, M.; Polanska, K.; Hanke, W.; et al. Associations of maternal dietary inflammatory potential and quality with offspring birth outcomes: An individual participant data pooled analysis of 7 European cohorts in the ALPHABET consortium. PLoS Med. 2021, 18, e1003491. [Google Scholar] [CrossRef] [PubMed]
- Okubo, H.; Miyake, Y.; Sasaki, S.; Tanaka, K.; Murakami, K.; Hirota, Y.; Kanzaki, H.; Kitada, M.; Horikoshi, Y.; Ishiko, O.; et al. Maternal dietary patterns in pregnancy and fetal growth in Japan: The Osaka Maternal and Child Health Study. Br. J. Nutr. 2012, 107, 1526–1533. [Google Scholar] [CrossRef]
- Lu, M.S.; Chen, Q.Z.; He, J.R.; Wei, X.L.; Lu, J.H.; Li, S.H.; Wen, X.X.; Chan, F.F.; Chen, N.N.; Qiu, L.; et al. Maternal Dietary Patterns and Fetal Growth: A Large Prospective Cohort Study in China. Nutrients 2016, 8, 257. [Google Scholar] [CrossRef] [PubMed]
- Yang, J.; Kang, Y.; Cheng, Y.; Zeng, L.; Yan, H.; Dang, S. Maternal Dietary Patterns during Pregnancy and Congenital Heart Defects: A Case-Control Study. Int. J. Environ. Res. Public Health 2019, 16, 2957. [Google Scholar] [CrossRef] [PubMed]
- Mi, B.; Wen, X.; Li, S.; Liu, D.; Lei, F.; Liu, R.; Shen, Y.; Chen, Y.; Zeng, L.; Liu, X.; et al. Vegetable dietary pattern associated with low risk of preeclampsia possibly through reducing proteinuria. Pregnancy Hypertens. 2019, 16, 131–138. [Google Scholar] [CrossRef]
- DU, H.Y.; Jiang, H.; Karmin, O.; Chen, B.; Xu, L.J.; Liu, S.P.; Yi, J.P.; He, G.S.; Qian, X. Association of Dietary Pattern during Pregnancy and Gestational Diabetes Mellitus: A Prospective Cohort Study in Northern China. Biomed. Environ. Sci. 2017, 30, 887–897. [Google Scholar] [CrossRef] [PubMed]
- Murakami, K.; Livingstone, M.B.E.; Fujiwara, A.; Sasaki, S. Reproducibility and Relative Validity of the Healthy Eating Index-2015 and Nutrient-Rich Food Index 9.3 Estimated by Comprehensive and Brief Diet History Questionnaires in Japanese Adults. Nutrients 2019, 11, 2540. [Google Scholar] [CrossRef]
- Sluik, D.; Streppel, M.T.; van Lee, L.; Geelen, A.; Feskens, E.J. Evaluation of a nutrient-rich food index score in the Netherlands. J. Nutr. Sci. 2015, 4, e14. [Google Scholar] [CrossRef]
- Shivappa, N.; Steck, S.E.; Hurley, T.G.; Hussey, J.R.; Hébert, J.R. Designing and developing a literature-derived, population-based dietary inflammatory index. Public Health Nutr. 2014, 17, 1689–1696. [Google Scholar] [CrossRef]
- Hébert, J.R.; Shivappa, N.; Wirth, M.D.; Hussey, J.R.; Hurley, T.G. Perspective: The Dietary Inflammatory Index (DII)-Lessons Learned, Improvements Made, and Future Directions. Adv. Nutr. 2019, 10, 185–195. [Google Scholar] [CrossRef]
- Drewnowski, A. The Nutrient Rich Foods Index helps to identify healthy, affordable foods. Am. J. Clin. Nutr. 2010, 91, 1095S–1101S. [Google Scholar] [CrossRef]
- Francou, A.; Hebel, P.; Braesco, V.; Drewnowski, A. Consumption Patterns of Fruit and Vegetable Juices and Dietary Nutrient Density among French Children and Adults. Nutrients 2015, 7, 6073–6087. [Google Scholar] [CrossRef]
- Phillips, C.M.; Chen, L.W.; Heude, B.; Bernard, J.Y.; Harvey, N.C.; Duijts, L.; Mensink-Bout, S.M.; Polanska, K.; Mancano, G.; Suderman, M.; et al. Dietary Inflammatory Index and Non-Communicable Disease Risk: A Narrative Review. Nutrients 2019, 11, 1873. [Google Scholar] [CrossRef] [PubMed]
- Mazidi, M.; Shivappa, N.; Wirth, M.D.; Hebert, J.R.; Mikhailidis, D.P.; Kengne, A.P.; Banach, M. Dietary inflammatory index and cardiometabolic risk in US adults. Atherosclerosis 2018, 276, 23–27. [Google Scholar] [CrossRef] [PubMed]
- Kotemori, A.; Sawada, N.; Iwasaki, M.; Yamaji, T.; Shivappa, N.; Hebert, J.R.; Ishihara, J.; Inoue, M.; Tsugane, S.; Group, J.F.V.S. Validating the dietary inflammatory index using inflammatory biomarkers in a Japanese population: A cross-sectional study of the JPHC-FFQ validation study. Nutrition 2020, 69, 110569. [Google Scholar] [CrossRef]
- Yang, J.; Dang, S.; Cheng, Y.; Qiu, H.; Mi, B.; Jiang, Y.; Qu, P.; Zeng, L.; Wang, Q.; Li, Q.; et al. Dietary intakes and dietary patterns among pregnant women in Northwest China. Public Health Nutr. 2017, 20, 282–293. [Google Scholar] [CrossRef]
- Shin, D.; Hur, J.; Cho, E.H.; Chung, H.K.; Shivappa, N.; Wirth, M.D.; Hébert, J.R.; Lee, K.W. Pre-Pregnancy Body Mass Index Is Associated with Dietary Inflammatory Index and C-Reactive Protein Concentrations during Pregnancy. Nutrients 2017, 9, 351. [Google Scholar] [CrossRef]
- Polanska, K.; Kaluzny, P.; Aubert, A.M.; Bernard, J.Y.; Duijts, L.; El Marroun, H.; Hanke, W.; Hébert, J.R.; Heude, B.; Jankowska, A.; et al. Dietary Quality and Dietary Inflammatory Potential During Pregnancy and Offspring Emotional and Behavioral Symptoms in Childhood: An Individual Participant Data Meta-analysis of Four European Cohorts. Biol. Psychiatry 2021, 89, 550–559. [Google Scholar] [CrossRef]
- Ishibashi, M.; Kyozuka, H.; Yamaguchi, A.; Fujimori, K.; Hosoya, M.; Yasumura, S.; Masahito, K.; Sato, A.; Ogata, Y.; Hashimoto, K.; et al. Effect of proinflammatory diet before pregnancy on gestational age and birthweight: The Japan Environment and Children’s Study. Matern. Child Nutr. 2019, 16, e12899. [Google Scholar] [CrossRef] [PubMed]
- Sen, S.; Rifas-Shiman, S.L.; Shivappa, N.; Wirth, M.D.; Hébert, J.R.; Gold, D.R.; Gillman, M.W.; Oken, E. Dietary Inflammatory Potential during Pregnancy Is Associated with Lower Fetal Growth and Breastfeeding Failure: Results from Project Viva. J. Nutr. 2016, 146, 728–736. [Google Scholar] [CrossRef]
- Miller, V.; Webb, P.; Micha, R.; Mozaffarian, D.; Database, G.D. Defining diet quality: A synthesis of dietary quality metrics and their validity for the double burden of malnutrition. Lancet Planet Health 2020, 4, e352–e370. [Google Scholar] [CrossRef]
- Pavethynath, S.; Imai, C.; Jin, X.; Hichiwa, N.; Takimoto, H.; Okamitsu, M.; Tarui, I.; Aoyama, T.; Yago, S.; Fudono, A.; et al. Metabolic and Immunological Shifts during Mid-to-Late Gestation Influence Maternal Blood Methylation of. Int. J. Mol. Sci. 2019, 20, 1066. [Google Scholar] [CrossRef]
- Date, C.; Fukui, M.; Yoshiike, N.; Tamagawa, Y.; Nakagami, S. Photo-Book of Typical Japanese Foods; Dai-ichi Shuppan Publishing: Tokyo, Japan, 2002. (In Japanese) [Google Scholar]
- Ministry of Education, Culture, Sports, Science and Technology. Standard Tables of Food Composition in Japan 2015, 7th ed.; Ministry of Education, Culture, Sports, Science and Technology: Tokyo, Japan, 2015.
- National Institute of Health and Nutrition, J. Nutritional Intake Status Survey. Available online: https://www.nibiohn.go.jp/eiken/kenkounippon21/en/eiyouchousa/koumoku_eiyou_chousa_select.html (accessed on 13 May 2021).
- Fujiwara, A.; Murakami, K.; Asakura, K.; Uechi, K.; Sugimoto, M.; Wang, H.C.; Masayasu, S.; Sasaki, S. Estimation of Starch and Sugar Intake in a Japanese Population Based on a Newly Developed Food Composition Database. Nutrients 2018, 10, 1474. [Google Scholar] [CrossRef]
- Murakami, K.; Livingstone, M.B.E.; Fujiwara, A.; Sasaki, S. Breakfast in Japan: Findings from the 2012 National Health and Nutrition Survey. Nutrients 2018, 10, 1551. [Google Scholar] [CrossRef]
- Ministry of Health, L.a.W. Japan Dietary Reference Intakes for Japanese 2015. Available online: http://www.mhlw.go.jp/stf/seisakunitsuite/bunya/0000208970.html (accessed on 17 March 2020).
- World Health Organization. Guideline: Sugars Intake for Adults and Children; WHO: Geneva, Switzerland, 2015. [Google Scholar]
- Fujiwara, A.; Murakami, K.; Asakura, K.; Uechi, K.; Sugimoto, M.; Wang, H.C.; Masayasu, S.; Sasaki, S. Association of Free Sugar Intake Estimated Using a Newly-Developed Food Composition Database With Lifestyles and Parental Characteristics Among Japanese Children Aged 3-6 Years: DONGuRI Study. J. Epidemiol. 2019, 29, 414–423. [Google Scholar] [CrossRef]
- Shivappa, N.; Steck, S.E.; Hurley, T.G.; Hussey, J.R.; Ma, Y.; Ockene, I.S.; Tabung, F.; Hébert, J.R. A population-based dietary inflammatory index predicts levels of C-reactive protein in the Seasonal Variation of Blood Cholesterol Study (SEASONS). Public Health Nutr. 2014, 17, 1825–1833. [Google Scholar] [CrossRef]
- Livingstone, M.B.; Black, A.E. Markers of the validity of reported energy intake. J. Nutr. 2003, 133 (Suppl. 3), 895S–920S. [Google Scholar] [CrossRef] [PubMed]
- Maugeri, A.; Barchitta, M.; Favara, G.; La Rosa, M.C.; La Mastra, C.; Magnano San Lio, R.; Agodi, A. Maternal Dietary Patterns Are Associated with Pre-Pregnancy Body Mass Index and Gestational Weight Gain: Results from the “Mamma & Bambino” Cohort. Nutrients 2019, 11, 1308. [Google Scholar] [CrossRef]
- Murakami, K.; Miyake, Y.; Sasaki, S.; Tanaka, K.; Ohya, Y.; Hirota, Y.; Group, O.M.a.C.H.S. Education, but not occupation or household income, is positively related to favorable dietary intake patterns in pregnant Japanese women: The Osaka Maternal and Child Health Study. Nutr. Res. 2009, 29, 164–172. [Google Scholar] [CrossRef]
- Ganpule, A.A.; Tanaka, S.; Ishikawa-Takata, K.; Tabata, I. Interindividual variability in sleeping metabolic rate in Japanese subjects. Eur. J. Clin. Nutr. 2007, 61, 1256–1261. [Google Scholar] [CrossRef]
- Black, A.E.; Cole, T.J. Within- and between-subject variation in energy expenditure measured by the doubly-labelled water technique: Implications for validating reported dietary energy intake. Eur. J. Clin. Nutr. 2000, 54, 386–394. [Google Scholar] [CrossRef]
- Nowicki, E.; Siega-Riz, A.M.; Herring, A.; He, K.; Stuebe, A.; Olshan, A. Predictors of measurement error in energy intake during pregnancy. Am. J. Epidemiol. 2011, 173, 560–568. [Google Scholar] [CrossRef]
- Yang, Y.; Kan, H.; Yu, X.; Li, L.; Zhao, M. Relationship between dietary inflammatory index, hs-CRP level in the second trimester and neonatal birth weight: A cohort study. J. Clin. Biochem. Nutr. 2020, 66, 163–167. [Google Scholar] [CrossRef]
- Gete, D.G.; Waller, M.; Mishra, G.D. Effects of maternal diets on preterm birth and low birth weight: A systematic review. Br. J. Nutr. 2020, 123, 446–461. [Google Scholar] [CrossRef]
- Tomata, Y.; Zhang, S.; Kaiho, Y.; Tanji, F.; Sugawara, Y.; Tsuji, I. Nutritional characteristics of the Japanese diet: A cross-sectional study of the correlation between Japanese Diet Index and nutrient intake among community-based elderly Japanese. Nutrition 2019, 57, 115–121. [Google Scholar] [CrossRef]
- Morisaki, N.; Nagata, C.; Jwa, S.C.; Sago, H.; Saito, S.; Oken, E.; Fujiwara, T. Pre-pregnancy BMI-specific optimal gestational weight gain for women in Japan. J. Epidemiol. 2017, 27, 492–498. [Google Scholar] [CrossRef]
- Ishiwaki, A.; Yokoyama, T.; Fujii, H.; Saito, K.; Nozue, M.; Yoshita, K.; Yoshiike, N. A statistical approach for estimating the distribution of usual dietary intake to assess nutritionally at-risk populations based on the new Japanese Dietary Reference Intakes (DRIs). J. Nutr. Sci. Vitaminol. 2007, 53, 337–344. [Google Scholar] [CrossRef][Green Version]


| Characteristics | NRF9.3 | E-DII | ||||||
|---|---|---|---|---|---|---|---|---|
| T1 (n = 36) | T2 (n = 36) | T3 (n = 36) | p Value a | T1 (n = 36) | T2 (n = 36) | T3 (n = 36) | p Value a | |
| Maternal age (years) | 32.6 ± 4.1 | 34.8 ± 4.3 | 34.2 ± 3.8 | 0.069 | 34.7 ± 4.0 | 33.8 ± 4.0 | 33.1 ± 4.4 | 0.258 |
| Height (cm) | 159.4 ± 5.2 | 158.6 ± 6.0 | 159.7 ± 5.3 | 0.673 | 160.2 ± 4.7 | 159.0 ± 6.6 | 158.5 ± 4.9 | 0.390 |
| Pre-pregnancy weight (kg) | 53.9 ± 6.8 | 54.0 ± 9.5 | 51.1 ± 7.7 | 0.223 | 52.3 ± 8.7 | 53.3 ± 9.1 | 53.4 ± 6.5 | 0.813 |
| Pre-pregnancy BMI (kg/cm2) | 21.3 ± 2.9 | 21.4 ± 2.8 | 20.0 ± 2.6 | 0.064 | 20.3 ± 3 | 21.0 ± 2.9 | 21.2 ± 2.5 | 0.350 |
| Parity (multipara) | 18 (50) | 16 (44.4) | 22 (61.1) | 0.354 | 19 (52.8) | 19 (52.8) | 18 (50) | 0.964 |
| Energy intake (EI) (kcal/day) b | 1690 ± 280 | 1651 ± 271 | 1698 ± 286 | 0.747 | 1714 ± 303 | 1648 ± 247 | 1677 ± 283 | 0.607 |
| Smoking in pregnancy | 0 (0) | 0 (0) | 0 (0) | − | 0 (0) | 0 (0) | 0 (0) | − |
| Maternal educational attainment, university or higher degree | 23 (63.9) | 25 (69.4) | 26 (72.2) | 0.741 | 26 (72.2) | 28 (77.8) | 20 (55.6) | 0.107 |
| Household income (≥ 6 million yen per year) | 24 (68.6) | 25 (69.4) | 25 (69.4) | 0.996 | 24 (66.7) | 29 (80.6) | 21 (60.0) | 0.159 |
| Fetal sex, male | 21 (58.3) | 13 (36.1) | 18 (50) | 0.163 | 19 (52.8) | 16 (44.4) | 17 (47.2) | 0.771 |
| Food Group (g) | T1 (n = 36) | T2 (n = 36) | T3 (n = 36) | p for Trend a |
|---|---|---|---|---|
| Rice and Rice products | 131.5 ± 67.7 | 124.1 ± 42.6 | 146.6 ± 61.2 | 0.44 |
| Wheat flour and Wheat products | 76.6 ± 46.7 | 85.8 ± 43 | 73.7 ± 53.6 | 0.93 |
| Potatoes | 11.8 ± 13.2 | 18.1 ± 15.9 | 22.0 ± 20.3 | 0.015 |
| Legumes | 16.7 ± 15.5 | 23.6 ± 24.8 | 33.9 ± 30.7 | 0.0062 |
| Seeds and Nuts | 0.7 ± 1.3 | 1.0 ± 1.9 | 0.9 ± 1.6 | 0.79 |
| Vegetables | 101.3 ± 46.6 | 135.1 ± 56.5 | 167.5 ± 69.8 | <0.0001 |
| Fruits | 25.5 ± 26.9 | 35.4 ± 32.3 | 59.6 ± 52.7 | 0.00011 |
| Mushrooms | 5.2 ± 5.6 | 6.4 ± 8.4 | 6.4 ± 7.0 | 0.59 |
| Seaweeds | 3.9 ± 4.7 | 7.7 ± 9.1 | 7.1 ± 7.8 | 0.038 |
| Fish and Shellfish | 8.8 ± 10.0 | 18.7 ± 20.9 | 22.8 ± 20.6 | 0.00077 |
| Meat and Poultry | 57.9 ± 25.5 | 55.3 ± 26.2 | 51.9 ± 26.4 | 0.35 |
| Egg | 15.6 ± 13.0 | 22.1 ± 15.1 | 20.2 ± 12.7 | 0.078 |
| Milk and Dairy Products | 95.4 ± 86.6 | 95.4 ± 68.3 | 82.5 ± 65.1 | 0.49 |
| Fats and oils | 6.1 ± 2.9 | 6.4 ± 3.5 | 4.7 ± 2.3 | 0.021 |
| Confectionery | 25.9 ± 28.4 | 19.2 ± 19.5 | 16.8 ± 16.1 | 0.044 |
| Sugar-sweetened beverages | 54.4 ± 71.9 | 43.7 ± 66.4 | 26.4 ± 30.0 | 0.051 |
| Seasonings and Spices | 30.0 ± 13.0 | 28.0 ± 9.6 | 28.2 ± 10.2 | 0.90 |
| Food Group (g) | T1 (n = 36) | T2 (n = 36) | T3 (n = 36) | p for Trend a |
|---|---|---|---|---|
| Rice and Rice products | 133.3 ± 59.7 | 130.9 ± 50.1 | 137.9 ± 65.7 | 0.53 |
| Wheat flour and Wheat products | 61.8 ± 44.1 | 88.6 ± 46.9 | 85.8 ± 49.0 | 0.039 |
| Potatoes | 20.5 ± 19.9 | 17.3 ± 17.7 | 14.1 ± 12.7 | 0.17 |
| Legumes | 40.6 ± 33.9 | 17.8 ± 14.3 | 15.8 ± 14.5 | <0.0001 |
| Seeds and Nuts | 1.0 ± 1.9 | 0.8 ± 1.5 | 0.7 ± 1.3 | 0.76 |
| Vegetables | 178.5 ± 60 | 141.3 ± 54.1 | 84.1 ± 35.8 | <0.0001 |
| Fruits | 55.8 ± 55.6 | 33.0 ± 26.4 | 31.7 ± 31.8 | 0.0067 |
| Mushrooms | 6.9 ± 8.3 | 6.0 ± 7.0 | 5.1 ± 5.7 | 0.38 |
| Seaweeds | 7.5 ± 8.5 | 6.4 ± 7.2 | 4.8 ± 6.8 | 0.058 |
| Fish and Shellfish | 24.0 ± 25.2 | 14.4 ± 14 | 11.9 ± 12.3 | 0.0068 |
| Meat and Poultry | 53.8 ± 25.5 | 58.3 ± 27.9 | 53.0 ± 24.6 | 0.88 |
| Egg | 20.9 ± 14 | 20.9 ± 15.1 | 16.1 ± 11.8 | 0.069 |
| Milk and Dairy Products | 89.6 ± 73.4 | 83.4 ± 67.7 | 100.2 ± 80.0 | 0.53 |
| Fats and oils | 5.3 ± 2.6 | 6.2 ± 3.6 | 5.7 ± 2.7 | 0.43 |
| Confectionery | 19.8 ± 19.7 | 19.3 ± 20.1 | 22.9 ± 26.3 | 0.45 |
| Sugar-sweetened beverages | 37.4 ± 58.6 | 30.7 ± 47.0 | 56.3 ± 70.0 | 0.16 |
| Seasonings and Spices | 30.3 ± 10.7 | 29.0 ± 10.8 | 26.9 ± 11.4 | 0.061 |
| Food Group (g) | T1 (n = 30) | T2 (n = 30) | T3 (n = 31) | p for Trend a |
|---|---|---|---|---|
| Rice and Rice products | 132.7 ± 68.0 | 122.8 ± 44.3 | 152.2 ± 61.9 | 0.30 |
| Wheat flour and Wheat products | 69.1 ± 45.6 | 85.8 ± 44.5 | 66.5 ± 49.5 | 0.79 |
| Potatoes | 10.3 ± 10.2 | 18.9 ± 15.9 | 21.9 ± 21.5 | 0.015 |
| Legumes | 16.5 ± 14.2 | 25.1 ± 26.4 | 30.7 ± 30.0 | 0.11 |
| Seeds and Nuts | 0.7 ± 1.3 | 1.2 ± 2.0 | 0.9 ± 1.6 | 0.96 |
| Vegetables | 110.0 ± 44.5 | 130.9 ± 46.8 | 163.4 ± 63.7 | 0.00044 |
| Fruits | 22.1 ± 22.7 | 35.1 ± 31.9 | 60.4 ± 46.9 | <0.0001 |
| Mushrooms | 6.0 ± 5.9 | 6.4 ± 8.9 | 7.0 ± 7.2 | 0.59 |
| Seaweeds | 3.3 ± 3.4 | 7.6 ± 9.4 | 5.8 ± 6.2 | 0.33 |
| Fish and Shellfish | 9.2 ± 10.7 | 20.3 ± 21.9 | 18.6 ± 15.5 | 0.14 |
| Meat and Poultry | 61.0 ± 24.6 | 51.7 ± 24.7 | 55.7 ± 25.8 | 0.57 |
| Egg | 14.8 ± 13.4 | 22.0 ± 15.4 | 19.3 ± 12.2 | 0.14 |
| Milk and Dairy Products | 94.3 ± 90.1 | 89.5 ± 70.3 | 85.1 ± 67.9 | 0.73 |
| Fats and oils | 5.6 ± 2.6 | 6.3 ± 3.6 | 4.6 ± 2.4 | 0.10 |
| Confectionery | 25.2 ± 26.5 | 21.0 ± 20.3 | 18.4 ± 15.8 | 0.13 |
| Sugar-sweetened beverages | 60.6 ± 76.2 | 43.6 ± 66.6 | 28.9 ± 32.9 | 0.088 |
| Seasonings and Spices | 30.3 ± 12.3 | 28.3 ± 10.2 | 27.0 ± 10.8 | 0.43 |
| Food Group (g) | T1 (n = 30) | T2 (n = 30) | T3 (n = 31) | p for Trend a |
|---|---|---|---|---|
| Rice and Rice products | 139.5 ± 61.5 | 125.4 ± 52.5 | 143.0 ± 64.4 | 0.66 |
| Wheat flour and Wheat products | 53.3 ± 42.0 | 86.7 ± 43.9 | 80.8 ± 48.8 | 0.0090 |
| Potatoes | 22.1 ± 20.5 | 15.8 ± 18.6 | 13.6 ± 9.9 | 0.12 |
| Legumes | 39.0 ± 34.9 | 17.5 ± 14.6 | 16.2 ± 12.7 | 0.0015 |
| Seeds and Nuts | 1.2 ± 2.1 | 0.9 ± 1.5 | 0.8 ± 1.4 | 0.74 |
| Vegetables | 174.7 ± 53.7 | 140.2 ± 44.6 | 91.8 ± 36.4 | <0.0001 |
| Fruits | 55.9 ± 49.9 | 34.2 ± 27.5 | 28.6 ± 30.0 | 0.0080 |
| Mushrooms | 7.5 ± 8.8 | 6.1 ± 7.4 | 5.8 ± 5.8 | 0.34 |
| Seaweeds | 6.3 ± 7.2 | 5.8 ± 7.3 | 4.7 ± 6.4 | 0.57 |
| Fish and Shellfish | 21.3 ± 22.5 | 14.4 ± 13.9 | 12.7 ± 12.9 | 0.28 |
| Meat and Poultry | 53.5 ± 24.5 | 59.3 ± 27.2 | 55.6 ± 24.0 | 0.95 |
| Egg | 19.6 ± 13.5 | 21.2 ± 16.0 | 15.5 ± 11.9 | 0.13 |
| Milk and Dairy Products | 93.4 ± 78 | 77.3 ± 66.9 | 97.8 ± 82.7 | 0.77 |
| Fats and oils | 5.2 ± 2.7 | 6.3 ± 3.7 | 5.0 ± 2.1 | 0.92 |
| Confectionery | 21.2 ± 19.7 | 22.8 ± 20.9 | 20.6 ± 23.5 | 0.98 |
| Sugar-sweetened beverages | 40.9 ± 62.4 | 34.7 ± 50.4 | 56.5 ± 70.8 | 0.40 |
| Seasonings and Spices | 29.6 ± 11.5 | 29.3 ± 11.7 | 26.7 ± 10.1 | 0.12 |
Publisher’s Note: MDPI stays neutral with regard to jurisdictional claims in published maps and institutional affiliations. |
© 2021 by the authors. Licensee MDPI, Basel, Switzerland. This article is an open access article distributed under the terms and conditions of the Creative Commons Attribution (CC BY) license (https://creativecommons.org/licenses/by/4.0/).
Share and Cite
Imai, C.; Takimoto, H.; Fudono, A.; Tarui, I.; Aoyama, T.; Yago, S.; Okamitsu, M.; Sasaki, S.; Mizutani, S.; Miyasaka, N.; et al. Application of the Nutrient-Rich Food Index 9.3 and the Dietary Inflammatory Index for Assessing Maternal Dietary Quality in Japan: A Single-Center Birth Cohort Study. Nutrients 2021, 13, 2854. https://doi.org/10.3390/nu13082854
Imai C, Takimoto H, Fudono A, Tarui I, Aoyama T, Yago S, Okamitsu M, Sasaki S, Mizutani S, Miyasaka N, et al. Application of the Nutrient-Rich Food Index 9.3 and the Dietary Inflammatory Index for Assessing Maternal Dietary Quality in Japan: A Single-Center Birth Cohort Study. Nutrients. 2021; 13(8):2854. https://doi.org/10.3390/nu13082854
Chicago/Turabian StyleImai, Chihiro, Hidemi Takimoto, Ayako Fudono, Iori Tarui, Tomoko Aoyama, Satoshi Yago, Motoko Okamitsu, Satoshi Sasaki, Shuki Mizutani, Naoyuki Miyasaka, and et al. 2021. "Application of the Nutrient-Rich Food Index 9.3 and the Dietary Inflammatory Index for Assessing Maternal Dietary Quality in Japan: A Single-Center Birth Cohort Study" Nutrients 13, no. 8: 2854. https://doi.org/10.3390/nu13082854
APA StyleImai, C., Takimoto, H., Fudono, A., Tarui, I., Aoyama, T., Yago, S., Okamitsu, M., Sasaki, S., Mizutani, S., Miyasaka, N., & Sato, N. (2021). Application of the Nutrient-Rich Food Index 9.3 and the Dietary Inflammatory Index for Assessing Maternal Dietary Quality in Japan: A Single-Center Birth Cohort Study. Nutrients, 13(8), 2854. https://doi.org/10.3390/nu13082854