
A Randomized Pilot Study of DASH Patterned Groceries on Serum Urate in Individuals with Gout

 , and
, and
Abstract
1. Introduction
2. Methods
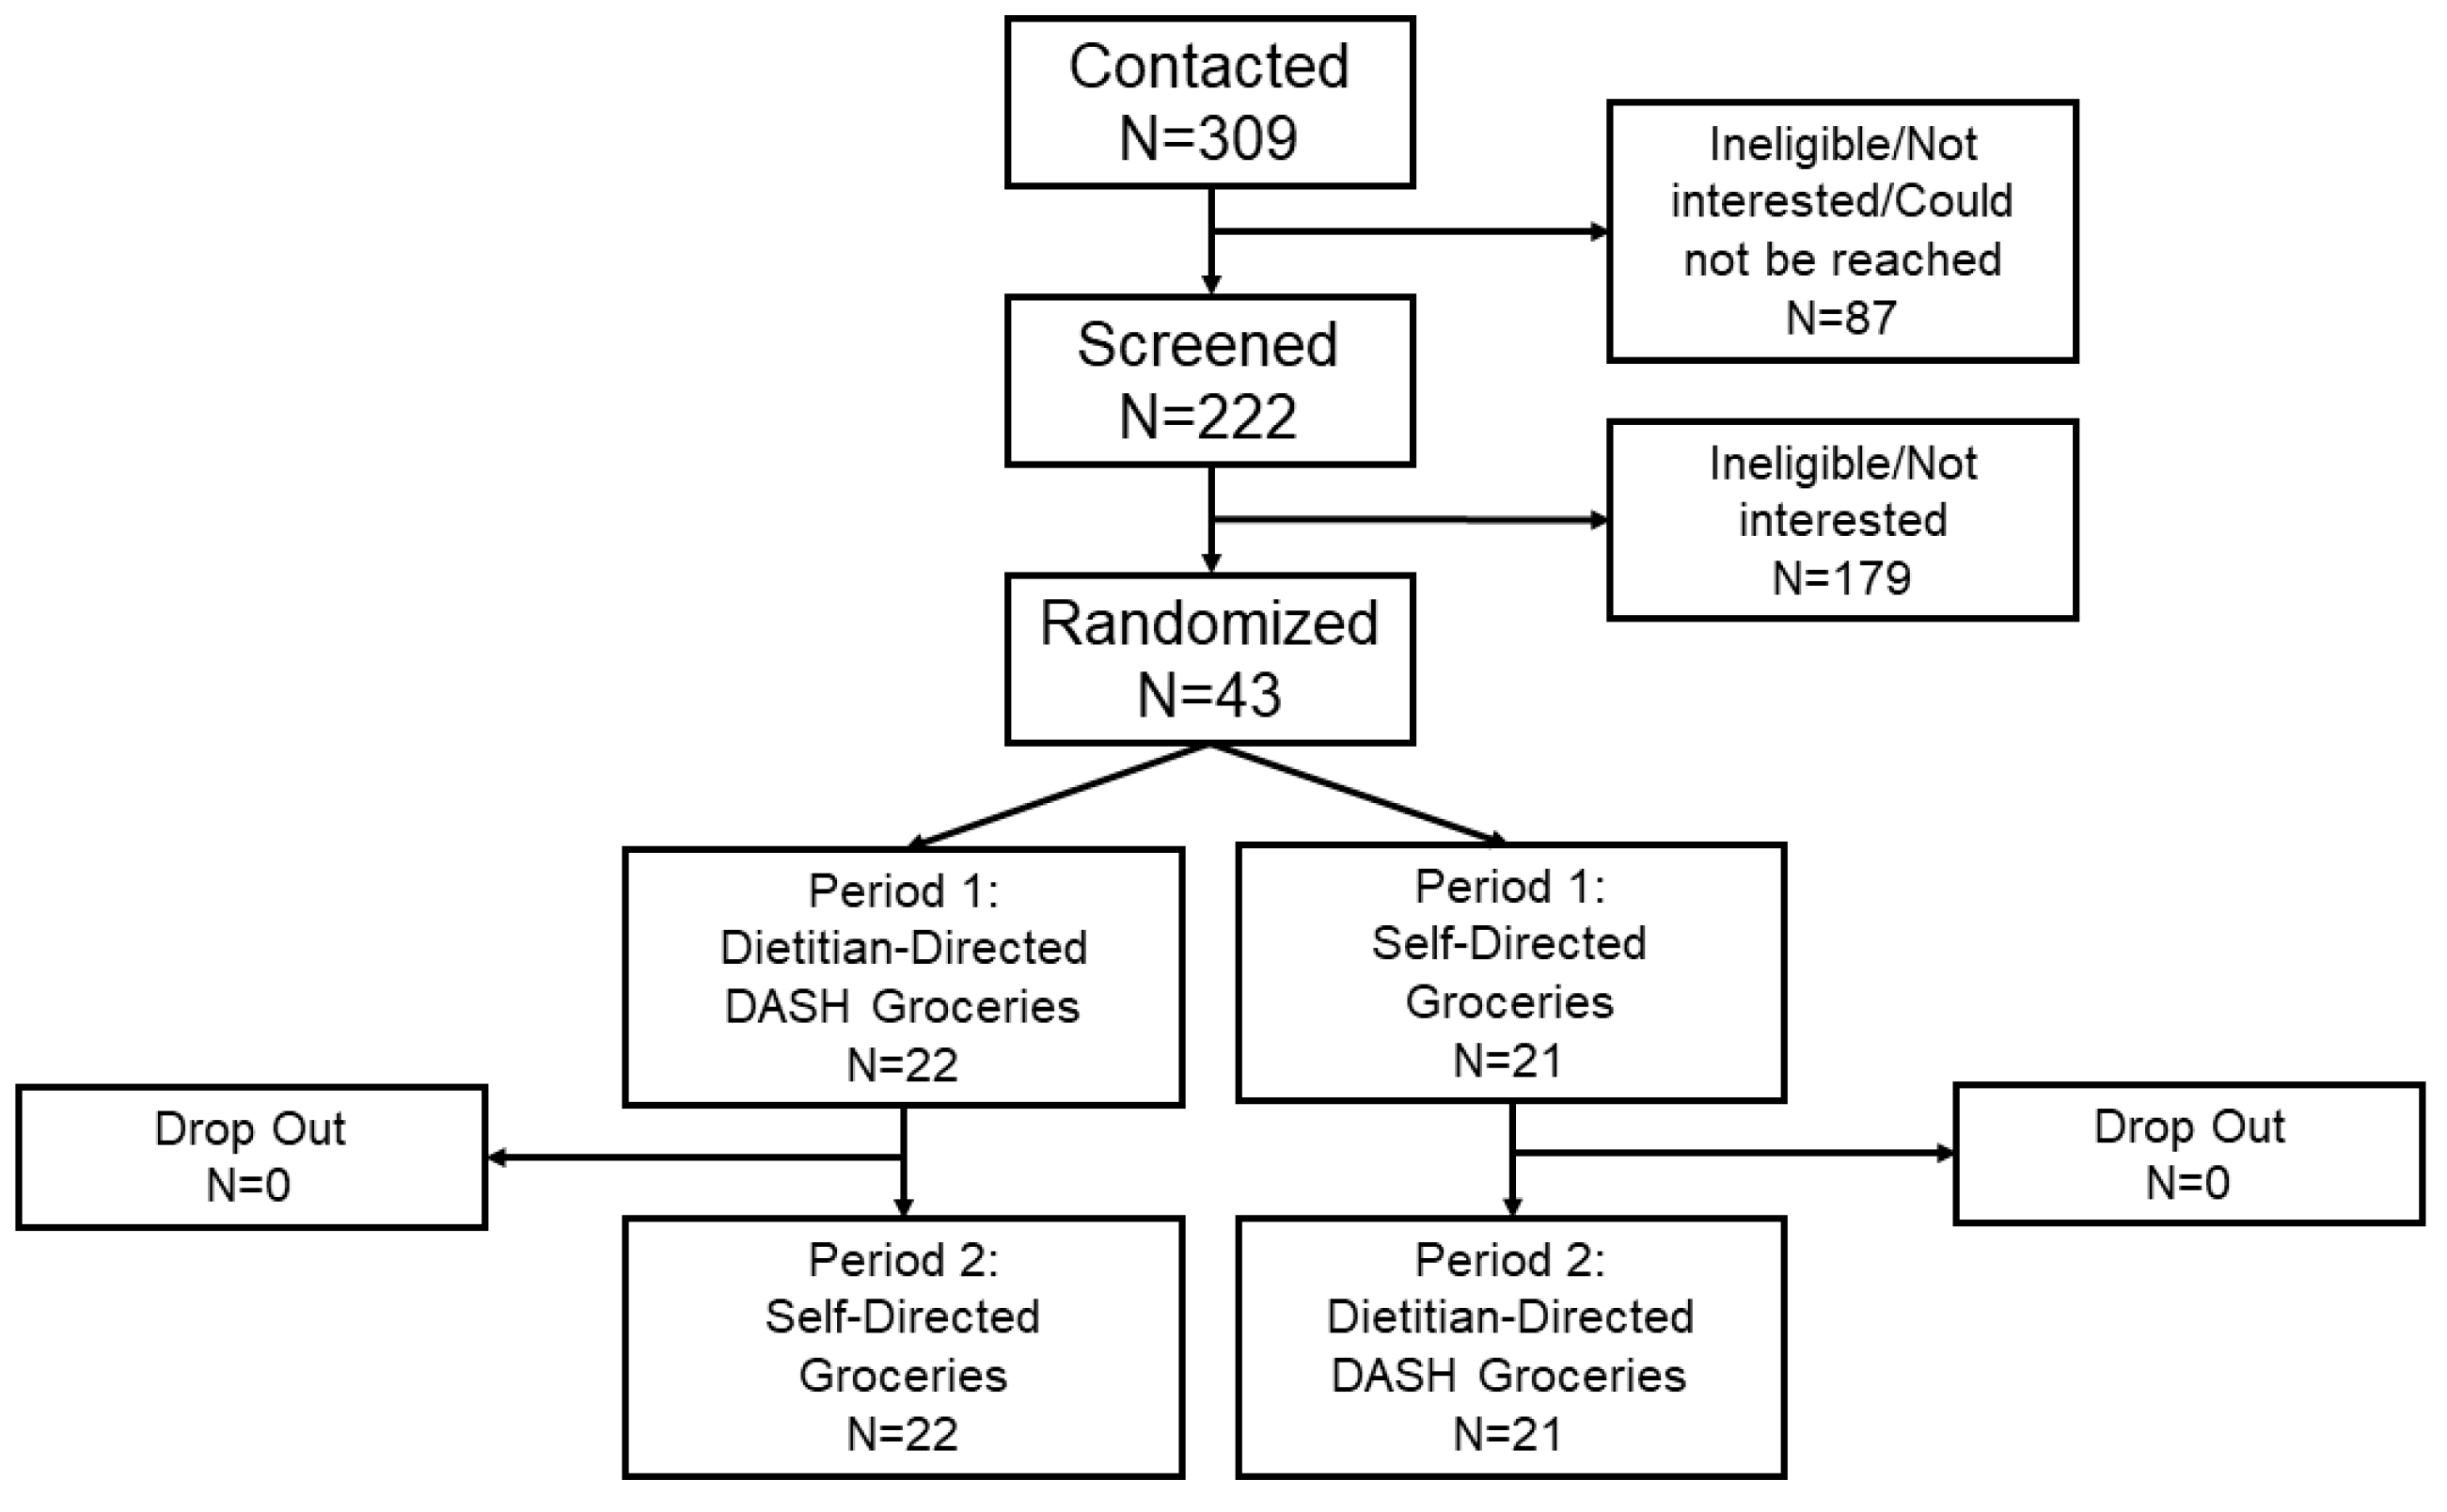
2.1. Participants
2.2. Intervention
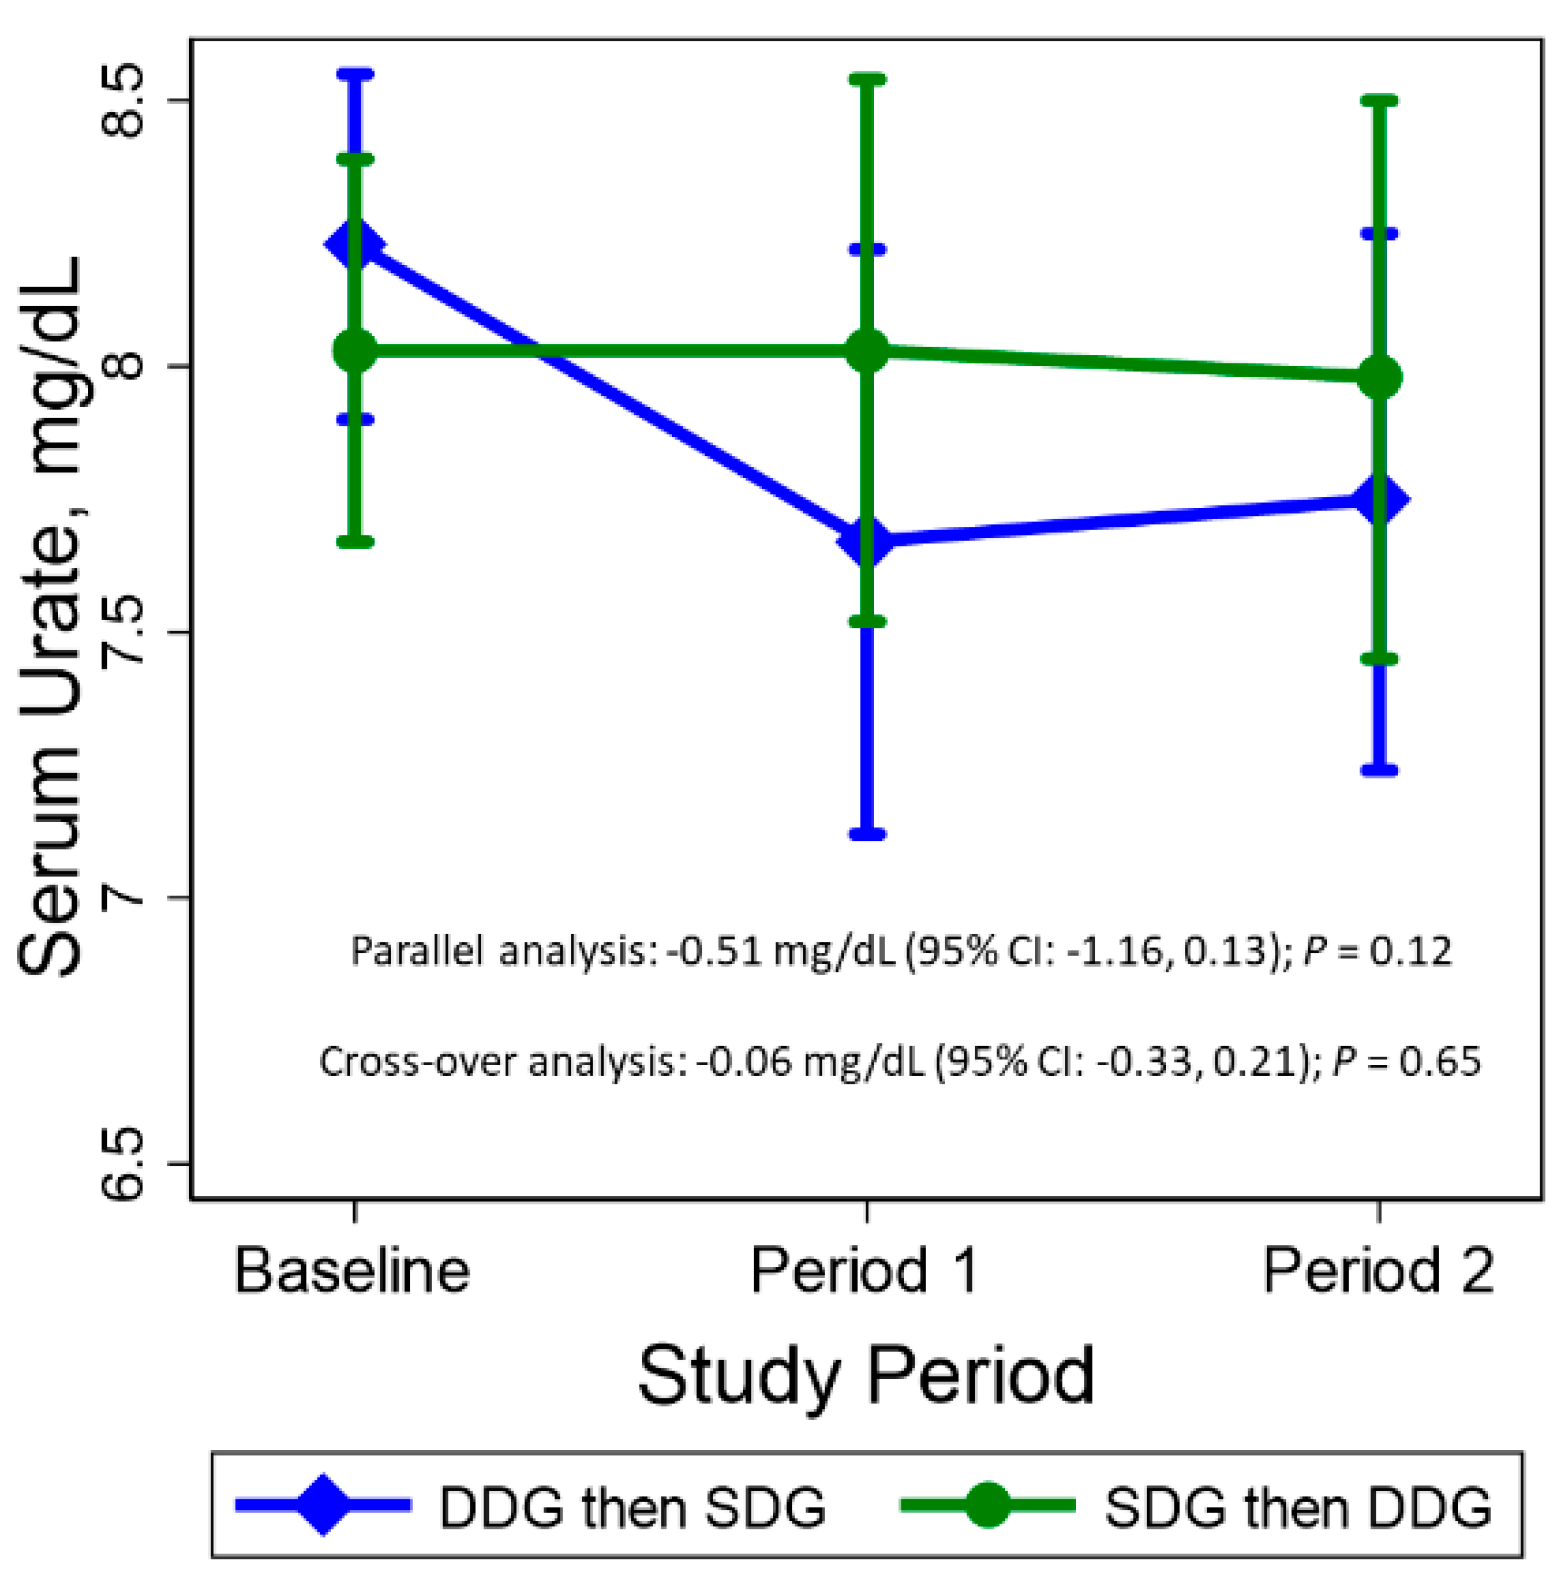
2.3. Primary Outcome: Serum Urate
2.4. Adherence
2.5. Other Measurements
2.5.1. Gout-Related Outcomes
2.5.2. Anthropometric and Laboratory Outcomes
2.5.3. Symptoms & Palatability
2.5.4. Other Covariates
2.6. Statistical Analysis
3. Results
3.1. Baseline Characteristics
3.2. Primary Outcome: Serum Urate
3.3. Other Outcomes
3.4. Compliance Measures
3.5. Side Effects & Tolerability
3.6. Sensitivity Analysis: Period 1 Only (Parallel Effects)
4. Discussion
5. Conclusions
Supplementary Materials
Author Contributions
Funding
Institutional Review Board Statement
Informed Consent Statement
Data Availability Statement
Acknowledgments
Conflicts of Interest
Abbreviation
References
- Rai, S.K.; Aviña-Zubieta, J.A.; McCormick, N.; De Vera, M.A.; Shojania, K.; Sayre, E.C.; Choi, H.K. The rising prevalence and incidence of gout in British Columbia, Canada: Population-based trends from 2000 to 2012. Semin. Arthritis Rheum. 2017, 46, 451–456. [Google Scholar] [CrossRef] [PubMed]
- Juraschek, S.P.; Miller, E.R.; Gelber, A.C. Body mass index, obesity, and prevalent gout in the United States in 1988–1994 and 2007–2010. Arthritis Care Res. 2013, 65, 127–132. [Google Scholar] [CrossRef] [PubMed]
- Safiri, S.; Kolahi, A.-A.; Cross, M.; Carson-Chahhoud, K.; Hoy, D.; Almasi-Hashiani, A.; Sepidarkish, M.; Ashrafi-Asgarabad, A.; Moradi-Lakeh, M.; Mansournia, M.A.; et al. Prevalence, incidence, and years lived with disability due to gout and its attributable risk factors for 195 countries and territories 1990–2017: A systematic analysis of the global burden of disease study 2017. Arthritis Rheumatol. 2020, 72, 1916–1927. [Google Scholar] [CrossRef] [PubMed]
- Xia, Y.; Wu, Q.; Wang, H.; Zhang, S.; Jiang, Y.; Gong, T.; Xu, X.; Chang, Q.; Niu, K.; Zhao, Y. Global, regional and national burden of gout, 1990–2017: A systematic analysis of the global burden of disease study. Rheumatology 2020, 59, 1529–1538. [Google Scholar] [CrossRef] [PubMed]
- Nuki, G.; Simkin, P.A. A concise history of gout and hyperuricemia and their treatment. Arthritis Res. Ther. 2006, 8, S1. [Google Scholar] [CrossRef][Green Version]
- Choi, H.K.; Mount, D.B.; Reginato, A.M. American college of physicians, american physiological society: Pathogenesis of gout. Ann. Intern. Med. 2005, 143, 499–516. [Google Scholar] [CrossRef]
- Choi, H.K.; Atkinson, K.; Karlson, E.W.; Willett, W.; Curhan, G. Purine-rich foods, dairy and protein intake, and the risk of gout in men. N. Engl. J. Med. 2004, 350, 1093–1103. [Google Scholar] [CrossRef] [PubMed]
- Choi, H.K.; Willett, W.; Curhan, G. Fructose-rich beverages and risk of gout in women. JAMA 2010, 304, 2270–2278. [Google Scholar] [CrossRef]
- Huang, H.-Y.; Appel, L.J.; Choi, M.J.; Gelber, A.C.; Charleston, J.; Norkus, E.P.; Miller, E.R. The effects of vitamin C supplementation on serum concentrations of uric acid: Results of a randomized controlled trial. Arthritis Rheum. 2005, 52, 1843–1847. [Google Scholar] [CrossRef]
- Juraschek, S.P.; Miller, E.R.; Gelber, A.C. Effect of oral vitamin C supplementation on serum uric acid: A meta-analysis of randomized controlled trials. Arthritis Care Res. 2011, 63, 1295–1306. [Google Scholar] [CrossRef]
- Dalbeth, N.; Ames, R.; Gamble, G.D.; Horne, A.; Wong, S.; Kuhn-Sherlock, B.; MacGibbon, A.; McQueen, F.M.; Reid, I.R.; Palmano, K. Effects of skim milk powder enriched with glycomacropeptide and G600 milk fat extract on frequency of gout flares: A proof-of-concept randomised controlled trial. Ann. Rheum. Dis. 2012, 71, 929–934. [Google Scholar] [CrossRef] [PubMed]
- Appel, L.J.; Moore, T.J.; Obarzanek, E.; Vollmer, W.M.; Svetkey, L.P.; Sacks, F.M.; Bray, G.A.; Vogt, T.M.; Cutler, J.A.; Windhauser, M.M.; et al. A clinical trial of the effects of dietary patterns on blood pressure. DASH Collaborative Research Group. N. Engl. J. Med. 1997, 336, 1117–1124. [Google Scholar] [CrossRef] [PubMed]
- Sacks, F.M.; Svetkey, L.P.; Vollmer, W.M.; Appel, L.J.; Bray, G.A.; Harsha, D.; Obarzanek, E.; Conlin, P.R.; Miller, E.R.; Simons-Morton, D.G.; et al. DASH-Sodium Collaborative Research Group. Effects on blood pressure of reduced dietary sodium and the Dietary Approaches to Stop Hypertension (DASH) diet. N. Engl. J. Med. 2001, 344, 3–10. [Google Scholar] [CrossRef] [PubMed]
- Rai, S.K.; Fung, T.T.; Lu, N.; Keller, S.F.; Curhan, G.C.; Choi, H.K. The Dietary Approaches to Stop Hypertension (DASH) diet, Western diet, and risk of gout in men: Prospective cohort study. BMJ 2017, 357. [Google Scholar] [CrossRef]
- Juraschek, S.P.; Gelber, A.C.; Choi, H.K.; Appel, L.J.; Miller, E.R. Effects of the Dietary Approaches to Stop Hypertension (DASH) diet and sodium intake on serum uric acid. Arthritis Rheumatol. 2016, 68, 3002–3009. [Google Scholar] [CrossRef]
- Juraschek, S.P.; White, K.; Tang, O.; Yeh, H.-C.; Cooper, L.A.; Miller, E.R. Effects of a Dietary Approach to Stop Hypertension (DASH) diet intervention on serum uric acid in African Americans with hypertension. Arthritis Care Res. 2018, 70, 1509–1516. [Google Scholar] [CrossRef]
- Miller, H.N.; Charleston, J.; Wu, B.; Gleason, K.; White, K.; Dennison Himmelfarb, C.R.; Ford, D.E.; Plante, T.B.; Gelber, A.C.; Appel, L.J.; et al. Use of electronic recruitment methods in a clinical trial of adults with gout. Clin. Trials. 2020. [Google Scholar] [CrossRef]
- Block, G.; Gillespie, C.; Rosenbaum, E.H.; Jenson, C. A rapid food screener to assess fat and fruit and vegetable intake. Am. J. Prev. Med. 2000, 18, 284–288. [Google Scholar] [CrossRef]
- Block, G.; Woods, M.; Potosky, A.; Clifford, C. Validation of a self-administered diet history questionnaire using multiple diet records. J. Clin. Epidemiol. 1990, 43, 1327–1335. [Google Scholar] [CrossRef]
- Gaffo, A.L.; Dalbeth, N.; Saag, K.G.; Singh, J.A.; Rahn, E.J.; Mudano, A.S.; Chen, Y.-H.; Lin, C.-T.; Bourke, S.; Louthrenoo, W.; et al. Brief report: Validation of a definition of flare in patients with established gout. Arthritis Rheumatol. 2018, 70, 462–467. [Google Scholar] [CrossRef]
- Bellamy, N. Outcome measurement in osteoarthritis clinical trials. J. Rheumatol. Suppl. 1995, 43, 49–51. [Google Scholar] [PubMed]
- Bennell, K.; Dobson, F.; Hinman, R. Measures of physical performance assessments: Self-Paced Walk Test (SPWT), Stair Climb Test (SCT), Six-Minute Walk Test (6MWT), Chair Stand Test (CST), Timed Up & Go (TUG), Sock Test, Lift and Carry Test (LCT), and Car Task. Arthritis Care Res. 2011, 63, S350–S370. [Google Scholar]
- Inker, L.A.; Schmid, C.H.; Tighiouart, H.; Eckfeldt, J.H.; Feldman, H.I.; Greene, T.; Kusek, J.W.; Manzi, J.; Van Lente, F.; Zhang, Y.L.; et al. Estimating glomerular filtration rate from serum creatinine and cystatin C. N. Engl. J. Med. 2012, 367, 20–29. [Google Scholar] [CrossRef] [PubMed]
- White, H. A heteroskedasticity-consistent covariance matrix estimator and a direct test for heteroskedasticity. Econometrica 1980, 48, 817–838. [Google Scholar] [CrossRef]
- Senn, S.S. Cross-Over Trials in Clinical Research, 2nd ed.; John Wiley & Sons, Ltd: Hoboken, NJ, USA, 2002. [Google Scholar]
- Frank, O. Nutritional state and purine metabolism. Adv. Exp. Med. Biol. 1977, 76B, 266–268. [Google Scholar] [PubMed]
- Juraschek, S.P.; McAdams-Demarco, M.; Gelber, A.C.; Sacks, F.M.; Appel, L.J.; White, K.J.; Miller, E.R. Effects of lowering glycemic index of dietary carbohydrate on plasma uric acid levels: The omnicarb randomized clinical trial. Arthritis Rheumatol. 2016, 68, 1281–1289. [Google Scholar] [PubMed]
- Vogt, T.M.; Appel, L.J.; Obarzanek, E.; Moore, T.J.; Vollmer, W.M.; Svetkey, L.P.; Sacks, F.M.; Bray, G.A.; Cutler, J.A.; Windhauser, M.M.; et al. Dietary Approaches to Stop Hypertension: Rationale, design, and methods. DASH Collaborative Research Group. J. Am. Diet. Assoc. 1999, 99, S12–S18. [Google Scholar] [CrossRef]
- Juraschek, S.P.; Yokose, C.; McCormick, N.; Miller, E.R., III; Appel, L.J.; Choi, H.K. Effects of dietary patterns on serum urate: Results from the DASH randomized trial. Arthritis Rheumatol. 2020. [Google Scholar] [CrossRef]
- Miller, E.R.; Cooper, L.A.; Carson, K.A.; Wang, N.-Y.; Appel, L.J.; Gayles, D.; Charleston, J.; White, K.; You, N.; Weng, Y.; et al. A dietary intervention in urban African Americans: Results of the “Five Plus Nuts and Beans” randomized trial. Am. J. Prev. Med. 2016, 50, 87–95. [Google Scholar] [CrossRef]
- Tang, O.; Miller, E.R.; Gelber, A.C.; Choi, H.K.; Appel, L.J.; Juraschek, S.P. DASH diet and change in serum uric acid over time. Clin. Rheumatol. 2017, 36, 1413–1417. [Google Scholar] [CrossRef]


| Food Group | Servings/Day | Serving Size |
| Grains | 5–7 | 5.8 (2.2) oz equivalent |
| Vegetables | 4 | 3.5 (0.9) cup equivalent |
| Fruits | 4 | 3.0 (0.6) cup equivalent |
| Fat-free/low-fat dairy | 2 | 2.3 (1.0) cup equivalent |
| Lean meats, poultry, fish | 1–2 | 10.3 (2.7) oz equivalent |
| Nuts, seeds, legumes | <0.5 | |
| Nutrients | Original DASH | Mean (SD) Ordered * |
| % Calories from fat | 25.6 | 40.4 (7.6) |
| % Calories from saturated fat | 7.0 | 8.5 (1.7) |
| % Calories from protein | 17.9 | 18.7 (2.6) |
| % Calories from carbohydrates | 56.5 | 40.9 (6.2) |
| Cholesterol (mg/day) | 151 | 184.4 (65.7) |
| Potassium (mg/day) | 4415 | 4110.9 (779.6) |
| Magnesium (mg/day) | 480 | 534.2 (121.9) |
| Calcium (mg/day) | 1265 | 1164.3 (366.4) |
| Sodium (mg/day) | 2859 | 1466.9 (554.7) |
| Mean (SD), Median (25th, 75th), or % | |||
|---|---|---|---|
| Overall | Dietitian-Directed DASH Groceries in Period 1 (N = 22) | Self-Directed Groceries in Period 1 (N = 21) | |
| Age, year | 59.0 (12.1) | 57.5 (13.3) | 60.5 (10.7) |
| Female, % | 19 | 18 | 19 |
| Black, % | 49 | 55 | 43 |
| Body mass index, kg/m2 | 33.5 (6.8) | 33.4 (6.4) | 33.5 (7.5) |
| Systolic blood pressure, mm Hg | 124.3 (14.8) | 125.0 (17.0) | 123.5 (12.4) |
| Diastolic blood pressure, mm Hg | 73.8 (10.8) | 74.9 (11.3) | 72.6 (10.5) |
| Total cholesterol, mg/dL | 191.4 (39.8) | 187.0 (37.5) | 196.0 (42.5) |
| Triglycerides, mg/dL | 103 (77, 152) | 89 (82, 147) | 105 (75, 188) |
| HDL-cholesterol, mg/dL | 52.7 (18.2) | 53.6 (19.4) | 51.7 (17.3) |
| LDL-cholesterol, mg/dL | 112.2 (36.1) | 109.0 (31.1) | 115.5 (41.2) |
| Fasting blood glucose, mg/dL | 97.9 (15.8) | 93.0 (11.6) | 103.0 (18.1) |
| eGFR, mL/min per 1.73 mm2 | 78.7 (16.1) | 79.1 (16.6) | 78.4 (16.0) |
| History of hypertension, % | 63 | 50 | 76 |
| History of high cholesterol *, % | 45 | 43 | 48 |
| History of diabetic condition **, % | 20 | 10 | 30 |
| Flare history | |||
| No attacks past year | 5 | 5 | 5 |
| 1 attack past year | 28 | 23 | 33 |
| >1 attacks past year | 67 | 73 | 62 |
| Diuretic use, % | 28 | 27 | 29 |
| Losartan use, % | 21 | 18 | 24 |
| Colchicine use, % | 16 | 14 | 19 |
| Non-steroidal anti-inflammatory (NSAID) use, % | 14 | 14 | 14 |
| Crossover Effect | ||
|---|---|---|
| Secondary CVD Endpoints | β (95% CI) | p |
| Systolic blood pressure, mm Hg | −1.03 (−4.57, 2.52) | 0.57 |
| Diastolic blood pressure, mm Hg | −1.14 (−3.36, 1.09) | 0.32 |
| Body mass index, kg/m2 | −0.15 (−0.39, 0.10) | 0.24 |
| HDL-cholesterol, mg/dL | −1.02 (−3.23, 1.19) | 0.36 |
| LDL-cholesterol, mg/dL | −4.99 (−12.32, 2.35) | 0.18 |
| Non-HDL-cholesterol, mg/dL | −6.23 (−13.67, 1.21) | 0.10 |
| Triglycerides, % | −5.0 (−12.9, 3.6) | 0.25 |
| Total cholesterol, mg/dL | −7.26 (−15.14, 0.62) | 0.07 |
| Fasting glucose, mg/dL | −3.05 (−7.03, 0.94) | 0.13 |
| eGFR, mL/min per 1.73 m2 | 1.14 (−1.05, 3.32) | 0.31 |
| Pain & Physical Function | β (95% CI) | p |
| Gout flares (Gaffo 2018 definition) * | 0.66 (0.23, 1.89) | 0.44 |
| TUG test, seconds | −0.95 (−2.35, 0.46) | 0.19 |
| Pain with walking, % | −19.3 (−41.1, 10.7) | 0.18 |
| Pain with stair climbing, % | −24.1 (−43.2, 1.4) | 0.06 |
| Pain at night, % | −13.9 (−32.4, 9.7) | 0.23 |
| Pain at rest, % | −15.3 (−34.6, 9.9) | 0.21 |
| Pain with weight bearing, % | −15.3 (−35.5, 11.3) | 0.23 |
| Bodily pain, % | −26.7 (−42.9, −5.9) | 0.01 |
| Pain interfering with normal work, % | −12.1 (−33.6, 16.3) | 0.37 |
| Crossover Effect | ||
|---|---|---|
| Self-reported food consumption | β (95% CI) | p |
| Fat score, servings per day | −8.65 (−11.68, −5.62) | <0.001 |
| Saturated fat, gm/day | −7.61 (−10.28, −4.95) | <0.001 |
| Total fat, gm/day | −20.76 (−28.04, −13.49) | <0.001 |
| Self-reported cholesterol, mg/day | −67.48 (−91.12, −43.84) | <0.001 |
| Fruit & vegetable servings per day | 3.12 (1.45, 4.78) | 0.002 |
| Fruit, vegetable, & bean servings per day | 5.07 (2.92, 7.22) | <0.001 |
| Spot Urine | β (95% CI) | p |
| Urate/creatinine, mg/mg | 6.82 (−36.17, 49.81) | 0.76 |
| Sodium mmol/L, % | −22.4 (−34.0, −8.6) | 0.002 |
| Sodium mmol/L/creatinine mg/dL, % | −10.8 (−30.6, 14.6) | 0.37 |
| Potassium mmol/L, % | −4.4 (−19.4, 13.4) | 0.61 |
| Potassium mmol/L/creatinine mg/dL, % | 9.3 (−3.3, 23.5) | 0.15 |
| Sodium mmol/L/potassium mmol/L, % | −18.4 (−34.5, 1.7) | 0.07 |
| Urine pH, % | 2.1 (−1.8, 6.1) | 0.30 |
| Side Effects * | Crossover Effect | |
|---|---|---|
| OR (95% CI) | p | |
| Hunger | 0.79 (0.38, 1.64) | 0.53 |
| Bloating | 0.57 (0.32, 1.01) | 0.054 |
| Diarrhea | 1.46 (0.64, 3.35) | 0.37 |
| Thirst | 0.82 (0.42, 1.60) | 0.57 |
| Fatigue | 0.68 (0.33, 1.39) | 0.29 |
| Headache | 0.82 (0.41, 1.62) | 0.57 |
| Lightheadedness | 1.00 (0.48, 2.06) | >0.99 |
| Nausea | 0.39 (0.10, 1.49) | 0.17 |
Publisher’s Note: MDPI stays neutral with regard to jurisdictional claims in published maps and institutional affiliations. |
© 2021 by the authors. Licensee MDPI, Basel, Switzerland. This article is an open access article distributed under the terms and conditions of the Creative Commons Attribution (CC BY) license (http://creativecommons.org/licenses/by/4.0/).
Share and Cite
Juraschek, S.P.; Miller, E.R., III; Wu, B.; White, K.; Charleston, J.; Gelber, A.C.; Rai, S.K.; Carson, K.A.; Appel, L.J.; Choi, H.K. A Randomized Pilot Study of DASH Patterned Groceries on Serum Urate in Individuals with Gout. Nutrients 2021, 13, 538. https://doi.org/10.3390/nu13020538
Juraschek SP, Miller ER III, Wu B, White K, Charleston J, Gelber AC, Rai SK, Carson KA, Appel LJ, Choi HK. A Randomized Pilot Study of DASH Patterned Groceries on Serum Urate in Individuals with Gout. Nutrients. 2021; 13(2):538. https://doi.org/10.3390/nu13020538
Chicago/Turabian StyleJuraschek, Stephen P., Edgar R. Miller, III, Beiwen Wu, Karen White, Jeanne Charleston, Allan C. Gelber, Sharan K. Rai, Kathryn A. Carson, Lawrence J. Appel, and Hyon K. Choi. 2021. "A Randomized Pilot Study of DASH Patterned Groceries on Serum Urate in Individuals with Gout" Nutrients 13, no. 2: 538. https://doi.org/10.3390/nu13020538
APA StyleJuraschek, S. P., Miller, E. R., III, Wu, B., White, K., Charleston, J., Gelber, A. C., Rai, S. K., Carson, K. A., Appel, L. J., & Choi, H. K. (2021). A Randomized Pilot Study of DASH Patterned Groceries on Serum Urate in Individuals with Gout. Nutrients, 13(2), 538. https://doi.org/10.3390/nu13020538