
Non-Conjugated-Industrially-Produced-Trans Fatty in Lebanese Foods: The Case of Elaidic and Linolelaidic Acids

 , and
, and 
Abstract
:1. Introduction
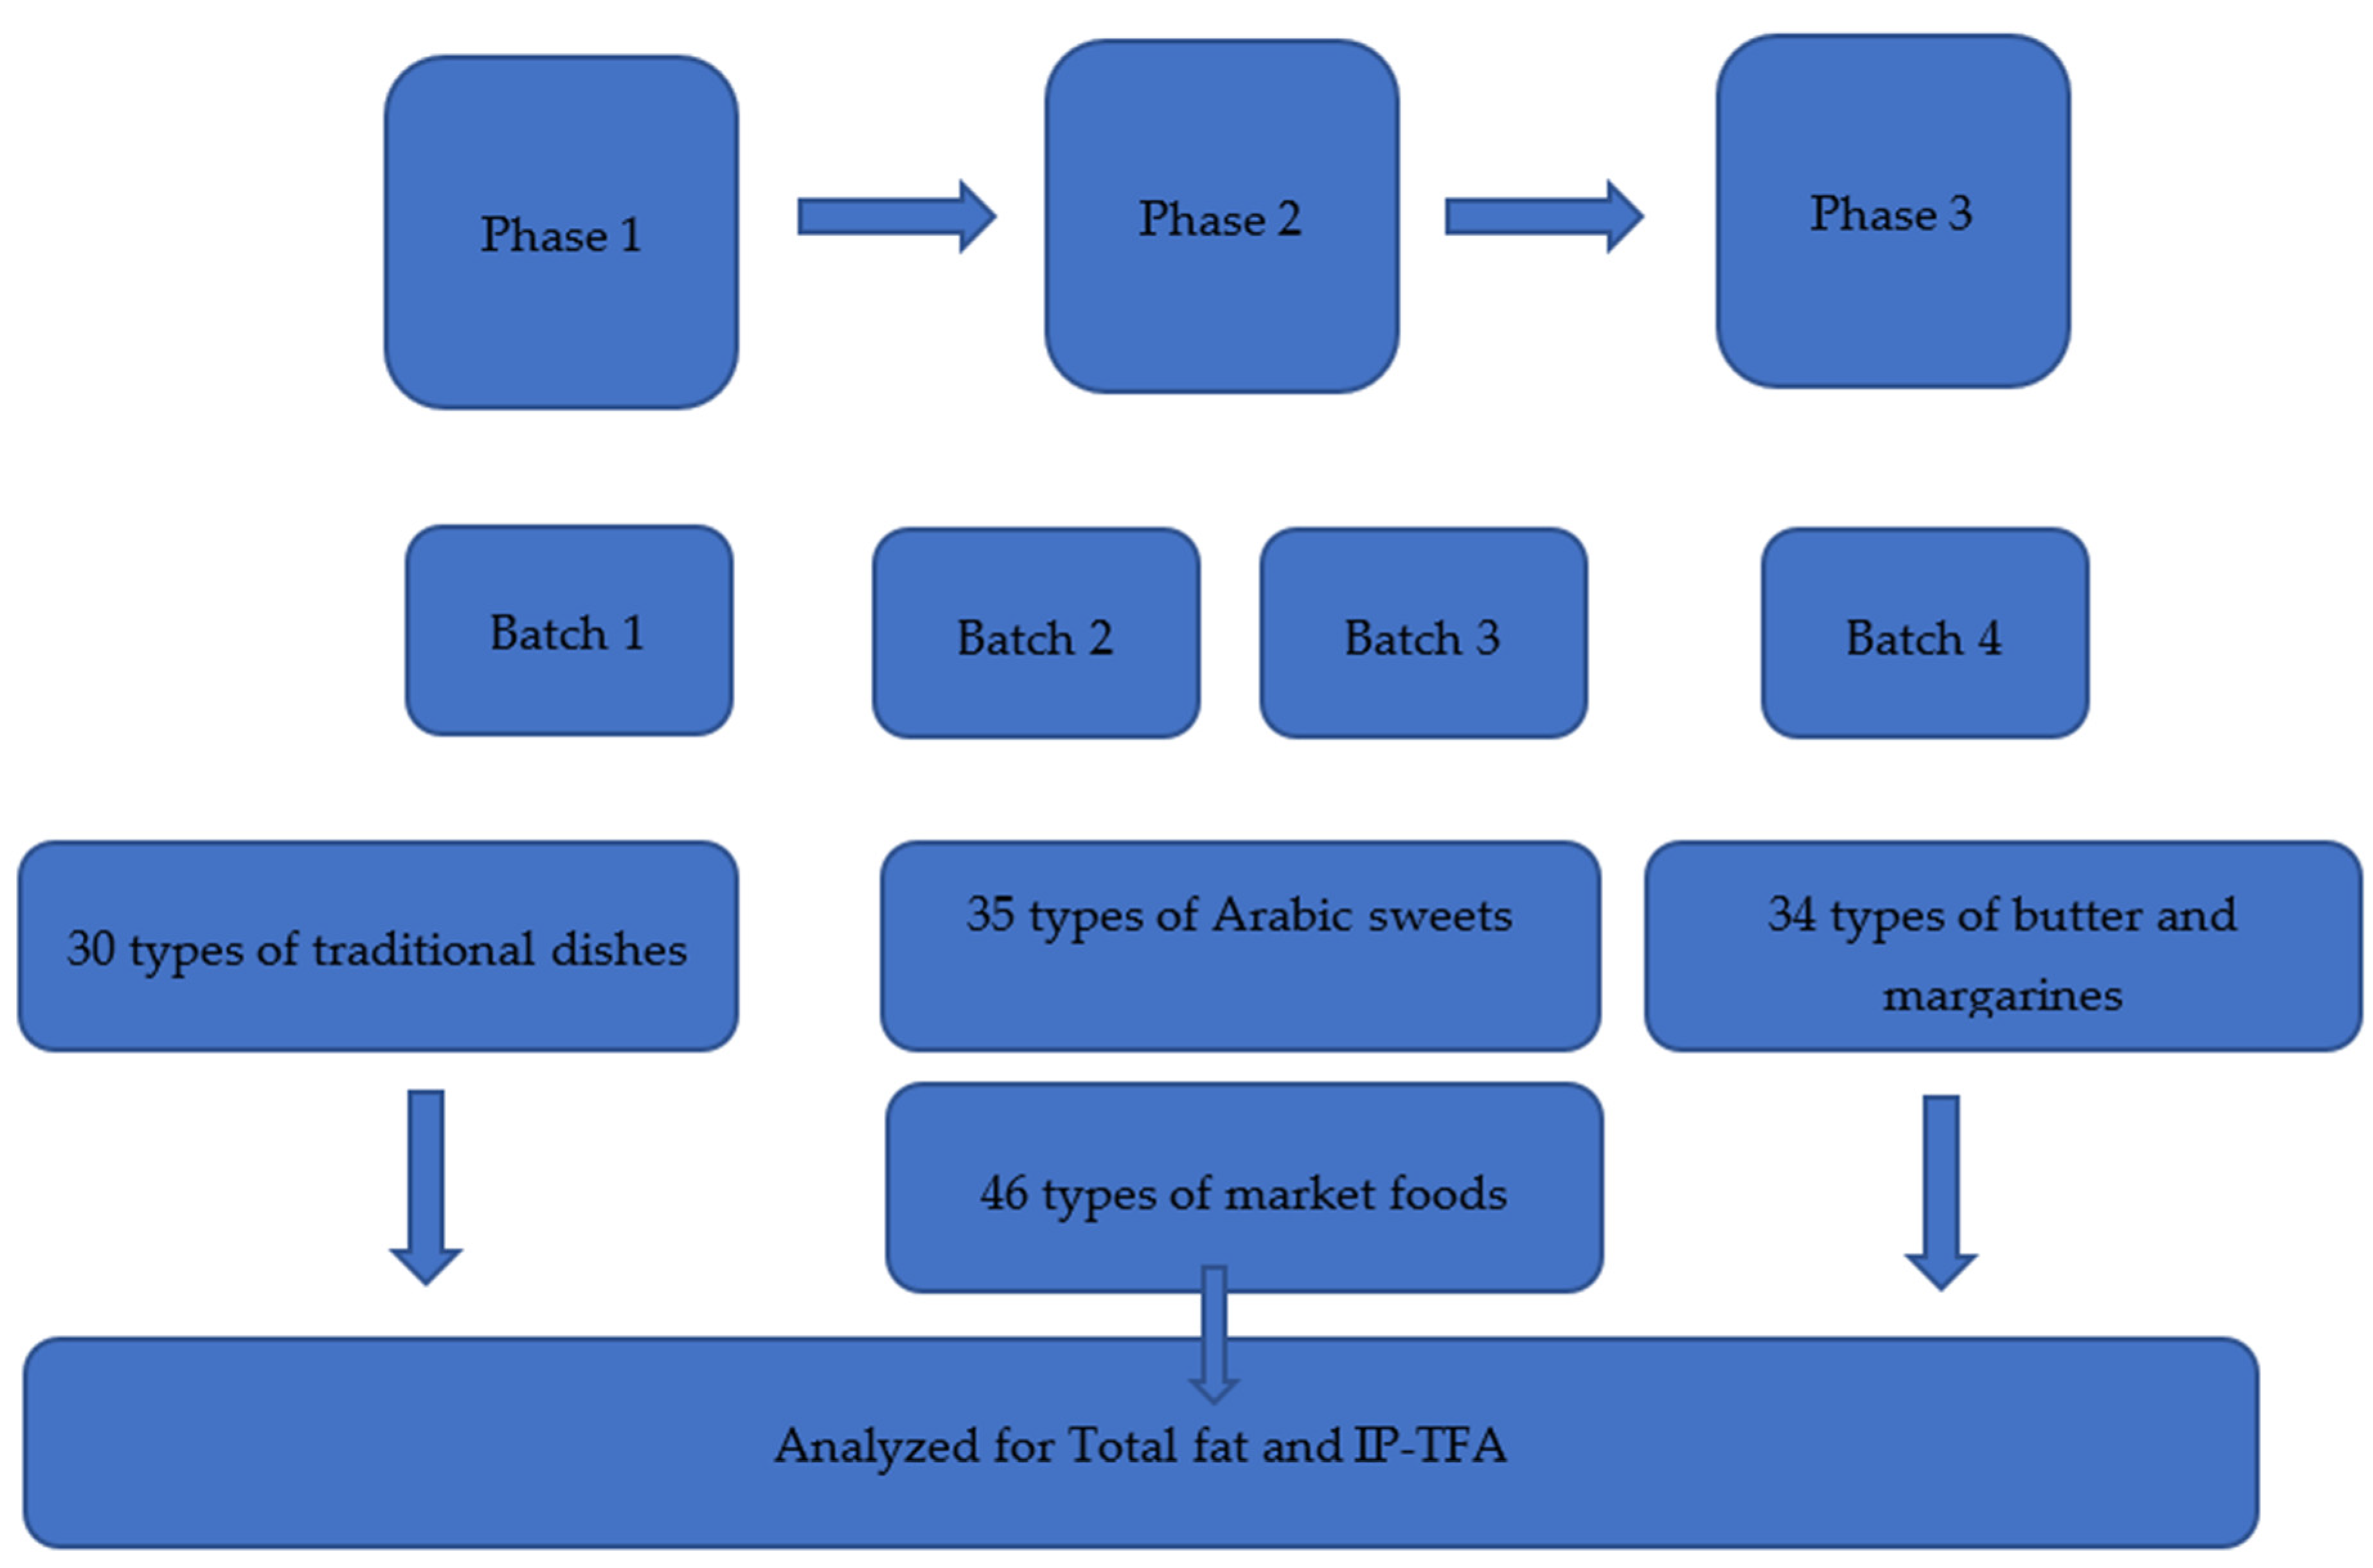
2. Materials and Methods
2.1. Food Sampling
2.2. Laboratory Analysis Protocol
- Column: fatty acid methyl esters (FAME) length: 30 m, 0.32 ID
- Injection volume: 1 µL
- Injector temperature (PTV): injection: 60 °C for 0.1 min
- Transfer: ramp 10 °C/min to 270 °C, 1 min hold
- Carrier flow (He): 2.0 mL/min
- Split flow: 20 mL/min (split ratio: 20)
- Detector temperature (flame ionization detection (FID) 280 °C
- Detector gases flows: Air 350 mL/min, Hydrogen 32 mL/min, Make-up (N2) 30 mL/min
- Initial temperature: 100 °C, hold 3 min
- -Ramp 1: 10 °C/min to 200 °C, hold 3 min
- -Ramp 2: 10 °C/min to 250 °C, hold 5 min
3. Results
3.1. Trans Fatty Acid Acids in Frequently Consumed Traditional Dishes
3.2. Trans Fatty Acid Acids in Frequently Consumed Arabic Sweets
3.3. Trans Fatty Acid in Market Foods
3.3.1. Cereals and Breads Group
3.3.2. Butter and Margarines
3.3.3. Snacks and Processed Foods
4. Discussion
4.1. Comparison between Lebanese Market Basket Investigation and Other Global and Regional Market Investigations
4.2. Investigation of the Country of Origin of Imported Food Products in Lebanon
4.3. Limits, Advantages, and Future Directions
5. Conclusions
Author Contributions
Funding
Institutional Review Board Statement
Informed Consent Statement
Data Availability Statement
Acknowledgments
Conflicts of Interest
Disclaimer
References
- World Health Organization-Noncommunicable Diseases (NCD) Country Profiles 2018. Available online: https://www.who.int/publications/i/item/ncd-country-profiles-2018 (accessed on 2 June 2021).
- Remig, V.; Franklin, B.; Margolis, S.; Kostas, G.; Nece, T.; Street, J.C. Trans fats in America: A review of their use, consumption, health implications, and regulation. J. Am. Diet. Assoc. 2010, 110, 585–592. [Google Scholar] [CrossRef] [PubMed] [Green Version]
- World Health Organization. Countdown to 2023: WHO Report on Global Trans-Fat Elimination 2019; World Health Organization: Geneva, Switzerland, 2019. [Google Scholar]
- World Health Organization. An Action Package to Eliminate Industrially-Produced Trans Fat from the Global Food Supply; World Health Organization: Geneva, Switzerland, 2018; Available online: http://www.who.int/nutrition/topics/replace-transfat (accessed on 15 March 2021).
- World Health Organization. Countdown to 2023: WHO Report on Global Trans-Fat Elimination 2020; World Health Organization: Geneva, Switzerland, 2020. [Google Scholar]
- World Health Organization. REPLACE Trans Fat: An Action Package to Eliminate Industrially Produced Trans-Fatty Acids. In Module 3: Legislate or Regulate. How-to Guide for Trans Fat Policy Action; World Health Organization: Geneva, Switzerland, 2020; Licence: CC BY-NC-SA 3.0 IGO. [Google Scholar]
- Saunders, D.; Jones, S.; Devane, G.J.; Scholes, P.; Lake, R.J.; Paulin, S.M. Trans fatty acids in the New Zealand food supply. J. Food Comp. Anal. 2008, 21, 320–325. [Google Scholar] [CrossRef]
- Jawaldeh, A.A.; Al-Jawaldeh, H. Fat Intake Reduction Strategies among Children and Adults to Eliminate Obesity and Non-Communicable Diseases in the Eastern Mediterranean Region. Children 2018, 5, 89. [Google Scholar] [CrossRef] [PubMed] [Green Version]
- World Health Organization. Noncommunicable Diseases: Key Facts. Geneva. 2018. Available online: https://www.who.int/news-room/fact-sheets/detail/noncommunicable-diseases (accessed on 16 March 2021).
- Persistence Market Research. PHO and non-PHO Based Oils and Fats Market: Global Industry Analysis 2013–2017 and Forecast 2018–2026. Available online: https://www.persistencemarketresearch.com/market-research/pho-and-nonpho-based-oils-and-fats-market.asp (accessed on 17 June 2021).
- Bösch, S.; Westerman, L.; Renshaw, N.; Pravst, I. Trans Fat Free by 2023—A Building Block of the COVID-19 Response. Front. Nutr. 2021, 8, 645750. [Google Scholar] [CrossRef]
- Ohmori, H.; Fujii, K.; Kadochi, Y.; Mori, S.; Nishiguchi, Y.; Fujiwara, R.; Kishi, S.; Sasaki, T.; Kuniyasu, H. Elaidic Acid, a Trans-Fatty Acid, Enhances the Metastasis of Colorectal Cancer Cells. Pathobiol. J. Immunopathol. Mol. Cell. Biol. 2017, 84, 144–151. [Google Scholar] [CrossRef] [PubMed]
- Li, C.; Cobb, L.K.; Vesper, H.W.; Asma, S. Global Surveillance of trans-Fatty Acids. Prev. Chronic Dis. 2019, 16, E147. [Google Scholar] [CrossRef] [Green Version]
- Park, K.-H.; Kim, J.-M.; Cho, K.-H. Elaidic acid (EA) generates dysfunctional high-density lipoproteins and consumption of EA exacerbates hyperlipidemia and fatty liver change in zebrafish. Mol. Nutr. Food Res. 2014, 58, 1537–1545. [Google Scholar] [CrossRef]
- Wang, J.; Liang, Y.; Jian, L.; Zhang, J.; Liang, S.; Xiao, S.; Liu, B.; Wang, H. Linoelaidic acid enhances adipogenic differentiation in adipose tissue-derived stromal cells through suppression of Wnt/β-catenin signaling pathway in vitro. Prostaglandins Leukot. Essent. Fat. Acids 2016, 110, 1–7. [Google Scholar] [CrossRef]
- Li, J.; Rao, H.; Bin, Q.; Fan, Y.-W.; Li, H.-Y.; Deng, Z.-Y. Linolelaidic acid induces apoptosis, cell cycle arrest and inflammation stronger than elaidic acid in human umbilical vein endothelial cells through lipid rafts. Eur. J. Lipid Sci. Technol. 2016, 119, 1600374. [Google Scholar] [CrossRef]
- World Health Organization. Regional framework for action. In WHO/Noncommunicable Diseases; WHO Regional Office for Eastern Mediterranean: Cairo, Egypt, 2015. [Google Scholar]
- Hoteit, M.; Zoghbi, E.; Al Iskandarani, M.; Rady, A.; Shankiti, I.; Matta, J.; Al-Jawaldeh, A. Nutritional value of the Middle Eastern diet: Analysis of total sugar, salt, and iron in Lebanese traditional dishes. F1000Research 2020, 9, 1254. [Google Scholar] [CrossRef]
- Hoteit, M.; Zoghbi, E.; Rady, A.; Shankiti, I.; Al-Jawaldeh, A. Development of a Lebanese food exchange system based on frequently consumed Eastern Mediterranean traditional dishes and Arabic sweets. F1000Research 2021, 10, 12. [Google Scholar] [CrossRef]
- Food Composition Data: Traditional Dishes, Arabic Sweets and Market Foods. 2021. Available online: https://ul.edu.lb/files/ann/20210422-LU-RePa-Report.pdf (accessed on 29 April 2021).
- Batal, M.; Hunter, E. Traditional Lebanese recipes based on wild plants: An answer to diet simplification? Food Nutr. Bull. 2007, 28 (Suppl. 2), S303–S311. [Google Scholar] [CrossRef] [Green Version]
- Issa, C.; Salameh, P.; Batal, M.; Vieux, F.; Lairon, D.; Darmon, N. The nutrient profile of traditional Lebanese composite dishes: Comparison with composite dishes consumed in France. Int. J. Food Sci. Nutr. 2009, 60 (Suppl. 4), 285–295. [Google Scholar] [CrossRef]
- Association of Official Analytical Chemists. Official Methods of Analysis; Washington Ce 1h-05; 23; Association of Official Analytical Chemists: Washington, DC, USA, 2017; (Revised 2017). [Google Scholar]
- Association of Official Analytical Chemists. Official Methods of Analysis, 21st ed.; Association of Official Analytical Chemists: Washington, DC, USA, 2019. [Google Scholar]
- Bahrami, G.; Bahrami, S.; Bahrami, M.; Pasdar, Y.; Darbandi, M.; Rezaei, M. The Trans Fatty Acid Content of Snacks Offered in Kermanshah. Int. J. Health Life Sci. 2015, 1, e69803. [Google Scholar]
- Wolff, R.L.; Combe, N.A.; Destaillats, F.; Boué, C.; Precht, D.; Molkentin, J.; Entressangles, B. Follow-up of the Δ4 to Δ16 trans-18:1 isomer profile and content in French processed foods containing partially hydrogenated vegetable oils during the period 1995–1999. Analytical and nutritional implications. Lipids 2000, 35, 815–825. [Google Scholar] [CrossRef]
- Nazari, B.; Asgary, S.; Azadbakht, L. Fatty acid analysis of Iranian junk food, dairy, and bakery products: Special attention to trans-fats. J. Res. Med. Sci. Off. J. Isfahan Univ. Med. Sci. 2012, 17, 952–957. [Google Scholar]
- Żbikowska, A.; Onacik-Gür, S.; Kowalska, M.; Rutkowska, J. Trans fatty acids in polish pastry. J. Food Prot. 2019, 82, 1028–1033. [Google Scholar]
- Reshma, M.V.; Kiran, R.C.; Nisha, P.; SobanKumar, D.R.; Sundaresan, A.; Jayamurthy, P. Trans fat content in labeled and unlabelled indian bakery products including fried snacks. Int. Food Res. J. 2012, 19, 1609–1614. Available online: http://ezproxy.usek.edu.lb/login?url=https://www-proquest-com.ezproxy.usek.edu.lb/scholarly-journals/trans-fat-content-labeled-unlabelled-indian/docview/1318005982/se-2?accountid=43544 (accessed on 2 July 2021).
- Saadeh, C.; Toufeili, I.; Habbal, M.Z.; Nasreddine, L. Fatty acid composition including trans-fatty acids in selected cereal-based baked snacks from Lebanon. J. Food Compos. Anal. 2015, 41, 81–85. [Google Scholar] [CrossRef]
- Lee, J.H.; Adhikari, P.; Kim, S.-A.; Yoon, T.; Kim, I.-H.; Lee, K.-T. Trans Fatty Acids Content and Fatty Acid Profiles in the Selected Food Products from Korea between 2005 and 2008. J. Food Sci. 2010, 75, C647–C652. [Google Scholar] [CrossRef]
- Cakmak, Y.S.; Guler, G.O.; Yigit, S.; Caglav, G.; Aktumsek, A. Fatty Acid Composition and TransFatty Acids in Crisps and Cakes in Turkey’s Markets. Int. J. Food Prop. 2011, 14, 822–829. [Google Scholar] [CrossRef] [Green Version]
- Akmar, Z.D.; Norhaizan, M.E.; Azimah, R.; Azrina, A.; Chan, Y.M. The trans fatty acids content of selected foods in Malaysia. Malays. J. Nutr. 2013, 19, 87–98. [Google Scholar]
- Kuhnt, K.; Baehr, M.; Rohrer, C.; Jahreis, G. Trans fatty acid isomers and the trans-9/trans11 index in fat containing foods. Eur. J. Lipid Sci. Technol. 2011, 113, 1281–1292. [Google Scholar] [CrossRef] [PubMed] [Green Version]
- Roe, M.; Pinchen, H.; Church, S.; Elahi, S.; Walker, M.; Farron-Wilson, M.; Buttriss, J.; Finglas, P. Trans fatty acids in a range of UK processed foods. Food Chem. 2013, 140, 427–431. [Google Scholar] [CrossRef]
- Baylin, A.; Siles, X.; Donovan-Palmer, A.; Fernandez, X.; Campos, H. Fatty acid composition of Costa Rican foods including trans fatty acid content. J. Food Compos. Anal. 2007, 20, 182–192. [Google Scholar] [CrossRef]
- Anwar, F.; Bhanger, M.I.; Iqbal, S.; Sultana, B. Fatty acid composition of different margarines and butters from pakistan with special emphasis on trans unsaturated contents. J. Food Qual. 2006, 29, 87–96. [Google Scholar] [CrossRef]
- Abramovič, H.; Vidrih, R.; Zlatić, E.; Kokalj, D.; Schreiner, M.; Žmitek, K.; Kušar, A.; Pravst, I. Trans fatty acids in margarines and shortenings in the food supply in Slovenia. J. Food Compos. Anal. 2018, 74, 53–61. [Google Scholar] [CrossRef]
- Satia, J.A.; Galanko, J.A.; Neuhouser, M.L. Food nutrition label use is associated with demographic, behavioral, and psychosocial factors and dietary intake among African Americans in North Carolina. J. Am. Diet. Assoc. 2005, 105, 392–403. [Google Scholar] [CrossRef] [PubMed]
- Kamel, S.; Otaibi, H.A. Trans-Fats Declaration, Awareness and Consumption in Saudi Arabia. Curr. Res. Nutr. Food Sci. 2018, 6, 748–756. [Google Scholar] [CrossRef]
- Stender, S. Industrially produced trans fat in popular foods in 15 countries of the former Soviet Union from 2015 to 2016: A market basket investigation. BMJ Open 2019, 9, e023184. [Google Scholar] [CrossRef] [Green Version]
- Stender, S. Trans fat in foods in Iran, South-Eastern Europe, Caucasia and Central Asia: A market basket investigation. Food Policy 2020, in press. [Google Scholar] [CrossRef]
- Lebanon Dairy Produce; Butter and Other Fats and Oils Derived from Milk Imports by Country/2018/Data (worldbank.org). Available online: https://wits.worldbank.org/trade/comtrade/en/country/LBN/year/2018/tradeflow/Exports/partner/ALL/product/040500 (accessed on 1 July 2021).
- World Food Program. WFP Lebanon Country Brief February 2021. Available online: www.wfp.org/countries/Lebanon (accessed on 2 July 2021).


| IP-TFAs in 100 g of Total Fat | ||||
|---|---|---|---|---|
| Dish | Total Fat (g) in 100 g | Total IP-TFA * per 100 g of Total Fat | Trans-C18:1n9t (Elaidic Acid) | Trans-C18:2n6t (Linolelaidic Acid) |
| Baba ghanouj | 9.44 | 0.74 | 0.66 | 0.08 |
| Batata mahchi | 1.24 | 1.98 | 1.92 | 0.06 |
| Borgul bil banadoura | 5.02 | 0.48 | 0.34 | 0.14 |
| Chichbarak | 4.62 | 0.98 | 0.86 | 0.12 |
| Falafel | 11.70 | 0.36 | 0.32 | 0.04 |
| Fatayer sabanikh | 11.16 | 0.18 | 0.12 | 0.04 |
| Fattat Hommos | 7.04 | 0.66 | 0.58 | 0.08 |
| Fattoush | 2.94 | 0.8 | 0.5 | 0.3 |
| Foul moudamas | 3.48 | 0.46 | 0.38 | 0.08 |
| Hindbe bil zet | 10.70 | 0.18 | 0.18 | 0 |
| Hommos bi tahini | 6.44 | 0.38 | 0.24 | 0.14 |
| Kafta wa batata | 6.32 | 1.28 | 1.18 | 0.1 |
| Kebba bil sayniya | 6.40 | 0.86 | 0.74 | 0.12 |
| Koussa mahchi | 2.42 | 1.26 | 1.1 | 0.16 |
| Lahm bil ajin | 8.96 | 0.34 | 0.22 | 0.12 |
| Loubia bil zet | 5.68 | 0.52 | 0.46 | 0.06 |
| Malfouf mahchi | 2.12 | 1.1 | 1.02 | 0.1 |
| Moujadara | 5.80 | 0.36 | 0.36 | 0 |
| Moghrabia | 3.94 | 0.86 | 0.76 | 0.1 |
| Mousaka batinjan | 6.58 | 0.5 | 0.34 | 0.16 |
| Riz a dajaj | 5.42 | 2.82 | 2.66 | 0.16 |
| Riz bi lahma | 6.52 | 0.82 | 0.78 | 0.04 |
| Sayadia | 6.48 | 0.22 | 0.18 | 0.04 |
| Shawarma dajaj | 6.94 | 0.24 | 0.16 | 0.08 |
| Shawarma lahma | 8.28 | 2.24 | 2.08 | 0.16 |
| Tabboula | 4.24 | 0.38 | 0.26 | 0.12 |
| Warak enab | 3.98 | 1.24 | 1.06 | 0.18 |
| Yakhnat Bamia | 5.42 | 1.24 | 1.02 | 0.22 |
| Yakhnat Fassoulia | 3.90 | 0.76 | 0.64 | 0.12 |
| Yakhnat Mouloukhia | 4.28 | 1 | 0.8 | 0.2 |
| IP-TFAs in 100 g of Total Fat | ||||
|---|---|---|---|---|
| Name | Total Fat (g) in 100 g | Total IP-TFAs per 100 g of Total Fat * | Trans-C18:1n9t (Elaidic Acid) | Trans-C18:2n6t (Linolelaidic Acid) |
| Baklava Mixed | 23.45 | 0.25 | 0.2 | 0.05 |
| Baklava Mixed Light | 20.5 | 0.3 | 0.3 | 0 |
| Halawat El Jiben | 8.95 | 1.2 | 1.05 | 0.15 |
| katayef Kashta | 6.65 | 0.9 | 0.65 | 0.25 |
| Kounafa bil jiben | 12.25 | 0.4 | 0.25 | 0.15 |
| Maakaroun | 12 | 0.1 | 0.1 | 0 |
| Maamoul Tamer | 17.4 | 0.4 | 0.25 | 0.15 |
| Maamoul mad Kashta | 10.65 | 0.4 | 0.25 | 0.15 |
| Maamoul mad joz | 19.2 | 0.45 | 0.4 | 0.05 |
| Maamoul joz | 21.5 | 0.85 | 0.75 | 0.1 |
| Mafrouka Kashta | 13.25 | 0.4 | 0.2 | 0.2 |
| Mafroukeh fostok | 10.6 | 0.6 | 0.5 | 0.1 |
| Moushabak | 20.1 | 0.4 | 0.4 | 0 |
| Nammoura | 5.9 | 1.5 | 1.3 | 0.2 |
| Osmaliya | 16.25 | 0.5 | 0.4 | 0.1 |
| Saniora | 23.8 | 1.15 | 0.85 | 0.3 |
| Sfouf | 12.45 | 1.45 | 1.2 | 0.25 |
| Barazik | 16.5 | 0.5 | 0.5 | 0 |
| Boundoukia | 19.5 | 0.3 | 0.3 | 0 |
| Daoukia | 14.8 | 0.4 | 0.3 | 0.1 |
| Foustoukia | 20.4 | 0.4 | 0.4 | 0 |
| Ghourayba | 0.325.8 | 0.6 | 0.4 | 0.2 |
| Ish el bulbul | 25.1 | 0.2 | 0.2 | 0 |
| kallaj kashta | 9.6 | <0.1 | - | - |
| Karabij joz maa crema | 18.8 | 0.4 | 0.2 | 0.2 |
| kounafa kashta maa kaak | 10 | 0.4 | 0.1 | 0.3 |
| Maakroun wa Moushabak | 13.7 | <0.1 | - | - |
| Maamoul fostok | 19.1 | 0.7 | 0.5 | 0.2 |
| Madlouka | 11.5 | 0.6 | 0.5 | 0.1 |
| Moufattaka | 20.7 | <0.1 | - | - |
| Mouhallabiya | 4 | 0.5 | 0.1 | 0.4 |
| Riz bil Halib | 4.4 | <0.1 | - | - |
| Shaaybiyat | 16.1 | <0.1 | - | - |
| Ward el sham | 14.2 | 0.5 | 0.5 | 0 |
| Znoud El sitt | 12.3 | <0.1 | - | - |
| IP-TFAs in 100 g of Total Fat | ||||
|---|---|---|---|---|
| Product | Total Fat (g) in 100 g | Total IP-TFA per 100 g of Total Fat | Trans-C18:1n9t (Elaidic Acid) | Trans-C18:2n6t (Linolelaidic Acid) |
| Arabic Bread-White | 2.3 | <0.1 | - | - |
| Arabic Bread-Whole wheat | 4 | <0.1 | - | - |
| Baguette | 0.5 | <0.1 | - | - |
| Biscuits Chocolate Quinoa | 13.4 | 0.1 | 0.1 | - |
| Biscuits Digestive | 17.1 | 0.3 | 0.1 | 0.2 |
| Biscuits Digestive Light | 13.8 | 0.3 | 0.1 | 0.2 |
| Biscuits with cream | 15.5 | <0.1 | - | - |
| Breakfast Cereals | 2.1 | <0.1 | - | - |
| Breakfast Cereals-Chocolate | 2.4 | 0.3 | 0.1 | 0.2 |
| Butter (n = 17 samples) | 80 | 0.8 | 0.6 | 0.2 |
| Cake with Cream | 16.1 | <0.1 | - | - |
| Chocolate Dark | 33.6 | <0.1 | - | - |
| Chocolate Milk-1 | 36.6 | 0.1 | 0.1 | - |
| Chocolate Milk-2 | 35 | <0.1 | - | - |
| Coffee without cardamon | 16.8 | 0.2 | 0.1 | 0.1 |
| Coffee with cardamon | 17.7 | 0.3 | 0.1 | 0.2 |
| Corn Oil | 100 | <0.1 | - | - |
| Croissant Zaatar-1 (cheap) | 16.1 | 0.7 | 0.4 | 0.3 |
| Croissant zaatar-2 (expensive) | 22.5 | 0.1 | 0.1 | |
| De-hulled Pumpkin Seeds | 50.6 | 0.6 | 0.3 | 0.3 |
| De-hulled Sunflower Seeds | 52.5 | 0.7 | 0.3 | 0.4 |
| Doughnuts | 19.6 | 0.5 | 0.5 | - |
| English Cake-Chocolate | 18.6 | 2.6 | 2.6 | - |
| Margarines (n = 18) | 100 | 2.4 | 2.2 | 0.2 |
| Halawa | 25.5 | 0.4 | 0.4 | - |
| Halawa Light | 29.9 | 1.3 | 1.1 | 0.2 |
| Hot Chocolate Powder | 5.4 | 0.3 | 0.3 | - |
| Instant Coffee | 10.8 | 0.2 | 0.2 | - |
| Kaak asrouni ** | 1.5 | Tr | - | - |
| Kaak debes and Cacao *** | 11.9 | 0.3 | 0.2 | 0.1 |
| Kaak korshalli **** | 6.9 | 0.5 | 0.5 | - |
| Mixed Kernels | 53.6 | <0.1 | - | |
| Mixed Nuts | 25.7 | 0.3 | 0.2 | 0.1 |
| Olive Oil | 100 | <0.1 | - | - |
| Pain au Lait | 3.8 | 2.7 | 2.7 | - |
| Petit Fours-1 (cheap) | 25.6 | 0.2 | 0.2 | - |
| Petit Fours-2 (expensive) | 29.6 | 0.2 | - | 0.2 |
| Potato Chips-1 | 29.9 | 0.1 | 0.1 | - |
| Potato Chips-2 | 15.4 | 0.3 | 0.2 | 0.1 |
| Potato Chips Light-1 | 26.9 | 0.1 | 0.1 | - |
| Potato Chips light-2 | 22.9 | 0.3 | 0.3 | - |
| Sunflower Oil | 100 | <0.1 | - | - |
| Tahina | 59.4 | 0.1 | - | 0.1 |
| Tuna Packed in Oil | 6.8 | 0.3 | 0.1 | 0.2 |
| Tuna Packed in Water | 0.5 | 0.6 | 0.6 | - |
| Wafer-Chocolate-1 | 21.7 | <0.1 | - | - |
| Wafer-Chocolate-2 (manufactured in Lebanon) | 24.2 | 6.5 | 6.2 | 0.3 |
| IP-TFAs | ||
|---|---|---|
| Countries | Trans-C18:1n9t (Elaidic Acid) (%) | Trans-C18:2n6t (Linolelaidic Acid) (%) |
| France | Cake: 24.43 Cereals: 28.9 Roasted bread: 33.1 Toasted bread: 25.8 Bread: 30.3 Cookies 38.9 | - |
| France | Cake: 18.5 | - |
| New Zealand | Margarines and table spreads (low trans): 0.1 Margarines and table spreads: 12.3 Margarine/butter blends: 8.3 Butters: 5.2 | Margarines and table spreads (low trans): 0.1 Margarines and table spreads: 1.3 Margarine/butter blends: 1.6 Butters: 1.7 |
| Spain | Spanish margarines: 8.17 | Spanish margarines: 0.49 |
| Bulgaria | Imported margarines: 8.4 Bulgarian margarines: 1.12 | - |
| Turkey | Margarine tub: 3.85 Margarine stick: 16.88 | Margarine tub: 0 Margarine stick: 2.09 |
| Korea | Breakfast cereal: 6.75 Cream-filled biscuit: 15.57 Cream-stuffed cake: 20.96 Canned coffee: 2.3 | Breakfast cereal: 0.25 Cream-filled biscuit: 0.43 Cream-stuffed cake: 0.66 Canned coffee: 0.3 |
| New Zealand | Biscuits and cakes: 0.9 Margarines/spreads: 4.9 Chocolate: 1.1 Snack bars: 0.4 Pies and pastry: 3.7 Partially cooked chips/wedges: 2.5 | Biscuits and cakes: 0 Margarines/spreads: 0.1 Chocolate: 0 Snack bars: 0.1 Pies and pastry: 0.4 Partially cooked chips/wedges: 0.4 |
| Pakistan | Margarines: 7.89 Butter: 3.82 | Margarines: 0.45 |
| Turkey | Margarines and shortenings: 10.55 | - |
| Canada | Tub margarines: 3.4 Print margarines: 5.5 | Tub margarines: 0.1 Print margarines: 0.3 |
| Costa Rica | Corn oil: 0.35 | Corn oil: 0.07 |
| Sunflower oil: 0.28 | Sunflower oil: 0.09 | |
| Olive oil: 0.26 | Olive oil: 0 | |
| Margarines: 10.15 | Margarines: 0.35 | |
| Butter: 5.1 | Butter: 0.23 | |
| Mixed nuts: 0.2 | Mixed nuts: 0 | |
| Mayonnaise: 0.02 | ||
| Canned tuna (oil): 0.54 | Canned tuna (oil): 0.08 | |
| Canned tuna (water): 1.07 | Canned tuna (water): 0 | |
| Nondairy coffee creamer: 30.84 | Nondairy coffee creamer: 1.15 | |
| Korea | Breakfast cereal: 0.5 Cream-filled biscuit: 2.4 Cream-stuffed cake: 1.36 Canned coffee: 2.3 | Breakfast cereal: 0.3 Cream-filled biscuit: 0.25 Cream-stuffed cake: 0.26 Canned coffee: 0.7 |
| Pakistan | Margarines: 19.48 | Margarines: 0.49 |
| Brazil | Regular dark Chocolate: 0.078 Regular chocolate: 0.075 | - |
| Germany | Margarines/spreads: 0.2 Shortenings/cooking fats: 0.51 Doughnuts: 2.07 Chocolate products: 0.44 Biscuits: 0.18 Instant coffee products: 0.36 Butter: 0.23 | - |
| Mexico | Spreadable margarines: 4.73 Stick margarines: 7.4 | Spreadable margarines: 0.39 Stick margarines: 0.94 |
| Turkey | Potato crisps: 0.13 Corn crisps: 0.24 Cocoa cakes: 0.37 Chocolate cakes: 0.55 Cream cakes: 0.78 Fruity cakes: 1 | Potato crisps: 0.15 Corn crisps: 0.16 Cocoa cakes: 0.11 Mosaic cakes: 0.05 Chocolate cakes: 0.08 Cream cakes: 0.24 Hazelnut-cocoa cakes: 0.14 Fruity cakes: 0.09 |
| India | Biscuit: 0.01 Pastry: 0.85 Cake: 1.92 Bread: 0.18 Bun: 1.31 | Biscuit: 0 Pastry: 0 Cake: 0.04 Bread: 0.007 Bun: 0.03 |
| Iran | Cakes: 18 Cream biscuits: 12 Simple biscuits: 9 Simple chocolates: 5 Potato chips: 10 Margarine: 3.2 | Cakes: 0 Cream biscuits: 2 Simple biscuits: 2 Simple chocolates: 0 Potato chips: 4 Margarine: 0.9 |
| UK | Breakfast cereal products: 0.03 Margarine, hard block: 0.05 Potato chips, takeaway: 0.97 Potato chips, fine cut, takeaway: 0.08 Potato chips, oven baked: <0.02 Potato snacks and corn snacks: 0.08 Confectionery, non-chocolate: 0.05 Confectionery, chocolate: 0.08 Butter, spreadable: 0.22 | - |
| Malaysia | Cakes: <0.001 Doughnuts: <0.001 Croissants: <0.001–0.02 White bread: <0.001 Whole grain bread: <0.001 Buns: <0.001 Cream crackers: <0.001–0.33 Chocolate biscuits: <0.001 Potato chips: <0.001–0.87 Chocolate bars: <0.001 Chocolate wafers: <0.001–0.38 Olive oil: 0.79 Blended oil (canola, soybean and olive): 0.82 Soybean oil: 1.76 Palm oil: 1.79 Corn oil: <0.001 Coco-coated cereal: 1.57 Corn cereal: <0.001 Cereal beverages: <0.001 | Cakes: <0.001 Doughnuts: <0.001 Croissants: <0.001 White bread: 3.12 Whole grain bread: <0.001 Buns: <0.001–1.21 Cream crackers: <0.001 Chocolate biscuits: <0.001–0.02 Potato chips: <0.001–1.02 Chocolate bars: <0.001–0.54 Chocolate wafers: <0.001 Olive oil: <0.001 Blended oil (canola, soybean and olive): 3.24 Soybean oil: 4.06 Palm oil: <0.001 Corn oil: 2.13 Coco-coated cereal: <0.001 Corn cereal: 4.82 Cereal beverages: <0.001–6.60 |
| Iran | Liquid frying oils: 0.08 Solid frying oils: 1.26 | Liquid frying oils: 0.01 Solid frying oils: 0.03 |
| Saudi Arabia | Margarines and shortenings: 5.43 | Margarines and shortenings: 1.49 |
| Iran | Margarines: 5.99 | Margarines: 0.66 |
| Iran | Biscuit: 12.86 Cake: 6.95 Shortcake: 3.38 Donuts: 3.29 Bread tan: 2.99 Baklava: 2.5 Chocolate: 1.24 Chips: 0.61 Snack: 0.52 | - |
| Iran | Edible oils: 0.07 Margarines: 5.3 | - |
| India | Cakes: 3.93 | Cakes: 2.82 |
| Lebanon | Cakes: 1.7 Biscuits: 3.7 Croissant: 2.7 Wafers: 5.6 | Cakes: 0.1 Biscuits: 0.1 Croissant: 0.1 Wafers: 0.1 |
| Slovenia | Margarines and shortenings: 34.63 | Margarines and shortenings: 21.38 |
| Serbia | Crackers: 0.9 Chips and flips: 5.34 Fried corn nuts: 1.7 | Crackers: 0.5 Chips and flips: 0.152 Fried corn nuts: 0.1 |
| Poland | Biscuits: 2.81 French pastry cookies: 1.65 | Biscuits: 0.21 French pastry cookies: 0.275 |
| Tunisia | Margarines: 4.47 Frying oil: 0.14 | Margarines: 4.47 Frying oil: 0.24 |
| Lebanon 2021 (current study) | Traditional dishes: 0.7 Arabic sweets: 0.5 Butter and margarines: 1.4 Biscuits, doughnuts, cake: 0.4 Cereals and breads group: 0.3 Tuna: 0.35 Chocolate and chocolate wafers: 1.26 Cooking oils: 0 Coffee and instant coffee: 0.2 Chips, nuts and seeds: 0.2 Tahina and Halawa: 0.5 | Traditional dishes: 0.9 Arabic sweets: 0.6 Butter and margarines: 1.6 Biscuits, doughnuts, cake: 0.5 Cereals and breads group: 0.3 Tuna: 0.45 Chocolate and chocolate wafers: 1.3 Cooking oils: 0 Coffee and instant coffee: 0.25 Chips, nuts and seeds: 0.3 Tahina and Halawa: 0.6 |
Publisher’s Note: MDPI stays neutral with regard to jurisdictional claims in published maps and institutional affiliations. |
© 2021 by the authors. Licensee MDPI, Basel, Switzerland. This article is an open access article distributed under the terms and conditions of the Creative Commons Attribution (CC BY) license (https://creativecommons.org/licenses/by/4.0/).
Share and Cite
Hoteit, M.; Zoghbi, E.; Rady, A.; Shankiti, I.; Ibrahim, C.; Al-Jawaldeh, A. Non-Conjugated-Industrially-Produced-Trans Fatty in Lebanese Foods: The Case of Elaidic and Linolelaidic Acids. Nutrients 2021, 13, 3664. https://doi.org/10.3390/nu13103664
Hoteit M, Zoghbi E, Rady A, Shankiti I, Ibrahim C, Al-Jawaldeh A. Non-Conjugated-Industrially-Produced-Trans Fatty in Lebanese Foods: The Case of Elaidic and Linolelaidic Acids. Nutrients. 2021; 13(10):3664. https://doi.org/10.3390/nu13103664
Chicago/Turabian StyleHoteit, Maha, Edwina Zoghbi, Alissar Rady, Iman Shankiti, Carla Ibrahim, and Ayoub Al-Jawaldeh. 2021. "Non-Conjugated-Industrially-Produced-Trans Fatty in Lebanese Foods: The Case of Elaidic and Linolelaidic Acids" Nutrients 13, no. 10: 3664. https://doi.org/10.3390/nu13103664
APA StyleHoteit, M., Zoghbi, E., Rady, A., Shankiti, I., Ibrahim, C., & Al-Jawaldeh, A. (2021). Non-Conjugated-Industrially-Produced-Trans Fatty in Lebanese Foods: The Case of Elaidic and Linolelaidic Acids. Nutrients, 13(10), 3664. https://doi.org/10.3390/nu13103664