
The Effect of Aerobic Exercise Training Frequency on Arterial Stiffness in a Hyperglycemic State in Middle-Aged and Elderly Females


Abstract
1. Introduction
2. Materials and Methods
2.1. Participants
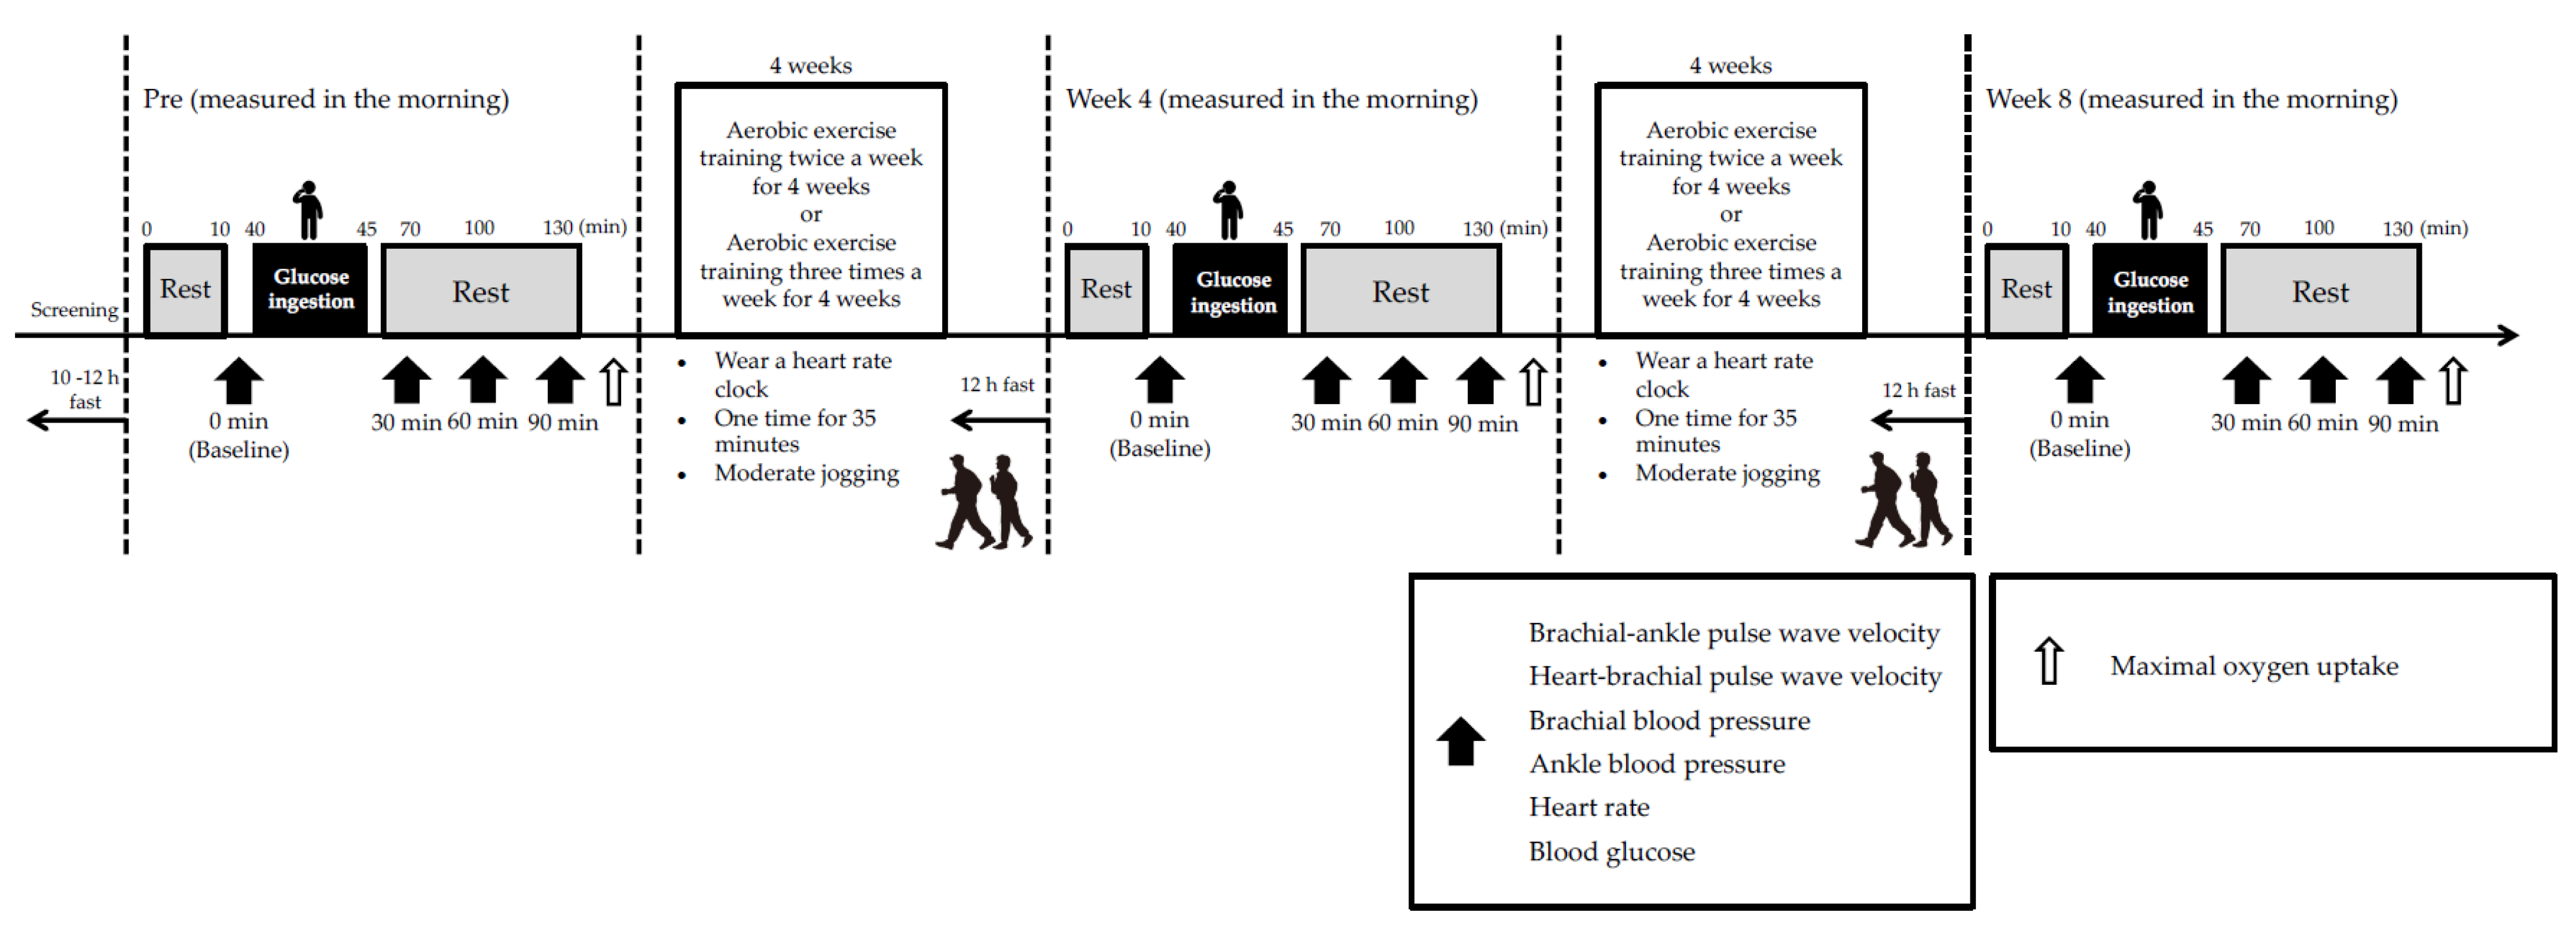
2.2. Study Design
2.3. Body Composition
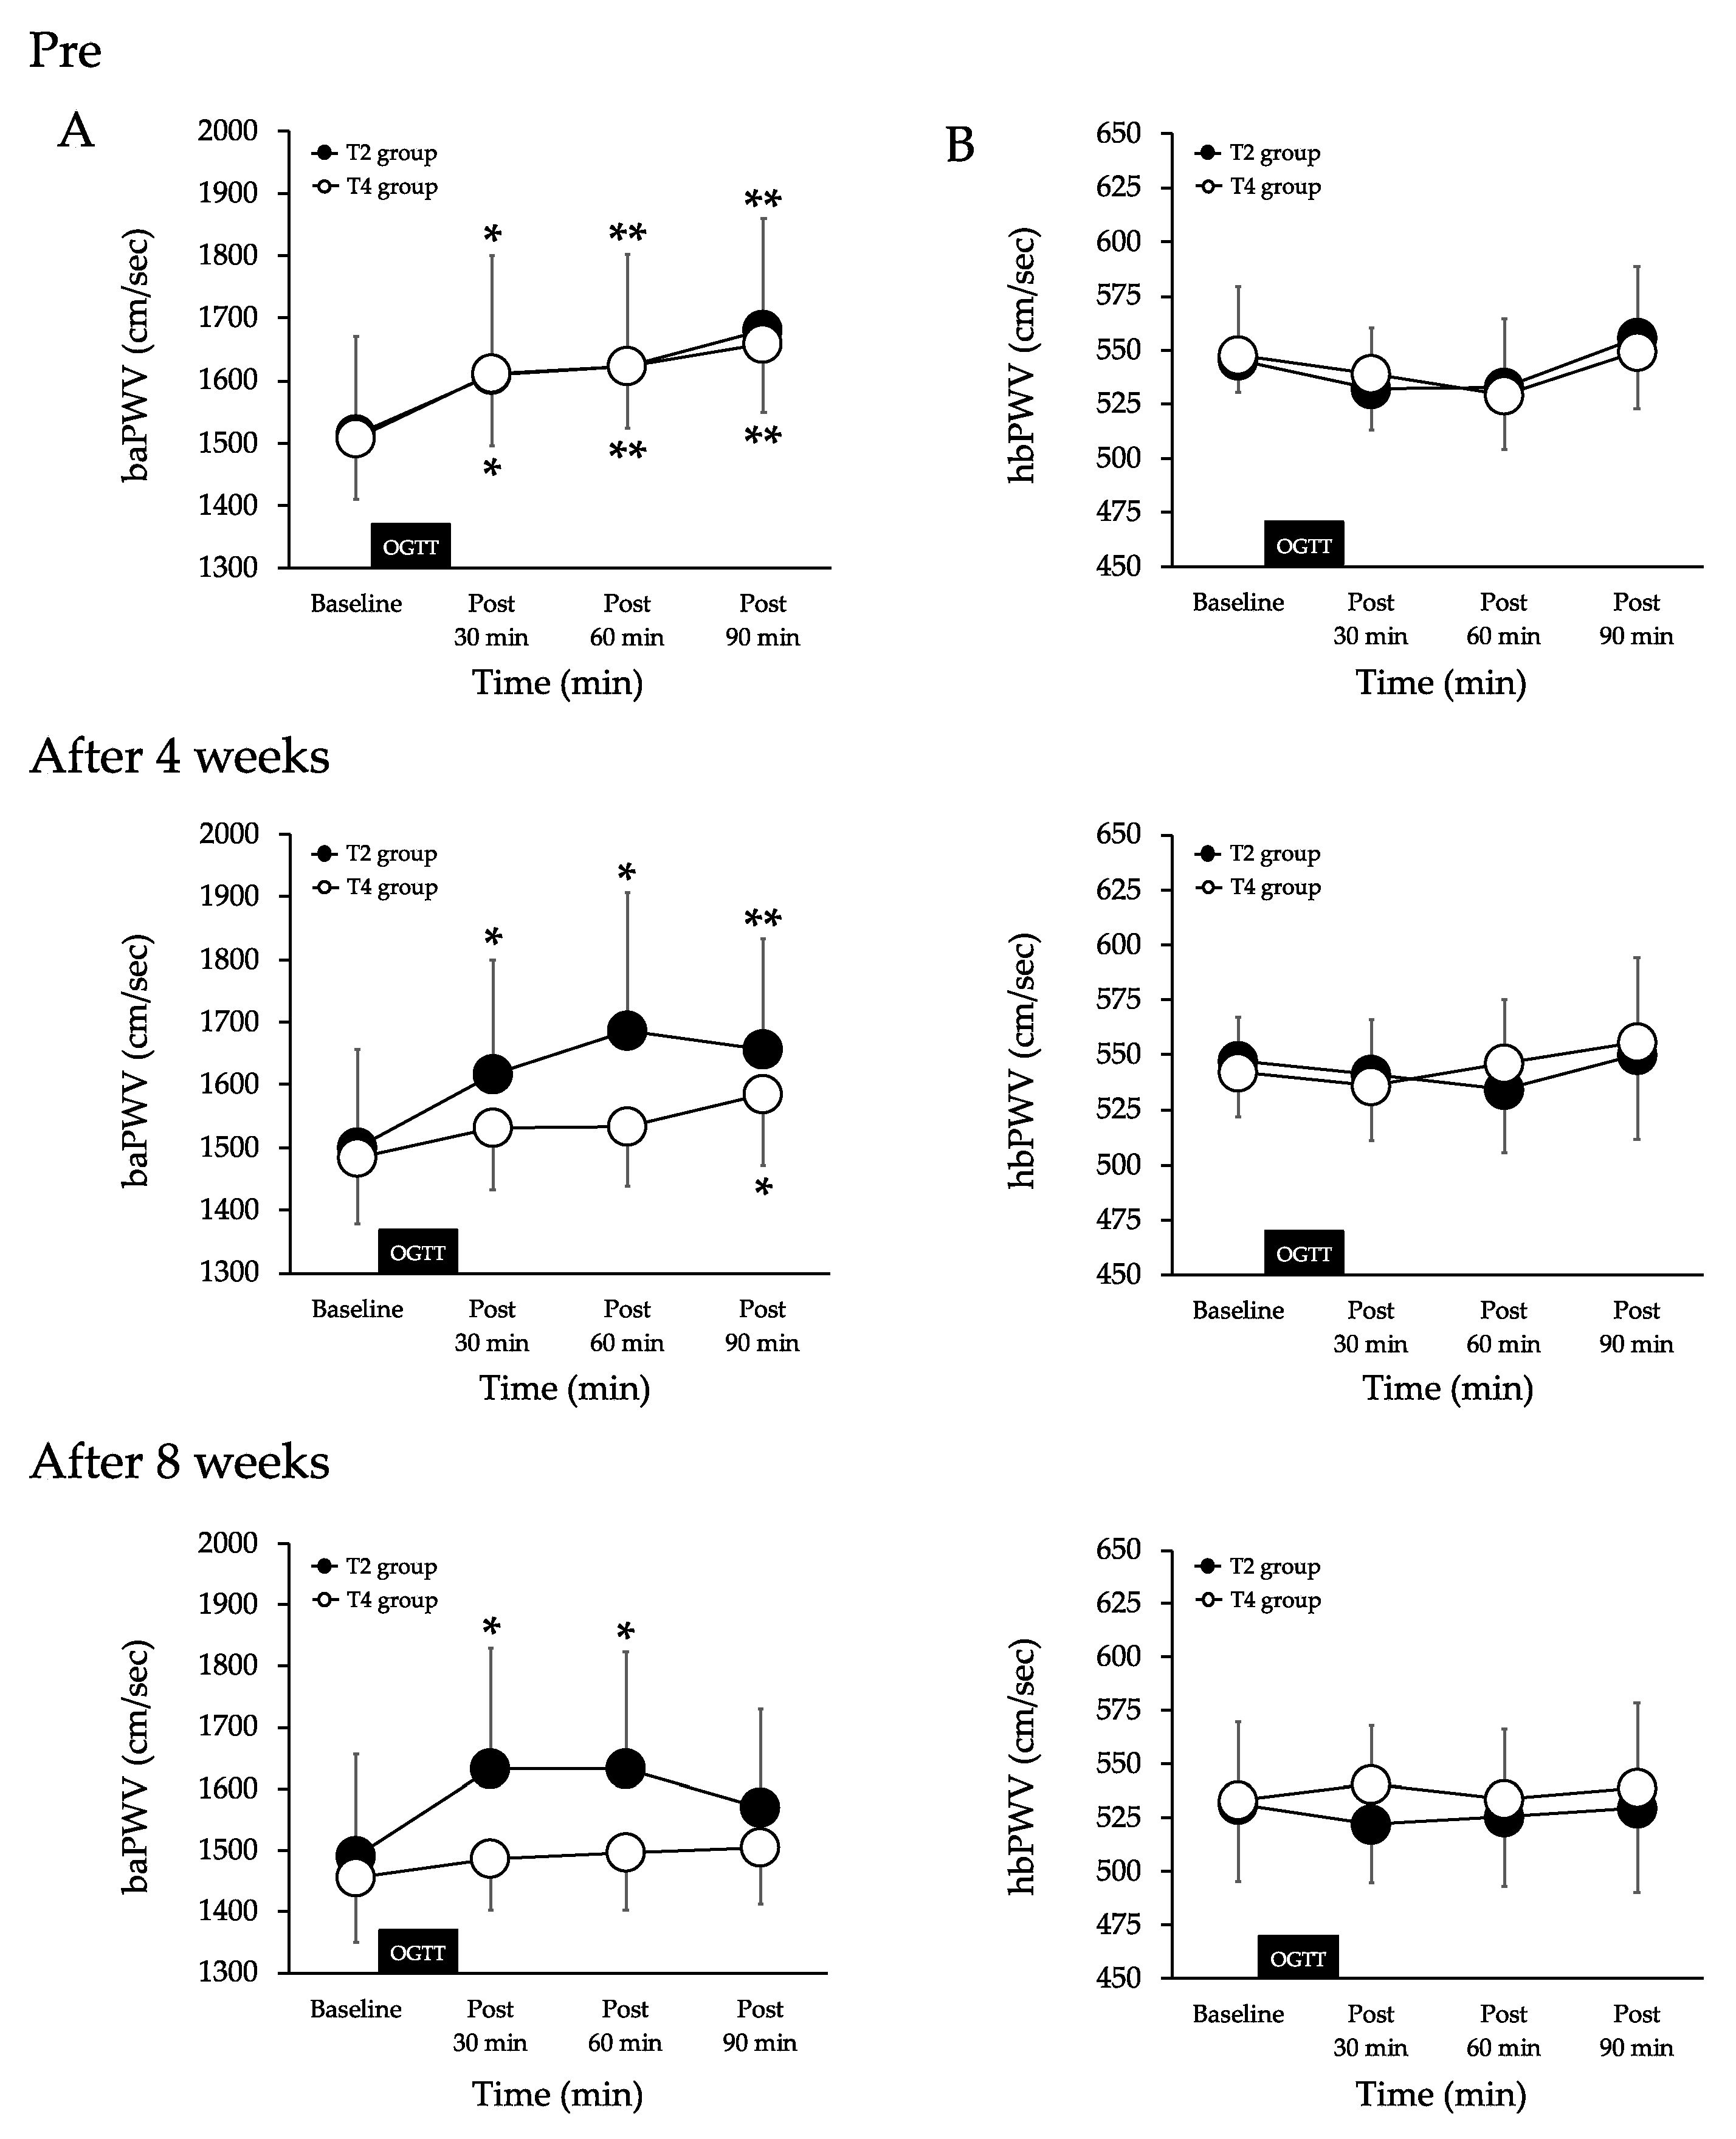
2.4. Arterial Stiffness
2.5. Upper Arm and Ankle Blood Pressure and Heart Rate
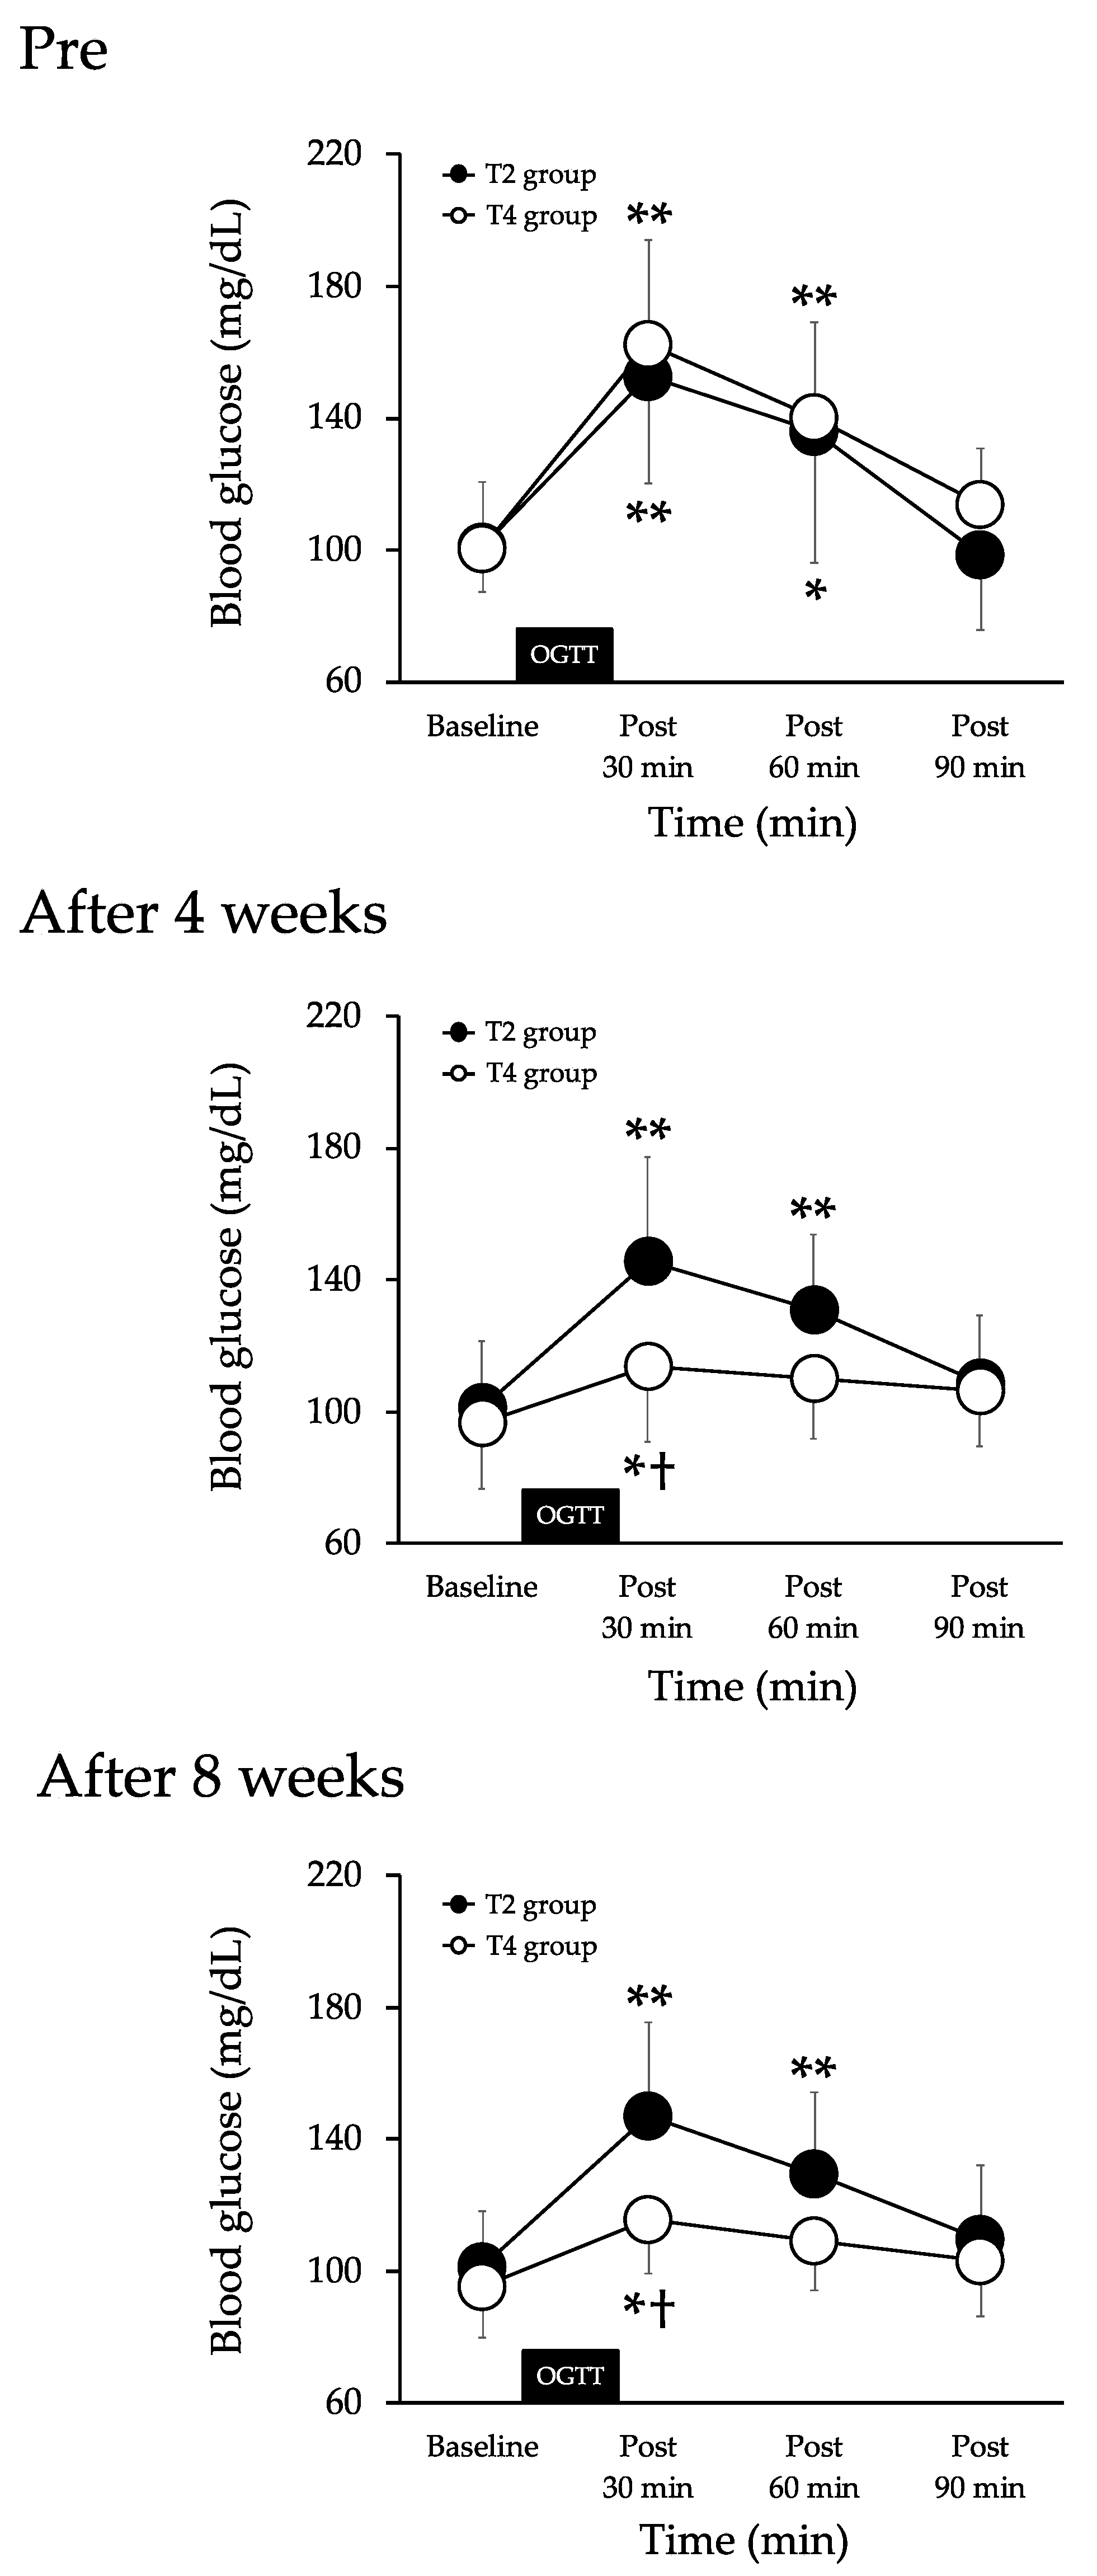
2.6. Blood Glucose
2.7. Oral Glucose Tolerance Test
2.8. Maximal Oxygen Uptake
2.9. Aerobic Exercise Training
2.10. Statistical Analysis
3. Results
3.1. Physical Characteristics
3.2. Arterial Stiffness
3.3. HR
3.4. Brachial Blood Pressure
3.5. Ankle Blood Pressure
3.6. BG
3.7. Maximal Oxygen Uptake
4. Discussion
5. Conclusions
Author Contributions
Funding
Institutional Review Board Statement
Informed Consent Statement
Data Availability Statement
Acknowledgments
Conflicts of Interest
References
- Tominaga, M.; Eguchi, H.; Manaka, H.; Igarashi, K.; Kato, T.; Sekikawa, A. Impaired Glucose Tolerance Is a Risk Factor for Cardiovascular Disease, but Not Impaired Fasting Glucose. The Funagata Diabetes Study. Diabetes Care 1999, 22, 920–924. [Google Scholar] [CrossRef] [PubMed]
- DECODE Study Group, the European Diabetes Epidemiology Group. Glucose Tolerance and Cardiovascular Mortality: Comparison of Fasting and 2-Hour Diagnostic Criteria. Arch. Intern. Med. 2001, 161, 397–405. [Google Scholar] [CrossRef] [PubMed]
- Fu, S.; Chen, W.; Luo, L.; Ye, P. Roles of Fasting and Postprandial Blood Glucose in the Effect of Type 2 Diabetes on Central Arterial Stiffness: A 5-Year Prospective Community-Based Analysis. Diabetol. Metab. Syndr. 2017, 9, 33. [Google Scholar] [CrossRef] [PubMed]
- Gordin, D.; Saraheimo, M.; Tuomikangas, J.; Soro-Paavonen, A.; Forsblom, C.; Paavonen, K.; Steckel-Hamann, B.; Vandenhende, F.; Nicolaou, L.; Pavo, I.; et al. Influence of Postprandial Hyperglycemic Conditions on Arterial Stiffness in Patients With Type 2 Diabetes. J. Clin. Endocrinol. Metab. 2016, 101, 1134–1143. [Google Scholar] [CrossRef] [PubMed]
- Kobayashi, R.; Sato, K.; Sakazaki, M.; Nagai, Y.; Iwanuma, S.; Ohashi, N.; Hashiguchi, T. Acute Effects of Difference in Glucose Intake on Arterial Stiffness in Healthy Subjects. Cardiol. J. 2021, 28, 446–452. [Google Scholar] [CrossRef]
- Takahashi, K.; Miura, S.; Mori-Abe, A.; Kawagoe, J.; Takata, K.; Ohmichi, M.; Kurachi, H. Impact of Menopause on the Augmentation of Arterial Stiffness with Aging. Gynecol. Obstet. Investig. 2005, 60, 162–166. [Google Scholar] [CrossRef]
- Tsuboi, A.; Ito, C.; Fujikawa, R.; Yamamoto, H.; Kihara, Y. Association between the Postprandial Glucose Levels and Arterial Stiffness Measured According to the Cardio-Ankle Vascular Index in Non-Diabetic Subjects. Intern. Med. Tokyo Jpn. 2015, 54, 1961–1969. [Google Scholar] [CrossRef]
- Arai, H.; Ouchi, Y.; Toba, K.; Endo, T.; Shimokado, K.; Tsubota, K.; Matsuo, S.; Mori, H.; Yumura, W.; Yokode, M.; et al. Japan as the Front-Runner of Super-Aged Societies: Perspectives from Medicine and Medical Care in Japan. Geriatr. Gerontol. Int. 2015, 15, 673–687. [Google Scholar] [CrossRef]
- Russo, C.; Jin, Z.; Palmieri, V.; Homma, S.; Rundek, T.; Elkind, M.S.V.; Sacco, R.L.; Di Tullio, M.R. Arterial Stiffness and Wave Reflection: Sex Differences and Relationship with Left Ventricular Diastolic Function. Hypertens. Dallas Tex 1979 2012, 60, 362–368. [Google Scholar] [CrossRef]
- Maeda, S.; Iemitsu, M.; Miyauchi, T.; Kuno, S.; Matsuda, M.; Tanaka, H. Aortic Stiffness and Aerobic Exercise: Mechanistic Insight from Microarray Analyses. Med. Sci. Sports Exerc. 2005, 37, 1710–1716. [Google Scholar] [CrossRef]
- Kobayashi, R.; Kasahara, Y.; Ikeo, T.; Asaki, K.; Sato, K.; Matsui, T.; Iwanuma, S.; Ohashi, N.; Hashiguchi, T. Effects of Different Intensities and Durations of Aerobic Exercise Training on Arterial Stiffness. J. Phys. Ther. Sci. 2020, 32, 104–109. [Google Scholar] [CrossRef]
- Seals, D.R.; Nagy, E.E.; Moreau, K.L. Aerobic Exercise Training and Vascular Function with Ageing in Healthy Men and Women. J. Physiol. 2019, 597, 4901–4914. [Google Scholar] [CrossRef] [PubMed]
- Tanahashi, K.; Akazawa, N.; Miyaki, A.; Choi, Y.; Ra, S.-G.; Matsubara, T.; Kumagai, H.; Oikawa, S.; Maeda, S. Aerobic Exercise Training Decreases Plasma Asymmetric Dimethylarginine Concentrations with Increase in Arterial Compliance in Postmenopausal Women. Am. J. Hypertens. 2014, 27, 415–421. [Google Scholar] [CrossRef] [PubMed]
- Kobayashi, R.; Sato, K.; Takahashi, T.; Asaki, K.; Iwanuma, S.; Ohashi, N.; Hashiguchi, T. Arterial Stiffness during Hyperglycemia in Older Adults with High Physical Activity vs Low Physical Activity. J. Clin. Biochem. Nutr. 2019, 65, 146–152. [Google Scholar] [CrossRef]
- Kobayashi, R.; Sato, K.; Takahashi, T.; Asaki, K.; Iwanuma, S.; Ohashi, N.; Hashiguchi, T. Effects of a Short-Term Increase in Physical Activity on Arterial Stiffness during Hyperglycemia. J. Clin. Biochem. Nutr. 2020, 66, 238–244. [Google Scholar] [CrossRef]
- Kobayashi, R.; Yoshida, S.; Okamoto, T. Effects of Acute Aerobic Exercise on Arterial Stiffness Before and After Glucose Ingestion. Int. J. Sports Med. 2017, 38, 12–18. [Google Scholar] [CrossRef]
- Kobayashi, R.; Hashimoto, Y.; Hatakeyama, H.; Okamoto, T. Acute Effects of Aerobic Exercise Intensity on Arterial Stiffness after Glucose Ingestion in Young Men. Clin. Physiol. Funct. Imaging 2018, 38, 138–144. [Google Scholar] [CrossRef]
- Sugawara, J.; Otsuki, T.; Tanabe, T.; Hayashi, K.; Maeda, S.; Matsuda, M. Physical Activity Duration, Intensity, and Arterial Stiffening in Postmenopausal Women. Am. J. Hypertens. 2006, 19, 1032–1036. [Google Scholar] [CrossRef] [PubMed]
- Miura, H.; Nakagawa, E.; Takahashi, Y. Influence of Group Training Frequency on Arterial Stiffness in Elderly Women. Eur. J. Appl. Physiol. 2008, 104, 1039–1044. [Google Scholar] [CrossRef] [PubMed]
- Shibata, S.; Fujimoto, N.; Hastings, J.L.; Carrick-Ranson, G.; Bhella, P.S.; Hearon, C.M.; Levine, B.D. The Effect of Lifelong Exercise Frequency on Arterial Stiffness. J. Physiol. 2018, 596, 2783–2795. [Google Scholar] [CrossRef]
- Faul, F.; Erdfelder, E.; Lang, A.-G.; Buchner, A. G*Power 3: A Flexible Statistical Power Analysis Program for the Social, Behavioral, and Biomedical Sciences. Behav. Res. Methods 2007, 39, 175–191. [Google Scholar] [CrossRef]
- Okamoto, T.; Masuhara, M.; Ikuta, K. Combined Aerobic and Resistance Training and Vascular Function: Effect of Aerobic Exercise before and after Resistance Training. J. Appl. Physiol. Bethesda Md 1985 2007, 103, 1655–1661. [Google Scholar] [CrossRef]
- Sugawara, J.; Tomoto, T.; Tanaka, H. Arterial Path Length Estimation for Heart-to-Brachium Pulse Wave Velocity. Hypertens. Res. Off. J. Jpn. Soc. Hypertens. 2018, 41, 444–450. [Google Scholar] [CrossRef]
- Committee of the Japan Diabetes Society on the Diagnostic Criteria of Diabetes Mellitus; Seino, Y.; Nanjo, K.; Tajima, N.; Kadowaki, T.; Kashiwagi, A.; Araki, E.; Ito, C.; Inagaki, N.; Iwamoto, Y.; et al. Report of the Committee on the Classification and Diagnostic Criteria of Diabetes Mellitus. J. Diabetes Investig. 2010, 1, 212–228. [Google Scholar] [CrossRef]
- Baynard, T.; Carhart, R.L.; Weinstock, R.S.; Ploutz-Snyder, L.L.; Kanaley, J.A. Short-Term Exercise Training Improves Aerobic Capacity with No Change in Arterial Function in Obesity. Eur. J. Appl. Physiol. 2009, 107, 299–308. [Google Scholar] [CrossRef] [PubMed]
- Lu, Y.; Pechlaner, R.; Cai, J.; Yuan, H.; Huang, Z.; Yang, G.; Wang, J.; Chen, Z.; Kiechl, S.; Xu, Q. Trajectories of Age-Related Arterial Stiffness in Chinese Men and Women. J. Am. Coll. Cardiol. 2020, 75, 870–880. [Google Scholar] [CrossRef] [PubMed]
- Yamashina, A.; Tomiyama, H.; Arai, T.; Koji, Y.; Yambe, M.; Motobe, H.; Glunizia, Z.; Yamamoto, Y.; Hori, S. Nomogram of the Relation of Brachial-Ankle Pulse Wave Velocity with Blood Pressure. Hypertens. Res. Off. J. Jpn. Soc. Hypertens. 2003, 26, 801–806. [Google Scholar] [CrossRef] [PubMed]
- Augustine, J.; Tarzia, B.; Kasprowicz, A.; Heffernan, K.S. Effect of a Single Bout of Resistance Exercise on Arterial Stiffness Following a High-Fat Meal. Int. J. Sports Med. 2014, 35, 894–899. [Google Scholar] [CrossRef]
- Huang, C.-L.; Chen, M.-F.; Jeng, J.-S.; Lin, L.-Y.; Wang, W.-L.; Feng, M.-H.; Liau, C.-S.; Hwang, B.-S.; Lee, Y.-T.; Su, T.-C. Postchallenge Hyperglycaemic Spike Associate with Arterial Stiffness. Int. J. Clin. Pract. 2007, 61, 397–402. [Google Scholar] [CrossRef]
- Olver, T.D.; Hazell, T.J.; Hamilton, C.D.; Shoemaker, J.K.; Lemon, P.W.R. Impaired Superficial Femoral Artery Vasodilation and Leg Blood Flow in Young Obese Women Following an Oral Glucose Tolerance Test. Appl. Physiol. Nutr. Metab. Physiol. Appl. Nutr. Metab. 2012, 37, 176–183. [Google Scholar] [CrossRef]
- Frøsig, C.; Rose, A.J.; Treebak, J.T.; Kiens, B.; Richter, E.A.; Wojtaszewski, J.F.P. Effects of Endurance Exercise Training on Insulin Signaling in Human Skeletal Muscle: Interactions at the Level of Phosphatidylinositol 3-Kinase, Akt, and AS160. Diabetes 2007, 56, 2093–2102. [Google Scholar] [CrossRef] [PubMed]
- Jacome-Sosa, M.; Parks, E.J.; Bruno, R.S.; Tasali, E.; Lewis, G.F.; Schneeman, B.O.; Rains, T.M. Postprandial Metabolism of Macronutrients and Cardiometabolic Risk: Recent Developments, Emerging Concepts, and Future Directions. Adv. Nutr. Bethesda Md 2016, 7, 364–374. [Google Scholar] [CrossRef] [PubMed]
- Marfella, R.; Sasso, F.C.; Cacciapuoti, F.; Portoghese, M.; Rizzo, M.R.; Siniscalchi, M.; Carbonara, O.; Ferraraccio, F.; Torella, M.; Petrella, A.; et al. Tight Glycemic Control May Increase Regenerative Potential of Myocardium during Acute Infarction. J. Clin. Endocrinol. Metab. 2012, 97, 933–942. [Google Scholar] [CrossRef]
- Sasso, F.C.; Rinaldi, L.; Lascar, N.; Marrone, A.; Pafundi, P.C.; Adinolfi, L.E.; Marfella, R. Role of Tight Glycemic Control during Acute Coronary Syndrome on CV Outcome in Type 2 Diabetes. J. Diabetes Res. 2018, 2018, 3106056. [Google Scholar] [CrossRef] [PubMed]
- Jensen, C.J.; Eberle, H.C.; Nassenstein, K.; Schlosser, T.; Farazandeh, M.; Naber, C.K.; Sabin, G.V.; Bruder, O. Impact of Hyperglycemia at Admission in Patients with Acute ST-Segment Elevation Myocardial Infarction as Assessed by Contrast-Enhanced MRI. Clin. Res. Cardiol. Off. J. Ger. Card. Soc. 2011, 100, 649–659. [Google Scholar] [CrossRef] [PubMed]
- Wei, C.H.; Litwin, S.E. Hyperglycemia and Adverse Outcomes in Acute Coronary Syndromes: Is Serum Glucose the Provocateur or Innocent Bystander? Diabetes 2014, 63, 2209–2212. [Google Scholar] [CrossRef]


| Variable | T2 Group | T4 Group | p-Value (Group) | ||||
|---|---|---|---|---|---|---|---|
| Pre | After 4 Week | After 8 Week | Pre | After 4 Week | After 8 Week | p-Value | |
| Age, years | 66.3 ± 4.4 | N/A | N/A | 65.7 ± 3.3 | N/A | N/A | N/A |
| Height, cm | 157.6 ± 2.2 | N/A | N/A | 160.8 ± 2.3 | N/A | N/A | N/A |
| Weight, kg | 56.4 ± 3.8 | 56.8 ± 4.0 | 56.0 ± 3.5 | 57.2 ± 0.9 | 57.3 ± 0.6 | 57.3 ± 0.4 | 0.308 |
| BMI, kg/m2 | 22.7 ± 1.5 | 22.9 ± 1.6 | 22.6 ± 1.4 | 23.1 ± 0.4 | 23.1 ± 0.4 | 23.1 ± 0.4 | 0.318 |
| Variable | Group | Intervention | Baseline | Post 30 min | Post 60 min | Post 90 min | p-Value (Group) |
|---|---|---|---|---|---|---|---|
| Brachial SBP, mmHg | T2 group | Pre | 124.8 ± 5.9 | 128.1 ± 6.9 | 131.0 ± 8.1 | 132.0 ± 7.2 * | 0.93 |
| T4 group | 124.6 ± 7.0 | 126.0 ± 6.2 | 129.1 ± 5.8 | 133.0 ± 6.4 | |||
| T2 group | After 4 weeks | 122.9 ± 6.6 | 124.6 ± 7.3 | 128.1 ± 8.1 | 127.9 ± 7.8 | 0.93 | |
| T4 group | 123.1 ± 7.6 | 124.0 ± 6.1 | 125.5 ± 6.3 | 127.4 ± 4.8 | |||
| T2 group | After 8 weeks | 122.3 ± 5.1 | 124.8 ± 5.3 | 127.8 ± 6.7 | 126.5 ± 6.7 | 0.82 | |
| T4 group | 122.4 ± 4.5 | 122.7 ± 5.0 | 123.0 ± 6.1 | 125.9 ± 6.7 | |||
| Brachial MBP, mmHg | T2 group | Pre | 90.3 ± 4.2 | 91.4 ± 4.2 | 92.9 ± 4.7 | 93.2 ± 4.4 | 0.85 |
| T4 group | 89.7 ± 2.5 | 90.5 ± 2.5 | 91.3 ± 3.0 | 92.6 ± 2.5 | |||
| T2 group | After 4 weeks | 88.9 ± 4.7 | 89.5 ± 4.7 | 90.4 ± 4.8 | 90.8 ± 5.1 | 0.88 | |
| T4 group | 88.2 ± 3.4 | 88.5 ± 3.6 | 88.9 ± 3.8 | 90.6 ± 2.8 | |||
| T2 group | After 8 weeks | 88.1 ± 3.8 | 88.5 ± 3.4 | 90.1 ± 3.8 | 91.3 ± 4.1 | 0.81 | |
| T4 group | 87.4 ± 2.0 | 88.1 ± 2.1 | 88.5 ± 3.3 | 89.6 ± 2.8 | |||
| Brachial DBP, mmHg | T2 group | Pre | 73.0 ± 3.5 | 73.1 ± 2.9 | 73.8 ± 3.3 | 73.8 ± 3.4 | 0.80 |
| T4 group | 72.2 ± 2.3 | 72.7 ± 2.0 | 72.4 ± 2.9 | 72.4 ± 2.6 | |||
| T2 group | After 4 weeks | 71.9 ± 3.9 | 71.9 ± 3.9 | 71.5 ± 3.2 | 72.2 ± 3.9 | 0.86 | |
| T4 group | 70.8 ± 2.7 | 70.8 ± 3.2 | 70.6 ± 4.0 | 72.2 ± 3.0 | |||
| T2 group | After 8 weeks | 71.0 ± 3.2 | 70.4 ± 2.7 | 71.2 ± 2.5 | 73.7 ± 3.0 | 0.84 | |
| T4 group | 69.9 ± 2.3 | 70.7 ± 2.3 | 71.2 ± 3.2 | 71.5 ± 2.4 | |||
| HR, beats/min | T2 group | Pre | 66.1 ± 3.3 | 64.0 ± 2.0 | 63.1 ± 2.6 | 62.3 ± 2.0 | 0.50 |
| T4 group | 63.6 ± 3.4 | 62.9 ± 2.9 | 59.9 ± 2.5 | 59.4 ± 2.8 | |||
| T2 group | After 4 weeks | 65.9 ± 3.6 | 64.9 ± 2.5 | 63.3 ± 1.8 | 60.8 ± 2.6 | 0.18 | |
| T4 group | 62.7 ± 4.8 | 59.4 ± 2.7 | 57.1 ± 2.2 | 55.4 ± 1.8 | |||
| T2 group | After 8 weeks | 62.3 ± 3.4 | 61.5 ± 3.1 | 62.4 ± 2.2 | 61.1 ± 2.7 | 0.35 | |
| T4 group | 59.4 ± 2.4 | 60.7 ± 2.1 | 56.9 ± 1.7 | 57.1 ± 1.8 |
| Variable | Group | Intervention | Baseline | Post 30 min | Post 60 min | Post 90 min | p-Value (Group) |
|---|---|---|---|---|---|---|---|
| Ankle SBP, mmHg | T2 group | Pre | 149.2 ± 7.5 | 155.6 ± 7.8 * | 162.1 ± 8.7 * | 163.2 ± 8.9 ** | 0.98 |
| T4 group | 150.2 ± 12.2 | 156.6 ± 11.6 * | 161.6 ± 13.9 * | 163.0 ± 10.7 ** | |||
| T2 group | After 4 weeks | 149.9 ± 7.5 | 152.1 ± 6.5 | 151.8 ± 6.9 | 153.4 ± 5.3 | 0.92 | |
| T4 group | 48.8 ± 13.4 | 152.7 ± 10.8 | 152.9 ± 11.1 | 154.4 ± 11.5 | |||
| T2 group | After 8 weeks | 149.0 ± 8.6 | 149.2 ± 7.0 | 151.7 ± 8.8 | 153.9 ± 7.5 | 0.97 | |
| T4 group | 147.2 ± 9.2 | 150.2 ± 9.7 | 153.1 ± 10.3 | 152.1 ± 10.3 | |||
| Ankle MBP, mmHg | T2 group | Pre | 98.6 ± 4.4 | 101.0 ± 4.3 | 103.1 ± 5.0 | 104.7 ± 5.1 | 0.95 |
| T4 group | 98.9 ± 4.1 | 101.5 ± 4.0 | 102.7 ± 4.3 | 105.6 ± 3.1 | |||
| T2 group | After 4 weeks | 96.6 ± 3.8 | 97.5 ± 3.5 | 97.6 ± 4.0 | 98.3 ± 3.9 | 0.98 | |
| T4 group | 97.1 ± 5.1 | 98.4 ± 3.8 | 98.4 ± 3.8 | 100.1 ± 3.8 | |||
| T2 group | After 8 weeks | 97.2 ± 5.4 | 97.0 ± 4.2 | 98.7 ± 4.9 | 100.6 ± 4.7 | 0.95 | |
| T4 group | 95.8 ± 2.8 | 96.7 ± 2.9 | 98.0 ± 3.3 | 99.9 ± 3.5 | |||
| Ankle DBP, mmHg | T2 group | Pre | 73.4 ± 3.1 | 73.8 ± 2.7 | 73.6 ± 3.4 | 75.4 ± 3.6 | 0.93 |
| T4 group | 73.3 ± 1.9 | 73.9 ± 1.2 | 73.3 ± 1.9 | 76.9 ± 2.8 | |||
| T2 group | After 4 weeks | 70.0 ± 2.2 | 70.2 ± 2.2 | 70.5 ± 2.7 | 70.7 ± 3.4 | 0.91 | |
| T4 group | 71.3 ± 2.2 | 71.2 ± 2.3 | 71.2 ± 2.4 | 73.0 ± 2.1 | |||
| T2 group | After 8 weeks | 71.3 ± 3.9 | 70.9 ± 3.1 | 72.3 ± 3.1 | 73.9 ± 3.5 | 0.84 | |
| T4 group | 70.1 ± 2.0 | 69.6 ± 1.9 | 70.4 ± 2.3 | 73.7 ± 1.7 |
| Variable | T2 Group | T4 Group | p-Value (Group) | ||||
|---|---|---|---|---|---|---|---|
| Pre | After 4 Week | After 8 Week | Pre | After 4 Week | After 8 Week | p-Value | |
| VO2max, ml/kg/min | 21.4 ± 1.4 | 23.4 ± 1.3 * | 25.2 ± 1.5 ** | 22.6 ± 2.8 | 27.0 ± 2.5 ** | 30.1 ± 1.4 ** | 0.204 |
Publisher’s Note: MDPI stays neutral with regard to jurisdictional claims in published maps and institutional affiliations. |
© 2021 by the authors. Licensee MDPI, Basel, Switzerland. This article is an open access article distributed under the terms and conditions of the Creative Commons Attribution (CC BY) license (https://creativecommons.org/licenses/by/4.0/).
Share and Cite
Kobayashi, R.; Asaki, K.; Hashiguchi, T.; Negoro, H. The Effect of Aerobic Exercise Training Frequency on Arterial Stiffness in a Hyperglycemic State in Middle-Aged and Elderly Females. Nutrients 2021, 13, 3498. https://doi.org/10.3390/nu13103498
Kobayashi R, Asaki K, Hashiguchi T, Negoro H. The Effect of Aerobic Exercise Training Frequency on Arterial Stiffness in a Hyperglycemic State in Middle-Aged and Elderly Females. Nutrients. 2021; 13(10):3498. https://doi.org/10.3390/nu13103498
Chicago/Turabian StyleKobayashi, Ryota, Kenji Asaki, Takeo Hashiguchi, and Hideyuki Negoro. 2021. "The Effect of Aerobic Exercise Training Frequency on Arterial Stiffness in a Hyperglycemic State in Middle-Aged and Elderly Females" Nutrients 13, no. 10: 3498. https://doi.org/10.3390/nu13103498
APA StyleKobayashi, R., Asaki, K., Hashiguchi, T., & Negoro, H. (2021). The Effect of Aerobic Exercise Training Frequency on Arterial Stiffness in a Hyperglycemic State in Middle-Aged and Elderly Females. Nutrients, 13(10), 3498. https://doi.org/10.3390/nu13103498