Abstract
The aim of this study was to explore United States (U.S.) seafood consumption patterns, food sourcing, expenditures, and geography of consumption. We analyzed seafood intake and food sourcing using the National Health and Nutrition Examination Survey (NHANES) cycles 2007–2008 to 2015–2016 for US adults ≥19 years old (n = 26,743 total respondents; n = 4957 respondents consumed seafood in the past 24 h). Seafood expenditures were extrapolated by combining NHANES with three other public datasets. U.S. adults consumed 63% of seafood (by weight) at home. The top sources of seafood (by weight) were food retail (56%), restaurants (31%), and caught by the respondent or someone they know (5%). Sixty-five percent of consumer expenditures for seafood were at restaurants and other “away from home” sources while 35% were at retail and other “at home” sources. Slightly less than half of overall U.S. food expenditures are “away from home,” which is much lower than for seafood, suggesting that consumers have very different spending habits for seafood than for an aggregate of all foods.
Keywords:
diet; fish; salmon; shrimp; restaurant; food away from home; food at home; NHANES; retail; seafood 1. Introduction
United States (U.S.) consumers receive the majority of their protein from terrestrial animals [1], however, seafood consumption has been linked with numerous health benefits, including reduced risk of coronary heart disease, ischemic stroke, and cardiac death [2,3]. Federal dietary guidelines recommend that adults consume at least 227 g/week (8 oz/week) of seafood based on a 2000 kcal diet (for reference, one seafood serving is 85 g or 3 oz, cooked wt) [4]. Only 10% to 20% of U.S. consumers meet the federal Dietary Guidelines [5].
The current U.S. seafood supply provides 140 g/week (4.9 oz/week) per person, a level that has remained relatively constant for three decades [6,7]. Market growth in terms of amount consumed is significant [6,7], but mainly reflects population growth. Analyses of trade data indicate that the five top species consumed by Americans are shrimp, salmon, canned tuna, catfish/pangasius, and tilapia, which jointly comprise 70–80% of the U.S. seafood supply [6]. Focus has shifted from wild capture to farm-raised products, and there is an increasing reliance on imports as U.S. production has been stable since the mid-1980′s [6].
Americans spend $102 billion each year on seafood, predominantly at food service venues (e.g., restaurants, institutional food) [7], however, this finding has not been independently verified. Retail scanner data can explain market trends among grocery shoppers by product, region, and season [8,9,10], but these analyses have been limited to frozen and canned seafood and do not include fresh seafood. Consumers note preferences to purchase familiar types of seafood, which limits the demand for diverse fish types [11]. Economies of scale in the supply chain accentuate this narrowing [12]. Consumer purchasing behavior is multi-faceted, as are the drivers and barriers that affect seafood consumption [13]. Price, convenience, product quality, taste, culture, preferences, and habits, as well as origin, production methods, and labeling are each important [13]. Consumers also say they are willing to spend more for seafood with environmental or social certifications [14,15], however, the complex messaging around these issues can confuse consumers [16].
Several key knowledge gaps exist around seafood consumption. There is little detailed information about consumer habits when sourcing seafood. For example, is seafood more often consumed at lunch or dinner? Do consumers purchase some species more often at supermarkets or restaurants? There is also incomplete information about the distribution of seafood consumption within the U.S. The present study seeks to describe national seafood consumption patterns, food sourcing and expenditures using multiple, publicly available data sources. Dietary habits can serve as a proxy for purchasing behaviors and provide a more nuanced understanding of consumer seafood choices than was previously available. This study can also inform government agencies and healthcare professionals that may wish to change Americans’ seafood consumption or shift purchasing habits.
2. Materials and Methods
2.1. Dietary Data
The National Health and Nutrition Examination Survey (NHANES) is a nationally representative survey of Americans that is administered by the U.S. government. NHANES uses a complex, multistage, probability sampling design that continuously samples approximately seven thousand non-military, non-institutionalized Americans annually, in order to obtain a nationally representative sample [17]. Data are released in two-year cycles. One component of NHANES is a 24-h dietary recall survey called What We Eat In America (WWEIA), which is administered by the U.S. Departments of Agriculture (USDA) and Health and Human Services (HHS) [18]. NHANES and WWEIA (which we will collectively refer to as NHANES) collect detailed information about food intake, sourcing, time and location of consumption, the nutritional content of foods, and supporting demographic information.
2.2. NHANES Seafood Analysis
We analyzed the NHANES day-1 dietary recall dataset for adults (≥19) respondents over five survey cycles (2007–2008, 2009–2010, 2011–2012, 2013–2014, and 2015–2016), which contained 26,743 total adult respondents, including 4957 individuals who reported consuming seafood (i.e., fish, crustaceans, mollusks, other aquatic animals) in the prior day (henceforth: “seafood consumers”). NHANES data were joined with the USDA Food Patterns Equivalents Database [19], which converts foods consumed by NHANES respondents into grams by food group—in this case grams of seafood.
We assessed per capita seafood consumption in relation to several sociodemographic status variables: sex; age (19–30, 31–50, 51–70, +71); and income (above or below the 185% poverty threshold). These variables and break-points were chosen to better compare with previous NHANES seafood analyses [5]. We then analyzed seafood consumption by the location where a meal was purchased (variable name: “DR1FS”), the location where a meal was consumed (variable name: “DR1_040Z”), and the meal type (variable name: “DR1_030Z”) among seafood consumers. We used established definitions for food source created by the USDA: “Food at home” includes food obtained at grocery store or seafood caught by the consumer or someone known to them; and “food away from home” includes food obtained from a restaurant, institution, or school (Supplementary Materials Table S1) [20].
We explored seafood species intake by food source to better understand where Americans purchase the seafood species they consume. We accessed per capita seafood supply from the National Marine Fisheries Service [7] and National Fisheries Institute [21], and then compared per capita supply to per capita consumption.
2.3. Seafood Expenditure by Food Source
We estimated consumer spending by food source using previously described methods [22]. Briefly, we linked the NHANES database to the Center for Nutrition Policy and Promotion Food Prices Database, Consumer Price Index, and USDA National Household Food Acquisition and Purchase Survey (as described in [22]). Each food reported consumed by NHANES participants was linked with a food commodity in the USDA Loss-Adjusted Food Availability Database, which provides data on the amount of food lost and wasted at each point in the food system. This method also accounts for the consumer cost of seafood waste and inedible portions, as described by others [23].
2.4. Database Management and Statistical Analysis
Data were analyzed in R Studio (v1.2). We accounted for the complex sampling design within NHANES using primary sampling units, strata, and a 5-year weighted average variable to construct unbiased national estimates of seafood consumption. Two-sample t-tests were used to compare variables, such as fish consumption by gender. Survey-weighted generalized linear models were fit to compare three or more variables such as age classes. All data analyses were carried out in R Studio using the R statistical language and the survey and srvyr packages.
2.5. Geography of Seafood Consumption
We used ArcGIS (v10.7, Redlands, CA, USA) to map seafood consumption by U.S. county. We achieved this by determining the per capita consumption (g/day raw weight, edible portion) by county [24] and then multiplying by the county population [25] to get tons of seafood consumed per county per year. Per capita consumption by region and coastal vs. non-coastal areas was reported by the U.S. Environmental Protection Agency using NHANES analyses and modeling (Supplementary Materials Table S4) [24]. Log scale was used to account for the wide range in quantities consumed over space. The map uses WSF 1984 Web Mercator (auxiliary sphere) coordinate system and the county boundaries on the map are derived from the 2017 U.S. County TIGER/Line Shapefile.
3. Results
3.1. Per Capita Seafood Consumption
Average seafood consumption per capita was 18 g in the past 24-h across adult seafood consumers and non-consumers (Table 1). Among seafood consumers (respondents who consumed seafood in the past 24 h), average seafood consumption was 106.9 g (3.7 oz) (Table 1). Seafood consumption amounts were larger among men compared to women, those of middle age (31–50 y/o) compared to other ages, and individuals with higher incomes versus lower. Lower income was set at the 185% poverty threshold, which for a family of four would be $38,000 to $45,000 annual income during the study period.

Table 1.
Per capita seafood intake in United States adults (≥19) in the past 24 h (National Health and Nutrition Examination Survey (NHANES) 2007 to 2016).
3.2. Food Sourcing of Seafood
Sixty-one percent of seafood intake (by weight) was obtained from food sources consistent with USDA’s definition of “food at home” and 39% from food sources within the “food away from home” category (Table 2). The top five most commonly reported sources of seafood (by weight) were stores (i.e., grocery stores, 56%), restaurants (31%), a gift (5%), fish caught by you or someone you know (5%), or institutional food (2%), jointly accounting for nearly 98% of all seafood sources.
Table 2.
Meal type, food source, and location of meal in United States adult seafood consumers (≥19) in the past 24 h (NHANES 2007 to 2016).
We found good agreement between questions related to food sourcing and the location where the meal was consumed. Overall, 63% of seafood by weight was eaten at home, which is consistent with 61% of seafood by weight from “food at home” sources. When exploring the “food at home” category, 88% of seafood from these sources was eaten at home. Twenty-five percent of seafood from restaurants and other “food away from home” locations was eaten at home, which could be restaurant take-out or meal delivery.
The average per capita seafood meal size was 96.0 g (3.4 oz), which was 13% more than the U.S. recommended serving size for cooked seafood (85 g or 3 oz) [4,26]. The average meal size from food purchased at retail stores was 97.1 g (or 3.4 oz) and restaurants was 90.8 g (or 3.2 oz). Self-caught fish meals (170.0 g) were significantly larger than average seafood meal sizes from all sources.
Next, we explored when seafood was consumed (breakfast, lunch, dinner, snack) and where these meals were purchased and consumed (Table 2). Seafood was primarily consumed at dinner (62% by weight) with the remainder at lunch (29%), snack (4%) or breakfast (3%). Based on quantity consumed per meal, seafood portions were 30% larger at dinner than lunch. Seafood dinners were primarily consumed at home, while seafood lunches were more often consumed away from home at restaurants and other venues.
3.3. Seafood Species Consumed
By calculating the total quantity consumed by Americans, the species consumed in the greatest amounts (from most to least) were salmon, shrimp, canned tuna, “fish”, tilapia, and catfish (Table 3). Interestingly, there were preferences to purchase some species at retail stores (e.g., tilapia, canned tuna, and salmon) and other species at restaurants and other “away from home” venues (e.g., crab, shrimp, cod). To provide another perspective on sourcing we analyzed responses to a different question: “was the meal consumed at home?” and found good agreement with food sourcing. Food sourced from retail was largely eaten at home, and food sourced from restaurants and other venues was eaten away from home. The increased share of home consumption (compared to sourcing for foods often purchased at restaurants) may be due to restaurant take-out or meal delivery. We present consumption according to species and food source for adults and all ages in Supplementary Materials Tables S2 and S3.
Table 3.
Top seafood species consumed by United States adult seafood consumers (≥19) (NHANES 2007 to 2016).
3.4. Intake Versus Supply
We compared seafood supply reported by National Marine Fisheries Service (NMFS) to seafood consumption from in this study (Table 4). These comparisons were made both on a per-capita basis (lbs/yr, which is consistent with the supply data as provided) and by the rank order by species. Total per capita consumption was 11.7 lb/yr (5.3 kg/yr) edible portion, cooked wt, which is 24% less than the U.S. seafood supply (15.3 lb/yr or 6.9 kg/yr, edible portion, raw wt) [1]. Supply and consumption rates were proportional across species, suggesting NMFS and NHANES data sets are overall in agreement. Consumption frequencies generally predicted the rank order of species available in the U.S. seafood supply, other than shrimp and catfish supplies, which were disproportionately high compared to consumption.
Table 4.
Per capita supply (National Marine Fisheries Service (NMFS)) and consumption (NHANES) of top seafood species (2007 to 2016).
3.5. Seafood Expenditures by Food Source
We modeled seafood expenditures by food source (Table 5). We found “food at home” and “food away from home” expenditures were 35% and 65% of the retail value, respectively, which is a similar ratio to previous estimates by NMFS. Similar results using two different sets of methods and datasets suggest that the findings are reliable.
Table 5.
Seafood expenditure by food source modeled using supply (NMFS) and consumption data (NHANES) (2007–2016).
3.6. Geography of Seafood Consumption
Seafood consumption is not evenly spread across the U.S. Living away from the coast (>25 mi), regardless of the region in the U.S., was associated with a 5 g/day (0.18 oz/day) drop in seafood consumption among adults (Supplementary Materials Table S4, Figure S1). When combining coastal status and region, the lowest consumption rates were among inland Midwest (12.4 g/day; 0.44 oz/day) and inland Great Lakes (14.6 g/day; 0.52 oz/day) adults, and the highest consumption rates were among coastal Northeast (24.5 g/day;0.86 oz/day) and coastal Pacific (22.1 g/day; 0.78 oz/day) adults.
To better understand the spatial variability, we multiplied per capita consumption rates (Supplementary Materials Table S4, Figure S1) by population density to obtain total seafood demand by county (Figure 1). As one might expect, urban centers consumed more seafood than rural areas. This was true regardless of whether the city was near to or far from the coast (Figure 1). Somewhat surprisingly, demand in non-urban coastal regions was moderate to low, which indicates that population density is a stronger indicator of demand than coastal proximity.
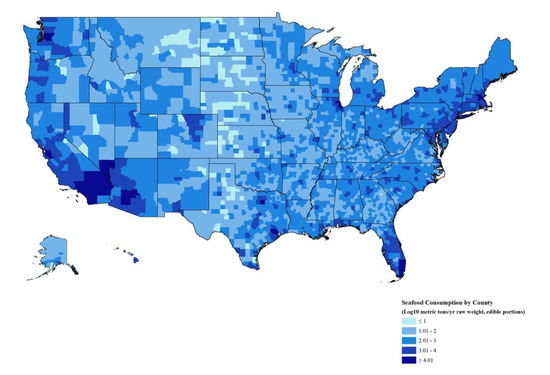
Figure 1.
Seafood consumption by county (log10 metric tons/yr raw weight, edible portion).
4. Discussion
This study uses nationally representative dietary intake data (i.e., NHANES) linked with other sources to provide a more nuanced picture of U.S. seafood sources and expenditures than has previously been described in other NHANES seafood studies [5,27,28,29,30]. Overall, seafood consumption levels were greater among men, those of middle age, and those with higher incomes compared with women, those of other ages, and those with lower incomes, which has been noted previously [5]. Seafood consumers obtained 39% of their seafood by weight from restaurants and other “away from home” venues, however, these food sources accounted for a disproportionate (65%) share of consumer expenditures [31,32]. Seafood consumption rates generally tracked that of the U.S. seafood supply, and the difference between them was likely due to water loss during cooking and food waste. The largest regions for seafood consumption were in coastal and inland cities. Although per-capita consumption is greater in coastal areas, overall seafood demand in non-urban coastal areas (represented as tons per county) was not as high as might have been expected.
One of our main findings relates to sourcing seafood at food service venues such as restaurants. Over the past half-century, the general trend among consumers is to cook less at home and eat out more [31,32,33]. It is estimated that Americans consume 28–35% of calories away from home [32]. We found that on average 39% of total seafood intake by weight was purchased at restaurants and other food service venues, and that the rate could be as high as 50% to 60% for some species such as crab, catfish, cod, and shrimp. Seafood meals at restaurants were similar in size to federally recommended serving sizes for seafood [4,26]. Seafood is more likely to be purchased at restaurants and other food service venues compared to other food products, although our by-weight seafood analysis cannot be directly compared to the by-energy caloric estimate.
On a per dollar basis, seafood expenditures away from home are notable. Today slightly less than half (48%) of overall U.S. food expenditures are away from home. By contrast, seafood expenditures at restaurants and other food service venues represent two-thirds of consumers’ seafood dollars. Consumers, therefore, have very different spending habits for seafood than for an aggregate of all foods.
Consumers preferred buying some products from retailers and others from restaurants. Shrimp and salmon are the top two seafood products consumed in the U.S. [6] and we found that (by weight) salmon was more often purchased at retail outlets like grocery stores, while shrimp was more often purchased at restaurants and other food service venues. These food sourcing preferences may be related to consumers’ perceived ability or comfort to cook certain species at home or the availability of products at different venues [34,35]. The average salmon meal was twice the quantity of a shrimp meal, which may be related to how shrimp is used as an ingredient in dishes while salmon is often a center of the plate protein. The time of day can also influence consumption sourcing; seafood eaten at dinner is more often purchased from retail outlets, while seafood lunches were more often purchased from restaurants and other “away from home” venues. Certain products such as crabs, lobster, scallops, and snails were purchased more at restaurants than retail outlets, perhaps because they are perceived as a luxury item or require special cooking methods compared to everyday food.
Previous analyses of household food expenditure at the national level have not accounted for the cost of food waste and inedible portions, as well as the important price differences between foods consumed at home and foods consumed away from the home. In the present study, we utilize nationally representative food expenditure data from a recent study by Conrad [22] that accounted for these important aspects of household food expenditure, while also using established methods to account for food price inflation to provide contemporary estimates (2016 U.S. dollars). Our findings on seafood expenditures are mostly within a few percentage points of the NMFS expenditure estimates. Differences in dollar expenditures between NMFS and our findings could be due to Conrad’s methods of accounting for the cost of food wasted at the store, inedible portions, and differences in “food away from home” costs. Given that NMFS model is built from supply-side data and ours is based on consumer intake and consumer price data, the similarity is striking and adds validity to the findings.
Several strengths and limitations are worth noting. NHANES has distinct advantages as a data source beyond its overall sampling quality and level of methodological rigor. First, we provide per capita estimates of intake, which is an improvement over previous estimates of per capita supply used as a proxy for intake [21]. Second, these data also include self-caught seafood, either as recreational or subsistence fishing, which is generally missing from per capita supply. Third, NHANES provides a rich individual-level dataset (age, sex, income, diet, health) which provides the opportunity to better understand demographic trends for future analyses. One limitation is the way seafood intake is collected. NHANES does not have response options for some species, most notably Alaska pollock, and other species were instead reported as “fish” or “seafood.” We used a single day of dietary intake, which is a cross sectional snapshot and may not reflect the population intake in the long term. While the mean intake from a single day will be accurate for the population, the standard error bars are wider than they would be using multiple days of intake because we have not accounted for random within-person variability [36]. Lastly, self-reported data have limitations in recall that might differ across types of seafood, portion size estimation, and the potential for overreporting seafood consumption due to social desirability bias.
5. Conclusions
This study addresses key knowledge gaps at the consumer-level about sourcing practices and expenditures for seafood using several nationally representative and publicly available datasets. We found that on average 39% of total seafood intake by weight was eaten away from home, mostly at restaurants, and it could be as high as 50% to 60% for some species, while 65% of consumer expenditures on seafood was at “food away from home” venues. U.S. adult expenditures on seafood at “away from home” venues are larger than the national trends for all foods. The analysis has broader implications because it identifies populations and locations where seafood consumption is particularly low and can inform government agencies and healthcare professionals that may wish to change Americans’ seafood consumption or shift purchasing habits.
Currently, most Americans do not meet national dietary recommendations for seafood as described in the Dietary Guidelines for Americans 2015–2020 [5]. Based on our findings, interventions to promote seafood consumption focusing only on at-home cooking would miss an important source for the American seafood diet, namely fast food and other chain restaurants. Food sourcing decisions have an impact on health; for example, cooking at home is typically healthier than eating out [37,38,39]. Further work is needed to understand the nutritional content of seafood at restaurants compared to home-cooked meals and to better align restaurant meals with recommendations in the Dietary Guidelines for Americans.
Supplementary Materials
The following is available online at https://www.mdpi.com/2072-6643/12/6/1810/s1, Table S1. U.S. Department of Agriculture “food at home” (FAH) and “food away from home” (FAFH) codes. Table S2. Top seafood species consumed by United States adult seafood consumers (≥ age 19) by food source (NHANES 2007 to 2016). Table S3. Top seafood species consumed by United States seafood consumers (all ages) by food source (NHANES 2007 to 2016). Table S4. Usual fish consumption rates (g/day raw weight, edible portion) of total fish and shellfish. 50th percentile estimates (range: 95% CI). Figure S1. Seafood consumption rates (g/day, raw weight, edible portion) by county for each coastal/inland region described in Table S4.
Author Contributions
Conceptualization, D.C.L.; Methodology, D.C.L. and Z.C.; Formal Analysis, D.C.L.; Writing-Original Draft Preparation, D.C.L.; Writing-Review and Editing, D.C.L., F.A., R.N., Z.C., R.Y., J.H., E.M.N. and A.L.T.-L.; Visualization, J.H. All authors have read and agreed to the published version of the manuscript.
Funding
This work is supported from a grant from the USDA (INFEWS, #2018-67003-27408) and the Santa Barbara Foundation.
Acknowledgments
We thank the staff at the CDC-National Center for Health Statistics, Biing-Hwan Lin and Abby Okrent at USDA-Economic Research Service, and Melissa Yencho at NOAA-National Marine Fisheries Service for their help answering questions. We would like to thank Becky Ramsing, Shawn McKenzie, and Martin Bloem at the Johns Hopkins Center for a Livable Future for reviewing a draft of the manuscript.
Conflicts of Interest
The authors have no conflicts of interest.
References
- Shan, Z.; Rehm, C.D.; Rogers, G.; Ruan, M.; Wang, D.D.; Hu, F.B.; Mozaffarian, D.; Zhang, F.F.; Bhupathiraju, S.N. Trends in dietary carbohydrate, protein, and fat intake and diet quality among US adults, 1999–2016. JAMA 2019, 322, 1178–1187. [Google Scholar] [CrossRef] [PubMed]
- Rimm, E.B.; Appel, L.J.; Chiuve, S.E.; Djoussé, L.; Engler, M.B.; Kris-Etherton, P.M.; Mozaffarian, D.; Siscovick, D.S.; Lichtenstein, A.H. Seafood long-chain n-3 polyunsaturated fatty acids and cardiovascular disease: A science advisory from the American heart association. Circulation 2018, 138, e35–e47. [Google Scholar] [CrossRef] [PubMed]
- Lund, E.K. Health benefits of seafood; Is it just the fatty acids? Food Chem. 2013, 140, 413–420. [Google Scholar] [CrossRef] [PubMed]
- HHS. 2015–2020 Dietary Guidelines. Available online: https://health.gov/dietaryguidelines/2015/guidelines/ (accessed on 24 June 2019).
- Jahns, L.; Raatz, S.; Johnson, L.; Kranz, S.; Silverstein, J.; Picklo, M. Intake of seafood in the US varies by age, income, and education level but not by race-ethnicity. Nutrients 2014, 6, 6060–6075. [Google Scholar] [CrossRef] [PubMed]
- Shamshak, G.L.; Anderson, J.L.; Asche, F.; Garlock, T.; Love, D.C. US seafood consumption. J. World Aquac. Soc. 2019, 50, 715–727. [Google Scholar] [CrossRef]
- NOAA. Fisheries of the United States; National Marine Fisheries Service Office of Science and Technology: Seattle, WA, USA, 2018; Volume 2017.
- Dey, M.M.; Surathkal, P.; Chen, O.L.; Engle, C.R. Market trends for seafood products in the USA: Implication for southern aquaculture products. Aquac. Econ. Manag. 2017, 21, 25–43. [Google Scholar] [CrossRef]
- Singh, K.; Dey, M.M.; Surathkal, P. Seasonal and spatial variations in demand for and elasticities of fish products in the United States: An analysis based on market-Level scanner data. Can. J. Agric. Econ. Rev. Can. Agroecon. 2014, 62, 343–363. [Google Scholar] [CrossRef]
- Surathkal, P.; Dey, M.M.; Engle, C.R.; Chidmi, B.; Singh, K. Consumer demand for frozen seafood product categories in the United States. Aquac. Econ. Manag. 2017, 21, 9–24. [Google Scholar] [CrossRef]
- Witkin, T.; Dissanayake, S.T.; McClenachan, L. Opportunities and barriers for fisheries diversification: Consumer choice in New England. Fish. Res. 2015, 168, 56–62. [Google Scholar] [CrossRef]
- Asche, F.; Smith, M.D. Induced innovation in fisheries and aquaculture. Food Policy 2018, 76, 1–7. [Google Scholar] [CrossRef]
- Carlucci, D.; Nocella, G.; De Devitiis, B.; Viscecchia, R.; Bimbo, F.; Nardone, G. Consumer purchasing behaviour towards fish and seafood products. Patterns and insights from a sample of international studies. Appetite 2015, 84, 212–227. [Google Scholar] [CrossRef] [PubMed]
- Roheim, C.; Bush, S.; Asche, F.; Sanchirico, J.; Uchida, H. Evolution and future of the sustainable seafood market. Nat. Sustain. 2018, 1, 392–398. [Google Scholar] [CrossRef]
- Del Giudice, T.; Stranieri, S.; Caracciolo, F.; Ricci, E.C.; Cembalo, L.; Banterle, A.; Cicia, G. Corporate social responsibility certifications influence consumer preferences and seafood market price. J. Clean. Prod. 2018, 178, 526–533. [Google Scholar] [CrossRef]
- McClenachan, L.; Dissanayake, S.T.; Chen, X. Fair trade fish: Consumer support for broader seafood sustainability. Fish Fish. 2016, 17, 825–838. [Google Scholar] [CrossRef]
- CDC. National Health and Nutrition Examination Survey. Available online: https://www.cdc.gov/nchs/nhanes/index.htm (accessed on 31 January 2019).
- USDA. What We Eat in America. Available online: https://www.ars.usda.gov/northeast-area/beltsville-md-bhnrc/beltsville-human-nutrition-research-center/food-surveys-research-group/docs/wweianhanes-overview/ (accessed on 1 February 2019).
- USDA. Food Patterns Equivalents Database. Available online: https://www.ars.usda.gov/northeast-area/beltsville-md-bhnrc/beltsville-human-nutrition-research-center/food-surveys-research-group/docs/fped-overview/ (accessed on 1 February 2019).
- Lin, B.-H.; Anekwe, T.D.; Buzby, J.C.; Bentley, J. US Food Commodity Availability by Food Source, 1994–2008; US Department of Agriculture, Economic Research Service: Washington, DC, USA, 2016.
- National Fisheries Institute. Top 10 List Shows Significant Increase in Seafood Consumption. Available online: https://www.aboutseafood.com/press_release/top-10-list-shows-significant-increase-in-seafood-consumption/ (accessed on 1 February 2019).
- Conrad, Z. Daily cost of consumer food wasted, inedible, and consumed in the United States, 2001–2016. Nutr. J. 2020, 19, 1–9. [Google Scholar] [CrossRef]
- Conrad, Z.; Niles, M.T.; Neher, D.A.; Roy, E.D.; Tichenor, N.E.; Jahns, L. Relationship between food waste, diet quality, and environmental sustainability. PLoS ONE 2018, 13, e0195405. [Google Scholar] [CrossRef]
- EPA. Estimated Fish Consumption Rates for the U.S. Population and Selected Subpopulations (NHANES 2003–2010); EPA-820-R-14-002; U.S. Environmental Protection Agency Report an Environmental: Washington, DC, USA, 2014.
- US Census Bureau. American Community Survey. Available online: https://www.census.gov/programs-surveys/acs (accessed on 1 February 2019).
- FDA. Nutrition Information for Cooked Seafood (Purcahsed Raw). Available online: https://www.fda.gov/food/food-labeling-nutrition/nutrition-information-cooked-seafood-purcahsed-raw (accessed on 25 September 2019).
- Kim, H.; Rebholz, C.M.; Caulfield, L.E.; Ramsing, R.; Nachman, K.E. Trends in types of protein in US adults: Results from the National Health and Nutrition Examination Survey 1999–2010. Public Health Nutr. 2019, 22, 191–201. [Google Scholar] [CrossRef]
- Papanikolaou, Y.; Brooks, J.; Reider, C.; Fulgoni, V.L. US adults are not meeting recommended levels for fish and omega-3 fatty acid intake: Results of an analysis using observational data from NHANES 2003–2008. Nutr. J. 2014, 13, 31. [Google Scholar] [CrossRef]
- Razzaghi, H.; Tinker, S.C. Seafood consumption among pregnant and non-pregnant women of childbearing age in the United States, NHANES 1999–2006. Food Nutr. Res. 2014, 58, 23287. [Google Scholar] [CrossRef][Green Version]
- Richter, C.K.; Bowen, K.J.; Mozaffarian, D.; Kris-Etherton, P.M.; Skulas-Ray, A.C. Total long-chain n-3 fatty acid intake and food sources in the United States compared to recommended intakes: NHANES 2003–2008. Lipids 2017, 52, 917–927. [Google Scholar] [CrossRef]
- Saksena, M.J.; Okrent, A.M.; Anekwe, T.D.; Cho, C.; Dicken, C.; Effland, A.; Elitzak, H.; Guthrie, J.; Hamrick, K.S.; Hyman, J. America’s Eating Habits: Food Away From Home; United States Department of Agriculture, Economic Research Service: Washington, DC, USA, 2018.
- Smith, L.P.; Ng, S.W.; Popkin, B.M. Trends in US home food preparation and consumption: Analysis of national nutrition surveys and time use studies from 1965–1966 to 2007–2008. Nutr. J. 2013, 12, 45. [Google Scholar] [CrossRef]
- Okrent, A.M.; Elitzak, H.; Park, T.; Rehkamp, S. Measuring the Value of the US Food System: Revisions to the Food Expenditure Series; United States Department of Agriculture, Economic Research Service: Washington, DC, USA, 2018.
- Christenson, J.K.; O’Kane, G.M.; Farmery, A.K.; McManus, A. The barriers and drivers of seafood consumption in Australia: A narrative literature review. Int. J. Consum. Stud. 2017, 41, 299–311. [Google Scholar] [CrossRef]
- Musarskaya, M.; Birch, D.; Memery, J. To eat or not to eat: seafood consumption habit formation. J. Int. Food Agribus. Mark. 2018, 30, 227–235. [Google Scholar] [CrossRef]
- Willett, W. Nutritional Epidemiology; Oxford University Press: Oxford, UK, 2012. [Google Scholar]
- Wolfson, J.A.; Bleich, S.N. Is cooking at home associated with better diet quality or weight-loss intention? Public Health Nutr. 2015, 18, 1397–1406. [Google Scholar] [CrossRef] [PubMed]
- Mancino, L.; Todd, J.; Lin, B.-H. Separating what we eat from where: measuring the effect of food away from home on diet quality. Food Policy 2009, 34, 557–562. [Google Scholar] [CrossRef]
- Todd, J.E.; Mancino, L.; Lin, B.-H. The Impact of Food Away From Home on Adult Diet Quality; ERS 90; United States Department of Agriculture: Washington, DC, USA, 2010.
© 2020 by the authors. Licensee MDPI, Basel, Switzerland. This article is an open access article distributed under the terms and conditions of the Creative Commons Attribution (CC BY) license (http://creativecommons.org/licenses/by/4.0/).