Highlights
What are the main findings?
- Hailstorms are one of the most important weather processes that present constant challenges to operational weather forecasters. A network of three X-band phased-array radars (XPARs) is deployed at Weining in Yun-Gui Plateau, western China, where abundant shallow and fast-evolving hailstorms occur. The Weather Research and Forecast model with Four-Dimensional Data Assimilation scheme and hydrometeor and latent heat nudging (HLHN) module (WRF-FDDA-HLHN) is employed to joint assimilate the XPAR data and the operational Severe Weather Automatic Nowcast (SWAN) System radar data of Chinese Meteorological Administration (CMA). We demonstrated that this approach greatly improves hailstorm forecast accuracy in the region. The XPAR data fill the detection blind zones of conventional S- and C-band radars included in SWAN in the lower altitudes and complete 3D volume sampling at 1-min (or less) detection intervals.
- Assimilation of the XPAR data at 1-min intervals outperforms the 6-min intervals, delivering faster model spin-up and quicker convergence toward observations. It helps capture the fine-scale structures and rapid changes of the hail clouds. It reproduces the intense hail cloud cores with radar reflectivity factors over 45 dBZ and suppresses the model spurious convection as well. The FSS scores for both general precipitation (15 dBZ) and hail cloud regions (40 dBZ) are significantly boosted from the early stages of assimilation. It also reduces the Root Mean Square Error (RMSE) of air temperature and relative humidity at 2 m, providing a more accurate thermodynamical condition for hail formation. During the subsequent forecast period, the 1-min interval assimilation maintains higher FSS values, demonstrating its effectiveness in tracking the rapid evolution of hailstorms.
- A humidity adjustment algorithm based on vertically integrated liquid (VIL) diagnosed from the radar observation is introduced to work together with WRF-FDDA-HLHN. This approach effectively improves moisture field inconsistencies and significantly enhances hailstorm forecast. The WRF-FDDA-HLHN scheme effectively corrects the hydrometeor and temperature errors but fails to regulate water vapor biases that result in serious spurious convection. By adding the humidity adjustment algorithm, we not only achieve more accurate humidity and temperature modeling but also suppress the spurious convection and extend the lifetime of the hail clouds.
What are the implications of the main findings?
- Assimilation of high spatiotemporal resolution measurements of atmospheric hydrometeors by XPAR can dramatically improve hailstorm forecasts. It is demonstrated that XPAR makes a necessary complement to the existing operational S- and C-band radar network for initiating mesoscale weather model forecasting of hailstorms.
- The joint assimilation of high-resolution XPAR data and SWAN radar data with WRF-FDDA-HLHN that is improved with the moisture adjustment algorithm provides a feasible solution for improving hailstorm forecasting in the Yun-Gui Plateau and the operational S- and C-band radars cannot provide sufficient information to monitor or facilitate the WRF model to predict such shallow, fast-evolving, and short-life convective storms.
- Further research should be conducted to incorporate measurements of winds and polarimetric variables to improve the simulation of microphysical processes and dynamical structures of hailstorms.
Abstract
Hailstorms frequently develop in Yun-Gui Plateau, Western China, which bring about significant economic damage. Due to the high terrain, these storms are typically shallow, rapidly evolving, and challenging to forecast. An X-band phased-array radar (XPAR) network is set up at Weining in Yun-Gui Plateau to study these storms. To explore these XPAR data for numerical prediction of hailstorms in this region, we implement the Weather Research and Forecast (WRF) model and Hydrometeor and Latent Heat Nudging (HLHN) method to assimilate the data and conduct prediction experiments. The XPAR data was evaluated along with the operational Severe Weather Automatic Nowcast (SWAN) system radar mosaic data. Furthermore, a humidity adjustment scheme is used to overcome inconsistency of the humidity field and related prediction errors. The model results show that in comparison to the SWAN data, assimilating XPAR data in 1-min intervals significantly reduces the model error, and improves the representation of rapid hail cloud evolution. Additionally, adjusting the model humidity based on vertically integrated liquid (VIL) derived from the radar data can effectively correct model analyses of humidity and temperatures, suppressing spurious convection, thus improving the hailstorm forecast. Overall, we recommend joint assimilation of the high spatiotemporal resolution XPAR data along with SWAN radar data with the improved WRF-HLHN for hailstorm prediction over the study region, and the algorithm can be promptly adapted to forecasting hailstorms in other regions.
1. Introduction
Hailstorms are among the most unstable, chaotic, and nonlinear components of atmospheric processes. They are difficult to detect and challenging to predict due to their small spatiotemporal scale [1,2]. Weather radar networks provide high temporal and spatial resolution observations of hydrometeors in convective storms, which is an important data source for improving hail forecasts. Many studies have explored radar data assimilation algorithms to improve the simulation and prediction of convective systems [3,4]. However, due to their overwhelming complexity, short lifetime, and rapidly changing properties, monitoring and forecasting hailstorms remain a great challenge. Recently, new observation measures, such as X-band phased-array radar (XPAR) networks are deployed to enhance hail detection capability. It is highly desired to develop data assimilation schemes to assimilate these data to improve numerical prediction of hailstorms.
Conventional operational weather radars (operating at S- and C-band wave lengths) have been utilized in studies related to convection storm detection, rainfall estimation, and data assimilation (DA). This is because of their extensive detection range and relatively low susceptibility to precipitation attenuation [5,6,7]. The low temporal measurement resolution (6–10 min) of these radars cannot observe some hail-growth-related microphysical structures; thus they cannot meet the needs for forecasting rapidly evolving hailstorms [8,9]. In addition, the large detection interval of conventional weather radar data easily leads to obvious deficiencies in observation capabilities near the ground, especially within the critical 1 km range, forming a significant blind zone in the lower layers [10,11]. Usually, single XPAR is installed with high density, 40–60 km apart, to provide observations within the near-ground blind zone of conventional weather radars in real-time operation.
XPAR presents excellent detection capabilities for initial development and important details of convective events, and has significant advantages in monitoring rapidly evolving hailstorm processes. Compared with conventional meteorological radars, it has higher spatial and temporal resolution, and exhibits unique advantages in tracking convective events evolution and capturing fine internal structure of convective systems in near-ground observations [12,13,14]. When compared with operational weather radars, XPARs exhibit a greater potential to tracking the occurrence and evolution of convective events [12,13] and detecting the detailed internal structure of convective clouds with higher spatiotemporal resolution [14]. In addition, assimilating high-frequency XPAR data not only captures the small-scale and fast-evolving cloud features overlooked by operational radars but also optimizes model initial conditions through the Four-Dimensional Data Assimilation scheme coupled with the numerical model of Weather Research and Forecast (WRF-FDDA) which supports the Hydrometeor and Latent Heat Nudging (HLHN) scheme, and corrects key structural characteristics of convective systems, thereby helping to reduce the analysis errors of severe convection [15,16,17]. Lin et al. (2022) compared data assimilation with 4-min and 6-min intervals and found that shortening the assimilation interval significantly improves the forecast accuracy [18]. Jia et al. (2025) compared S-band radars with five X-band radars and found that the X-band radars effectively supplement the low-altitude observational gaps of the S-band radars and provide critical extra information for severe convective weather in their study [19].
In spite of the above advantages of XPAR, the short detection distance and severe signal attenuation of XPAR may greatly limit its usage, and it is necessary to be used jointly with S-band radars for data assimilation. A recent study by Shi et al. (2025) shows that the joint assimilation of S-band Doppler radar and XPAR data shows better performance than assimilating them separately [20].
Three-dimensional DA schemes perform optimal analysis at a single time. As a result, it only makes use of a single time observation and does not involve temporal evolution constraints of the model atmospheric states. In contrast, the four-dimensional DA scheme continuously assimilates observations for a time window with the numerical dynamics and physics as constraints along a model integration. WRF-FDDA is widely used for small to mesoscale weather prediction [21,22]. Furthermore, WRF-FDDA supports HLHN and assimilation of radar reflectivity data [23,24,25]. The WRF-FDDA-HLHN scheme adopted in this study is a four-dimensional data assimilation scheme that assimilates continuously radar observation along the model forward integrations. This design allows us to assimilate the high-frequency XPAR observations. It has been evaluated and achieved significant improvements in heavy precipitation prediction [25,26,27,28,29]. Unlike the three-dimensional data assimilation approaches [30], WRF-FDDA-HLHN can absorb high-frequency radar observation data (down to sub-minute level) to continuously adjust the model hydrometeor and temperatures toward the observations. Hailstorms are shallow, fast-evolving severe convective systems. Their convective core structure can evolve dramatically within just a few minutes. Three-dimensional data assimilation methods cannot properly describe such rapid variations. They also fail to represent the complex nonlinear dynamics of hailstorms, and often lead to excessive model spin-up time. The FDDA scheme continuously assimilates high-frequency radar data along the model integration. It directly adjusts model hydrometeor and temperature fields in real time based on observations. It also indirectly modulates the pressure and wind fields synchronously. This maintains the dynamic–thermodynamic balance of the convective system. It effectively reduces the model spin-up time as well. These features fully match the core requirements of minute-scale hailstorm data assimilation and nowcasting. Thus, it is particularly adequate for supporting radar data assimilation for hailstorm prediction. Thus, it is particularly adequate for supporting radar data assimilation for hailstorm prediction.
In this study, we adopt the WRF-FDDA-HLHN data assimilation scheme to jointly assimilate XPAR data and the Severe Weather Automatic Nowcast System (SWAN, S- and C-band radars) data and demonstrate the benefits of adding a XPAR network for a hailstorm prediction in the plateau mountainous Weining area. SWAN is developed and operated by Chinese Meteorological Administration (CMA). It shows that high-frequency XPAR data can effectively capture the fine-scale features of these fast-evolving storms missed by operational radars, and its assimilation can significantly improve the initial conditions of convective systems. An algorithm is also developed to enhance WRF-FDDA-HLHN to address the inconsistency issue between the model water vapor field and the cloud development based on observed radar reflectivity. The phrase ‘forecast’ we use below is a general expression. The core goal of this study is to verify the improvement from radar data assimilation over 10–30 min prediction. The rest of the present paper is organized as follows. Section 2 introduces case selection, data sources, WRF model settings, and experimental design. In Section 3 the assimilation and forecast results of multi-band mosaic radar data are analyzed and the impact of the humidity adjustment algorithm is demonstrated. Section 4 discusses the limitations of the present work and the further work desired to apply the data assimilation schemes for operational application. Finally, Section 5 summarizes the conclusions of this study.
2. Methodology and Data
2.1. Hailstorm Case and Data Sources
The hailstorm event occurred on 17 August 2023, from 06:30 UTC to 08:30 UTC over Weining was selected for modeling study. In this case, the strong convective cell was captured by the XPAR radar network whose detection range of the XPAR radar network is shown in Figure 1b. Its top height exceeded over 8 km and the reflectivity was over 60 dBZ. The ground weather stations at Weining reported hail density over 40 m−2, and a maximum diameter reached approximately 1 cm. We also used the operational forecast products of the National Centers for Environmental Prediction (NCEP) Global Forecast System (GFS) data to analyze the atmospheric circulation and weather patterns prior, aiming to reveal the synoptic-scale characteristics of this event. At 00:00 UTC on 17 August 2023, the GFS synoptic chart shows favorable conditions for hail initiation at the blue star location. At 850 hPa, the region is covered by a warm tongue with low-level convergence and sufficient warm moist air. At 500 hPa, it is located ahead of a shortwave trough, with upper-level divergence and strong thermal instability caused by upper cold air and lower warm air. The coupling of low-level convergence and upper-level divergence provides strong upward lifting. Sufficient moisture, moderate vertical wind shear, and appropriate 0 °C and −20 °C layer heights support hail formation and growth.
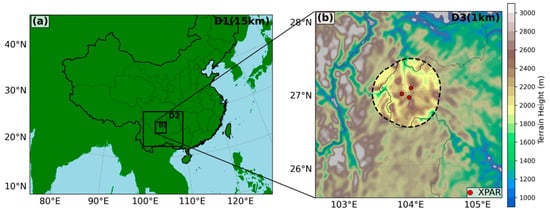
Figure 1.
Nested-grid simulation domains (a) and terrain height over the finest-grid domain containing the Weining region (b). The locations of three XPARs are marked by the red dots.
The data used in this study include the GFS data, the SWAN operational radar reflectivity factor mosaic, the XPAR radar network with three XPARs from Guizhou Hail Suppression Base located in Weining County, and standard meteorological observations from CMA.
GFS data are used to provide initial conditions and lateral boundary conditions for WRF simulations. The data from 00:00 UTC to 09:00 UTC on 17 August 2023, at 3 h intervals, were used. The data resolution was 0.25° × 0.25°. The NCEP Final Operational Global Analysis reanalysis data were not chosen in this study because we aim to enhance hailstorm forecast in Weining, and thus the GFS forecasts are more appropriate.
SWAN provides 3D mosaic data based on the national operational weather radars (with S-band and C-band wavelengths), with a maximum spatial resolution of 0.01° × 0.01° and a temporal resolution of 6 min. The XPAR network at Weining consists of three radars arranged in an approximately equilateral triangle, focusing on a study region of ~50 km wide with 3D overlapping observations of the three XPARs. These radars provide high-resolution data with a range resolution of 30 m and a sampling frequency of 1 min, allowing for the capture of fine-scale precipitation structures while maintaining spatial continuity. In this work, the collected XPAR and SWAN radar data were integrated to produce a multi-band mosaic dataset for conducting data assimilation with WRF-FDDA-HLHN. We adopted a directional differentiated interpolation strategy for grid processing of the dual-source radar data. Nearest-neighbor interpolation was applied in the horizontal direction, and linear interpolation in the vertical direction. We set targeted processing rules for the mosaic fusion. For grid points with missing XPAR mosaic data but valid corresponding SWAN mosaic data, we generated the final fusion output via nearest-neighbor interpolation of the SWAN data. For the overlapping area with both valid XPAR and SWAN data, we obtained the final grid value through weighted average fusion of the dual-source data. The radar measurements are interpolated to the WRF grid with a nearest-neighbor interpolation method in the horizontal direction and the linear interpolation method in the vertical direction. This approach preserves the detailed features of radar-observed precipitation reflectivity, while ensuring the spatial continuity of the gridded data. A set of targeted processing rules is established for the mosaic fusion. For grid points with missing XPAR mosaic data but valid SWAN data, we take the interpolated SWAN as the final result. For the area with collocated XPAR and SWAN data, we calculate a weighted average of the dual-source data. The data have a horizontal resolution of 1 km and a vertical resolution of 125 m, matching the horizontal grid spacing of the inner domain of the study area (Figure 1).
2.2. WRF-FDDA-HLHN
WRF-FDDA is a four-dimensional data assimilation scheme based on the Newtonian relaxation principle. It introduces artificial tendency terms into the model prognostic equations, allowing gradual nudging of the model towards the observations during the model forward integration. Each observation has an influence radius, a time window, and a relaxation coefficient, empirically specified by the user, to ingest the observed information into the model dynamics. The model analysis is generated during the model integration. Based on WRF-FDDA, the National Center for Atmospheric Research of Natural Science Foundation (NSF-NCAR) has developed a Real Time Four-Dimensional Data Assimilation and short-term forecasting system (RTFDDA) which has been broadly applied in operational regional forecasting [23,24,25]. The system contains HLHN radar data assimilation capability [26], which links hydrometeor field correction to latent heat changes through cloud microphysical conversion processes. When the model hydrometeor mixing ratios are updated, the corresponding latent heat release or absorption is calculated in real time. The adjusted latent heat is directly fed back to the model thermodynamic equation, correcting the in-storm temperature perturbation field, and further modulates the vertical motion and dynamic structure of convective systems. The algorithm is described in [28,29], and the key processes are as follows:
where are the mixing ratios of rainwater, snow, hail and graupel. is the analysis value of , are the close observations before and after the current moment, is the model state variable. is the source of mixing ratio from physical processes (microphysical conversion processes, land surface moisture flux, mixing, diffusion, etc.), and is the source of air temperature from physical processes (latent heating, sensible heating, etc.). The relaxation coefficient determines the relative magnitude of the nudging tendency terms. , and are the nudging weighting coefficients of horizontal and vertical space, and latent heat tendency term, respectively. is the specific latent heat and is the specific heat of air at constant pressure. is the temporal weighting, accounting for the time inconsistency between the observation and the model integration time. The observations before and after the current time are used to calculate the tendency terms.
2.3. Humidity Adjustment Along with WRF-FDDA-HLHN
WRF-FDDA-HLHN adjusts hydrometeors and latent heat during radar data assimilation based on the multi-band 3D radar mosaic data. It corrects model hydrometeor errors and boosts buoyancy through latent heat nudging. However, the background water vapor field remains completely unadjusted throughout the assimilation cycle, as the HLHN scheme has no capability to correct water vapor errors. This critical limitation is the reason for introducing the VIL-based humidity adjustment algorithm proposed in this study. Based on the research by Lai et al. (2020) [31], we design a model moisture adjustment algorithm by utilizing the high-resolution vertical observations of the XPAR. Vertically integrated liquid (VIL) was computed using 3D radar mosaic observations data to identify deep moist convection regions [32]:
where represents VIL at model level n, denotes the thickness of model layers (in meters) at model level n, and Zn represents reflectivity at model level n. Then, a VIL threshold of 6.5 kg m−2 was used to distinguish between convective and stratiform precipitation, i.e., a vertical column with VIL ≥ 6.5 kg m−2 is classified as convective precipitation, while otherwise it is considered stratiform precipitation. Finally, for each column, based on the value of VIL, adjustments were made to the relative humidity for the model column, as illustrated in Figure 2.
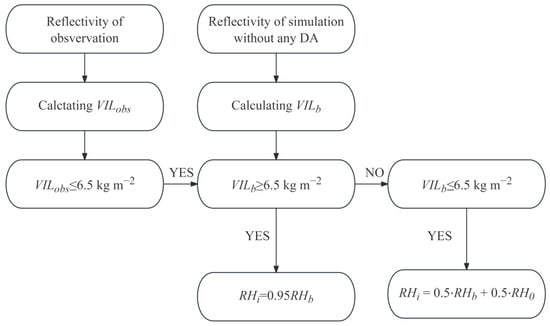
Figure 2.
Flowchart of the VIL-based WRF model humidity adjustment algorithm. VILobs represents the radar-observed VIL. RHb and VILb are the model-simulated VIL and relative humidity from simulation without any DA. RHo is an empirical constant. RHi is analysis from radar DA.
RHi is analysis from radar DA, RHb is simulation without any DA, and RH0 represents presented values as in Lai et al. (2020) [31]. Studies show that this approach appears to be effective in eliminating spurious convection and significantly enhancing the consistency of the moisture and temperature fields [32,33]. In the current study, we adopted the Lai et al. (2020) [31] moisture adjustment scheme and coupled it with WRF-FDDA-HLHN without critical modifications. It should be noted that further work should be carried out to tune these parameters to further improve the hailstorm simulation over the Yun-Gui Plateau.
2.4. Experimental Design
The model is configured with three nested grid domains with horizontal grid sizes of 15, 3, and 1 km and grid dimensions of 405 × 300, 345 × 305, and 288 × 288, respectively. The model has 34 vertical levels and the model top pressure is set to 50 hPa. The finest mesh domain (D03) covers the entire detection range of three XPARs at the Weining National Guizhou Hail Suppression Base (Figure 1b). The WRF simulation started at 00:00 UTC 17 August 2023, with a 7 h spin-up period until 07:00 UTC. All data assimilation experiments and evaluation started at 07:00 UTC using the same “spun-up” model state. Then radar data assimilation started at 07:00 UTC with either 1-min or 6-min interval radar data. Each experiment concludes with a 30-min forecast after assimilation. The cumulus parameterization uses the Grell–Freitas scheme [34] for domain 1 only. The longwave radiation and shortwave radiation parametrization adopt the Rapid Radiative Transfer Model (RRTMG) scheme [35]. We use Yonsei University scheme (YSU) [36] as the planetary boundary layer parameterizations.
Three groups of numerical experiments were designed to assess the improvement by radar data assimilation to hailstorm analysis and forecast. The data assimilation and forecasting period span the hailstorm initiation and main lifetime, with a 10–30 min forecast (nowcasting) window.
The first set was designed to select appropriate microphysical schemes where Lin [36], WSM6 [37], Thompson [38], and Morrison [39] were tested, respectively. Four WRF-FDDA-HLHN radar data assimilation experiments were designed, along with Lin, WSM6, Thompson, and Morrison schemes, respectively: EXP_Lin, EXP_WSM6, EXP_Thompson, and EXP_Morrison. Radar data were assimilated from 07:00 UTC to 07:10 UTC, followed by 30-min forecasts.
The second group aims to test the sensitivity of assimilation data intervals. Three experiments were designed: EXP_DA6min, EXP_DA1min, and EXP_CTRL. In EXP_DA6min and EXP_DA1min, the multi-band radar mosaic data are assimilated from 07:00 UTC to 07:30 UTC with 6-min and 1-min intervals, respectively. Both experiments are followed by a 30-min forecast. EXP_CTRL is conducted from 00:00 UTC to 08:00 UTC without any data assimilation.
The third group demonstrates the impact of humidity adjustment along with WRF-FDDA-HLHN. Two experiments are added: EXP_DA and EXP_PVDA. EXP_DA assimilates the radar mosaic data for 40 min from 07:00 to 07:40 UTC, followed by a 20-min forecast. EXP_PVDA is the same as EXP_DA, but with humidity adjustment at 07:30 UTC based on radar reflectivity. A summary of the experimental design is described in Table 1.

Table 1.
Summary of experiments.
2.5. Verification Metrics
The Fractions Skill Score (FSS) is a metric developed for quantifying the accuracy of precipitation forecasts of high-resolution models [40]. By accounting for the contributions of neighborhood-based predictions, FSS is widely utilized to evaluate precipitation simulations on high-resolution grids. The definition of FSS is as follows:
where and denote the number of grid points in the two dimensions of the evaluation domain, respectively. The number of grid points depends on the neighborhood scale, representing the grid count at the longitudinal and latitudinal directions over the sampling region. and represent the observed and modeled values at the grid point (i, j), respectively.
3. Results
3.1. Impact of Microphysical Schemes on Radar Data Assimilation
WRF-FDDA-HLHN assimilates radar reflectivity factors into the model by adding an observation nudging term to the hydrometeor prognostic equations and the associated latent heat nudging terms in the thermodynamic equation. It is known that microphysics parameterization schemes regulate dynamical and thermodynamical behaviors through latent heat release of the microphysical processes and the drag force by precipitation in the vertical momentum equation [41,42]. Thus, WRF-FDDA-HLHN radar data assimilation is sensitive to the microphysical scheme in WRF and it is desired to evaluate these interactions and choose a proper microphysical parameterization.
As illustrated in Figure 3, for the 10-min forecast, besides the observed hailstorm (marked in Figure 3a), scattering spurious convections occur in all four microphysics experiments. In our case, the model results are not highly sensitive to the choice of microphysical schemes, suggesting a dominant thermodynamic mechanism control on the hail cloud process.
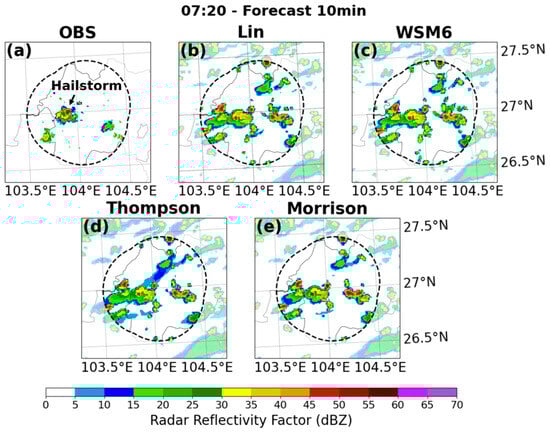
Figure 3.
Composite radar reflectivity of the observation (a) and the 10-min forecasts of with the Lin scheme (b); the WSM6 scheme (c); the Thompson scheme (d); and the Morrison scheme (e) at 07:20 UTC on 17 August 2023.
The FSS values for the simulated radar reflectivity factors at four selected times are shown in Figure 4a. At a 10 dBZ threshold (represents precipitation regions), EXP_Morrison consistently maintains higher FSS values throughout the forecast period in comparison to the other schemes, indicating that the Morrison scheme can accurately capture the overall structure and coverage of the rain belts. Similarly, EXP_Morrison also performs the best for the 30 dBZ threshold (Figure 4b).
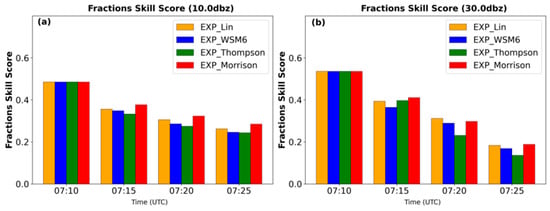
Figure 4.
Comparisons of the radar reflectivity verification for the model experiments with four different microphysics parameterization schemes: (a) FSS at thresholds of 10 dBZ; (b) FSS at thresholds of 30 dBZ.
The schemes we selected in this study are all double-moment microphysical schemes. The Morrison scheme was taken for the radar data assimilation study because it gains a slightly higher FSS score. In addition, several studies reported that the Morrison scheme can reliably simulate the formation and dissipation of convective systems and has better applicability for severe convective processes over complex terrain [43,44,45]. It is noted that microphysical parametrization involves many empirical parameters and assumptions, whose specifications vary across different microphysical schemes. Further study with more cases may be needed to determine and understand which microphysical parameterization best fits the simulation of the hailstorm in the Yun-Gui Plateau.
3.2. Assimilation of XPAR and SWAN Radar Data
Although there are several studies on using XPAR data for tornadoes and heavy rainfall over flat terrain, few works have been conducted to explore XPAR data for hailstorm forecasts, especially for the special shallow and short-life storms occurring in the mountainous plateau areas.
Figure 5 shows the results of EXP_DA6min, EXP_DA1min, and EXP_CTRL, and compares them with the observations. EXP_DA6min and EXP_DA1min start at 07:00 UTC and consists of a 30-min data assimilation cycle followed by a 10-min forecast. EXP_CTRL starts at the same time but does not assimilate any data. After 10 min of radar data assimilation (07:10 UTC), the composite radar reflectivity of both data assimilation experiments exhibits a good agreement with the observations. Notably, EXP_DA1min (Figure 5m) produces a much more accurate radar reflectivity cloud field than the other experiment, with radar reflectivity exceeding 45 dBZ and less spurious convection occurred in EXP_CTRL. At the 10-min forecast lead time (07:40 UTC), EXP_DA6 min and EXP_DA1min both show a significant reduction in weak spurious reflectivity (≤15 dBZ). The area above 40 dBZ in the hailstorm decreased. Compared with EXP_DA6min (Figure 5k), EXP_DA1min (Figure 5o) showed that the intensity of spurious reflectivity over 50 dBZ is significantly reduced. The convective structure of the hailstorm is maintained in this experiment. But the intensity of the hailstorm (≥40 dBZ) has weakened slightly.
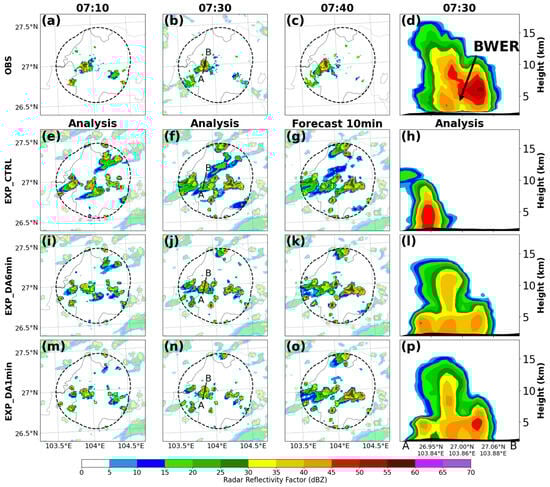
Figure 5.
Composite radar reflectivity of (a–d) observations; (e–h) EXP_CTRL without data assimilation; (i–l) EXP_DA6min with 6-min assimilation intervals; (m–p) EXP_DA1min with 1-min assimilation intervals from 07:10 to 07:40 UTC on 17 August 2023. The line AB in (b,f,j,n) marks the locations of the vertical cross-sections shown in (d,h,l,p). The dashed contour marks the measurement range of the XPAR radar network at Weining.
By the end of the 30-min assimilation cycle (Figure 5j,n), most spurious convection within the XPAR coverage is eliminated. However, some weak convection regions remain outside the XPAR coverage range where only SWAN radar data are available. This indicates that incorporating XPAR data with frequent data assimilation intervals helps suppress the spurious convection generated in the model. While it is difficult to contain intense spurious convection in the background field in both radar data assimilation experiments, EXP_DA1min still exhibits an ability to suppress the spatial extent and intensity of this strong spurious convection. The vertical cross-sections in Figure 5d show a Bounded Weak Echo Region (BWER) and overhanging strong radar reflectivity around this region. Compared with the observations, EXP_DA1min (Figure 5p) achieves a better simulation of these features than EXP_DA6min (Figure 5i). This finding demonstrates that assimilating frequent radar data can more effectively track and simulate the evolution of the cloud dynamics of the hailstorm and more accurately reproduce its important hydrometeor development features.
To quantitatively evaluate the impact of the multi-band radar mosaic data assimilation on the hailstorm analysis and prediction, Figure 6 presents the FSS values of composite radar reflectivity for the thresholds of 15 dBZ and 40 dBZ, respectively. The regions with reflectivity greater than 15 dBZ are defined as precipitation areas, which is used to evaluate overall precipitation conditions, while the regions with reflectivity exceeding 40 dBZ are defined as hail cloud areas. Additionally, Figure 6 also presents the verification statistics of the simulated temperature and humidity fields. RMSE is calculated between modeled and observed 2 m temperature and relative humidity against the surface weather stations. Assimilating the multi-band radar mosaic data with a 1-min interval yields more accurate hydrometeor analyses. At the beginning of assimilation (07:10 UTC), FSS for the 15 dBZ threshold increases from 0.12 to 0.51 (EXP_DA6min). FSS for EXP_DA1min increases to 0.76, with a relative improvement of 49%. For the 40 dBZ reflectivity threshold, EXP_DA1min raises the FSS value from 0.48 (EXP_DA6min) to 0.72, with a relative improvement of 50%. The 1-min assimilation experiment (EXP_DA1min) reaches the maximum FSS value after 10 min of assimilation. In contrast, the 6-min assimilation experiment (EXP_DA6min) does not reach its maximum FSS value until the 20th minute. This result quantitatively demonstrates that the 1-min high-frequency assimilation achieves convergence to the observed state much faster than the 6-min interval. Before 7:30 UTC, EXP_CTRL forecasted an intense convective cell which is displaced far west from the observed hailstorm. This leads to flat and low FSS scores. Right after 7:30 UTC, a convective cell is developed to the south of the observed hailstorm, but close by. This convection continues to grow, slightly overlapped with the observed hailstorm, and contributes to mildly higher FSS. By the end of the data assimilation (07:30 UTC), the FSS improvement slightly declines. Compared with EXP_DA6min, the FSS value for EXP_DA1min is increased by 24% for the 15 dBZ reflectivity threshold, and by 35% improvement for the 40 dBZ threshold. By assimilating the high-frequency XPAR data with WRF-FDDA-HLHN, the model corrects the location, intensity and spatial structure of the convective core. The data assimilation ends at 7:35 UTC and the forecast starts immediately. The data assimilation effect is accumulated and achieves the best results at 7:35 UTC. The model simulation accuracy starts to degrade as the model starts forecasting. Therefore, the DA experiments achieve a FSS peak around 7:35. It is evident that shorter assimilation intervals effectively reduce the model spin-up time, converge to the observations faster, and enable more effective tracking of the hailstorm development.
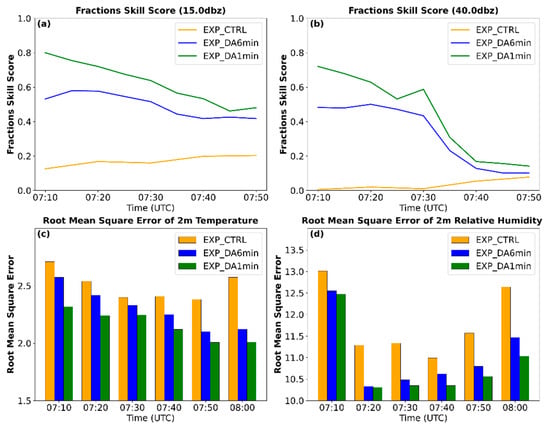
Figure 6.
FSS of composite radar reflectivity factors at 15 dBZ (a) and 40 dBZ (b) thresholds with a spatial scale of 3 km and RMSE of 2 m temperature (c) and 2 m humidity (d), computed for EXP_CTRL, EXP_DA6min, and EXP_DA1min.
In the subsequent 20-min forecast period (08:00 UTC), excessive depletion of low-level moisture in EXP_DA1min leads to the convection system collapsing, causing the FSS score for 40 dBZ to drop to 0.18. However, the overall FSS value remains higher than those of EXP_CTRL (0.07) and EXP_DA6min (0.10). As shown in Figure 6c,d, assimilating radar data with shorter time intervals can significantly improve the model simulation of the near-surface relative humidity and temperature. Meanwhile, the RMSE of 2 m temperature in EXP_DA1min and EXP_DA6min shows a slight overall decrease, from 2.7 of EXP_CTRL to 2.31 and 2.5, respectively. The positive impact continues during the forecast period. The improvement in 2 m relative humidity is more pronounced: by the end of the 30-min assimilation cycle, the RMSE values decrease from 11.33 of EXP_CTRL to 10.34 (EXP_DA1min) and 10.48 (EXP_DA6min), respectively.
Lin et al. (2022) [18] compared 4-min, 8-min, and 12-min phased array radar data assimilation intervals. They found that shorter assimilation intervals significantly improve strong convection nowcasting accuracy. By extending to assimilate radar data at 1-min intervals for plateau hailstorm scenarios, our results echo those of Lin et al. (2022) [18], showing that the high-frequency XPAR observations can help severe weather prediction. Assimilating the 1-min interval data enables faster spin-up of convection and quicker convergence to the observations. Moreover, it also better captures the fine-scale structure and rapid evolution of shallow hail clouds over the plateau.
3.3. Impact of Humidity Adjustment Along with HLHN
Since radar data assimilation with WRF-FDDA-HLHN only modifies the WRF model hydrometeor and temperature prognostic equations, model moisture errors exist and may grow during the data assimilation process. Figure 7 shows that by employing the humidity adjustment at 07:40 UTC, the model initial conditions gain significant improvement. The location and intensity of the hailstorm convection of EXP_PVDA compare better to the observations than those of the other experiments. A maximum radar reflectivity core exceeding 55 dBZ is produced and closely aligned with the observations. Meanwhile, spurious convection in the ambient of the hailstorm is largely eliminated. The benefit of the moisture adjustment well extended into the forecast stage. It continues to inhibit spurious convection development in the region surrounding the hailstorm and maintain the convective intensity in the hailstorm core region, with intense reflectivity (over 45 dBZ) persisting for more than 10 min, thereby extending the forecast period for hail.

Figure 7.
Composite radar reflectivity factor of observations (a–d); EXP_DA (without humidity adjustment) (e–h); (i–l) EXP_PVDA (with moisture adjustment) (e–h) from 07:40 UTC to 08:00 UTC on 17 August 2023. The line AB in (a,e,i) and line CD (c,g,k) marks the locations of the vertical cross-sections shown in Figure 7.
In Figure 8, we compare the radar reflectivity vertical cross-sections of the hailstorms simulated by EXP_CTRL, EXP_DA, and EXP_PVDA with radar observations. At 7:40 UTC, EXP_PVDA produces taller and stronger hail cloud, which is more consistent with the observations. The observed broad intense lower-level reflectivity with multiple cores and the observed maximum radar reflectivity over 40 dBZ are also well simulated. In contrast, the EXP_DA results are less accurate and EXP_CTRL is much worse. EXP_CTRL only simulated a narrow shallow convective cloud.
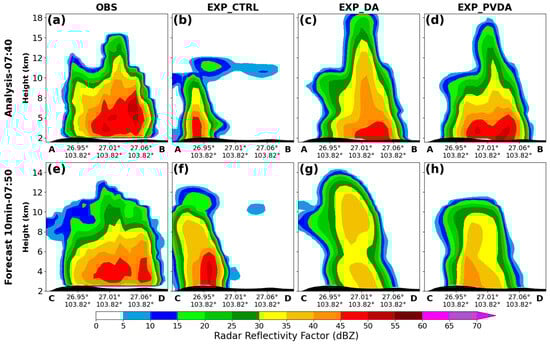
Figure 8.
Vertical cross-sections along lines AB and CD in Figure 7 of radar reflectivity factors for observations (a,e), and EXP_CTRL (b,f), EXP_DA (c,g), and EXP_PVDA (d,h) at 07:40 to 07:50 UTC on 17 August 2023.
EXP_CTRL (Figure 9a,d) develops weak updrafts and is displaced from the observed hailstorm. EXP_DA (Figure 9b) produces significantly enhanced updrafts after radar data assimilation. However, it suffers from substantial depletion of the low-level water vapor, and thus, at the 10-min forecast (Figure 9e), there is insufficient latent heat release in the cloud to sustain dynamical forcing. The convection rapidly weakened. EXP_PVDA (Figure 9c) achieves effective replenishment of low-level water vapor through the humidity adjustment. At the 10-min forecast (Figure 9f), the latent heat released by water vapor condensation in EXP_PVDA provides necessary fuel to support the severe convection development. The intensity of updrafts is well preserved. Its low-level moisture decreases as the storm develops, leading to rapid dissipation of the hail cloud. By adding the moisture adjustment, EXP_PVDA significantly enhances the low-level moisture, helps generate strong upward motion, and thus improves the hailstorm simulation. The low-level moisture conditions appear to preserve during the hailstorm development and align with the observed hailstorm. It also effectively clears the spurious convection in the surrounding area. In the 10-min forecast, the vertical upward motion is maintained and allows the hailstorm to develop with extended lifetime as observed.
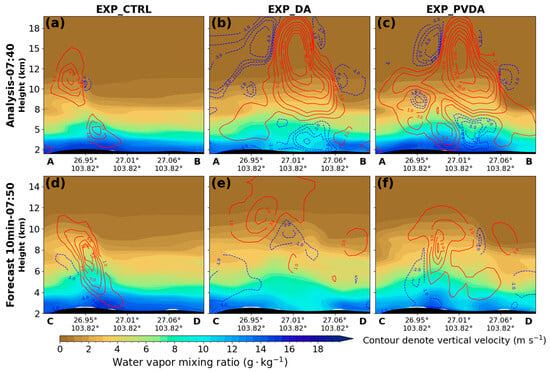
Figure 9.
Vertical cross-sections (along line AB and CD in Figure 7) of water vaper mixing ratio (colored shade, g kg−1) and vertical velocity (red and blue contours for updraft and downdraft respectively, m s−1) for EXP_CTRL (a,d), EXP_DA (b,e), and EXP_PVDA (c,f) at 07:40 UTC to 07:50 UTC on 17 August 2023.
WRF-FDDA-HLHN assimilates radar reflectivity and the VIL-based moisture adjustment algorithm improves the upper-air moisture. Together, they significantly improve the hailstorm simulation. It is of interest to analyze their impact on the surface temperature and moisture. We collected surface weather station observations in the region and verified the model forecasts of temperature and relative humidity at 2 m above ground level and used them to verify the effect of the VIL-based humidity adjustment algorithm on near-surface moisture and temperatures.
To clarify the regulation mechanism of the humidity adjustment on the hailstorm evolution, we summarize the characteristic of the water vapor, vertical velocity, and cloud life cycle simulated by EXP_DA and EXP_PVDA in Table 2.
Table 2.
Summary of the key features of the hailstorm simulated by EXP_DA and EXP_PVDA.
As shown in Figure 10a–c, a distinct cold pool emerges to the east of the hail cloud due to the development of spurious convection. For the EXP_DA (Figure 10d–f), the cold pool induced by spurious convection in the eastern region is partially suppressed after radar data assimilation. However, no significant temperature drop is formed in the hail cloud area. The EXP_PVDA (Figure 10g–i) clearly demonstrates that after introducing the radar reflectivity-based humidity adjustment, the anomalous low temperatures in the original spurious convection regions are effectively eliminated, and the surface temperature recovers to a level consistent with the surrounding environment. The overall temperature distribution becomes more distinct, with higher temperatures in the peripheral area and lower temperatures in the central area, and accurately reproduces the near surface cold pool structure formed by the sinking airflow and precipitation evaporation cooling in the main area of hail clouds. This effectively improved the simulation accuracy of the near-ground thermal field during the shallow and rapidly evolving hailstorm process on the plateau.
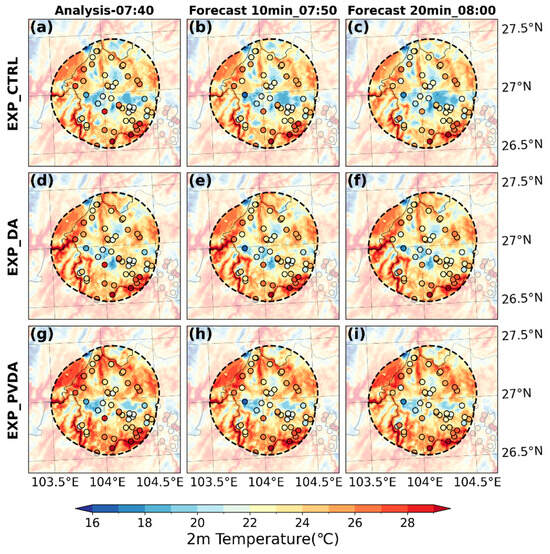
Figure 10.
Comparison of 2 m temperature from 07:40 to 08:00 UTC on 17 August 2023: (a–c) experiments without assimilation; (d–f) radar data assimilation experiments without humidity adjustment; (g–i) radar data assimilation experiments with humidity adjustment. Colored dots represent 2 m temperature observations from surface stations.
The improvement in the surface humidity due to the moisture adjustment process is more evident (Figure 11). Without the moisture adjustment, EXP_DA underestimates the relative humidity on the southern side significantly, resulting in discrepancies with observations. After adding the moisture adjustment, EXP_PVDA avoids the rapid depletion of low-level moisture in EXP_DA and noticeably enhances the moisture at the base of the hail cloud, which plays a critical role in facilitating the hail cloud’s further growth and intensification. Furthermore, it can be found that the relative humidity in the eastern spurious convection area decreases in EXP_PVDA, containing its further development during subsequent forecast period, thus significantly lowering the forecast errors.
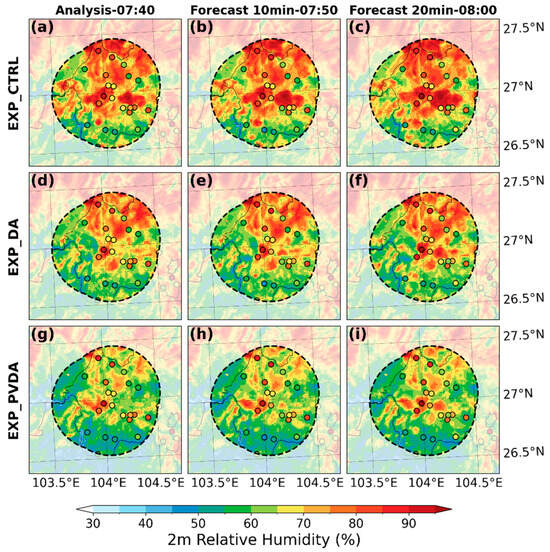
Figure 11.
Comparison of 2 m relative humidity from 07:40 to 08:00 UTC on 17 August 2023: (a–c) experiments without assimilation; (d–f) radar data assimilation experiments without humidity adjustment; (g–i) radar data assimilation experiments with humidity adjustment. Colored dots represent 2 m relative humidity observations from surface stations.
Figure 12 presents a quantitative comparison of the model performance between EXP_CTRL, EXP_DA, and EXP_PVDA. The removal of spurious convection by EXP_PVDA improves its precipitation score remarkably. At 07:40 UTC, the end of the data assimilation, the FSS value for 15 dBZ is 0.65 for EXP_DA and 0.78 for EXP_PVDA, with a 20% relative improvement. The moisture adjustment has a significant effect on intense convection and improves the core position and intensity of the hail cloud as verified against the observations. The FSS scores for EXP_PVDA further raises the FSS value from 0.58 to 0.76, with a 31% relative improvement compared with EXP_DA.
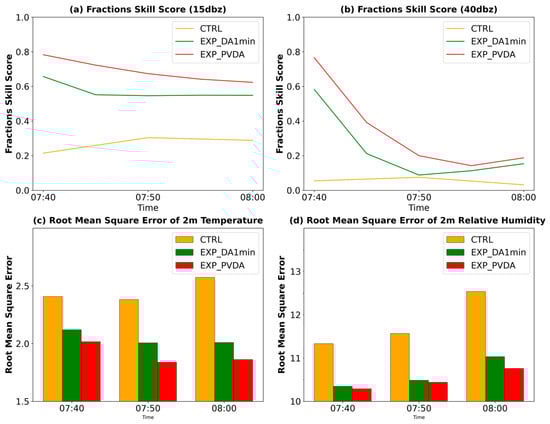
Figure 12.
Statistical verification of EXP_PVDA and EXP_DA (both with assimilation of 1-min interval radar data) and EXP_CTRL. FSS of composite radar reflectivity factors at 15 dBZ (a) and 40 dBZ (b) thresholds; RMSE of 2 m temperature (c) and 2 m relative humidity (d).
During the subsequent forecast period, the decline rate of the FSS of EXP_PVDA is slowed considerably from the other experiment. The FSS value for the 5-min forecast in EXP_PVDA is 0.39, significantly higher than 0.03 in EXP_CTRL and 0.21 in EXP_DA. For the 10-min forecast, the FSS value was 0.39, while those for EXP_CTRL and EXP_DA were only 0.02 and 0.09 respectively. Therefore, the moisture adjustment scheme greatly helps to extend the forecast length of the hailstorm.
Figure 12c,d show that the moisture adjustment in EXP_PVDA not only improved the surface relative humidity but also enhanced the surface temperature fields. The RMSE for the 2 m temperature of EXP_PVDA and EXP_DA decreased from 2.4 (EXP_CTRL) to 2.01 and 2.12, respectively. The RMSE for 2 m relative humidity also decreased at the end of the assimilation from 11.33 (EXP_CTRL) to 10.34 and 10.29. The positive effect in temperature and humidity extends well into the subsequent forecast period.
Although the moist adjustment scheme of Lai et al. (2020) [31] was applied in our simulation through coupling with WRF-FDDA-HLHN and working together with a high-frequency (1-min) radar data continuous assimilation, our results clearly show the benefit of the moist adjustment scheme in suppressing model spurious convection and enhance the target hailstorm. This effect is consistent with the objective of the moisture adjustment scheme that Lai et al. (2020) [31] developed and suggest the applicability of their scheme for plateau convective weather modeling. In conclusion, the assimilation process injects additional hydrometeor and latent heat into the model, but the background water vapor field remains unadjusted, creating an imbalance that triggers artificial instability and upward motion. This highlights the critical need for the humidity adjustment algorithm.
4. Discussion
The radar data assimilation process injects additional hydrometeors and latent heat into the model, while the background water vapor and temperature fields remain unadjusted. The resulting thermal imbalance and dynamic can trigger artificial disturbance and excites spurious convection upward. This problem underscores the necessity of the humidity adjustment algorithm.
It should be noted that this research represents an initial step toward exploiting XPAR radar data assimilation with WRF-FDDA-HLHN and VIL-based moisture adjustment for forecasting a typical hailstorm. Although we demonstrated the feasibility of our methods in improving the hailstorm forecasts, the results are subject to inherent limitations. A single case cannot fully represent the diverse characteristics of hailstorms in the plateau region. More case studies and statistical verification of multiple case modeling are needed to confirm the effectiveness and further optimize the empirical parameters of the proposed scheme in future work. We believe this is a typical case for hail cloud simulations, or where default FDDA cannot provide accurate prediction, and the improvement from moisture correction and other technology we applied yields satisfying results for this typical hailstorm. This is inspiring and needs more work in the future to verify its general applicability.
5. Conclusions
Forecasting hailstorms is very important for mitigating hail damage. However, it remains one of the most challenging tasks to accurately forecast hailstorms in operational weather forecasting due to their exceptional complexity, small size, and rapidly changing properties. With recent implementation of XPAR radar networks, 3D volume measurements of hailstorms with less than one-minute time intervals and 10-m radial resolution are produced. Therefore, there is an urgent need to explore data assimilation schemes to assimilate these XPAR data to improve hailstorm prediction.
Based on the XPAR radar network deployed in Weining, a plateau region with frequent hailstorm occurrences in the western China, we investigate how to assimilate XPAR data to improve hailstorm forecasting in the region. To address the core limitation that the HLHN scheme cannot correct water vapor field biases, a moisture adjustment algorithm is also implemented to correct the model moisture based on the radar 3D mosaic data. Three groups of numerical experiments are conducted for a typical hailstorm event occurred on 17 August 2023.
By assimilating the multi-band 3D radar reflectivity data composed with the XPAR and SWAN radar network in the Weining region, WRF-FDDA-HLHN appears to greatly improve the analysis and forecast of the hailstorm, in terms of both cloud and precipitation processes and the surface meteorological fields. The XPAR data effectively fill the low-altitude detection blind zones of conventional S- and C-band radars in the SWAN system, providing key observational information for the shallow, fast-evolving hailstorms over the plateau region. Assimilating the 1-min interval XPAR data can reduce reduced the spin-up time of the model in comparison to the data assimilation with 6-min radar data. This indicates that the HLHN scheme is a robust and effective scheme for DA applications with XPARs in forecasting convective weather. Furthermore, the 1-min interval assimilation can better capture the structure and rapid evolution of hailstorm, and accurately reproduces intense hail cloud cores with radar reflectivity over 45 dBZ. The model can track the rapid evolution of hail clouds observed by XPARs with the high-frequency DA.
By further integrating the VIL-based moisture adjustment algorithm based on the 3D radar mosaic data with WRF-FDDA-HLHN, the model remarkably improved the hailstorm prediction, including its size, intensity, and life cycle. The algorithm also helps contain the spurious convection occurring in the ambient conditions of the hailstorm, and improves the lower-level moisture and temperature during the initial development phase and mature stage of the hailstorm.
This study is an initial work toward assimilation of the XPAR radar network for hailstorm analysis and forecasting. Further improving the XPAR processing and combination with S- and C-band radar can help to improve the data assimilation effect. XPAR radar network provides important wind information and the measurement of polarized variables that reflect phases and types of the hydrometeors in the clouds. These data should be assimilated in the future. Furthermore, although the hailstorm case and the radar data in this study are representative over the high plateau of western China, the technique and findings obtained in this study need to be further validated with more case studies. A future multi-case statistical validation is needed to confirm the robustness and transferability of our method. We believe the WRF-FDDA-HLHN and moisture adjustment scheme can be applied to hailstorm forecasting in other regions, although extensive testing and parameter tuning are still required. In addition, for our future work, hail case studies with hail pads, disdrometer, and rain gauge measurements should be collected to conduct more rigorous surface verification for hailstorm modeling.
Author Contributions
Conceptualization, Y.L. and B.J.; methodology, Z.C., Y.L. and J.P.; software, J.P. and L.C.; validation, Q.D. and Y.L.; formal analysis, J.P. and Q.D.; investigation, J.P.; resources, B.J.; data curation, J.P. and Y.S.; writing—original draft preparation, J.P.; writing—review and editing, Y.L. and Q.D.; visualization, J.P.; supervision, Y.L.; project administration, Q.D. and L.C.; funding acquisition, Y.L.; All authors have read and agreed to the published version of the manuscript.
Funding
This research was funded by the NSFC-CMA Joint Research Grant U2342222, the CMA Challenge S&T Program (Grant CMAJBGS202215), the National Key R&D Program of China (Grant 2023YFC3007600 and Grant 2024YFF1308202).
Data Availability Statement
The GFS operational forecast data are from NCEP (https://rda.ucar.edu/datasets/ds083.2/ (accessed on 10 September 2025)). The SWAN and XPAR radar data used in this paper can be provided by corresponding authors upon request.
Conflicts of Interest
The authors declare no conflicts of interest.
References
- Rivero-Ordaz, L.; García-Ortega, E.; Navarro, A.; Tapiador, F.J.; Sánchez, J.L.; Merino, A. Evaluation of WRF Model Performance for Hailstorms in Southern France Using DPR-GPM Data. J. Geophys. Res. Atmos. 2025, 130, e2025JD043462. [Google Scholar] [CrossRef]
- Wu, W.; Huang, W.; Deng, L.; Wu, C. Investigation of Maximum Hail-Size Forecasting Using Bulk Microphysics Schemes. Mon. Weather Rev. 2022, 150, 2503–2525. [Google Scholar] [CrossRef]
- Huo, Z.; Liu, Y.; Taylor, J.; Zhou, Y.; Amemiya, A.; Fan, H.; Miyoshi, T. Incremental Analysis Updates in a Convective-Scale Ensemble Kalman Filter Using Minute-by-Minute Phased Array Radar Observations. J. Adv. Model. Earth Syst. 2025, 17, e2024MS004802. [Google Scholar] [CrossRef]
- Du, M.; Gao, J.; Zhang, G.; Wang, Y.; Heiselman, P.L.; Cui, C. Assimilation of Polarimetric Radar Data in Simulation of a Supercell Storm with a Variational Approach and the WRF Model. Remote Sens. 2021, 13, 3060. [Google Scholar] [CrossRef]
- Ryzhkov, A.; Zhang, P.; Hu, J. Suggested Modifications for the S-Band Polarimetric Radar Rainfall Estimation Algorithm. J. Hydrometeorol. 2025, 26, 1053–1062. [Google Scholar] [CrossRef]
- Wu, Z.; Huang, Y.; Zhang, Y.; Zhang, L.; Lei, H.; Zheng, H. Precipitation Characteristics of Typhoon Lekima (2019) at Landfall Revealed by Joint Observations from GPM Satellite and S-Band Radar. Atmos. Res. 2021, 260, 105714. [Google Scholar] [CrossRef]
- Gao, Y.; Chen, Y.; Zhang, L.; Peng, T. Radar-Rainfall Estimation from S-Band Radar and Its Impact on the Runoff Simulation of a Heavy Rainfall Event in the Huaihe River Basin. J. Meteorol. Soc. Jpn. Ser. II 2016, 94, 75–89. [Google Scholar] [CrossRef]
- Yang, Z.; Qi, Y.; Zhang, Z.; Li, D. Can CINRAD Radar with VCP-21 Mode Capture the Accumulated Rainfall Pattern and Intensity of Fast-Moving Storms? IEEE Trans. Geosci. Remote Sens. 2023, 62, 4100813. [Google Scholar] [CrossRef]
- Zhang, G.; Mahale, V.N.; Putnam, B.J.; Qi, Y.; Cao, Q.; Byrd, A.D.; Bukovcic, P.; Zrnic, D.S.; Gao, J.; Xue, M.; et al. Current Status and Future Challenges of Weather Radar Polarimetry: Bridging the Gap between Radar Meteorology/Hydrology/Engineering and Numerical Weather Prediction. Adv. Atmos. Sci. 2019, 36, 571–588. [Google Scholar] [CrossRef]
- Stratman, D.R.; Yussouf, N.; Jung, Y.; Supinie, T.A.; Xue, M.; Skinner, P.S.; Putnam, B.J. Optimal Temporal Frequency of NSSL Phased Array Radar Observations for an Experimental Warn-on-Forecast System. Weather Forecast. 2020, 35, 193–214. [Google Scholar] [CrossRef]
- Heinselman, P.L.; Priegnitz, D.L.; Manross, K.L.; Smith, T.M.; Adams, R.W. Rapid Sampling of Severe Storms by the National Weather Radar Testbed Phased Array Radar. Weather Forecast. 2008, 23, 808–824. [Google Scholar] [CrossRef]
- Huang, Y.; Wang, X.; Kerr, C.; Mahre, A.; Yu, T.-Y.; Bodine, D. Impact of Assimilating Future Clear-Air Radial Velocity Observations from Phased-Array Radar on a Supercell Thunderstorm Forecast: An Observing System Simulation Experiment Study. Mon. Weather Rev. 2020, 148, 3825–3845. [Google Scholar]
- Supinie, T.A.; Yussouf, N.; Jung, Y.; Xue, M.; Cheng, J.; Wang, S. Comparison of the Analyses and Forecasts of a Tornadic Supercell Storm from Assimilating Phased-Array Radar and WSR-88D Observations. Weather Forecast. 2017, 32, 1379–1401. [Google Scholar] [CrossRef]
- Wu, D.; Zhang, F.; Chen, X.; Ryzhkov, A.; Zhao, K.; Kumjian, M.R.; Chen, X.; Chan, P.-W. Evaluation of Microphysics Schemes in Tropical Cyclones Using Polarimetric Radar Observations: Convective Precipitation in an Outer Rainband. Mon. Weather Rev. 2021, 149, 1055–1068. [Google Scholar] [CrossRef]
- Zhu, Y.; Zhou, A.; Zhao, K.; Lu, Y.; Huang, H. The Observed and Simulated Evolution of a Microburst Using X-Band Phased-Array Radar Data Assimilation with EnKF. J. Geophys. Res. Atmos. 2025, 130, e2024JD042614. [Google Scholar] [CrossRef]
- He, L.; Min, J.; Yang, G.; Cao, Y. Contrasting the Effects of X-Band Phased Array Radar and S-Band Doppler Radar Data Assimilation on Rainstorm Forecasting in the Pearl River Delta. Remote Sens. 2024, 16, 2655. [Google Scholar] [CrossRef]
- Gao, S.; Min, J.; Yu, H. Assimilation of No-Precipitation Observations from Doppler Radar with 4DVar and Its Impact on Summertime Convective Event Prediction. Atmos. Res. 2021, 257, 105617. [Google Scholar] [CrossRef]
- Lin, X.; Feng, Y.; Xu, D.; Jian, Y.; Huang, F.; Huang, J. Improving the Nowcasting of Strong Convection by Assimilating Both Wind and Reflectivity Observations of Phased Array Radar: A Case Study. J. Meteorol. Res. 2022, 36, 61–78. [Google Scholar] [CrossRef]
- Jia, W.; Qin, M. Analysis of the applicability of X-band and S-band radar data over severe convective region in northern Jiangsu, China. Appl. Ecol. Environ. Res. 2025, 23, 7199–7219. [Google Scholar] [CrossRef]
- Shi, Z.; Feng, J.; Wu, C.; Wang, C.; Liu, T.; Duan, Y. The Impact of Assimilating X-Band Phased Array and S-Band Radar Data on the Forecast of Tropical Cyclone Saola (2023). J. Geophys. Res. Atmos. 2025, 130, e2024JD042898. [Google Scholar] [CrossRef]
- Liu, Y.; Vandenberghe, F.; Low-Nam, S.; Warner, T.; Swerdlin, S. Observation-quality estimation and its application in the NCAR/ATEC real-time FDDA and forecast (RTFDDA) system. Bull. Am. Meteorol. Soc. 2004, 1, 31–40. [Google Scholar]
- Liu, Y.; Xu, M.; Roux, G.; Ge, M.; Sheu, R.; Hacker, J.; Warner, T.; Swerdlin, S. A FDDA-Based Operational Mesoscale Ensemble Analysis and Prediction System (E-RTFDDA) and a Comparison of MM5 and WRF. In Proceedings of the 2007 WRF Users Workshop, Boulder, CO, USA, 11–15 June 2007. [Google Scholar]
- Liu, Y.; Warner, T.T.; Bowers, J.F.; Carson, L.P.; Chen, F.; Clough, C.A.; Davis, C.A.; Egeland, C.H.; Halvorson, S.F.; Huck, T.W., Jr.; et al. The Operational Mesogamma-Scale Analysis and Forecast System of the U.S. Army Test and Evaluation Command. Part I: Overview of the Modeling System, the Forecast Products, and How the Products Are Used. J. Appl. Meteorol. Clim. 2008, 47, 1077–1092. [Google Scholar] [CrossRef]
- Liu, Y.; Warner, T.T.; Astling, E.G.; Bowers, J.F.; Davis, C.A.; Halvorson, S.F.; Rife, D.L.; Sheu, R.-S.; Swerdlin, S.P.; Xu, M. The Operational Mesogamma-Scale Analysis and Forecast System of the U.S. Army Test and Evaluation Command. Part II: Interrange Comparison of the Accuracy of Model Analyses and Forecasts. J. Appl. Meteorol. Clim. 2008, 47, 1093–1104. [Google Scholar] [CrossRef]
- Zhang, H.; Liu, Y.; Qin, Y.; Xiang, Z.; Shi, Y.; Huo, Z. Assimilation of Moderate-Resolution Imaging Spectroradiometer Level Two Cloud Products for Typhoon Analysis and Prediction. Remote Sens. 2025, 17, 1635. [Google Scholar] [CrossRef]
- Sharman, R.D.; Liu, Y.; Sheu, R.S.; Warner, T.T.; Rife, D.L.; Bowers, J.F.; Clough, C.A.; Ellison, E.E. The Operational Mesogamma-Scale Analysis and Forecast System of the U.S. Army Test and Evaluation Command. Part III: Forecasting with Secondary-Applications Models. J. Appl. Meteorol. Climatol. 2008, 47, 1105–1122. [Google Scholar] [CrossRef]
- Wang, H.; Yuan, S.; Liu, Y.; Li, Y. Comparison of the WRF-FDDA-Based Radar Reflectivity and Lightning Data Assimilation for Short-Term Precipitation and Lightning Forecasts of Severe Convection. Remote Sens. 2022, 14, 5980. [Google Scholar] [CrossRef]
- Alexandru, A.; De Elia, R.; Laprise, R.; Separovic, L.; Biner, S. Sensitivity Study of Regional Climate Model Simulations to Large-Scale Nudging Parameters. Mon. Weather Rev. 2009, 137, 1666–1686. [Google Scholar] [CrossRef]
- Huo, Z.; Liu, Y.; Wei, M.; Shi, Y.; Fang, C.; Shu, Z.; Li, Y. Hydrometeor and Latent Heat Nudging for Radar Reflectivity Assimilation: Response to the Model States and Uncertainties. Remote Sens. 2021, 13, 3821. [Google Scholar] [CrossRef]
- Wang, J.; Zhang, M. A Constrained Data Assimilation Algorithm Based on GSI Hybrid 3D-EnVar and Its Application. Mon. Weather Rev. 2021, 149, 3365–3378. [Google Scholar] [CrossRef]
- Lai, A.; Min, J.; Gao, J.; Ma, H.; Cui, C.; Xiao, Y.; Wang, Z. Assimilation of Radar Data, Pseudo Water Vapor, and Potential Temperature in a 3DVAR Framework for Improving Precipitation Forecast of Severe Weather Events. Atmosphere 2020, 11, 182. [Google Scholar] [CrossRef]
- Zhang, J.; Qi, Y. A Real-Time Algorithm for the Correction of Brightband Effects in Radar-Derived QPE. J. Hydrometeorol. 2010, 11, 1157–1171. [Google Scholar] [CrossRef]
- Fierro, A.O.; Gao, J.; Ziegler, C.L.; Calhoun, K.M.; Mansell, E.R.; MacGorman, D.R. Assimilation of flash extent data in the variational framework at convection-allowing scales: Proof-of-concept and evaluation for the short-term forecast of the 24 May 2011 tornado outbreak. Mon. Weather Rev. 2016, 144, 4373–4393. [Google Scholar] [CrossRef]
- Grell, G.A.; Freitas, S.R. A Scale and Aerosol Aware Stochastic Convective Parameterization for Weather and Air Quality Modeling. Atmos. Chem. Phys. 2014, 14, 5233–5250. [Google Scholar] [CrossRef]
- Iacono, M.J.; Delamere, J.S.; Mlawer, E.J.; Shephard, M.W.; Clough, S.A.; Collins, W.D. Radiative Forcing by Long-lived Greenhouse Gases: Calculations with the AER Radiative Transfer Models. J. Geophys. Res. 2008, 113, 2008JD009944. [Google Scholar] [CrossRef]
- Chen, S.H.; Sun, W.Y. A One-Dimensional Time Dependent Cloud Model. J. Meteorol. Soc. Jpn. Ser. II 2002, 80, 99–118. [Google Scholar] [CrossRef]
- Hong, S.Y.; Lim, J.O.J. The WRF Single-Moment 6-Class Microphysics Scheme (WSM6). Asia-Pac. J. Atmos. Sci. 2006, 42, 129–151. [Google Scholar]
- Thompson, G.; Field, P.R.; Rasmussen, R.M.; Hall, W.D. Explicit Forecasts of Winter Precipitation Using an Improved Bulk Microphysics Scheme. Part II: Implementation of a New Snow Parameterization. Mon. Weather Rev. 2008, 136, 5095–5115. [Google Scholar] [CrossRef]
- Morrison, H.; Thompson, G.; Tatarskii, V. Impact of Cloud Microphysics on the Development of Trailing Stratiform Precipitation in a Simulated Squall Line: Comparison of One-and Two-Moment Schemes. Mon. Weather Rev. 2009, 137, 991–1007. [Google Scholar] [CrossRef]
- Roberts, N.M.; Lean, H.W. Scale-Selective Verification of Rainfall Accumulations from High-Resolution Forecasts of Convective Events. Mon. Weather Rev. 2008, 136, 78–97. [Google Scholar] [CrossRef]
- Thomas, B.; Viswanadhapalli, Y.; Srinivas, C.V.; Dasari, H.P.; Attada, R.; Langodan, S. Cloud resolving simulation of extremely heavy rainfall event over Kerala in August 2018–Sensitivity to microphysics and aerosol feedback. Atmos. Res. 2021, 258, 105613. [Google Scholar] [CrossRef]
- Karki, R.; Hasson, S.U.; Gerlitz, L.; Talchabhadel, R.; Schenk, E.; Schickhoff, U.; Scholten, T.; Böhner, J. WRF-based simulation of an extreme precipitation event over the Central Himalayas: Atmospheric mechanisms and their representation by microphysics parameterization schemes. Atmos. Res. 2018, 214, 21–35. [Google Scholar] [CrossRef]
- Putnam, B.J.; Xue, M.; Jung, Y.; Snook, N.; Zhang, G. The analysis and prediction of microphysical states and polarimetric radar variables in a mesoscale convective system using double-moment microphysics, multinetwork radar data, and the ensemble Kalman filter. Mon. Weather Rev. 2014, 142, 141–162. [Google Scholar] [CrossRef]
- Bryan, G.H.; Morrison, H. Sensitivity of a simulated squall line to horizontal resolution and parameterization of microphysics. Mon. Weather. Rev. 2012, 140, 202–225. [Google Scholar] [CrossRef]
- Bellagente, I.E.; Lai, H.W.; Senf, F. Effects of cloud microphysics on the simulation of extreme precipitation over the Tibetan Plateau region. Atmos. Res. 2025, 327, 108366. [Google Scholar] [CrossRef]


Disclaimer/Publisher’s Note: The statements, opinions and data contained in all publications are solely those of the individual author(s) and contributor(s) and not of MDPI and/or the editor(s). MDPI and/or the editor(s) disclaim responsibility for any injury to people or property resulting from any ideas, methods, instructions or products referred to in the content. |
© 2026 by the authors. Licensee MDPI, Basel, Switzerland. This article is an open access article distributed under the terms and conditions of the Creative Commons Attribution (CC BY) license.