Highlights
What are the main findings?
- Landsat time series (2000–2024) reveal a clear transition from severe land degradation toward widespread ecological recovery in central Tunisia.
- Opuntia ficus-indica plantations expanded by over 350%, accompanied by a significant increase in NDVI values from 0.05–0.17 to 0.4–0.48.
What are the implications of the main findings?
- OFI demonstrates strong potential as a nature-based solution for reversing land degradation in semi-arid environments.
- The integration of remote sensing and topographic analysis supports effective restoration planning, particularly at higher elevations and on convex slopes prone to erosion.
Abstract
Land degradation is a growing concern in arid and semi-arid regions, posing severe threats to ecosystem stability, agricultural productivity, and rural livelihoods due to the combined effects of natural processes and human activities. This study examines the role of Opuntia ficus-indica (OFI), a drought-resistant cactus, in mitigating land degradation and enhancing ecosystem resilience in central Tunisia using Landsat 5 and 9 satellites with 30 m spatial resolution. Spatio-temporal dynamics of land use/land cover (LULC) and variations in key spectral indices sensitive to vegetation and soil conditions were analyzed over the period from 2000 to 2024. Using a remote sensing-based multi-index framework, Land Degradation Index (LDI) maps were generated for 2000–2010 and 2010–2024 sub-periods. Change detection analysis revealed a marked reduction in moderate-to-severe land degradation, particularly in areas characterized by OFI expansion. NDVI values associated with OFI increased significantly, from less than 0.1 in 2000 to about 0.18 in 2024, indicating enhanced vegetation vigor and improved adaptive capacity under semi-arid climatic conditions. To further assess species performance, correlation analyses were conducted between NDVI-OFI values and topographic variables, including elevation and terrain curvature. Results show a strong positive relationship between NDVI-OFI and elevation, with a clear temporal improvement from 2000 to 2024. In addition, NDVI values were highest in convex terrain forms (0.2), highlighting OFI’s ability to thrive in erosion-prone and topographically exposed environments. Findings confirm the effectiveness of OFI in reversing land degradation processes, supporting restoration through an integrated approach combining multi-temporal remote sensing and topographic analysis. The study highlights the potential of OFI as a cost-effective and scalable nature-based solution for land rehabilitation in semi-arid regions.
1. Introduction
Land degradation and desertification are among the most pressing environmental and socio-economic challenges of the 21st century, with profound consequences for ecosystem stability, agricultural productivity, food security, and human well-being [1]. At the global scale, these phenomena have escalated in magnitude and impact, with approximately 3.2 billion people directly affected and economic losses estimated at nearly 10% of the annual global gross domestic product [2]. The severity of the problem is further highlighted by the degradation of about 33% of the Earth’s terrestrial surface, exceeding 4.9 billion hectares, resulting from a complex interplay of anthropogenic pressures and climate-induced stressors [3].
Land degradation manifests through multiple interrelated processes, including persistence due to soil erosion, nutrient depletion, and loss of soil structure, often accompanied by fertility loss, along with off-site impacts such as sedimentation that disrupt ecosystems [4]. Desertification in arid regions further accelerates vegetation loss and ecosystem decline, reducing land productivity and resilience [5]. In response to these cascading impacts, many countries have undertaken strategic initiatives to combat land degradation and promote sustainable land management [6]. These efforts are underpinned by growing recognition of the critical role of healthy land systems in sustaining biodiversity, supporting economic development and enhancing climate resilience [7]. The principal drivers of land degradation are well documented and include deforestation, unsustainable agricultural practices, overgrazing [8], and the accelerating impacts of climate change [9]. Accordingly, policy frameworks have been developed to address these drivers by implementing land-use regulations, controlled deforestation [10], the promotion of sustainable grazing systems, and restricting the excessive use of chemical inputs in agriculture [11]. In Europe, particularly in southern and south-eastern regions, land degradation is increasingly exacerbated by climate extremes, including prolonged droughts [12,13,14] and recurrent heatwaves [15]. These stressors contribute to soil quality deterioration, vegetation cover loss, enhanced salinization in coastal areas, and increasing instability of agricultural systems.
Early and timely detection of land degradation is essential for preventing irreversible land deterioration and supporting appropriate, effective mitigation and restoration [16]. In this context, advances in geospatial technologies have positioned Geographic Information Systems (GIS) and Remote Sensing as key tools for assessing and monitoring desertification dynamics, particularly in remote or inaccessible regions where conventional field-based surveys are limited or unfeasible [17]. These technologies facilitate the acquisition, integration, and interpretation of multi-temporal and multi-spectral datasets, enabling comprehensive spatial and temporal analyses of land degradation patterns [18]. Their ability to deliver consistent, large-scale, and long-term observations has significantly improved the accuracy and efficiency of desertification monitoring [19]. Consequently, GIS and remote sensing approaches facilitate the identification of high-risk areas, the understanding of degradation drivers, and the design of targeted restoration strategies [20,21,22,23,24].
Building on these capabilities, previous research has emphasized vegetation dynamics as a fundamental proxy for monitoring and interpreting environmental transformations at multiple spatial and temporal scales [25]. Vegetation is widely recognized as a sensitive bio-indicator ecosystem response to climatic variability and anthropogenic pressure [26]. Therefore, elucidating the complex interactions between vegetation patterns and global change drivers has become a central focus of ecosystem monitoring and sustainable land management research [27]. This analytical potential is further enhanced by integrating spectral indices, which serve as effective proxies for detecting and quantifying key biophysical parameters associated with land degradation and desertification processes [28]. Spectral indices are a core component of multitemporal change detection frameworks, providing critical quantitative metrics for monitoring vegetation dynamics and assessing ecosystem disturbances [29].
Within this framework, the Zelfen region in central Tunisia represents an ideal case study given its vulnerability to desertification and the widespread expansion of Opuntia ficus-indica (L.) OFI. In this study, a suite of complementary spectral indices was employed to capture the multidimensional aspects of land degradation and desertification processes by leveraging the capabilities of remote sensing and GIS technologies. Vegetation condition was primarily assessed using the Normalized Difference Vegetation Index (NDVI) and the Soil-Adjusted Vegetation Index (SAVI), both widely recognized for their sensitivity to variations in vegetation cover, health, and chlorophyll activity [30,31]. To detect bare soil exposure, a key indicator of erosion and surface degradation, the Bare Soil Index (BSI) is used because it can discriminate between vegetated and non-vegetated surfaces [32]. Soil salinization, another critical driver of land degradation, was assessed using the Normalized Difference Salinity Index (NDSI) [33]. Surface water dynamics were evaluated using the Modified Normalized Difference Water Index (MNDWI), which enhances the detection of water bodies under hydrological stress [34]. Finally, urban expansion and built-up areas were analyzed using the Normalized Difference Built-up Index (NDBI), reflecting anthropogenic land transformation [35].
The combined and integrative use of these spectral indices significantly enhances the capacity to identify land degradation hotspots and to monitor diachronic changes across both spatial and temporal scales. By integrating indicators of vegetation, soil, water, salinity, and urbanization, this multi-index approach provides a more nuanced and robust delineation of ecological stress [32]. Hotspot areas identified through this composite spectral approach are frequently associated with significant variations in vegetation cover, which, when analyzed alongside other indices, offer valuable insights into the drivers, extent, and evolution of land degradation in semi-arid environments [22]. In fact, spatial patterns of vegetation cover, when analyzed alongside other spectral indicators, provide essential insights into the drivers, extent, and evolution of degradation hotspots, particularly within vulnerable arid and semi-arid conditions.
The main objective of this study is to evaluate land degradation and restoration dynamics in the semi-arid Zelfen region of Kasserine, Tunisia. Specifically, the study aims to: (i) assess land use and land cover (LULC) changes between 2000 and 2024; (ii) analyze the spatio-temporal variability of key spectral indices; (iii) evaluate land degradation dynamics using a composite Land Degradation Index (LDI); and (iv) investigate the ecological role of Opuntia ficus-indica in landscape restoration under semi-arid conditions.
2. Materials and Methods
2.1. Study Area Description
The study area encompasses the Zelfen region, at 35°24′N latitude and 8°47′E longitude, within the Kasserine Governorate in central-western Tunisia, covering an area of approximately 60,245 ha. The Digital Elevation Model (DEM) adopted in this study was derived from the Shuttle Radar Topography Mission (SRTM) dataset distributed by USGS, featuring a spatial resolution of 30 m, which is fully consistent with the Landsat imagery used in the analysis (Figure 1).
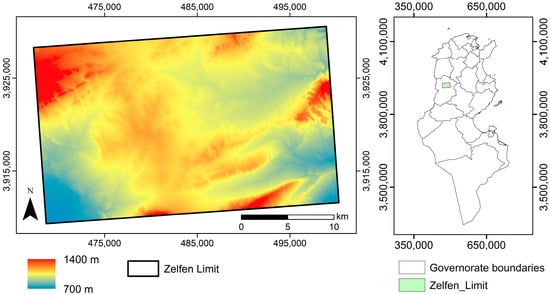
Figure 1.
Location of the study area.
Topographically, this region exhibits marked elevation variability ranging from approximately 700 m to over 1400 m above sea level (Figure 1). This altitudinal gradient contributes to spatial heterogeneity in soil properties, vegetation cover, and microclimatic conditions across the study area. The region lies within a semi-arid climatic zone. This region is characterized by severe environmental conditions, including low and irregular precipitation and recurrent drought episodes, which collectively impose substantial constraints on agricultural productivity and land sustainability.
The region supports a mix of traditional and adaptive land-use systems, among which OFI is particularly prominent. OFI is an exotic species originally introduced to Tunisia via Spain after its initial introduction from Central America [36]. Over time, this species has successfully acclimatized to local environmental conditions, demonstrating remarkable resilience to water scarcity and degraded soils [37]. OFI is widely recognized for its agro-economic and ecological benefits in Mediterranean and arid environments, where it functions as a low-input, drought-resistant crop capable of providing both economic returns and ecosystem services (Figure 2). Its extensive cultivation highlights the importance of plant-based adaptation strategies for reinforcing socio-ecological resilience in semi-arid landscapes such as the Zelfen region. Consequently, the study area represents an appropriate reference setting for analyzing LULC dynamics, monitoring land degradation processes, and evaluating sustainable land management strategies under semi-arid conditions.
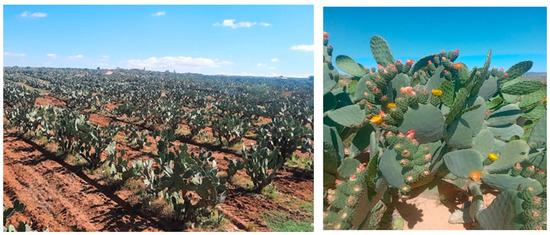
Figure 2.
Photographs of representative OFI cultivation in the Zelfen region.
2.2. Satellite Imagery and Classification Method
A multi-temporal satellite imagery was used to assess LULC changes and land degradation in the Zelfen region over 25 years (2000–2024). The datasets included imagery from Landsat 5 Thematic Mapper (TM) for 2000 and 2010, and Landsat 9 Operational Land Imager-2 (OLI-2) for 2024. All images were acquired during the spring season, minimizing phenological variability and enhancing inter-annual comparability (Table 1). All Landsat scenes were obtained as Collection 2 Level-2 Surface Reflectance (SR) products from the USGS Earth Explorer platform, ensuring radiometric consistency, atmospheric correction, and temporal continuity. Landsat-5 TM data were processed using the LEDAPS atmospheric correction algorithm, while Landsat-9 OLI data were processed using the LaSRC algorithm; both approaches are based on the 6S radiative transfer model. The use of standardized Level-2 SR products minimizes atmospheric effects and sensor-related variability, thereby improving the comparability of multi-temporal spectral indices across different sensors.

Table 1.
Details of satellite images used in this study.
Each image has a spatial resolution of 30 m, providing an optimal balance between regional coverage and detail for semi-arid landscape analysis. The minimum mapping unit corresponds to the intrinsic spatial resolution of the Landsat imagery, and classification results were retained at the pixel level, without applying majority or smoothing filters.
Supervised LULC classification was performed using the Support Vector Machine (SVM) algorithm, which is widely recognized for its high classification accuracy and strong generalization capabilities in both linear and non-linear problems [38]. Implementation of the algorithm through the Orfeo ToolBox 9.1 platform enabled effective handling of high-dimensional spectral data and precise delineation of land-cover classes. Due to its robustness and adaptability, SVM has been extensively applied in remote-sensing-based LULC classification tasks [39].
Classification accuracy was quantitatively assessed using the overall accuracy (OA) and the Kappa coefficient, both widely adopted metrics for evaluating classification reliability (Table 2). These metrics confirm the high accuracy and consistency of the produced LULC maps, which form the basis for subsequent spatio-temporal analysis of land degradation and vegetation dynamics [40]. Second, imagery was used to calculate a range of spectral indices, offering complementary quantitative insights into spatio-temporal degradation dynamics throughout the study area.
Table 2.
Accuracy (%) and Kappa index of land use classes.
A total of 1361 reference points were collected and stratified across six LULC classes. For each class, 100 points were reserved for validation, and the remaining samples were used for training (Table 2). To ensure statistical robustness, the validation sample size was determined assuming a success probability p = 0.5, representing maximum variability, and a margin of error d = ±0.05 (5%).
Integrating classification results with spectral index trends provided a thorough assessment of environmental change and degradation hotspots over time. Merging LULC classification outcomes with the temporal patterns of spectral indices enabled a detailed evaluation of environmental shifts, aiding the identification of degradation hotspots and the tracking of landscape changes across periods.
2.3. Spectral Indices Calculation
Spectral indices are essential tools for sustainable land-use planning, especially in arid and semi-arid regions where field-based observations are often constrained by harsh climatic and logistical limitations [41]. In this study, spectral indices were systematically calculated from selected Landsat imagery (Table 1) for the 2000–2024 period. This 25-year interval captures key phases in the environmental dynamics of the Zelfen region and was chosen to assess spatiotemporal trends and degradation under semi-arid climatic conditions. The selection of spectral indices was based on their proven diagnostic capability in detecting environmental changes across multiple landscape components (Table 3). Moreover, the spectral indices were selected to provide complementary, spatially explicit biophysical information. Beyond vegetation productivity, the inclusion of other related indices enables a more comprehensive assessment of surface conditions that influence degradation trajectories in semi-arid landscapes. Indeed, the indices were grouped into four functional categories: (i) vegetation indices, including NDVI and SAVI, to quantify vegetation vigor and cover fraction; (ii) soil and salinity indices such as BSI and NDSI, to detect bare soil exposure and salinization trends; (iii) water-related indices including MNDWI, which enhances the detection of surface water and soil moisture; and (iv) built-up area index represented by NDBI, to monitor anthropogenic land cover expansion.
Table 3.
Land Descriptions of some characteristic indices.
Together, these indices provide quantitative proxies for detecting changes in land conditions. This multi-index approach improves the ability to capture subtle environmental stresses that may not be apparent from vegetation productivity indicators alone. For each of the three selected dates, the full suite of spectral indices was systematically computed, allowing for comparative multi-temporal analysis of land-surface conditions and degradation trajectories.
2.4. Land Degradation Index Calculation
Time-series analysis of composite trends provided insights into the extent and direction of land transformation, while diachronic mapping allowed for the spatial delineation and characterization of critical degradation zones. This integrative framework allowed for a nuanced understanding of how multiple biophysical indicators co-evolve over time and space regarding land degradation and desertification processes.
In the subsequent phase of the study, to combine individual spectral indices into a single synthetic indicator, a LDI was developed to identify and track degradation hotspots from 2000 to 2024.
The LDI was computed following a standardized, multi-step procedure, ensuring methodological transparency and reproducibility. Composite LDI maps were generated for two sub-periods (2000–2010 and 2010–2024), and change-detection analysis was applied to identify areas of degradation, stability, or recovery. Time-series analysis of LDI trends provided insights into the direction and magnitude of land transformation, while diachronic mapping enabled the spatial delineation of critical degradation zones.
The LDI combines vegetation (NDVI, SAVI), soil/salinity (BSI, NDSI), water (MNDWI), and built-up (NDBI) indices into a composite metric, enabling the identification and temporal tracking of land degradation hotspots. These individual indicators were integrated using a Principal Component Analysis (PCA) approach. PCA is employed to objectively transform the original correlated indices into a new set of uncorrelated principal components (PCs), thereby condensing the multi-dimensional information while eliminating redundancy. Crucially, PCA determines the optimal weights for each spectral index statistically based on their respective contributions to the overall variance within the dataset, rather than relying on arbitrary or subjective weight assignments. Prior to analysis, all six spectral indices were normalized (Inorm) to a standard range (0 to 1) to ensure comparability.
Indices that are negatively correlated with degradation (NDVI, SAVI, and MNDWI, where higher values indicate healthier conditions) were inverted so that all indices consistently represent degradation pressure in the same direction, with Iinv representing this inverted value:
PCA transforms the individual indices into a new set of uncorrelated variables, known as principal components (PCs). The weights of these PCs are then determined based on the proportion of variance explained by each component. These weights are subsequently used to develop the LDI. Accordingly, it is computed using the following formula:
where LDI is the land degradation index; NDVI, SAVI, BSI, NDSI, MNDWI and NDBI are the individual indices; WNDVI, WSAVI, WMNDWI, WBSI, WNDSI and WNDBI are their weights.
This data-driven methodology ensures that the resulting LDI quantitatively captures the integrated effects of vegetation stress, soil exposure, salinity, moisture deficit, and urbanization, producing a continuous degradation surface where higher pixel values correspond to more severe land degradation.
By correlating LDI patterns with LULC changes and topographic variables, the analysis aimed to establish linkages between environmental stressors and the spatial degradation patterns. Temporal comparisons further enabled the distinction between gradual and abrupt changes, supporting a more detailed interpretation of land degradation dynamics and informing targeted land management and mitigation strategies.
3. Results
The analysis followed a sequential approach, beginning with mapping LULC changes to identify spatial patterns and trends over time. Spectral indices were computed and analyzed to capture variations in overall landscape condition, providing quantitative indicators of environmental change and revealing the spatio-temporal dynamics of land surface conditions and degradation processes. These observations were integrated into LDI, a composite metric that synthesizes multiple remote sensing-derived spectral indices, to identify areas experiencing significant deterioration. Given that OFI is the most developed species in the study area, a correlation analysis was conducted between OFI-NDVI values and key topographic variables to evaluate its ecological role in land restoration. This stepwise framework links land cover changes, degradation patterns and topographic influences on OFI distribution, providing a coherent understanding of the factors driving landscape dynamics and informing targeted restoration and land management strategies.
3.1. Spatio-Temporal Distribution of LULC in the Zelfen Region
The analysis of LULC dynamics in the Zelfen region over the period 2000–2024, based on supervised classification using the SVM algorithm, revealed pronounced spatial and temporal transformations. Classification accuracy was consistently high across the three reference years, with overall accuracy increasing from 84% in 2000 to 92% in 2024, and Kappa coefficients rising from 0.8 to 0.9 (Table 2). These results indicate substantial agreement between the classified maps and the ground-truth reference data, confirming the robustness and reliability of the classification procedure and the temporal consistency of LULC mapping, thereby supporting subsequent spatial and temporal analyses [40].
The processed Landsat images for 2000, 2010, and 2024 enabled the delineation of six major LULC classes, providing a consistent basis for analyzing temporal changes and land-use dynamics across the study area (Table 2 and Figure 3). This classification provided a consistent basis for analyzing temporal changes and assessing land use dynamics across the study area.
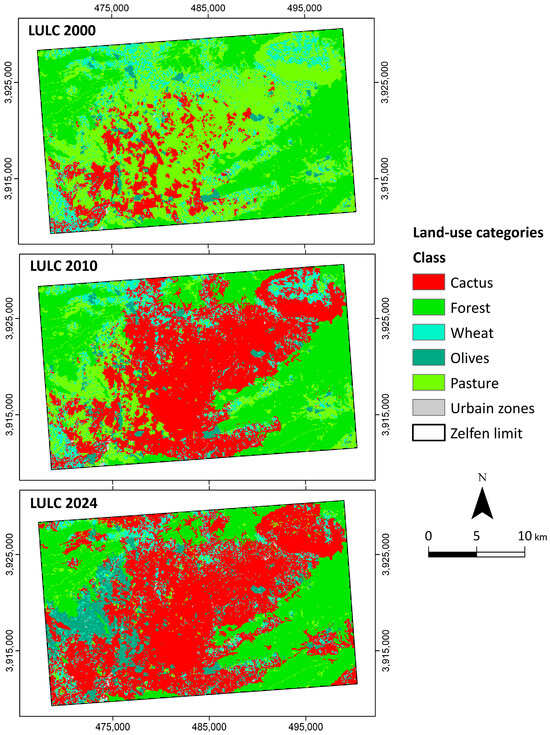
Figure 3.
Land use/land cover (LULC) maps of the Zelfen region for the years 2000, 2010 and 2024.
Georeferenced high-resolution Google Earth satellite imagery from 2010 and 2024 was also used to visually assess changes in land-use categories. Figure 4 presents four representative examples that provide independent evidence supporting the remote-sensing results and strengthen the plausibility and credibility of the detected spatio-temporal changes. In particular, Figure 4 highlights the spatial expansion and densification of OFI in relation to surrounding land-cover types and the local environmental context, including the morphological setting.
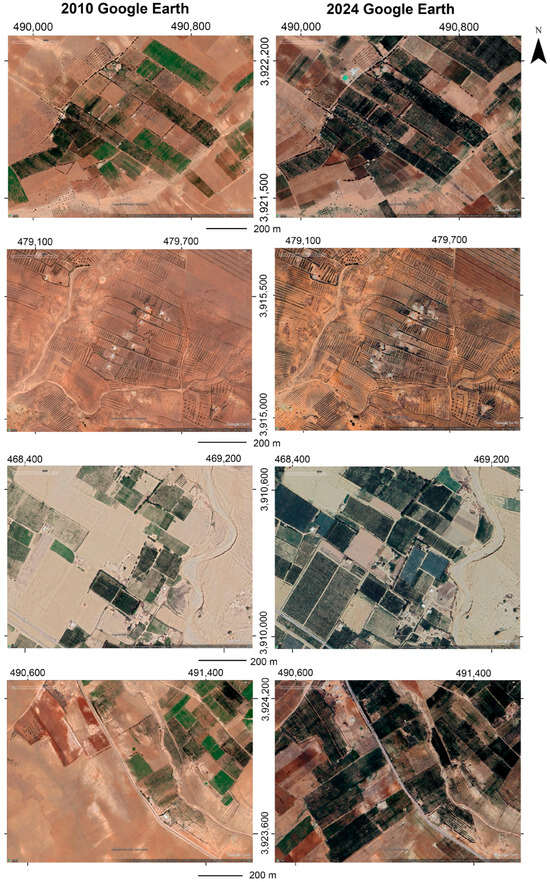
Figure 4.
Four representative examples of land-use category changes visible in high-resolution Google Earth imagery between 2010 (left) and 2024 (right), enabling a direct and intuitive assessment of OFI-associated land-cover changes.
Across the three benchmark years 2000, 2010, and 2024, substantial shifts in land use categories were observed. The most pronounced transformation concerns the expansion of cactus plantations (OFI), which increased from 6759 ha (11%) in 2000 to 25,005 ha (41.5%) in 2010 and further to 30,494 ha (51%) in 2024, representing a cumulative exceeding 350% over the study period. This expansion reflects a progressive shift toward drought-resistant and climate-adaptive land management practices, favoring drought-resistant crops in response to climatic and socio-economic pressures.
The spatial analysis of OFI distribution within the Zelfen region revealed a predominant concentration of this species in the central zones of the study area, particularly within elevation ranges between 700 and 1100 m above sea level (Figure 5). These mid-altitude areas exhibit favorable edaphoclimatic conditions, including moderate slope gradients and semi-arid climatic features, which support the proliferation and persistence of drought-tolerant species. The altitudinal preference underscores the adaptive capacity of OFI to marginal and degraded lands, where it contributes to soil conservation, agricultural diversification, and livelihood resilience in rural arid and semi-arid environments.
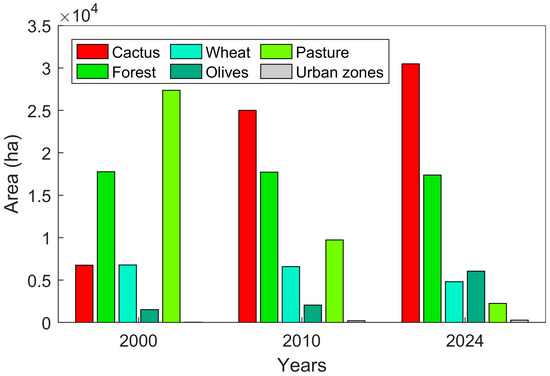
Figure 5.
Changes in the surface areas of major LULC classes in the Zelfen region between 2000 and 2024.
Olive groves also exhibited a significant expansion, increasing from 1518 ha in 2000 to 6061 ha in 2024, representing a 299% increase, underscoring the crop’s growing significance in regional arid agriculture. Forested areas remained relatively stable, exhibiting only a minor decline of approximately −2.2%, likely attributable to increased anthropogenic pressures, such as land fragmentation, expansion of agricultural frontiers, and localized exploitation of forest resources. In contrast, urban areas expanded markedly, exhibiting an increase of more than 546% between 2000 and 2024, reflecting gradual but persistent urban growth. Conversely, pasture lands experienced a sharp contraction, declining from 27,364 ha in 2000 to 9730 ha in 2010, and further to 2243 ha by 2024. Similarly, wheat cultivation diminished progressively from 6785 ha in 2000 to 4801 ha in 2024. These declines are indicative of a structural shift away from extensive grazing and annual crops toward more resilient perennial systems, particularly OFI and olive plantations.
Overall, the observed LULC transitions reflect a profound reorganization of land-use patterns, with increasing specialization in drought-tolerant and economically viable land covers. These changes not only characterize the trajectory of landscape transformation in the Zelfen region but also serve as key indicators of land degradation and recovery processes, providing a critical foundation for subsequent spectral and LDI-based analyses. By linking LULC dynamics with land degradation assessments, it becomes possible to identify hotspots of environmental stress. Such an approach ensures that landscape monitoring is directly relevant to both local ecosystem sustainability and broader international land degradation targets.
3.2. Spatio-Temporal Analysis of Spectral Indices
The spatio-temporal evolution of spectral indices between 2000 and 2024, including NDVI, SAVI, BSI, NDSI, MNDWI and NDBI, provides a comprehensive depiction of land surface condition dynamics and degradation processes within the study area (Figure 6). Vegetation indices such as NDVI and SAVI indicate a substantial increase in vegetation cover over the 25-year period. In 2000, low to moderate NDVI and SAVI values dominated the landscape, particularly in the central and southern sectors characterized by pasturelands and cereal cultivation. By 2010, moderate increases in vegetation indices were observed, predominantly in the central-eastern sectors, reflecting early stages of vegetation recovery and possible agricultural intensification or expansion. This trend intensified by 2024, when high NDVI and SAVI values dominated extensive portions of the central belt, coinciding with the proliferation of perennial drought-resistant crops, notably OFI and olive plantations. Such shifts highlight significant land-use change from traditional pasture and cereal systems towards more resilient and economically valuable perennial cropping systems, likely motivated by environmental and socioeconomic pressures (Figure 6).
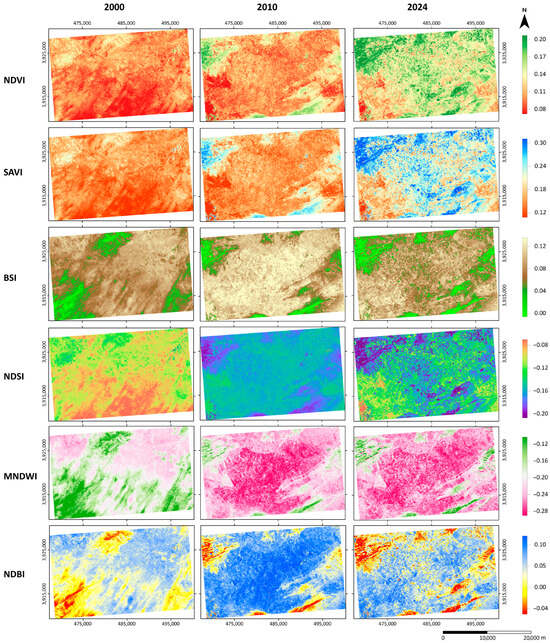
Figure 6.
Spatial distribution of key spectral indices (NDVI, SAVI, BSI, NDSI, MNDWI, and NDBI) in the Zelfen region for the years 2000, 2010 and 2024.
In contrast, soil and salinity indicators, BSI and NDSI, exhibit inverse temporal trends relative to vegetation indices. Elevated BSI values recorded in 2000, particularly concentrated in the northern and southwestern fringes, indicate extensive areas of exposed bare soil associated with degraded pasturelands and limited vegetation cover. These conditions indicate early stages of land degradation, marked by increased susceptibility to erosion and salinization. By 2024, both BSI and NDSI values declined substantially and became spatially restricted to isolated patches, suggesting a reduction in soil exposure and salinization intensity, likely driven by improved land management practices and vegetation recovery (Figure 6).
The MNDWI, an indicator of surface water presence, remained consistently low over the study period, consistent with the region’s semi-arid to arid climatic conditions and limited surface water availability. Nevertheless, subtle localized increases in MNDWI values observed in the eastern-central lowlands in 2010 and 2024 indicate improved water retention associated with small-scale, water-harvesting or land management interventions (Figure 6). Meanwhile, anthropogenic pressure and urbanization patterns are clearly captured by the built-up index (NDBI). A pronounced spatial expansion of built-up areas, especially around the northeastern periphery of urban centers (Figure 6). This pattern aligns with demographic growth and urban expansion, as reflected by a remarkable 546% increase in urban land cover, highlighting the role of urbanization as a persistent driver of land transformation. While the spatial extent of urban growth remains relatively limited compared with agricultural and natural land cover changes, its irreversible nature and concentration around urban cores make it a critical factor to monitor for sustainable land management.
Collectively, the spatio-temporal trends of these spectral indices reveal a complex but discernible trajectory of landscape transformation, characterized by simultaneous processes of degradation, stabilization, and recovery across the Zelfen region.
Table 4 presents a quantitative overview of temporal dynamics through the mean values of spectral indices used for 2000, 2010, and 2024. Vegetation indices (NDVI and SAVI) exhibit a gradual increase over time, indicating slow but steady ecological improvement or land restoration in the study area. Soil and salinity indices (BSI and NDSI) reflect a reduction or stabilization of exposed soil, supporting this trend. In contrast, water availability, represented by MNDWI, remains consistently low, highlighting the persistence of arid to semi-arid conditions. Built-up areas, as indicated by NDBI, show minor temporal fluctuations, suggesting limited urban expansion during the study period.
Table 4.
Mean Values of Spectral Indices in 2000, 2010, and 2024.
3.3. Land Degradation Index Change
The Land Degradation Index (LDI) integrates multiple spectral indices, i.e., vegetation (NDVI, SAVI), soil/salinity (BSI, NDSI), water (MNDWI), and built-up (NDBI), into a composite indicator to assess and monitor land health and degradation dynamics over time.
By integrating various spectral indices, LDI provides a holistic representation of ecosystem functionality and degradation dynamics. Spectral indices capture subtle variations in surface conditions and vegetation vigor, making them essential for detecting early signs of degradation or recovery. In this framework, LDI is an advanced, data-driven approach that tracks changes in land condition over space and time. This integrative use of spectral information within the LDI framework enhances the reliability and resolution of land degradation assessments, particularly in vulnerable and rapidly changing environments. The observed trends provide spatially explicit evidence of both degradation hotspots and areas where recovery processes are detectable, allowing a more granular interpretation than standard national-scale Land Degradation Neutrality reporting.
Between 2000 and 2024, the LDI change detection reveals a clear spatio-temporal transition from zones of degradation to widespread land improvement, strongly correlated with spectral index trends (NDVI, BSI, NDBI) and shifts in land use and land cover, under the influence of climatic constraints. During the 2000–2010 period, moderate-to-severe degradation was prominent in the southwestern and southeastern zones, corresponding to areas characterized by low NDVI values, elevated BSI, indicating reduced vegetation cover and increased bare-soil exposure. This degradation pattern aligns with the sharp decline in pastureland (from 45% to 16%) and pressure on forest margins, likely exacerbated by recurrent drought events and unsustainable agricultural practices.
Conversely, areas in the north-central and northeastern regions exhibited improvement, supported by moderate NDVI increases and land-use conversion to olive and OFI plantations, particularly in elevations between 700 and 1100 m (Figure 7). The subsequent 2010–2024 period shows a marked shift toward moderate-to-significant ecological recovery across large portions of the study area including the central, northern, and even southern zones. This improvement in land status was accompanied by consistent positive trends of spectral indices, such as NDVI and SAVI, indicating vegetative recovery, while BSI and NDBI declined, reflecting reduced bare surfaces and built-up pressure. This ecological restoration corresponds to the expansion of perennial crops and agroecological practices, as evidenced by LULC maps showing a significant increase in olive and cactus areas, coupled with a continued reduction in cereal and rangeland areas. In fact, this transformation is mainly correlated with the expansion of OFI, which is particularly concentrated in the central zones (700–1100 m elevation) and increasingly extending toward the northwestern hills and eastern mid-slopes (Figure 7). This perennial crop not only improves vegetative cover but also contributes to soil stabilization and microclimate regulation (Figure 7). Additionally, the increased resilience of the landscape may be partially attributed to adaptive responses to climate variability and targeted land management interventions.
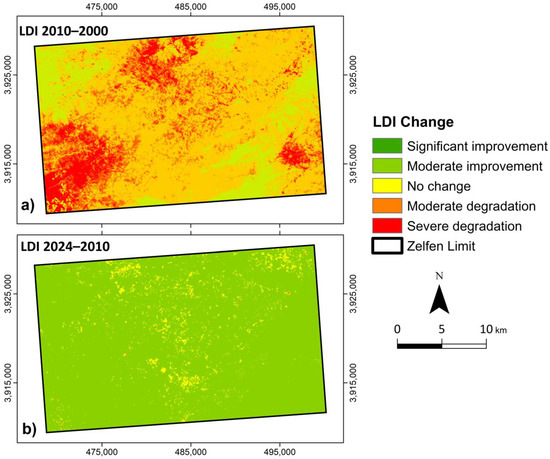
Figure 7.
Land degradation index change (a) between 2000–2010 and (b) 2010–2024.
Finally, integrating spectral indices, LULC dynamics, and elevation data with LDI change detection provides a comprehensive understanding of land transformation processes in a semi-arid context under anthropogenic and climatic influences.
The observed ecological improvements, particularly in areas undergoing significant land cover transformation, underscore the critical role of OFI in landscape restoration. As a drought-tolerant, perennial species with deep rooting systems and efficient water-use strategies, OFI not only enhances vegetation cover but also contributes to soil conservation by reducing soil degradation and erosion. Its widespread expansion in degraded and semi-arid zones, especially between 700 and 1100 m in elevation, highlights its potential as a nature-based solution for combating desertification. Given these ecological benefits and the strong correlation between OFI expansion and improved spectral indices and LDI trends, it becomes essential to conduct a targeted analysis of its spatial dynamics, ecological functions, and potential in long-term land rehabilitation strategies.
3.4. Correlation Analysis Between OFI-NDVI and Topographic Factors
To further evaluate the ecological role of OFI in land restoration, a correlation analysis was conducted between NDVI values of OFI cover and key topographic variables, namely altitude and terrain curvature. This approach aims to identify environmental conditions that favor OFI development and vitality, providing valuable insights into its potential contribution to mitigating land degradation. By linking vegetative vigor (as indicated by NDVI) to spatial terrain factors, this analysis explains the environmental preferences of OFI and its potential contribution to land rehabilitation and productivity under climatic stress.
The analysis of NDVI values specifically associated with OFI reveals a clear upward trend from 2000 to 2024, indicating enhanced vegetation vigor and biomass development in areas dominated by cacti. In 2000, NDVI values ranged from 0.05 to 0.17, reflecting a modest level of vegetative density. By 2010, despite a broader range (−0.14 to 0.37), variability increased, likely due to transitional land use phases and early stages of OFI plantation. In 2024, NDVI values for OFI-covered areas rose significantly, reaching up to 0.4, thereby confirming the maturity and density of OFI stands and their contribution to greenness recovery, especially in previously degraded zones. This progression underlines the cactus plant’s adaptive performance over the 25 years in response to both anthropogenic land-use changes and climatic variability.
Figure 8 illustrates the variation in average NDVI-OFI values across different elevation classes (700–>1100 m) over three time periods (2000, 2010, and 2024), revealing both a clear altitudinal gradient and a temporal increase. NDVI-OFI values generally increase with elevation, with the lowest values consistently recorded in the 700–800 m class (0.096 in 2000, 0.104 in 2010, and 0.117 in 2024) and the highest values above 1100 m (0.077 in 2000, 0.170 in 2010, and 0.180 in 2024). At intermediate altitudes, similar trends are observed, with NDVI-OFI rising from ~0.09–0.10 in 2000 to ~0.10–0.11 in 2010, and peaking between 0.14 and 0.16 in 2024. Over time, NDVI-OFI steadily improved, showing relatively uniform and low values in 2000, moderate increases in 2010 (especially above 1000 m), and the highest values in 2024 across all elevation bands, with the most pronounced rise above 900 m. This combined spatio-temporal pattern highlights two main findings: (i) OFI vegetation health has improved steadily over the last two decades, as reflected by the increasing NDVI values, and (ii) this improvement is more pronounced at higher altitudes, suggesting that elevation plays a buffering role against degradation processes in semi-arid environments. In fact, the results emphasize the ecological resilience and adaptive potential of OFI, particularly in elevated zones where environmental conditions are less restrictive (Figure 8).
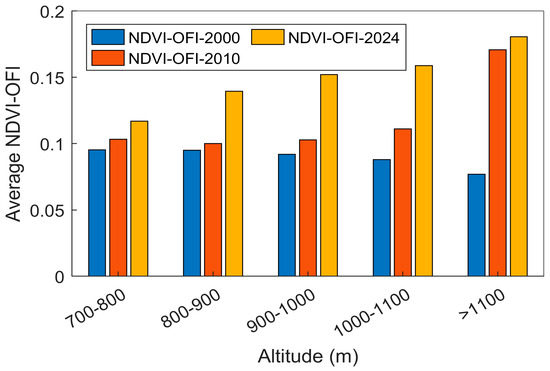
Figure 8.
Altitudinal Variation in NDVI values for OFI in 2000, 2010, and 2024.
To evaluate the statistical significance of the observed vegetation recovery, a multi-stage analysis was performed. A Pearson correlation analysis revealed a strong positive relationship between time and NDVI recovery across all altitudinal gradients, with a weighted average correlation coefficient of r = 0.91. Furthermore, paired t-tests comparing monitoring data from 2000 to 2024 yielded p-values consistently below 0.05 (averaging p = 0.017), confirming that the observed 69.9% increase in mean NDVI is statistically significant and providing quantitative evidence for OFI-driven landscape rehabilitation (Table 5).
Table 5.
Statistical Analysis of NDVI Evolution (2000–2024).
The analysis of terrain curvature and its relationship with the NDVI-OFI in 2024 reveals a clear positive correlation. Average NDVI values increase progressively with terrain convexity: from 0.1 in negatively curved (concave) zones to 0.13 in flat areas, reaching a maximum of 0.17 in positively curved (convex) terrains. This pattern diverges from the typical expectation, where vegetation indices are often higher in concave areas due to enhanced water and nutrient accumulation. Instead, the elevated NDVI in convex zones suggests that OFI not only tolerates but thrives in more exposed, erosion-prone environments. This may be attributed to its physiological adaptations, such as water retention capacity, deep rooting systems, and minimal water demand, which enable it to establish in dry, sloped areas with higher runoff potential. Consequently, this finding reinforces the ecological importance of OFI in land restoration efforts. Its strong presence in convex terrains, typically associated with high erosion risks, highlights its potential to stabilize soils, reduce surface runoff, and prevent further land degradation. The correlation between curvature and NDVI-OFI indicates that this plant serves as a key species in rehabilitating marginal lands and enhancing ecosystem resilience in semi-arid landscapes.
In conclusion, the correlation between NDVI-OFI values and key topographic variables underscores the vital ecological role of OFI in combating land degradation in semi-arid environments. The consistent enhancement of vegetative vigor across both elevation gradients and convex landforms highlights the exceptional ecological adaptability of OFI under climatic stress and edaphic limitations. Its ability to persist and develop in erosion-prone and water-limited environments not only confirms its suitability for severely degraded landscapes but also reinforces its role as an effective natural stabilizer of soils and a catalyst for ecosystem recovery. By enhancing vegetation cover and promoting soil protection in vulnerable zones, OFI serves as an effective, low-cost and sustainable solution for land rehabilitation strategies. Its integration into landscape restoration programs offers promising potential to restore productivity, mitigate erosion and foster long-term ecological resilience in regions affected by desertification and anthropogenic pressure.
4. Discussion
Understanding the complex dynamics of land degradation and ecosystem restoration requires a multi-dimensional approach and integrative analytical framework, capable of combining geospatial observation, environmental indicators and landscape-level evaluation [5]. In this study, multi-temporal satellite imagery, machine learning-based classification and spectral index analysis were jointly applied to investigate LULC changes and vegetation dynamics in the semi-arid Zelfen region between 2000 and 2024. The analysis of land transformations, supported by classification outputs and spectral indices (NDVI, SAVI, BSI, NDSI, MNDWI, NDBI), is contextualized within broader environmental and socio-ecological dynamics. By linking these spatially explicit observations to a composite LDI, the study provides a coherent interpretation of degradation hotspots, recovery trajectories, and adaptive land management strategies under semi-arid Mediterranean conditions. Particular focus is given to OFI, recognized for its resilience and capacity to promote land restoration in erosion-prone and degraded landscapes. This section explores the mechanisms behind degradation hotspots, vegetation recovery and shifting land management practices across the study period by linking spectral trends to elevation and terrain curvature.
The integration of remote sensing indices and LULC classifications over a 25-year period provided crucial insights into the dynamics of land degradation and vegetation transformation in the study area.
4.1. Land-Use Transitions and Drivers of Landscape Change
The analysis reveals a pronounced reconfiguration of land-use patterns, driven by the combined effects of climatic stress, socio-economic change, and adaptive land management. The significant expansion of OFI from approximately 6760 ha in 2000 to more than 30,000 ha in 2024 reflects a strategic shift toward drought-resilient perennial crops. This expansion coincided with the contraction of pasture lands and cereal crops, which can be attributed to multiple interacting drivers: overgrazing reduced pasture productivity, intensive cultivation of cereals on marginal lands led to soil depletion, changes in rural livelihoods and socio-economic changes prompted abandonment or conversion of agricultural plots [47]. Such transitions illustrate a shift from traditional extensive land use systems toward adaptive strategies that mitigate degradation while maintaining some level of productivity [48]. Additionally, the substantial increase in urban areas (>546%) reflects population growth, rural-to-urban migration and infrastructure development, resulting in land sealing and fragmentation of natural habitats, which further exacerbates local degradation and hydrological disruption. Similarly, the expansion of olive plantations (>299%) indicates a trend of agricultural intensification driven by market demand, but also represents a shift toward perennial, deep-rooted crops that can moderately reduce soil erosion compared to annual cereals, although it still contributes to pressure on remaining natural ecosystems. Collectively, these LULC changes reveal a dual narrative: while urbanization and conventional agriculture amplify land degradation, the strategic deployment of OFI demonstrates targeted ecological restoration. In fact, this expansion suggests a growing reliance on perennial, stress-tolerant species in response to land degradation and reduced agricultural productivity. This trend aligns with findings from other Mediterranean countries, where OFI is promoted not only for its drought resilience but also for its role in improving soil structure, increasing organic carbon stocks and supporting local economies through fruit and fodder production [47,49].
4.2. Spectral Evidence of Degradation and Recovery Processes
From a spectral perspective, the combined analysis of vegetation (NDVI, SAVI), soil (BSI), salinity (NDSI), water (MNDWI), and built-up (NDBI) indices revealed distinct trends across the 25-year period from 2000 to 2024, closely mirroring the LULC transitions observed [28]. Vegetation indices exhibited significant enhancement within OFI-dominated areas in the central zones, signaling a robust improvement in vegetation cover and photosynthetic activity. Conversely, built-up and bare soil indices showed expansion in urban and degraded areas, respectively, reflecting continued anthropogenic pressure and residual areas of land degradation. By quantifying these variations over time, spectral indices provide a spatially explicit complement to LDI assessments, enabling the identification of hotspots of degradation as well as areas of ecological recovery. The alignment between LULC changes and spectral trends underscores the diagnostic power of remote-sensing tools for long-term monitoring, particularly in semi-arid environments where field-based observations are often limited [37]. The expansion of OFI, as revealed through enhanced NDVI and SAVI signals, highlights its ecological role in mitigating soil erosion, improving soil moisture retention, and sustaining biomass under conditions of recurrent drought and limited precipitation [28]. Moreover, variations in indices such as MNDWI and NDSI provide insights into changes in soil moisture and surface water availability, reflecting both climate variability and human-driven alterations of the landscape.
4.3. Land Degradation Index as an Integrative Diagnostic Tool
LDI improvement in OFI-dominated areas should be interpreted cautiously, as several concurrent processes may contribute to the observed patterns. In the Zelfen region, fluctuations in seasonal precipitation, olive grove expansion, and recent soil and water conservation programs may influence vegetation productivity and soil stability. These co-occurring drivers preclude attributing LDI trends solely to OFI expansion. While the spatial association is strong, establishing causality requires multivariate statistical approaches and longer-term ecological monitoring, which are recommended for future research. By integrating multiple indices, the study captures complementary dimensions of land degradation and restoration, reinforcing the relevance of spectral metrics for adaptive land management under semi-arid Mediterranean conditions. The major expansion of OFI plantations observed in the study area corresponds to targeted restoration efforts in semi-arid landscapes, a trend consistent with previous findings on the use of OFI for dryland rehabilitation [37,42].
Between 2000 and 2024, LDI change detection and spectral indices reveal a clear transition from degraded areas to widespread land improvement. During 2000–2010, degradation was concentrated in southwestern and southeastern zones, associated with low vegetation cover, increased bare soil, pasture loss and drought impacts, while north-central and northeastern areas showed moderate recovery linked to olive and OFI plantation expansion at mid-elevations (700–1100 m). From 2010 to 2024, a marked shift toward ecological recovery is observed, with moderate to significant improvement across the central, northern, and southern parts of the study area. Positive trends in vegetation indices, including NDVI and SAVI, reflect increased vegetative cover, while declines in BSI and NDBI indicate reduced bare soil exposure and lower urban/built-up pressure. These spectral and LDI-based patterns correspond to the expansion of perennial crops, such as OFI, which is concentrated in central zones and progressively extends to northwestern hills and eastern mid-slopes. In fact, OFI contributes significantly to these improvements through multiple mechanisms. Its dense perennial biomass reduces soil erosion by mitigating raindrop impact and enhancing soil stabilization [37]. The canopy and root system improve soil structure, increase organic matter content, and enhance water infiltration, thereby supporting vegetation recovery [50]. OFI also regulates microclimatic conditions by shading the soil surface, reducing temperature extremes and retaining moisture, which facilitates the establishment of other plant species. The integration of LDI and spectral composites demonstrates their robustness as tools for monitoring land dynamics and detecting early signs of degradation or recovery [51]. Observed spectral trends reflect a dual narrative of ecological degradation alongside targeted restoration efforts, with land use changes, most notably the expansion of drought-resilient OFI, emerging as key drivers of spectral enhancement [51,52]. These findings underscore the value of combining LULC mapping, spectral indices, and LDI in providing a spatially explicit assessment of land degradation and restoration. Such interpretations are consistent with previous studies highlighting OFI’s role in dryland restoration and sustainable land management across Mediterranean regions [50,52,53].
4.4. Topographic Controls on OFI Performance and Restoration Potential
Building on the observed improvements in vegetation cover and LDI trends, as well as the documented role of OFI in enhancing landscape resilience and mitigating land degradation, it is important to consider how these dynamics vary across topographic gradients. Elevation can modulate microclimatic conditions, soil moisture availability, and exposure to climatic stressors, all of which influence the growth and productivity of drought-resilient species like OFI. By examining NDVI-OFI values across elevation classes, it is possible to assess not only the spatial heterogeneity of restoration success but also the interaction between topography, vegetation vigor and land degradation dynamics. In this study, the spatial distribution of OFI was strongly associated with altitudinal gradients and curvature types, indicating that the topographic setting significantly influences land cover dynamics. This work demonstrates a strong positive relationship between NDVI-OFI and elevation, coupled with a clear temporal improvement from 2000 to 2024. NDVI-OFI values increase with elevation. The lowest values are consistently recorded in the 700–800 m class (0.096 in 2000 to 0.117 in 2024), while the highest values occur above 1100 m (0.077 in 2000 to 0.180 in 2024), with intermediate classes showing similar trends. These patterns indicate that higher elevations provide favorable conditions for OFI growth, reinforcing its role in restoring semi-arid land and sustainable landscape management.
This elevation-dependent pattern of vegetative performance is consistent with the physiological insights reported by Nobel [54], who demonstrated that OFI exhibits optimal growth under moderate thermal conditions and adequate water availability. The coherence of current remote sensing-based findings with Nobel’s field-based physiological data reinforces the reliability of using NDVI as a proxy for cactus health and further validates the role of elevation as a key driver in the spatial distribution and restoration potential of OFI in semi-arid Mediterranean environments. In addition, the NDVI response to terrain curvature revealed an unexpected trend: higher NDVI values were observed in convex areas (≈0.17), suggesting that OFI not only tolerates but thrives in erosion-prone, sloped environments [53]. This finding challenges the classical ecological expectation that vegetation tends to favor concave or flat zones due to enhanced water and nutrient accumulation. Instead, OFI’s physiological resilience, including high water-use efficiency and deep root systems, enables it to establish in less favorable topographies, contributing significantly to slope stabilization and erosion control [37]. These findings collectively highlight the essential role of topography in influencing land rehabilitation dynamics. The preferential establishment of OFI in higher and convex terrains not only reflects species-specific ecological preferences but also signals the potential of this cactus to serve as a nature-based solution for restoring marginal lands. Additionally, the integration of remote sensing and topographic modeling has proven particularly effective for identifying degradation hotspots and highlighting areas for prioritizing OFI interventions. In addition, while our results highlight the strong rehabilitation potential of OFI within the degraded semi-arid landscapes of Tunisia, it is crucial to consider its broader ecological footprint. In various global contexts, particularly in parts of South Africa, Australia, and Madagascar, certain Opuntia species have demonstrated significant invasive behavior, outcompeted native flora and altering ecosystem functions. This suggests that the ecological impact of OFI is highly context-dependent. Consequently, while we recommend OFI as a viable nature-based solution for North African soil conservation, its application in other regions must be preceded by site-specific risk assessments and the establishment of long-term monitoring frameworks to prevent unintended environmental consequences.
4.5. Implications, Limitations and Transferability
While the proposed framework demonstrates high accuracy in the Tunisian context, its global scalability is subject to both ecological and technical considerations. Ecologically, while OFI is a potent tool for rehabilitation in North Africa, its invasive history in other regions necessitates a cautious, context-dependent approach. Future upscaling must be preceded by site-specific risk assessments to ensure that introducing this nature-based solution does not compromise local biodiversity.
Furthermore, several technical sources of uncertainty must be considered. First, the use of a long-term time series spanning multiple Landsat missions introduces potential sensor-related biases; despite cross-calibration efforts, slight variations in spectral response functions can influence trend analysis. Second, the 30 m spatial resolution leads to mixed pixel effects in heterogeneous landscapes, where young OFI stands may be spectrally masked by the soil background. This can result in delayed detection of establishment and an overestimation of vegetative resilience, as NDVI recovery may appear more rapid or pronounced than actually occurring at the sub-pixel level. To address this uncertainty, future studies should integrate very high-resolution remote sensing data, such as Sentinel-2 (10 m), to improve early-stage detection, validate spectral trends and reduce estimation bias in restored vegetation monitoring.
The combined findings reveal a dual narrative of persistent degradation in some zones and targeted recovery in others, emphasizing the critical role of drought-resilient species in land management strategies. These results provide actionable insights for land degradation monitoring, adaptive restoration planning, and the sustainable management of semi-arid landscapes. They also highlight the value of integrating remote sensing, ecological indicators, and socio-environmental context to support evidence-based decision-making. Finally, this study contributes to the growing body of literature on dryland rehabilitation and provides a model for combining satellite-based monitoring with ecological assessments to inform restoration strategies. The outcomes underscore the importance of incorporating indigenous, drought-resistant species into sustainable land use planning.
5. Conclusions
This study provided a comprehensive spatio-temporal assessment of land use/land cover dynamics and land degradation processes in a semi-arid Mediterranean catchment between 2000 and 2024, with particular focus on the expansion and ecological role of OFI. The LULC classification using the SVM algorithm revealed a major shift in land occupation patterns, with pasture areas dramatically declining from 45% to less than 4% of the total studied area, a loss of over 91%, while OFI areas increased by more than 350% (from 6759 ha to 30,494 ha), especially in central zones of the study area. Urban zones also expanded significantly (+546%), indicating increasing anthropogenic pressure. Concurrently, NDVI values associated with OFI increased markedly, from 0.05–0.17 in 2000 to 0.4–0.48 in 2024, indicating enhanced vegetative health and productivity. Spectral index analysis revealed consistent degradation trends in bare soil and salinity indices (BSI, NDSI), especially in areas that lost vegetative cover. Conversely, vegetation indices (NDVI, SAVI) improved in OFI-dominated zones, highlighting their restorative capacity. Time-series change detection using the LDI confirmed that areas previously classified as degraded have shown progressive improvement since OFI was introduced, notably at elevations from 700 to more than 1100 m.
The results indicate variations in average NDVI-OFI values across elevation classes (from 700 to above 1100 m) over the three study periods (2000, 2010 and 2024), with a well-defined altitudinal gradient and a pronounced temporal progression. This indicates that vegetative vigor, as measured by NDVI, consistently increases with altitude. Specifically, areas above 1100 m demonstrated the highest NDVI values (0.18 in 2024 compared to 0.07 in 2000), suggesting that these higher-elevation zones offer more favorable microclimatic and edaphic conditions for OFI development. Furthermore, the analysis of terrain curvature showed a progressive increase in NDVI values from concave (0.1) to flat (0.13) and convex areas (0.17). This trend is particularly noteworthy, as it deviates from typical patterns in which vegetation is generally more vigorous in concave landforms due to greater water and nutrient accumulation. The enhanced NDVI values in convex terrains, typically associated with runoff and erosion risks, suggest that OFI not only tolerates but also develops in these more challenging environments. This exceptional performance may be attributed to its physiological adaptations, such as deep root systems, high water use efficiency and the ability to thrive in nutrient-poor, sloping soils. OFI expansion coincides with areas showing LDI improvement and may contribute to enhanced vegetation stability, although other environmental and management factors must also be considered.
Collectively, these findings highlight OFI’s ecological resilience and underscore its potential role as a natural engineer in stabilizing vulnerable landscapes, reducing erosion, and contributing to sustainable land management in semi-arid and mountainous Mediterranean regions. Importantly, this study demonstrates the utility of geospatial and remote-sensing approaches as cost-effective tools for monitoring land degradation and guiding restoration strategies in data-scarce Mediterranean drylands. It underscores the value of OFI as a nature-based solution, highlighting its topographic preferences, resilience, and soil-stabilizing properties. The findings offer a reference for policymakers seeking adaptive strategies to combat desertification using climate-resilient species and advanced earth observation.
However, to ensure long-term sustainability, the vulnerability of relying on a single species must be addressed. A pest or pathogen outbreak could jeopardize widespread OFI plantations, potentially reversing decades of restoration gains. In this context, the geospatial technologies, particularly high-resolution satellite time series and predictive modeling, offer powerful tools for assessing both actual and future risk scenarios. By integrating early warning systems based on vegetation health indicators (e.g., NDVI), land managers can detect pre-visual stress signals and implement timely interventions to contain outbreaks before they propagate.
Beyond technological monitoring, sustainability also requires diversifying planted species and promoting intercropping systems that pair OFI with native shrubs, forage species, or drought-tolerant legumes. Such associations enhance biodiversity, improve soil fertility, and reduce pest pressure. However, the adoption of these practices depends critically on the active involvement of local farming communities. A dedicated effort to vulgarize intercropping techniques is essential to ensure that scientific advances translate into lasting landscape transformation. This must be supported by continued investment in interdisciplinary research projects that couple agronomy, ecology, and remote sensing, and co-develop adaptive management strategies with local stakeholders.
In conclusion, the integration of OFI into Mediterranean dryland restoration offers a promising pathway toward landscape rehabilitation, provided that it is combined with geospatial risk assessment, species diversification, and adaptive management. When combined with geospatial risk assessment, diversified intercropping, farmer-centered outreach and sustained research support, OFI can contribute meaningfully to climate-resilient, ecologically sustainable, and socially inclusive land management strategies in Mediterranean drylands.
Author Contributions
Conceptualization, T.H. and F.J.; methodology, T.H. and F.J.; software, T.H. and F.J.; validation, T.H., L.T. and V.A.; formal analysis, T.H. and F.J.; investigation, T.H. and F.J.; resources, T.H. and F.J.; data curation, F.J.; writing—original draft preparation, F.J.; writing—review and editing, T.H., M.L.K., M.C., C.D.L., S.D., L.T., A.S., S.Y. and M.A.B.A.; visualization, T.H. and F.J.; supervision, T.H.; project administration, T.H.; funding acquisition, T.H. and V.A. All authors have read and agreed to the published version of the manuscript.
Funding
This research was funded by the VENUS project-PRIMA programme (Grant Agreement number: 2312) supported by the European Union’s Horizon 2020 research and innovation programme.
Data Availability Statement
The data cannot be shared because they are in priority of INRGREF.
Acknowledgments
The authors thank the VENUS project for funding this research. This work is part of the PRIMA programme supported by the European Union’s Horizon 2020 research and innovation programme. Grant Agreement number: 2312, VENUS project.
Conflicts of Interest
The authors declare no conflicts of interest.
Abbreviations
The following abbreviations are used in this manuscript:
| OFI | Opuntia ficus-indica |
| LULC | Land use land cover |
| LDI | Land Degradation Index |
| GIS | Geographic Information Systems |
| NDVI | Normalized Difference Vegetation Index |
| SAVI | Soil-Adjusted Vegetation Index |
| BSI | Bare Soil Index |
| NDSI | Normalized Difference Salinity Index |
| MNDWI | Modified Normalized Difference Water Index |
| NDBI | Normalized Difference Built-up Index |
References
- Worqlul, A.W.; Haddad, M.; Alemayehu, S.; Govind, A. Developing a satellite-based combined land degradation index for monitoring environmental change: A case study in Tana-Beles watershed, Upper Blue Nile, Ethiopia. Remote Sens. Appl. Soc. Environ. 2023, 32, 101050. [Google Scholar] [CrossRef]
- IPBES. Summary for Policymakers of the Assessment Report on Land Degradation and Restoration; Scholes, R., Ed.; IPBES Secretariat: Bonn, Germany, 2018. [Google Scholar]
- Nait-Taleb, O.; Elomari, S.; Abdelrahman, K.; Ismaili, M.; Fnais, M.S.; El Atiq, J.; Ouchkir, I.; Karaoui, I.; Krimissa, S.; Namous, M.; et al. Monitoring soil degradation using Sentinel-2 imagery and statistical analysis of spectral indices in a semi-arid watershed of the Moroccan High Atlas. Front. Soil Sci. 2025, 5, 1553887. [Google Scholar] [CrossRef]
- Ali, E.A.; Elnagar, A.S.; Rebouh, N.Y.; Fadl, M.E. Assessing Land Degradation Through Remote Sensing and Geospatial Techniques for Sustainable Development Under the Mediterranean Conditions. Sustainability 2025, 17, 6087. [Google Scholar] [CrossRef]
- Tariq, A.; Sardans, J.; Zeng, F.; Graciano, C.; Hughes, A.C.; Ullah, A.; Ali, S.; Oláh, V.; Gao, Y.; Peñuelas, J. Guardians of arid lands: Deep-rooted defense against desertification and climate change. Trends Plant Sci. 2025. online ahead of print. [Google Scholar] [CrossRef]
- Benrhouma, A.; Hermassi, T.; Jarray, F.; Bouajila, K.; Mechri, M.; Aouissi, J.; Kotti, M.L.; Attia, R. Soil erosion assessment using SWAT in relation with land use, agricultural practices, and future climate change in a semi-arid catchment in Tunisia. Environ. Res. Commun. 2024, 6, 105028. [Google Scholar] [CrossRef]
- Dimobe, K.; Gessner, U.; Ouédraogo, K.; Thiombiano, A. Trends and drivers of land use/cover change in W National Park in Burkina Faso. Environ. Dev. 2022, 44, 100768. [Google Scholar] [CrossRef]
- Bhunia, G.S.; Chatterjee, U.; Shit, P.K.; Kashyap, A. Wasteland reclamation and geospatial solution: Existing scenario and future strategy. In Land Reclamation and Restoration Strategies for Sustainable Development; Academic Press: Cambridge, MA, USA, 2021; Volume 10, pp. 87–113. [Google Scholar]
- Piao, T.; Shi, H. Consequences of Land Degradation Under Climate Stress in Northern China: Linking Agriculture, Water, and Rural Development. Land Degrad. Dev. 2025, 36, 899–915. [Google Scholar] [CrossRef]
- Dimobe, K.; Ouédraogo, A.; Soma, S.; Goetze, D.; Porembski, S.; Thiombiano, A. Identification of driving factors of land degradation and deforestation in the wildlife reserve of Bontioli. Glob. Ecol. Conserv. 2015, 4, 559–571. [Google Scholar] [CrossRef]
- Ontel, I.; Cheval, S.; Irimescu, A.; Boldeanu, G.; Amihaesei, V.A.; Mihailescu, D.; Nertan, A.; Angearu, C.V.; Craciunescu, V. Assessing recent trends of land degradation and desertification in Romania using remote sensing indicators. Remote Sens. 2023, 15, 4842. [Google Scholar] [CrossRef]
- Charalampopoulos, I.; Droulia, F. Climate Evolution of Agricultural and Natural Areas of Southeastern Europe According to Pinna, Johansson and Kerner Climate Indices. Climate 2025, 13, 121. [Google Scholar] [CrossRef]
- Jaagus, J.; Aasa, A.; Aniskevich, S.; Boincean, B.; Bojariu, R.; Briede, A.; Danilovich, I.; de Castro, F.; Dumitrescu, A.; Labuda, M. Long-term changes in drought indices in Eastern and Central Europe. Int. J. Climatol. 2022, 42, 225–249. [Google Scholar] [CrossRef]
- Alencar, P.H.L.; Paton, E.N. Which droughts are becoming more frequent? A copula entropy analysis on the return period of droughts in Europe. Nat. Hazards 2025, 121, 543–565. [Google Scholar] [CrossRef]
- Nagavciuc, V.; Scholz, P.; Ionita, M. Hotspots for warm and dry summers in Romania. Nat. Hazards Earth Syst. Sci. 2022, 22, 1347–1369. [Google Scholar] [CrossRef]
- Fensholt, R.; Langanke, T.; Rasmussen, K.; Reenberg, A.; Prince, S.D.; Tucker, C.; Scholes, R.J.; Le, Q.B.; Bondeau, A.; Eastman, R. Greenness in semi-arid areas across the globe 1981–2007. Remote Sens. Environ. 2012, 121, 144–158. [Google Scholar] [CrossRef]
- Salih, A.; Hassaballa, A.A. Quantitative assessment of land sensitivity to desertification in Central Sudan. In Applications of Space Techniques on Natural Hazards in the MENA Region; Springer: Cham, Switzerland, 2022. [Google Scholar]
- Kaliraj, S.; Chandrasekar, N.; Parmar, M.; Rejith, R.G.; Dharumarajan, S.; Lalitha, M.; Chandramohan, K. Assessment of land degradation vulnerability in southern India using MEDALUS. In Remote Sensing of Soils; Elsevier: Amsterdam, The Netherlands, 2024; pp. 591–608. [Google Scholar]
- Terán-Gómez, V.F.; Buitrago-Ramírez, A.M.; Echeverri-Sánchez, A.F.; Figueroa-Casas, A.; Benavides-Bolaños, J.A. Integrating AHP and GIS for Sustainable Surface Water Planning: Identifying Vulnerability to Agricultural Diffuse Pollution in the Guachal River Watershed. Sustainability 2025, 17, 4130. [Google Scholar] [CrossRef]
- Macedo, T.H.J.; Tagliaferre, C.; da Silva, B.L.; de Paula, A.; Lemos, O.L.; Rocha, A.; Pinheiro, R.G.S.; Lima, A.C.S. Assessment of land desertification in the Brazilian East Atlantic region using MEDALUS and GEE. Land 2023, 13, 31. [Google Scholar] [CrossRef]
- Ogbue, C.; Igboeli, E.; Ajaero, C.; Ochege, F.U.; Yahaya, I.I.; Yeneayehu, F.; You, Y.; Wang, Y. Remote sensing analysis of desert-sensitive areas using MEDALUS in the Niger River Basin. Ecol. Indic. 2024, 158, 111404. [Google Scholar] [CrossRef]
- Hermassi, T.; Jarray, F.; Tlili, W.; Achour, I.; Mechergui, M. Integrative hydrologic modelling of soil and water conservation strategies. Front. Water 2025, 7, 1521812. [Google Scholar] [CrossRef]
- Jarray, F.; Hermassi, T.; Mechergui, M.; Zucca, C.; Le, Q.B. Long-term impact of soil and water conservation measures on soil erosion. Land 2023, 12, 1537. [Google Scholar] [CrossRef]
- Jafari, R.; Bakhshandehmehr, L. Quantitative mapping of environmentally sensitive areas to desertification in central Iran. Land Degrad. Dev. 2016, 27, 108–119. [Google Scholar] [CrossRef]
- Zhao, C.; Pan, Y.; Zhu, X.; Li, L.; Xia, X.; Ren, S.; Gao, Y. Monitoring deforestation events using Sentinel-1 radar data. Front. For. Glob. Change 2023, 6, 1257806. [Google Scholar] [CrossRef]
- Wang, Q.F.; Qi, J.Y.; Qiu, H.; Li, J.; Cole, J.; Waldhoff, S.; Zhang, X.S. Future soil erosion influenced by freeze–thaw cycles. Environ. Sci. Technol. 2021, 55, 9905–9915. [Google Scholar] [CrossRef]
- Pang, J.; Wang, M.; Zhang, H.; Dong, L.; Li, J.; Ding, Y.; Zhu, Z.; Yan, F. Study on the driving mechanism of spatio-temporal non-stationarity of vegetation dynamics in the Taihangshan-Yanshan Region. Ecol. Indic. 2025, 170, 113084. [Google Scholar] [CrossRef]
- Jarray, F.; Hermassi, T.; Kotti, M.L.; Mechergui, M. Soil erosion risk assessment using modeling and spectral indices. J. Indian Soc. Remote Sens. 2024, 52, 1611–1621. [Google Scholar] [CrossRef]
- Li, H.; Zhou, B.; Xu, F. Variation analysis of spectral characteristics of reclamation vegetation. IEEE Trans. Geosci. Remote Sens. 2022, 60, 4408412. [Google Scholar]
- Da Silva, V.S.; Salami, G.; da Silva, M.I.O.; Silva, E.A.; Monteiro Junior, J.J.; Alba, E. Methodological evaluation of vegetation indexes in LULC classification. Geol. Ecol. Landsc. 2020, 4, 159–169. [Google Scholar]
- Pérez, C.C.; Olthoff, A.E.; Hernandez-Trejo, H.; Rullan-Silva, C.D. Spectral indices for burned areas in tropical wetlands. Remote Sens. Appl. Soc. Environ. 2022, 25, 100664. [Google Scholar]
- Ji, J.; Xu, M.; Wang, S.; Cao, C.; Zhang, X.; Tian, F.; Zheng, J.; Sang, Y. Analysis of spatial pattern of vegetation resilience and influencing factors in Hubei Province based on long time series remote sensing data. Environ. Sustain. Indic. 2025, 27, 100742. [Google Scholar] [CrossRef]
- Khan, N.M.; Rastoskuev, V.V.; Shalina, E.V.; Sato, Y. Mapping salt-affected soils using remote sensing indicators. Proc. Asian Conf. Remote Sens. 2001, 22, 5–9. [Google Scholar]
- Szabo, S.; Gácsi, Z.; Balazs, B. Features of NDVI, NDWI and MNDWI in land cover categories. Landsc. Environ. 2016, 10, 194–202. [Google Scholar] [CrossRef]
- Degerli, B.; Çetin, M. Effect of NDVI–NDBI on land surface temperature. Turk. J. Agric. Food Sci. Technol. 2022, 10, 2446–2452. [Google Scholar]
- Hassen, W.; Alibi, S.; Hassen, A.; Ben Mansour, H. Quality assessment of cactus fruit vinegar. J. New Sci. 2022, 89, 5. [Google Scholar]
- Iqbal, M.A.; Hamid, A.; Imtiaz, H.; Rizwan, M.; Imran, M.; Sheikh, U.A.A.; Saira, I. Cactus pear for food security under changing climate. Planta Daninha 2020, 38, e020191761. [Google Scholar] [CrossRef]
- Zhang, W.; Brandt, M.; Wang, Q.; Prishchepov, A.V.; Tucker, C.J.; Li, Y.; Lyu, H.; Fensholt, R. Mapping woody plants using Sentinel data. Remote Sens. Environ. 2019, 234, 111465. [Google Scholar] [CrossRef]
- Hermassi, T.; Kotti, M.L.; Jarray, F. Soil erosion over 40 years in central Tunisia. Appl. Sci. 2023, 13, 11641. [Google Scholar] [CrossRef]
- Mather, P.M. Computer Processing of Remotely-Sensed Images, 2nd ed.; Wiley: Chichester, UK, 1999. [Google Scholar]
- Zhou, M.; Li, D.; Liao, K.; Lu, D. Landsat time-series vegetation indices for change detection. Int. J. Digit. Earth 2023, 16, 1276–1299. [Google Scholar] [CrossRef]
- Martín-Sotoca, J.J.; Saa-Requejo, A.; Borondo, J.; Tarquis, M. Singularity maps applied to vegetation indices. Biosyst. Eng. 2018, 168, 42–53. [Google Scholar] [CrossRef]
- Huete, A.R. A soil-adjusted vegetation index (SAVI). Remote Sens. Environ. 1988, 25, 295–309. [Google Scholar] [CrossRef]
- Hong, S.H.; Hendrickx, J.M.H.; Borchers, B. Down-scaling SEBAL evapotranspiration maps. Int. J. Remote Sens. 2011, 32, 6457–6477. [Google Scholar] [CrossRef]
- Xu, H. Modification of normalized difference water index. Int. J. Remote Sens. 2006, 27, 3025–3033. [Google Scholar] [CrossRef]
- Nguyen, C.T.; Chidthaisong, A.; Kieu Diem, P.; Huo, L.Z. Modified bare soil index for fallow-period mapping. Land 2021, 10, 231. [Google Scholar] [CrossRef]
- Inglese, P.; Mondragon, C.; Nefzaoui, A.; Saenz, C. Crop Ecology, Cultivation and Uses of Cactus Pear; FAO: Rome, Italy, 2017. [Google Scholar]
- Barbier, E.B.; Hochard, J.P. Does land degradation increase poverty? PLoS ONE 2016, 11, e0152973. [Google Scholar] [CrossRef] [PubMed]
- Nefzaoui, A.; Louhaichi, M.; Ben Salem, H. Cactus as a tool to combat desertification. J. Arid Land Stud. 2014, 24, 121–127. [Google Scholar]
- Novoa, A.; Flepu, V.; Boatwright, J.S. Spinelessness in cactus pear cultivars. J. Arid Environ. 2019, 160, 11–16. [Google Scholar] [CrossRef]
- Badapalli, P.K.; Nakkala, A.B.; Gugulothu, S. Dynamic land degradation assessment using machine learning. Earth Syst. Environ. 2025, 9, 315–335. [Google Scholar] [CrossRef]
- Wang, J.; Zhen, J.; Hu, W.; Chen, S.; Lizaga, I.; Zeraatpisheh, M.; Yang, X. Remote sensing of soil degradation. Int. Soil Water Conserv. Res. 2023, 11, 429–454. [Google Scholar] [CrossRef]
- Genin, M.; Alifriqui, M.; Fakhech, A.; Hafidi, M.; Lahcen, O.; Genin, D. Prickly pear cultivation and argan regeneration. Silva Fenn. 2017, 51, 1618. [Google Scholar]
- Nobel, P.S. Cacti: Biology and Uses; University of California Press: Berkeley, CA, USA, 2002; p. 291. [Google Scholar]


Disclaimer/Publisher’s Note: The statements, opinions and data contained in all publications are solely those of the individual author(s) and contributor(s) and not of MDPI and/or the editor(s). MDPI and/or the editor(s) disclaim responsibility for any injury to people or property resulting from any ideas, methods, instructions or products referred to in the content. |
© 2026 by the authors. Licensee MDPI, Basel, Switzerland. This article is an open access article distributed under the terms and conditions of the Creative Commons Attribution (CC BY) license.