Highlights
What are the main findings?
- We proposed a method integrating morphological operations on raster imagery and vector point density information to eliminate misclassified pixels and outliers for optimizing the original data.
- We introduced a density-based hierarchical scheme using the alpha-shape algorithm (α = 0.02 and α = 0.006) for precise contour identification of both dense and sparse Populus euphratica areas.
What are the implications of the main findings?
- The study demonstrated that Gaussian filtering outperformed other smoothing algorithms in refining distribution outlines, effectively reducing the “saw-tooth phenomenon.”
- We established an automated technical framework integrating multi-source data, density-based outlier removal, and morphological processing for vector mapping of desert vegetation distribution.
Abstract
Populus euphratica is a key constructive species in desert ecosystems and plays a vital role in maintaining their stability. However, effective automated methods for accurately delineating its distribution outlines are currently lacking. This study used the mainstream area of the Tarim River as a case study and proposed a technical solution for identifying the distribution outline of Populus euphratica using multi-source thematic classification data. First, cropland thematic data were used to optimize the accuracy of the Populus euphratica classification raster data. Discrete points were removed based on density to reduce their impact on boundary identification. Then, a hierarchical identification scheme was constructed using the alpha-shape algorithm to identify the boundaries of high- and low-density Populus euphratica distribution areas separately. Finally, the outlines of the Populus euphratica distribution polygons were smoothed, and the final distribution outline data were obtained after spatial merging. The results showed the following: (1) Applying a closing operation to the cropland thematic classification data to obtain the distribution range of shelterbelts effectively eliminated misclassified pixels. Using the kd-tree algorithm to remove sparse discrete points based on density, with a removal ratio of 5%, helped suppress the interference of outlier point sets on the Populus euphratica outline identification. (2) Constructing a hierarchical identification scheme based on differences in Populus euphratica density is critical for accurately delineating its distribution contours. Using the alpha-shape algorithm with parameters set to α = 0.02 and α = 0.006, the reconstructed geometries effectively covered both densely and sparsely distributed Populus euphratica areas. (3) In the morphological processing stage, a combination of three methods—Gaussian filtering, equidistant expansion, and gap filling—effectively ensured the accuracy of the Populus euphratica outline. Among the various smoothing algorithms, Gaussian filtering yielded the best results. The equidistant expansion method reduced the impact of elongated cavities, thereby contributing to boundary accuracy. This study enhances the automation of Populus euphratica vector data mapping and holds significant value for the scientific management and research of desert vegetation.
1. Introduction
Populus euphratica is a unique tree species in desert ecosystems and a Tertiary relict plant. It is drought-resistant and salt-tolerant and is the only arborescent species capable of forming natural forests in desert regions. It is listed as a Class II Endangered Protected Species in China and identified by the FAO as one of the most urgently prioritized forest genetic resources for conservation. Xinjiang is the region with the world’s highest density of Populus euphratica; approximately 60% of the global Populus euphratica population is found in China, and about 90% of China’s Populus euphratica is distributed in Xinjiang. Populus euphratica plays a crucial role in maintaining the stability of oasis ecosystems and is known as a “natural barrier” for oasis protection. It provides multiple ecological services, such as water conservation, windbreak and sand fixation, soil retention, and microclimate regulation [1,2]. It also plays an irreplaceable role in maintaining material and energy balance, inhibiting soil salinization, improving desert ecosystems, and curbing desertification [3,4,5,6]. Sustainable management of Populus euphratica forests is directly linked to regional ecological security.
Mapping the spatial patterns of Populus euphratica is essential for the effective protection of natural forests [6]. The conservation of forest resources requires precise location information as a basic prerequisite. Vegetation maps are specialized cartographic products that represent vegetation types and their spatial distributions, providing essential references for scientific research and the sustainable management of vegetation [7,8]. The distribution of Populus euphratica is characterized by harsh environments, poor accessibility, discrete spatial patterns, and a high proportion of sparse forests. Natural patches of Populus euphratica often cover extensive spatial ranges. Plot survey methods are inadequate for determining the distribution boundaries and extent of Populus euphratica. Therefore, remote sensing-based mapping of its distribution is an essential foundational task for protecting natural Populus euphratica forests.
Vector data are an important format for recording plant distributions and are commonly used for spatial computation and analysis [9,10,11,12,13]. Among these, the shapefile format is widely used in disciplines such as forestry, ecology, and environmental science owing to its excellent geometric representation capabilities [12,14,15]. In studies related to vegetation distribution, its advantages are mainly reflected in the following aspects. First, shapefiles can accurately represent geometric characteristics such as object location, boundaries, distribution patterns, density, and centroid. Second, shapefiles can record detailed vegetation attributes such as species, health status, and habitat characteristics. Third, shapefiles are lightweight and can be used directly for spatial operations and analyses. Although raster classification data can provide basic information on plant distribution, they cannot directly provide geometric parameters such as boundaries and density. By contrast, vector data can precisely represent the geometric information of plant distributions, which is particularly important for the sustainable management of plant resources. Therefore, many research teams use vector data formats to produce and publish vegetation distribution results [16,17,18,19].
Advances in remote sensing technology have propelled the development of vegetation mapping and enhanced its efficiency [20,21,22]. However, there are certain shortcomings in mapping vector data for vegetation distribution. These shortcomings are specifically manifested as follows. (1) The automation level of the mapping methods is relatively low. Currently, vector data on vegetation distribution rely primarily on high-resolution remote sensing imagery and thematic remote sensing products as base maps, employing visual interpretation to manually delineate vegetation distribution patches. However, this approach cannot meet the demands of large-scale mapping applications because of its low efficiency and poor timeliness [8,19]. (2) The data sources are limited, reducing the accuracy of the vector data. The classification accuracy of raster data directly determines the precision of vector data. Generating vector data based on a single remote sensing classification dataset means that if the original classification accuracy is limited, it directly affects the accuracy of the vector data delineation. (3) Manual vector data delineation inadequately exploits spatial information. Manual interpretation mainly depends on the experience of the cartographer and does not fully utilize spatial characteristic information on vegetation distribution, making it difficult to accurately depict vegetation distribution contours [14,22].
Rapid, accurate, and automated generation of vector-formatted distribution data for Populus euphratica remains a challenge in distribution mapping [4,5,6,23,24]. Multi-source thematic remote sensing data products offer new solutions for vegetation distribution mapping [22]. With continuous innovation and the development of machine-learning and deep-learning algorithms, various thematic classification datasets have rapidly advanced [25,26,27]. In recent years, researchers have released large amounts of thematic classification data with continuously improving accuracy [28,29,30]. These thematic classification products feature well-developed classification systems and provide more detailed land-cover divisions [27,31,32,33]. They also offer advantages such as high accuracy, high resolution, timeliness, and broad coverage (at national and global scales) [34]. Multi-source, high-precision classification datasets often complement and validate each other. Leveraging the complementary strengths of multi-source thematic classification data can enhance the accuracy of Populus euphratica classification, mitigate deficiencies arising from single-classification methods or data sources, and provide important references for thematic mapping of Populus euphratica vegetation.
In light of the above, to rapidly and accurately extract the distribution contours of Populus euphratica, we developed a technical framework for automatically mapping its spatial distribution using multi-source remote sensing classification data. (1) First, cropland data is utilized to extract the extent of farmland shelterbelts through morphological closing operations, and a mask is applied to remove misclassified pixels in the Populus euphratica classification, thereby enhancing data accuracy. (2) Second, raster data are converted to vector points, and outliers are eliminated based on the kd-tree and density analysis. (3) Subsequently, the alpha-shape algorithm is employed for hierarchical contour identification, with different parameters set for high- and low-density areas to extract boundaries separately. (4) Finally, morphological processing such as Gaussian filtering for smoothing, equidistant outward expansion and merging, and void filling is applied to optimize the geometric shape of the contours, generating the final vector distribution map of Populus euphratica. This framework improves the automation level of Populus euphratica mapping and demonstrates good accuracy, providing a useful reference for desert vegetation management.
2. Study Area and Data
2.1. Study Area
This study focused on the mainstream area of the Tarim River (Figure 1). Located in Xinjiang, China, the mainstream area of the Tarim River spans geographical coordinates from 80.75° E to 88.58° E and 38.99° N to 41.53° N. It stretches 2179 km in length and covers an area of approximately 36,336 km2 [5]. The Tarim River is the fifth-largest inland river in the world and the largest in China. Over the past two decades, the Chinese government has implemented ecological water-diversion projects to conserve and restore natural Populus euphratica forests [35,36].
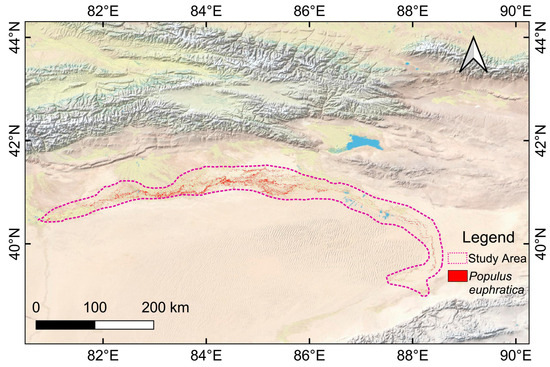
Figure 1.
Location of the study area. The purple dashed line indicates the extent of the study area, and the red dots represents the Populus euphratica pixels.
2.2. Data Sources
2.2.1. Populus euphratica Distribution Raster Data
Zou et al. [5] generated distribution data for Populus euphratica in the Tarim River Basin (as binary raster data) using Sentinel-1 and Sentinel-2 imagery combined with phenological parameters and a random forest algorithm on the Google Earth Engine (GEE) platform. The dataset has a spatial resolution of 10 m and an overall classification accuracy of 0.96.
2.2.2. Cropland Distribution Data
Qiu et al. [37] produced cropland distribution data for China using Sentinel-1 (S1) SAR and Sentinel-2 (S2) MSI imagery. This dataset provides a high-accuracy source for cropland distribution, with a resolution of 10 m and an overall accuracy of 90.88%. In this study, it was used as auxiliary data.
3. Methodology
Based on the binary classification raster images of Populus euphratica in the mainstream area of the Tarim River as the primary data, and using cropland classification data as auxiliary data, the alpha-shape algorithm was employed to identify the vector boundaries of the distribution of Populus euphratica. Subsequently, morphological processing was performed on the contour geometries, and vector boundary mapping of the Populus euphratica distribution was completed (Figure 2).
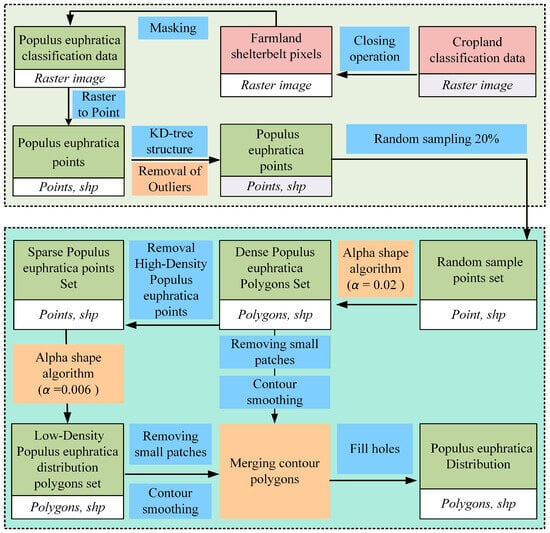
Figure 2.
Technical flowchart of the study.
3.1. Populus euphratica Classification Data Processing
The original Populus euphratica raster classification data were cleaned. First, a morphological closing operation was performed on the cropland classification data to obtain the spatial distribution of farmland shelterbelts. Then, the farmland shelterbelt distribution data were used as a mask to remove misclassified pixels from the Populus euphratica classification data, thereby further improving classification accuracy.
3.1.1. Preprocessing of Cropland Distribution Data
Misclassified pixels primarily originated from farmland shelterbelts. Currently, thematic classification data for farmland shelterbelts are not available. The spatial distribution of farmland shelterbelts was extracted from cropland data published by Qiu et al. [37]. The specific steps were as follows:
- Image Projection Conversion: The projection of the cropland image was converted to geographically align the cropland classification data with the Populus euphratica classification data.
- Image Morphological Processing: A closing operation was applied to the cropland classification images. Tests showed that setting a dilation kernel size of 25 and an erosion kernel size of 29 effectively extracted the distribution range of farmland shelterbelts.
3.1.2. Masking Processing
After morphological processing, the cropland classification data included farmland-shelterbelt pixels. These cropland data (containing shelterbelts) were used to mask the Populus euphratica classification data by removing farmland shelterbelt pixels.
3.2. Removal of Outlier Populus euphratica Points
- (1)
- The kernel size was set to 19 to filter fragmented pixels in the Populus euphratica classification data, reducing the adverse impact of isolated Populus euphratica points on boundary identification.
- (2)
- The refined Populus euphratica classification raster data were converted into a vector point file in SHP format, with the projection set to UTM Universal Transverse Mercator (EPSG: 32644).
- (3)
- Because of the large number of Populus euphratica points, which entails a significant computational load, the study employed a kd-tree for nearest-neighbor search. A search radius of 500 m was set to count the number of Populus euphratica points within a 500 m radius for each point, and density was calculated. The points were then sorted by density, and the lowest 5% of low-density points were removed.
3.3. Identifying the Boundary Contour of the Populus euphratica Distribution
An alpha-shape algorithm was used to identify the Populus euphratica distribution boundary. The alpha-shape algorithm is a geometric method used to construct shape boundaries from discrete point sets [38]. This method controls contour morphology by adjusting the parameter alpha (α) and is suitable for reconstructing irregular boundaries [39,40,41].
Given the significant variation in Populus euphratica density, a hierarchical strategy was adopted to identify the distribution range based on density differences. The spatial distribution of Populus euphratica can be divided into two categories: areas with high-density Populus euphratica distribution (Category 1) and areas with sparse Populus euphratica distribution (Category 2).
Delineating the contours of high-density Populus euphratica distribution areas: Based on the original SHP format vector point set of Populus euphratica, 20% of the points were randomly selected to create a random sample point set (RSPS). Based on the RSPS, with the parameter α set to 0.02, the distribution contour of the dense Populus euphratica distribution range (Category 1) was identified, resulting in a high-density Populus euphratica distribution polygon set (HDPS).
Extracting the contours of low-density Populus euphratica distribution areas: The intersection between the high-density Populus euphratica distribution polygon set (HDPS) and the random sample point set (RSPS) was calculated to obtain high-density Populus euphratica points (HDPs). High-density Populus euphratica points (HDPs) were removed from the original RSPS to obtain low-density Populus euphratica points (LDPs). Based on the LDP, with the parameter α set to 0.006, the contour of the sparse Populus euphratica distribution range (Category 2) was identified, resulting in a low-density Populus euphratica distribution polygon set (LDPS).
3.4. Morphological Processing of the Populus euphratica Distribution Contour Polygons
Comprehensive processing of the Populus euphratica distribution contour morphology was conducted. This mainly included the following steps:
- (1)
- Removing small patches: Isolated Populus euphratica pixels still existed in the classified image; therefore, the two contour files (HDPS and LDPS) obtained in Section 3.3 contained some fragmented small patches. These small patches were cleaned first.
- (2)
- Contour smoothing: The smoothing parameter sigma for Gaussian filtering was set to three, and the two contour polygon sets were smoothed separately.
- (3)
- Merging contour polygons: The contours of adjacent polygons did not completely coincide. To reduce cavities between the two contour sets, the contour of the high-density Populus euphratica polygon set (HDPS) was first expanded outward, and then the polygon sets were merged.
3.5. Cavity Filling in the Geometry
Cavities within the Populus euphratica distribution contour polygons were filled. After file merging in Section 3.4, several new cavities were generated within the polygon geometry. Cavities with areas smaller than 10,000 m2 were filled.
3.6. Accuracy Verification
Fifty polygons were randomly selected from the identification results as validation samples. Based on Google online maps, a visual interpretation was manually conducted to delineate the distribution boundaries of Populus euphratica as ground truth labels. Intersection over Union (IoU) and Mean Intersection over Union (MIoU) were adopted as accuracy evaluation metrics. IoU measures the overlap between the prediction results and the ground truth labels, which is a commonly used accuracy evaluation metric in the fields of object detection and image segmentation. For any two regions, A (prediction result) and B (ground truth), their IoU is defined as the ratio of the area of their intersection to the area of their union.
The calculation formula is as follows:
4. Results
4.1. Preprocessing of Populus euphratica Raster Classification Data
The removal of misclassified pixels is a fundamental prerequisite for accurately delineating the distribution outline of Populus euphratica. First, misclassified pixels in the original Populus euphratica classification image were cleaned to improve the accuracy of the classification data. The non-Populus euphratica pixels mixed into the original classification data were primarily other tree species, mainly white poplar. From the satellite imagery, these misclassified pixels mainly originated from farmland shelterbelts and were concentrated in agricultural areas (Figure 3). Therefore, thematic cropland classification data were used to mask the original classification data, removing the farmland shelterbelt pixels to obtain relatively pure raster data of the natural Populus euphratica forest distribution.
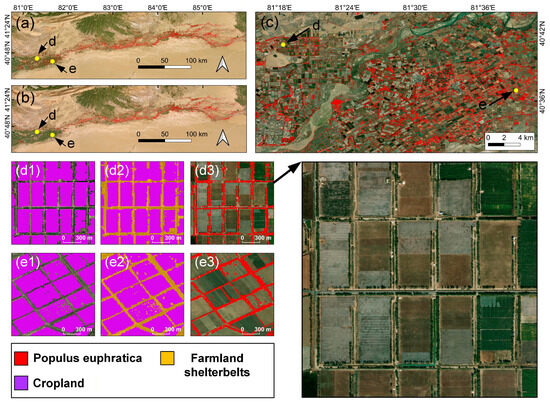
Figure 3.
Populus euphratica classification images before and after masking using farmland shelterbelt distribution data: (a) original Populus euphratica classification image; (b) Populus euphratica classification image after removing farmland shelterbelt pixels; (c) shows the pixels misclassified as Populus euphratica within the cropland distribution. (d1,e1) show the original cropland classification image; (d2,e2) show the new pixels generated by applying a closing operation to the cropland image; (d3,e3) show the original Populus euphratica classification image.
In the field of image processing, the closing operation is widely used for filling gaps in images and connecting separated pixels. The original cropland classification image did not include pixels of farmland shelterbelts. Shelterbelts are scattered between cropland patches, and the missing pixels between cropland patches correspond to shelterbelt pixels (as shown in d1 and e1 in Figure 3). Applying the closing operation (dilation followed by erosion) to the binary classification image of the original cropland can fill the missing pixels and obtain the distribution of shelterbelts.
The new pixels generated after dilation (A1, B1, C1 in Figure 4, yellow pixels) can be divided into two categories: one located inside the image, i.e., between cropland patches—these pixels spatially belong to farmland shelterbelts; the other category of pixels (A3, B3, C3 in Figure 4, cyan pixels) is located at the outermost periphery of the farmland. These pixels would mask the possible distribution of Populus euphratica around the farmland. Therefore, after dilation, an erosion operation is required to remove the pixels at the outer edge of the cropland image, retaining only the newly generated pixels inside the cropland image (A2, B2, C2 in Figure 4). Thus, through the closing operation, the shelterbelt pixels are filled while preserving the outermost boundary of the original cropland patches.
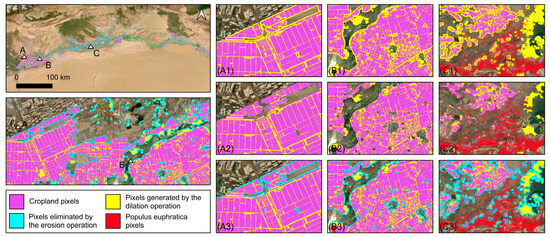
Figure 4.
Comparative results of cropland classification images processed with the closing operation, A, B, and C indicate the locations of the subfigures, respectively. (A1,B1,C1) show the images after the dilation operation; (A2,B2,C2) show the images after the closing operation (dilation followed by erosion); (A3,B3,C3) highlight the eroded pixels in cyan.
In the closing operation, the size of the kernel directly determines whether the distribution range of shelterbelts can be effectively captured. During dilation, if the kernel is too small, it may fail to cover and effectively extract the pixels of roadside trees; during erosion, if the kernel is too large, it may remove pixels of Populus euphratica. After testing, setting the dilation kernel size to 25 and the erosion kernel size to 29 proved effective in accurately obtaining the spatial extent of farmland shelterbelts. Using the cropland classification data published by Qiu et al. [37], a closing operation was performed to obtain cropland data including shelterbelts. These data were then used to mask the original Populus euphratica classification by removing misclassified pixels. The results showed that after masking, 6,188,729 non-Populus euphratica pixels were removed, which accounted for 26.04% of the original Populus euphratica pixels.
4.2. Removal of Vector Outliers
The Populus euphratica distribution boundary was delineated by reconstructing contour lines from the Populus euphratica point set. Therefore, in addition to misclassified pixels, sparsely distributed and isolated Populus euphratica points can also affect the contour shape and interfere with boundary identification. Typically, discretely distributed isolated point sets often lead to an overestimation of the Populus euphratica distribution range.
This study employed two methods to mitigate the impact of outliers. In the raster image, numerous fragmented pixel patches were present in the original data. An appropriate kernel size (19) was used to filter fragmented raster pixel patches. Second, after converting Populus euphratica raster pixels into point features, the density information of the point set was used to remove isolated outlier points.
The results showed that the method based on a kd-tree for calculating density efficiently separated outliers. The deleted discrete points were highly consistent with areas of sparse Populus euphratica distribution (Figure 5). Most of these isolated points were located at the edges of the Populus euphratica distribution range, in areas far from riverbanks, deep in the desert, with poor natural conditions unsuitable for extensive Populus euphratica growth. The removed outliers included a small number of tamarisk pixels misclassified as Populus euphratica and some isolated genuine Populus euphratica pixels.
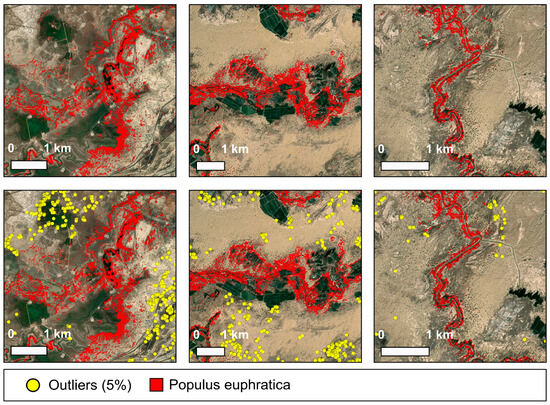
Figure 5.
Removed 5% of low-density points.
Excessive removal of discrete points can disrupt the connectivity within the Populus euphratica point set, leading to fragmented boundary identification. To determine the appropriate removal proportion, the contour identification effects of three outlier-removal schemes (10%, 5%, and 2%) were compared. The results indicated that removing 10% of the discrete points also eliminated some relatively sparse Populus euphratica pixels. Removing only 2% retained too many discrete points, significantly hindering boundary identification. Overall, removing 5% of the discrete points was most appropriate, as it primarily removed scattered points at the outer edge of the distribution without affecting contiguous patches, while greatly reducing outlier interference.
4.3. Density-Based Hierarchical Scheme for Populus euphratica Distribution Contour Identification
The distribution of Populus euphratica in the Tarim River Basin is scattered, covers a large area, and exhibits significant geographical variation, resulting in substantial differences in distribution density. Therefore, a hierarchical scheme for identifying distribution contours based on density differences was adopted. By adjusting the α value, Populus euphratica point sets of different density levels were identified separately. A relatively smaller α was set for dense areas and a larger α for sparse areas, thereby constructing dense distribution areas (HDPS) and sparse distribution areas (LDPS).
When applying the alpha-shape algorithm, α is an empirical parameter whose value is closely related to the density and distribution of the point set. It is often difficult to determine an appropriate α directly and accurately. The parameter α is a key factor controlling the “compactness” of the boundary contour. Therefore, to select a suitable α, we adopted a trial-and-error approach to optimize it. Values of α were set to 0.002, 0.004, 0.006, 0.008, 0.01, 0.02, 0.03, 0.04, and 0.05, respectively. The trends in polygon shape variation were observed.
The results show that when α is too small, the algorithm uses a circle with a relatively large radius to detect the boundary of the point set. This results in a single polygon with an overly large area and a contour that is too loose. In such cases, the polygon tends to cover many low-density points (Figure 6), as well as large blank areas where Populus euphratica is not distributed—areas that should instead be treated as depressions or internal holes in the polygon in vegetation mapping (Figure 6, Plot B).
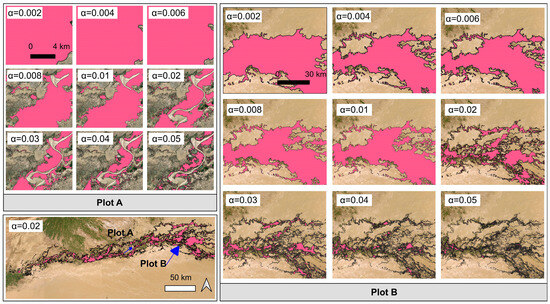
Figure 6.
Comparison of polygon shapes constructed by the alpha-shape algorithm under different α values. Plot A and Plot B illustrate the variations in patches at different scales: Plot A shows changes in small-scale Populus euphratica patches near the riverbank, while Plot B displays changes in large-scale Populus euphratica patches.
If α is too large, the algorithm employs a circle with a smaller radius to detect the point set boundary, resulting in overly fragmented polygons that fail to cover large, contiguous areas of Populus euphratica distribution. For instance, when α = 0.002, the polygon covers almost the entire point set, while at α = 0.05, it only covers 26% of the Populus euphratica point set (Table 1).

Table 1.
Proportion of Populus euphratica point sets covered by polygons created with different α parameters in the alpha-shape algorithm.
Considering three aspects comprehensively—polygon shape, the number of Populus euphratica points covered, and the density distribution of the covered points—when α = 0.02, the polygon shape closely approximates the actual distribution contour of Populus euphratica while maintaining relatively compact boundaries. It also covers most (80%) of the Populus euphratica points, predominantly those of medium density.
Through testing, setting the parameter α to 0.02 effectively generated polygon sets covering the range of dense Populus euphratica distribution areas (Figure 7). Setting the parameter α to 0.006 effectively generated polygon sets covering the range of sparse Populus euphratica distribution areas.
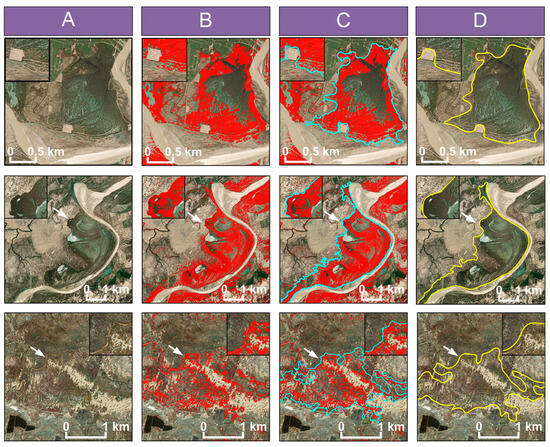
Figure 7.
Polygon recognition results of HDPS, the white arrows indicate the distribution area of populus euphratica. HDPS: high-density Populus euphratica distribution range. (A) Google Earth image; (B) Populus euphratica classification image; (C) The Populus euphratica distribution polygons reconstructed by the alpha-shape algorithm (cyan, α = 0.02); (D) the filtered result of the polygons after applying a Gaussian filter (yellow).
4.4. Comprehensive Optimization of Contour Polygon Morphology
4.4.1. Filtering Fragmented Patches
Although various methods were used to mitigate the adverse effects of outliers, the identification results still contained small polygon patches. Analysis of area distribution characteristics revealed that in the Category 1 (HDPS) polygon set (total polygons ≈ 32,807), most were small, fragmented patches. In terms of area distribution, patches with areas smaller than 1 hm2 accounted for approximately 78.48% of the total count but only 2.04% of the total area (Figure 8). After sorting the polygons in descending order of area, the cumulative area proportion was calculated. The results showed that the top 208 patches (0.634% of the total count) accounted for 80% of the total area. The top 1049 patches accounted for 90% of the total area. Consequently, using 1 hm2 as the threshold, fragmented patches smaller than this size (constituting the smallest 20% by area contribution) were filtered, retaining patches larger than 1 hm2.
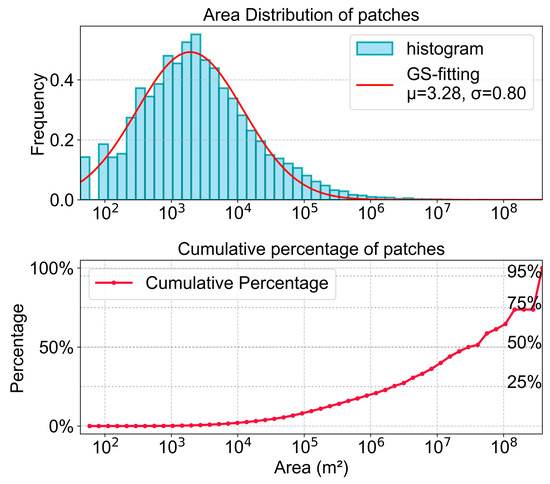
Figure 8.
Area distribution of Populus euphratica polygons.
4.4.2. Boundary Smoothing
The identification results showed that the alpha-shape algorithm effectively extracted the boundary contours of the Populus euphratica point set. The overall morphology of the created polygon geometries was consistent with the spatial distribution pattern of Populus euphratica, effectively depicting its distribution outline, particularly along riverbanks. However, closer inspection revealed that the boundary lines reconstructed directly from the point set were not smooth. The contour lines appeared jagged, with local angularities, especially near isolated Populus euphratica points, resulting in saw-tooth-like protrusions. Therefore, boundary smoothing was necessary to eliminate the “saw-tooth phenomenon.”
Common contour-smoothing methods include (1) the spline function method, (2) Chaikin’s algorithm, and (3) Gaussian filtering. To determine a suitable smoothing algorithm, polygons of different shapes and sizes were selected to test the three methods. The results showed that (1) the spline function only slightly improved the “saw-tooth phenomenon” and failed to effectively eliminate local protrusions, yielding unsatisfactory smoothing (Figure 9). (2) Chaikin’s algorithm performed better than the spline function but still could not completely eliminate the saw-tooth effect. (3) The Gaussian filtering algorithm yielded the best results, suppressing protrusions and compensating for concavities (Figure 9). This “cutting-peaks-and-filling-valleys” smoothing approach was more suitable for Populus euphratica contour extraction. Based on these results, the Gaussian filtering algorithm was adopted for boundary smoothing.
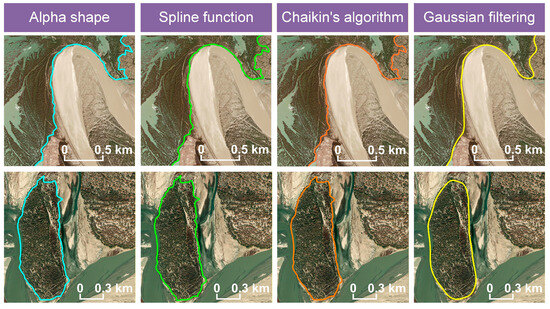
Figure 9.
Comparison of the effect of different smoothing algorithms.
The parameter σ is the core parameter controlling the smoothness intensity of Gaussian filtering, and its appropriate value is typically determined based on the application scenario. We set σ to 1, 2, 3, and 5, respectively. The changes in polygon shape under different parameters were observed to determine a suitable σ. As shown in the image (Figure 10), when σ is 1 or 2, the smoothing effect is relatively weak, providing insufficient reduction and suppression of convex protrusions and inadequate filling of local depressions, resulting in contours that retain excessive detail and sharp features. When σ is 5, it produces a good smoothing effect on the polygon contour—small convex bumps are flattened, and depressions are filled—but it also causes excessive shrinkage of the boundary contour. When σ is 3, an appropriate level of smoothing is achieved, effectively preserving boundary details while ensuring that the compactness of the boundary lines and the contour morphology align well with the actual boundary form of Populus euphratica. Therefore, σ = 3 was used for smoothing the boundary contour.
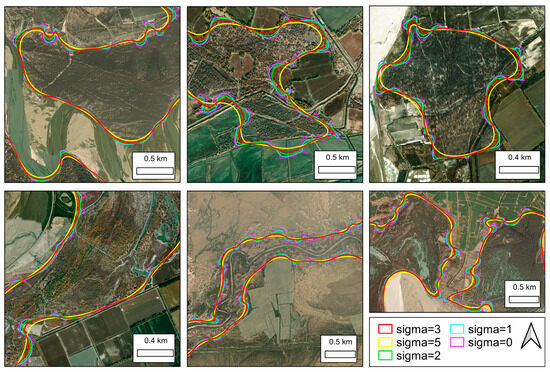
Figure 10.
Comparison of the smoothing effects on the Populus euphratica boundary contour using Gaussian filtering algorithms under different parameters.
4.4.3. Contour Merging Processing
In areas where dense (HDPS) and sparse (LDPS) Populus euphratica distribution zones were adjacent, the line forms of the HDPS and LDPS polygons were consistent, but their contours were not perfectly aligned, creating narrow, cavity-like gaps (Figure 11). Therefore, the HDPS and LDPS were preprocessed before spatial merging.
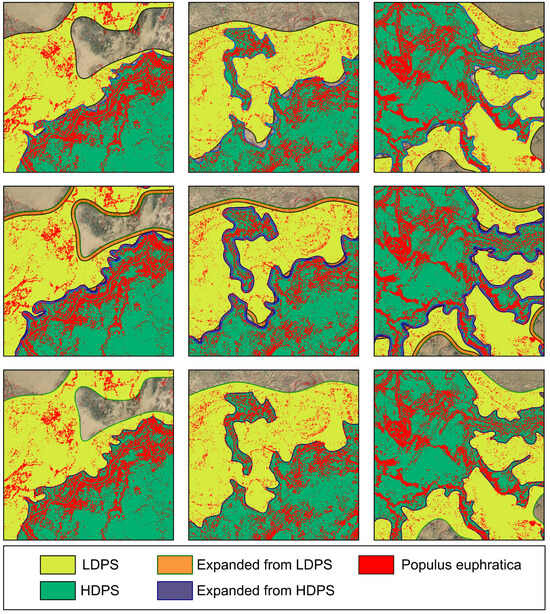
Figure 11.
Spatial merging of HDPS and LDPS. HDPS: dense Populus euphratica distribution polygon set; LDPS: low-density Populus euphratica distribution polygon set.
The equidistant-offset polygon-contour-point method was used to reduce the number and area of cavities at the HDPS-LDPS junctions. After testing, setting the buffer expansion distances for the HDPS and LDPS to 50 m and 100 m, respectively, reduced the number of cavities from 1461 to 521, a decrease of 64.2% (Figure 12). The results indicated that the equidistant expansion method effectively filled cavities in adjacent areas without altering the overall contour morphology, thereby eliminating small gaps and rapidly reducing the area of larger cavities.
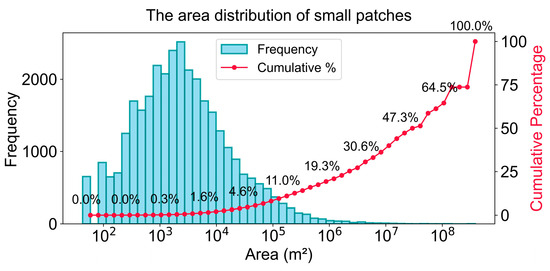
Figure 12.
Area distribution of small patches.
4.5. Polygon Hole Filling
After equidistant expansion and subsequent spatial merging of the HDPS and LDPS, some holes remained within the polygons. The areas and numbers of holes were counted (Figure 12). The analysis revealed that holes with areas smaller than 1 km2 accounted for 82.34% of the total number of holes, but only 1.9% of the total hole area. Therefore, a threshold of 1 km2 was set, and smaller holes within the polygons were filled. After this hole-filling process, the final spatial map of Populus euphratica distribution (Figure 13) was obtained.
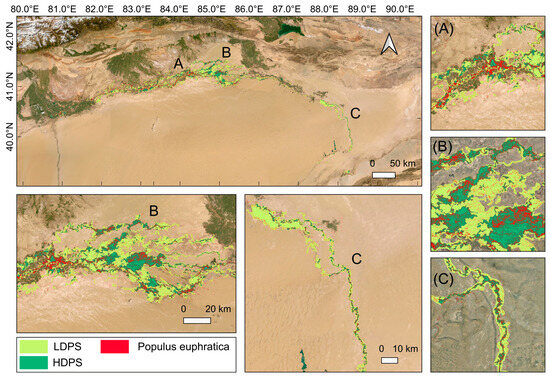
Figure 13.
Distribution outline of Populus euphratica along the Tarim River. A, B, and C indicate the geographical locations of the subfigures. (A) shows the distribution outline of Populus euphratica in the riparian zone; (B) shows the distribution outline of Populus euphratica in the floodplain area; (C) shows the distribution outline of Populus euphratica in the desert area.
4.6. Accuracy Evaluation
Compute the IoU and MIoU for 50 validation samples. Among the validation samples, the MIoU was 79.65%, with a maximum IoU of 91.49, a minimum of 63.02, and a median of 80.45. It is generally considered that an IoU > 0.5 indicates an acceptable prediction, while in stricter evaluations, an IoU > 0.75 is regarded as a good prediction result. The validation results demonstrate that the technical solution proposed in this study effectively identifies the distribution boundaries of Populus euphratica.
From a zonal perspective, the identification accuracy of Populus euphratica distribution boundaries can be spatially categorized into three types. First, in areas near riverbanks where Populus euphratica grows densely, better identification results are more easily achieved, yielding the highest accuracy (1/2 in Figure 14). Second, in areas where Populus euphratica and Tamarix grow intermixed, the boundary identification accuracy is relatively lower due to misclassification of Tamarix as Populus euphratica in the original classification map (7/9 in Figure 14). Third, in areas adjacent to deserts (3/4/5/6/8 in Figure 14), where Populus euphratica grows sparsely, these scattered, small-sized individual trees are difficult to accurately capture in 10 m resolution imagery. The boundary identification accuracy in these areas is lower than in riverbank zones but slightly higher than in mixed Populus euphratica–Tamarix areas.
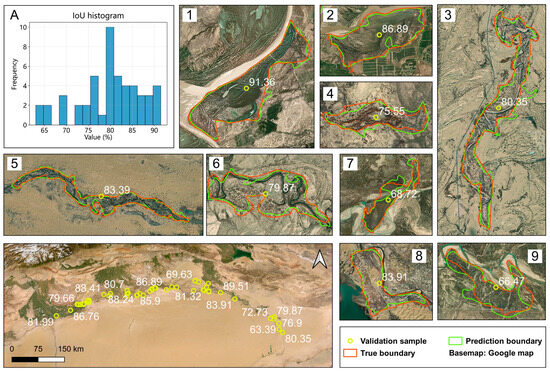
Figure 14.
Spatial distribution of validation samples: (A) the histogram of IoU values for the validation samples, with the IoU (%) for each validation zone annotated in white text. 1/2 represents the distribution of Populus euphratica in the riparian zone, 3/4/5/6/8 represents its distribution in the desert zone, and 7/9 represents the mixed Populus euphratica and Tamarix area.
5. Discussion
5.1. Optimizing Raster Data Classification Accuracy
High-accuracy raster classification imagery is crucial for accurately delineating the distribution boundaries of Populus euphratica. Zou et al. utilized Sentinel-1/2 series imagery and comprehensively integrated information such as texture and phenology with a Random Forest classification method, achieving favorable classification results. However, because of the vast extent of the Tarim River Basin and significant variation in Populus euphratica distribution density, misclassified pixels and isolated Populus euphratica points within the raster imagery significantly impacted boundary contour identification, leading to a substantial overestimation of the distribution range. Typically, it is challenging to further improve the classification accuracy of a single remote sensing product because of limitations inherent in the data.
Leveraging multi-source thematic classification data to enhance the classification accuracy of Populus euphratica raster data is essential for precise boundary identification. The rapid advancement of remote sensing classification technologies has led researchers to release numerous thematic datasets, continually creating new opportunities for mapping plant distributions [22]. Generally, in the absence of major environmental disturbances, vegetation distribution ranges remain relatively stable, especially in natural Populus euphratica forests, whose boundaries rarely change abruptly over a few years. The relative stability of feature categories enables the use of multiple thematic datasets. Thus, multisource thematic data from different periods can complement and validate each other. By exploiting the complementary spatial relationships and mutually exclusive categorical attributes of features, a post-classification accuracy optimization scheme for specific species of interest can be constructed using multiple land-cover classification products. This strategy of sequentially removing other feature categories effectively refines the accuracy of the distribution data for a specific vegetation type.
Farmland shelterbelts were the primary cause of classification errors for Populus euphratica, introducing significant uncertainty into the identification of its spatial distribution contours. White poplar, the main species in artificial shelterbelts, belongs to the same family (Salicaceae) as Populus euphratica, making it difficult to distinguish using remote sensing imagery in desert regions. Artificial shelterbelts are mainly distributed between regular-shaped cropland plots that have distinct spectral signatures and are typically classified with relatively high accuracy. Therefore, shelterbelt distribution can be indirectly extracted using morphological methods based on high-accuracy cropland data. The extracted shelterbelt data could then be used to mask the original classification of Populus euphratica, thereby improving its accuracy.
5.2. Outlier Removal
Outliers significantly affect contour identification, and removing an appropriate proportion of outliers is a key step for accurate delineation. Eliminating outliers offers two main advantages: ensuring boundary accuracy and promoting contour smoothness. The spatial distribution of Populus euphratica is highly heterogeneous. It is dense in areas with favorable natural conditions (e.g., floodplains and riverbanks) but sparse away from rivers, becoming discontinuous or absent deep within the desert. In areas with mixed distribution patterns containing dense, sparse, and discontinuous point sets, the resulting contour polygons are typically polygons with holes. If scattered, relatively sparse Populus euphratica points interfere with boundary identification, the result is often a polygon without holes, leading to overestimation of the distribution range. Hence, removing an appropriate proportion of isolated points is necessary to improve accuracy.
Density variation was the main cause of the differences in contour identification. Converting raster data into vector point features facilitates distance and density calculations. Therefore, using density as a criterion to filter isolated Populus euphratica points helps overcome interference caused by variations in distribution density, ensuring that the boundary contour closely approximates the true distribution morphology. The filtered low-density points primarily fall into two categories: (1) genuine isolated Populus euphratica points located away from contiguous patches near desert edges and (2) tamarisk pixels distributed in gravel deserts near sandy areas that were misclassified as Populus euphratica.
5.3. Hierarchical Identification Scheme
Populus euphratica is scattered, covers large areas, and exhibits significant geographical and spatial heterogeneity. To achieve better contour identification, a density-based hierarchical approach was adopted to adapt the alpha parameter to the distribution density. This study employed the alpha-shape algorithm for contour reconstruction. This algorithm is commonly used for reconstructing contours from two- or three-dimensional irregular point clouds and adapts well to data [42], often conceptualized via the “rolling circle” method. The parameter α directly determines the contour morphology [41]. A larger α value yields more detailed shapes but smaller geometries, whereas a smaller α value produces coarser outlines encompassing larger areas.
Operationally, a relatively small α value was set first to identify the distribution range in high-density areas. The resulting high-density zone vector file was used to remove high-density points from the original set. Subsequently, a relatively large α parameter was set to identify the distribution contour from the remaining (low-density) points. Finally, the results from both density classes were spatially merged to obtain the full-range Populus euphratica distribution data.
5.4. Main Advantages
This study focused on the key problem of identifying Populus euphratica distribution contours and established a technical framework based on multi-source remote sensing classification data. Using the mainstream area of the Tarim River as an example, it effectively extracted the distribution range, enhanced the automation level of contour delineation, and held a significant value for vector mapping of desert vegetation distribution.
The advantages of this scheme are threefold: (1) it fully utilizes multi-source data to effectively improve the accuracy of the original raster data. (2) It leverages vector-point sets and a kd-tree data structure to efficiently separate outliers, thereby improving contour-identification accuracy. (3) It employs a hierarchical strategy, sequentially processing point subsets using an alpha-shape algorithm to identify contours at different density levels. This zonal identification approach mitigates interference caused by density variations. Furthermore, the parameter α in the alpha-shape algorithm has a clear interpretation, being directly related to density and determining contour morphology, making it highly suitable for reconstructing desert plant distributions.
5.5. Study Limitations
The technical framework developed in this study effectively improved the automation level for delineating Populus euphratica distribution contours. However, certain factors constrain the degree of automation, which is primarily manifested in two aspects.
First, the parameters within the framework require manual adjustment, which reduces automation. The workflow involves multiple parameters (e.g., the kernel parameter for raster-closing operations, the α parameter for the alpha-shape algorithm, and the sigma parameter for Gaussian filtering) that directly affect the results. These parameters must be set according to the distribution characteristics of the target and rely on manual tuning based on experience. Different user experiences lead to different parameter settings and, consequently, different results.
Second, quantitative evaluation metrics are lacking. Assessing the results at various steps relies primarily on the researcher’s experience and lacks objective and quantitative indicators. For instance, evaluating the quality of boundary contours still depends on visual interpretation and experiential judgment of their reasonableness and consistency with the presumed true distribution.
In summary, future efforts to enhance automation should focus on two directions: (1) developing self-iterative parameter-optimization schemes tailored to the distribution characteristics of desert vegetation across zones with different densities and (2) establishing key evaluation metrics based on the morphological characteristics of the generated Populus euphratica contour geometries.
6. Conclusions
In arid regions, accurately and automatically delineating the spatial distribution of Populus euphratica is challenging because of its vast range and high spatial heterogeneity. To identify and extract distribution boundaries precisely, this study developed a technical scheme based on multi-source thematic classification data. The results demonstrated the following:
- (1)
- Utilizing a closing operation with cropland classification data effectively removed farmland shelterbelt pixels, improving the accuracy of the original Populus euphratica classification and establishing a reliable data foundation for boundary identification. Subsequently, employing a kd-tree data structure on the Populus euphratica vector point set to remove 5% of the low-density points based on density information effectively mitigated interference from sparse outliers in boundary recognition.
- (2)
- The hierarchical identification scheme, which adapts the alpha parameter of the alpha-shape algorithm according to density differences, successfully overcame the impact of density variation, facilitating accurate contour extraction of Populus euphratica distribution.
- (3)
- A comparison of various contour-smoothing methods revealed that the Gaussian filtering algorithm performed the best. When combined with morphological operations such as an equidistant offset of polygon contour points, it further optimized the polygon contour morphology and accurately characterized the spatial distribution of Populus euphratica. This represents a valuable attempt to automate vegetation distribution mapping, explore the feasibility of using raster classification data for mapping desert vegetation, and provide a useful reference for the scientific management and utilization of desert ecosystems.
Author Contributions
Conceptualization, H.L. and J.H.; methodology, H.L. and J.Z.; software, H.L. and Q.Z.; validation, H.L., Q.Z. and J.Z.; formal analysis, H.L.; investigation, J.Z.; resources, Q.S. and W.C.; data curation, S.L.; writing—original draft preparation, H.L. and J.Z.; writing—review and editing, H.L. and J.H.; visualization, H.L.; supervision, J.H. and W.C.; project administration, J.H.; funding acquisition, S.L. All authors have read and agreed to the published version of the manuscript.
Funding
This work was supported by the National Key R&D Program of China [No. 2023YFF1303802], National Natural Science Foundation of China [NSFC, Grant No. 32201349], and National Natural Science Foundation of China (Key Program) [NSFC, Grant No. 42130110].
Data Availability Statement
The original contributions presented in the study are included in the article; further inquiries can be directed to the corresponding author.
Conflicts of Interest
The authors declare no conflicts of interest.
Abbreviations
The following abbreviations are used in this manuscript:
| RSPS | Random Sample Point Set |
| HDPS | High-Density Populus euphratica Distributio Polygon Set |
| HDPs | High-Density Populus euphratica Points |
| LDPs | Low-Density Populus euphratica Points |
| LDPS | Low-Density Populus euphratica Polygon Set |
| IoU | Intersection over Union |
| MIoU | Mean Intersection over Union |
References
- Aishan, T.; Halik, Ü.; Betz, F.; Gärtner, P.; Cyffka, B. Modeling height–diameter relationship for Populus euphratica in the Tarim riparian forest ecosystem, Northwest China. J. For. Res. 2016, 27, 889–900. [Google Scholar] [CrossRef]
- Lang, P.; Jeschke, M.; Wommelsdorf, T.; Backes, T.; Lv, C.; Zhang, X.; Thomas, F.M. Wood harvest by pollarding exerts long-term effects on Populus euphratica stands in riparian forests at the Tarim River, NW China. For. Ecol. Manag. 2015, 353, 87–96. [Google Scholar] [CrossRef]
- Guo, X.; Li, J.; Zhang, J.; Wei, C.; Li, Z. Vegetation growth improvement Inadequately represents the ecological restoration of the Populus euphratica forests in Xinjiang, China. Ecol. Indic. 2025, 170, 113086. [Google Scholar] [CrossRef]
- Li, H.; Zhao, Q.; Hu, J.; Zou, J.; Ding, C.; Ji, L.; Liu, S.; Cheng, W. Populus Euphratica extraction based on deep learning of spatiotemporal Information using Sentinel data. Int. J. Remote Sens. 2025, 46, 6322–6349. [Google Scholar] [CrossRef]
- Zou, J.; Li, H.; Ding, C.; Liu, S.; Shi, Q. Mapping Natural Populus euphratica Forests in the Mainstream of the Tarim River Using Spaceborne Imagery and Google Earth Engine. Remote Sens. 2024, 16, 3429. [Google Scholar] [CrossRef]
- Li, H.; Shi, Q.; Wan, Y.; Shi, H.; Imin, B. Using Sentinel-2 Images to Map the Populus euphratica Distribution Based on the Spectral Difference Acquired at the Key Phenological Stage. Forests 2021, 12, 147. [Google Scholar] [CrossRef]
- Horvath, P.; Halvorsen, R.; Simensen, T.; Bryn, A. A comparison of three ways to assemble wall-to-wall maps from distribution models of vegetation types. GIScience Remote Sens. 2021, 58, 1458–1476. [Google Scholar] [CrossRef]
- Su, Y.; Guo, Q.; Hu, T.; Guan, H.; Jin, S.; An, S.; Chen, X.; Guo, K.; Hao, Z.; Hu, Y.; et al. An updated Vegetation Map of China (1:1000000). Sci. Bull. 2020, 65, 1125–1136. [Google Scholar] [CrossRef]
- Anderson, S.L.; Murray, S.C. R/UAStools::plotshpcreate: Create Multi-Polygon Shapefiles for Extraction of Research Plot Scale Agriculture Remote Sensing Data. Front. Plant Sci. 2020, 11, 511768. [Google Scholar] [CrossRef]
- Cheng, Y.; Zhou, K.; Wang, J.; Maeyer, P.D.; Voorde, T.V.; Yan, J.; Cui, S. A Comprehensive Study of Geochemical Data Storage Performance Based on Different Management Methods. Remote Sens. 2021, 13, 3208. [Google Scholar] [CrossRef]
- Chowdhury, S.J.; Yang, C.-S. A Study on the Coastline Extraction and Coastal Change Analysis Using Sentinel-2 Imagery in Funafuti, Tuvalu. Remote Sens. 2025, 17, 2794. [Google Scholar] [CrossRef]
- Frankl, A.; Zwertvaegher, A.; Poesen, J.; Nyssen, J. Transferring Google Earth observations to GIS-software: Example from gully erosion study. Int. J. Digit. Earth 2013, 6, 196–201. [Google Scholar] [CrossRef]
- Teng, F.; Wu, L.; Liu, S. Extraction of Agricultural Parcels Using Vector Contour Segmentation Network with Hybrid Backbone and Multiscale Edge Feature Extraction. Remote Sens. 2025, 17, 2556. [Google Scholar] [CrossRef]
- Burner, N.; Harris, D.K.; Li, Z. SHP Buddy: A QGIS plugin for generating shapefiles to support remote sensing in plant breeding and agronomic experiments. Plant Methods 2025, 21, 17. [Google Scholar] [CrossRef] [PubMed]
- Ramdani, F. Working with Spatial Data. In Data Science: Foundations and Hands-on Experience: Handling Economic, Spatial, and Multidimensional Data with R; Ramdani, F., Ed.; Springer: Singapore, 2025; pp. 243–319. [Google Scholar]
- Pedrotti, F. Mapping Vegetation. In Plant and Vegetation Mapping; Pedrotti, F., Ed.; Springer Nature: Berlin, Heidelberg, 2013; pp. 53–102. [Google Scholar]
- Pedrotti, F. Types of Vegetation Maps. In Plant and Vegetation Mapping; Pedrotti, F., Ed.; Springer Nature: Berlin, Heidelberg, 2013; pp. 103–181. [Google Scholar]
- Ricker, M.; Castillo-Santiago, M.Á.; Gutiérrez-García, G.; Martínez-Salas, E.M.; Mondragón, E. Dataset about Mexico’s forest diversity: Site locations of tree species, wood densities, and geographic database of forest-vegetation provinces. Data Brief 2024, 53, 110186. [Google Scholar] [CrossRef]
- Xiahou, M.; Peng, M.; Shen, Z.; Wen, Q.; Wang, C.; Liu, Y.; Zhang, Q.; Peng, L.; Yu, C.; Ou, X.; et al. Vegetation mapping of Yunnan Province by integrating remote sensing, field observations, and models. Sci. China Earth Sci. 2025, 68, 836–849. [Google Scholar] [CrossRef]
- Immitzer, M.; Böck, S.; Einzmann, K.; Vuolo, F.; Pinnel, N.; Wallner, A.; Atzberger, C. Fractional cover mapping of spruce and pine at 1ha resolution combining very high and medium spatial resolution satellite imagery. Remote Sens. Environ. 2018, 204, 690–703. [Google Scholar] [CrossRef]
- Fassnacht, F.E.; Latifi, H.; Stereńczak, K.; Modzelewska, A.; Lefsky, M.; Waser, L.T.; Straub, C.; Ghosh, A. Review of studies on tree species classification from remotely sensed data. Remote Sens. Environ. 2016, 186, 64–87. [Google Scholar] [CrossRef]
- Xu, J.; Huang, Y.; Cheng, K.; Wang, Y.; Hu, T.; Guan, H.; Chen, Y.; Ren, Y.; Chen, M.; Yang, Z.; et al. Efficient large-scale vegetation mapping at the formation level using multi-source data: A case study in Beijing, China. ISPRS J. Photogramm. Remote Sens. 2025, 225, 36–51. [Google Scholar] [CrossRef]
- Peng, Y.; He, G.; Wang, G.; Zhang, Z. Large-Scale Populus euphratica Distribution Mapping Using Time-Series Sentinel-1/2 Data in Google Earth Engine. Remote Sens. 2023, 15, 1585. [Google Scholar] [CrossRef]
- Peng, Y.; He, G.; Wang, G. Spatial-temporal analysis of the changes in Populus euphratica distribution in the Tarim National Nature Reserve over the past 60 years. Int. J. Appl. Earth Obs. Geoinf. 2022, 113, 103000. [Google Scholar] [CrossRef]
- Li, X.; Duan, T.; Yang, K.; Yang, B.; Wang, C.; Tian, X.; Lu, Q.; Wang, F. Mapping Temperate Savanna in Northeastern China Through Integrating UAV and Satellite Imagery. Sci. Data 2025, 12, 671. [Google Scholar] [CrossRef]
- Xuan, F.; Dong, Y.; Li, J.; Li, X.; Su, W.; Huang, X.; Huang, J.; Xie, Z.; Li, Z.; Liu, H.; et al. Mapping crop type in Northeast China during 2013–2021 using automatic sampling and tile-based image classification. Int. J. Appl. Earth Obs. Geoinf. 2023, 117, 103178. [Google Scholar] [CrossRef]
- Zhao, X.; Wang, J.; Ding, Y.; Gao, X.; Li, C.; Huang, H.; Gao, X. High-resolution (10 m) dataset of multi-crop planting structure on the Loess Plateau during 2018–2022. Sci. Data 2025, 12, 1190. [Google Scholar] [CrossRef]
- Gong, P.; Liu, H.; Zhang, M.; Li, C.; Wang, J.; Huang, H.; Clinton, N.; Ji, L.; Li, W.; Bai, Y.; et al. Stable classification with limited sample: Transferring a 30-m resolution sample set collected in 2015 to mapping 10-m resolution global land cover in 2017. Sci. Bull. 2019, 64, 370–373. [Google Scholar] [CrossRef] [PubMed]
- Zhang, X.; Liu, L.; Zhao, T.; Zhang, W.; Guan, L.; Bai, M.; Chen, X. GLC_FCS10: A global 10 m land-cover dataset with a fine classification system from Sentinel-1 and Sentinel-2 time-series data in Google Earth Engine. Earth Syst. Sci. Data 2025, 17, 4039–4062. [Google Scholar] [CrossRef]
- Zhao, L.; Dong, T.; Du, X.; Dong, B.; Li, Q. Model morphing supported large scale crop type mapping: A case stuy of cotton mapping in Xinjiang, China. Int. J. Appl. Earth Obs. Geoinf. 2025, 141, 104667. [Google Scholar] [CrossRef]
- Gao, X.; Hu, Q.; Sun, D.; Belgiu, M.; Lun, F.; Sun, Q.; Ji, Z.; Jiao, X. Improved mapping of perennial crop types based on intra-annual biophysical changing patterns of spectral endmembers. Remote Sens. Environ. 2025, 331, 115059. [Google Scholar] [CrossRef]
- Kang, X.; Huang, C.; Chen, J.M.; Lv, X.; Wang, J.; Zhong, T.; Wang, H.; Fan, X.; Ma, Y.; Yi, X.; et al. The 10-m cotton maps in Xinjiang, China during 2018–2021. Sci. Data 2023, 10, 688. [Google Scholar] [CrossRef]
- You, N.; Dong, J.; Huang, J.; Du, G.; Zhang, G.; He, Y.; Yang, T.; Di, Y.; Xiao, X. The 10-m crop type maps in Northeast China during 2017–2019. Sci. Data 2021, 8, 41. [Google Scholar] [CrossRef] [PubMed]
- Zhang, X.; Zhao, T.; Xu, H.; Liu, W.; Wang, J.; Chen, X.; Liu, L. GLC_FCS30D: The first global 30 m land-cover dynamics monitoring product with a fine classification system for the period from 1985 to 2022 generated using dense-time-series Landsat imagery and the continuous change-detection method. Earth Syst. Sci. Data 2024, 16, 1353–1381. [Google Scholar] [CrossRef]
- Gao, B.; Xu, J.; Deng, M.; Ling, H. Study on the synergistic effects of ecological water conveyance and climate change on ecological restoration in arid areas: A case study of the Tarim River Basin. Ecol. Eng. 2026, 222, 107793. [Google Scholar] [CrossRef]
- Halik, Ü.; Aishan, T.; Betz, F.; Kurban, A.; Rouzi, A. Effectiveness and challenges of ecological engineering for desert riparian forest restoration along China’s largest inland river. Ecol. Eng. 2019, 127, 11–22. [Google Scholar] [CrossRef]
- Qiu, B.; Liu, B.; Tang, Z.; Dong, J.; Xu, W.; Liang, J.; Chen, N.; Chen, J.; Wang, L.; Zhang, C.; et al. National-scale 10-m maps of cropland use intensity in China during 2018–2023. Sci. Data 2024, 11, 691. [Google Scholar] [CrossRef]
- Edelsbrunner, H.; Mücke, E.P. Three-dimensional alpha shapes. ACM Trans. Graph. (TOG) 1994, 13, 43–72. [Google Scholar] [CrossRef]
- Capinha, C.; Pateiro-López, B. Predicting species distributions in new areas or time periods with alpha-shapes. Ecol. Inform. 2014, 24, 231–237. [Google Scholar] [CrossRef]
- Gao, G.; Qi, J.; Lin, S.; Hu, R.; Huang, H. Estimating plant area density of individual trees from discrete airborne laser scanning data using intensity information and path length distribution. Int. J. Appl. Earth Obs. Geoinf. 2023, 118, 103281. [Google Scholar] [CrossRef]
- Liu, K.; Ma, H.; Zhang, L.; Gao, L.; Xiang, S.; Chen, D.; Miao, Q. Building outline extraction using adaptive tracing alpha shapes and contextual topological optimization from airborne LiDAR. Autom. Constr. 2024, 160, 105321. [Google Scholar] [CrossRef]
- Shen, Y.; Zhong, B.; Ma, K.K. Cognitive Contour Detection of Sparse-Structured Objects in the Alpha-Shape Scale Space. IEEE Trans. Image Process. 2025, 34, 4955–4967. [Google Scholar] [CrossRef] [PubMed]


Disclaimer/Publisher’s Note: The statements, opinions and data contained in all publications are solely those of the individual author(s) and contributor(s) and not of MDPI and/or the editor(s). MDPI and/or the editor(s) disclaim responsibility for any injury to people or property resulting from any ideas, methods, instructions or products referred to in the content. |
© 2026 by the authors. Licensee MDPI, Basel, Switzerland. This article is an open access article distributed under the terms and conditions of the Creative Commons Attribution (CC BY) license.