Highlights
What are the main findings?
- Nighttime land surface temperature increased faster than daytime temperature.
- Over 90% of cities show high coordination between urban heat and air pollution.
What is the implication of the main finding?
- Strengthening correlation between thermal environment and air pollution is observed.
- Strengthening positive feedback between air pollution and nighttime heat islands.
Abstract
Rapid urbanization in China has exacerbated the dual challenges of urban heat islands (UHIs) and air pollution, threatening urban sustainability. We conducted a national-scale analysis of the spatiotemporal dynamics and synergy between the surface UHI intensity, distinguished as daytime (DUHI) and nighttime (NUHI), and major air pollutants (PM2.5, PM10, NO2) in 370 Chinese cities (2000–2019). Using multi-source remote sensing, ground-based monitoring, and urban data, we applied coupling coordination and correlation analyses to quantify these interactions. Key findings reveal distinct patterns: (1) The annual mean land surface temperature (LST) rose, with the nighttime LST (NLST) increasing faster than the daytime LST (DLST). Conversely, the UHI intensity showed an overall decline, with the DUHI decreasing more than the NUHI. (2) Air pollutants displayed strong seasonality; while PM10 concentrations decreased slightly over the long term, NO2 levels rose significantly. (3) Monthly, pollutants correlated negatively with LST (R2 > 0.92 for PM2.5), suppressing the DUHI but intensifying the NUHI. Long-term, the correlation trend revealed a strengthening synergy, particularly between particulate matter and NUHI (trend R2 = 0.50). (4) Spatially, over 90% of cities exhibited high UHI–particle coordination. Key associated factors include anthropogenic activities, urban morphology, and natural mitigation factors. We conclude that disrupting the heat–pollution synergy requires integrated strategies, namely reducing emissions at the source, optimizing the urban form, and enhancing ecological regulation. This is essential for advancing low-carbon, climate-resilient urban development.
1. Introduction
Rapid urbanization and economic growth in China since the late 20th century have transformed land use and the climate []. Urban expansion, industrial growth, and increased energy use alter ecosystems and emit pollutants, threatening urban sustainability [,]. In particular, the large-scale conversion of natural landscapes to built-up areas, with impervious surfaces, dense buildings, and less vegetation, has reshaped biophysical surface properties and energy exchange []. Built-up areas have lower albedo and higher heat capacity levels. This enhances solar radiation absorption and storage, raising land surface temperatures (LSTs) in urban cores compared to their rural surroundings [,]. These processes intensify environmental issues such as the urban heat island (UHI) effect and deteriorated air quality [,,]. Extreme heat and poor air quality together increase health risks. They raise morbidity and mortality from respiratory and cardiovascular diseases, particularly in vulnerable groups such as the elderly and children [,].
Economic and demographic growth has severely degraded urban air quality by emitting pollutants including fine particulate matter (PM2.5 and PM10) and nitrogen dioxide (NO2) [,]. These pollutants originate from diverse sources including vehicle exhaust fumes, industrial combustion, construction dust, and residential heating []. Their complex mixtures vary spatially and temporally cross cities. Beyond their well-documented cardiopulmonary health impacts, these aerosols and gases also interact with solar radiation and cloud formation processes, influencing both local and regional climate systems [,]. Critically, these two processes, thermal intensification and pollutant accumulation, are not independent. They interact through a series of complex biophysical and chemical mechanisms that together pose multidimensional challenges to urban sustainability, public health, and energy security [,]. Existing research studies confirm synergistic heat–pollution relationships across a range of geographic and climatic settings [,]. Spatial variations in LST can influence the atmospheric boundary layer structure, as well as pollutant transport and the dispersion and deposition of pollutants [,]. A stronger UHI intensity may enhance local circulations that concentrate pollutants and promote secondary aerosol formation [,]. Conversely, particulate matter and other pollutants can influence UHI patterns by altering radiative transfer and surface energy balances [,].
Although existing studies in regions such as the Yangtze River Delta and metropolitan areas such as Beijing and Seoul have shown UHI–pollutant correlations [,], these findings are geographically fragmented and temporally limited. Most research studies have examined individual cities or specific clusters. Such approaches miss the full spatiotemporal complexity and regional heterogeneity of UHI–pollution interactions nationally [,,]. Key gaps persist regarding the synergistic mechanisms between UHI effects and multiple pollutants, such as PM2.5, PM10, and NO2, across climates, topography, and seasons [,]. Moreover, the influence of urban morphological factors, anthropogenic heat emissions, and regional atmospheric conditions are still poorly quantified [,]. This is particularly critical in China, where rapid yet uneven urbanization has led to significant regional disparities in urban development intensity, industrial structure, and ecological backgrounds []. A systematic national analysis is needed. It should elucidate the driving mechanisms and contextual variabilities in the UHI–pollution relationship.
To address these research gaps, this study conducts a comprehensive analysis of all prefecture-level cities in China during 2000–2019. This period covers the most intensive phase of the country’s urban transition. By integrating multi-source remote sensing data (MODIS LST and land cover), ground-based air quality records, and high-resolution urban metrics, we aim to: (1) characterize the spatiotemporal dynamics of surface UHI intensity during both day and night and major air pollutants (PM2.5, PM10, and NO2); (2) quantify thermal–pollution coupling coordination using entropy weighting and standardized models; (3) identify key drivers and synergistic mechanisms across different regional contexts, focusing on urban expansion patterns, economic structures, and natural determinants; and (4) evaluate implications for urban environmental management and climate adaptation planning, including the design of co-benefit strategies that simultaneously mitigate heat and pollution. Distinct from previous national-scale assessments, this research involves a more nuanced and systemic understanding of heat pollution interactions in all cities in China for the first time. Meanwhile, this work provides the first nationwide, long-term (2000–2019) analysis that explicitly decouples and compares the synergistic mechanisms between daytime and nighttime thermal environment and multiple pollutants. This systematic approach allows us to move beyond fragmented evidence and reveal the universal patterns and regional heterogeneities of the heat–pollution nexus across China’s diverse urban landscapes. By integrating perspectives from atmospheric science, urban climatology, spatial epidemiology, and environmental policy, this study provides insights aimed at fostering more sustainable, healthy, and resilient urban development in China and other rapidly urbanizing regions facing similar environmental challenges.
2. Materials and Methods
2.1. Study Area
This study covers 370 cities across islands and mainland China, representing comprehensive spatial coverage of diverse climatic zones, topographies, and socioeconomic conditions. To facilitate a regionally stratified analysis, the country is divided into seven major geographic regions (Figure 1): Northeast China (NE), Northern China (N), Central China (C), Eastern China (E), Southern China (S), Southwest China (SW), and Northwest China (NW). This classification follows conventional Chinese geographical divisions. It enables consistent regional comparisons and policy insights. These regions reflect significant variations in climate, vegetation cover, industrial structure, and urbanization intensity. For instance, eastern and southern regions have high urbanization and intensive economies. Western and northern regions exhibit lower urban density but distinct natural factors such as arid climates or monsoons. This regional framework supports systematically evaluations of the thermal–pollution coupling relationships across heterogeneous environmental and anthropogenic gradients.
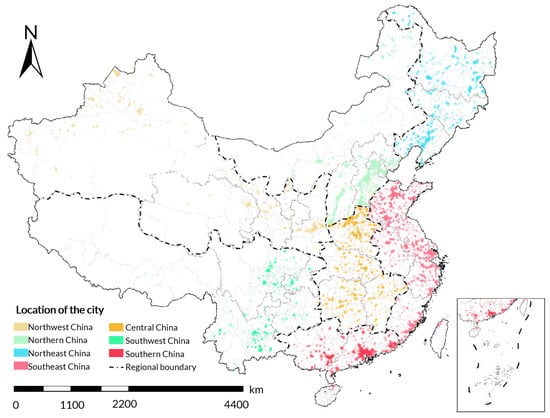
Figure 1.
Study area zoning. This map is divided into 7 main areas.
2.2. Data Source
To elucidate the spatiotemporal coupling relationships between urban thermal environments and air pollution across China, this study incorporates thermal remote sensing data and concentrations of key air pollutants (Table 1). Furthermore, we also integrate metrics from four dimensions to identify factors and mechanisms linking heat and pollution distributions, including the urban form, natural features, anthropogenic emissions, and land use (Table 1). The urban form was characterized using built-up area boundaries and building data. Natural features were represented by digital elevation models (DEMs) and climatic variables. Anthropogenic activities and emissions were proxied through population density, nighttime light, and carbon emission data. Land use patterns were captured using high-resolution urban land cover classification and tree canopy coverage datasets. Finally, all indicators were averaged within each city’s built-up area.

Table 1.
Data sources.
To clarify the temporal aggregation of the LST data, the MODIS MYD11A2 product provides an 8-day composite LST. Therefore, the monthly mean LST for a given month and city was calculated as the average of the 3–4 available 8-day composite scenes within that month. Correspondingly, the annual mean LST was derived from the average of all available 8-day composites (theoretically 46 scenes per year) for that city and year. We retained only those pixels with the quality control (QC) flag ‘00’—indicating the highest quality under clear sky conditions—for the final analysis. This step is essential to ensure that the LST signals originate from the actual surface, free from atmospheric interference. It is important to note that following rigorous QC to remove pixels contaminated by clouds or other artifacts, the actual number of scenes used for averaging could be less than the theoretical maximum. This data availability varies by city, month, and year. In contrast, the air pollution data (PM2.5, PM10, NO2) were obtained as pre-processed monthly averages. Therefore, the annual mean for each pollutant was directly computed as the average of the 12 monthly values for each city and year.
2.3. Calculation of Thermal Environment Indicators
The MODIS MYD11A2 product is a Level 3 composite derived from the MODIS sensor, which has undergone rigorous atmospheric and geometric corrections. Its accuracy in retrieving LST data has been extensively validated across the globe []. Utilizing datasets of urban built-up boundaries, land use, and LST, we extracted monthly daytime LST (DLST) and nighttime LST (NLST) data within the built-up areas of all 370 cities, as well as the corresponding daytime and nighttime LST data in adjacent rural areas (denoted as and , respectively). The urban–rural temperature differences were then used to quantify the DUHI and NUHI. To avoid the ambiguity of simply using all rural pixels, we implemented a systematic multi-step screening approach for each city. Only rural areas dominated by well-vegetated surfaces, such as cropland, grassland, and forest are, were retained, which best represent the regional climatic background conditions. We sequentially excluded all pixels classified as built-up areas b, water bodies, industrial zones, airports, and bare soil.
2.4. Calculation of Urban Characteristic Indicators
Urban morphological characteristics are critical indicators influencing urban ventilation and heat dissipation. Based on the built-up area boundaries of each city, we calculated the UA for all cities. Additionally, we computed the perimeter () and area () of each built-up patch within every city. The mean fractal dimension was then derived to quantify US complexity.
2.5. Spatial Coupling Analysis
The coupling degree (C) quantifies the intensity of interaction and interdependence between systems or elements, reflecting the strength of their mutual influence. Given its applicability to synergistic relationships, the coupling coordination model has recently been employed to analyze the interactive constraints between air quality, urbanization, and the urban thermal environment []. In this study, to eliminate the influence of different units and magnitudes, we first standardized the original variables. The thermal subsystem is represented by the standardized UHI intensity (U) for each city, while the air pollution subsystem is represented by standardized concentrations of various pollutants (E). Specifically, we applied the min–max normalization method to scale all variables into a comparable range of [0, 1]. The coupling degree (C ∈ [0, 1]) was computed based on a coupling function, with higher values indicating stronger interactions between the two subsystems [].
Each indicator () was normalized using the min–max scaling method to derive standardized values () suitable for coupling degree calculations.
The calculation results of the coupling degree are usually divided into four levels: high-coordination type, medi-coordination type, low-coordination type, and incoordination type (Table 2). This classification standard is based on the classic application of coupling coordination degree models in environmental research [,].
Table 2.
Coupling types between urban thermal environments and air pollution.
2.6. Correlation Analysis
A correlation analysis was used to examine the quantitative relationship between two spatial phenomena. Pearson’s correlation coefficient (Pearson’s r) measures the strength and direction of the linear relationship between two variables () with a sample size of n. The value of r ranges from −1 to 1. A positive value (r > 0) indicates a positive correlation, a negative value (r < 0) indicates a negative correlation, and r = 0 indicates no linear correlation. The confidence level, denoted by the p-value, was used to assess statistical significance. A p-value < 0.05 indicates that the correlation is statistically significant, while a p-value > 0.05 suggests no statistical significance. This method was chosen as the primary analytical framework for its high interpretability and its suitability for providing a foundational, overarching assessment of the bivariate association between the urban thermal environment and air pollution across the nation. The Pearson correlation coefficient provides a standardized, intuitive measure and directly shows the extent to which two variables co-vary.
3. Results
3.1. Spatiotemporal Dynamics of Urban LST in China
Urban LST data exhibit distinct latitudinal zonality, generally decreasing northward. The DLST exceeds 30 °C near 25°N, declines to 26–30 °C around 30°N, and falls below 25 °C above 40°N (Figure 2a). Notable anomalies occur in high-altitude regions such as Tibet and arid areas such as western deserts. The NLST follows a similar gradient, remaining above 15 °C at low-latitudes, decreasing to 11–15 °C at mid-latitudes, and dropping below 0 °C north of 45°N (Figure 2b). The latitude, altitude, and land cover are primary controlling factors. At constant latitude, higher altitudes correspond to lower temperatures, while desert regions may exhibit relatively elevated temperatures.
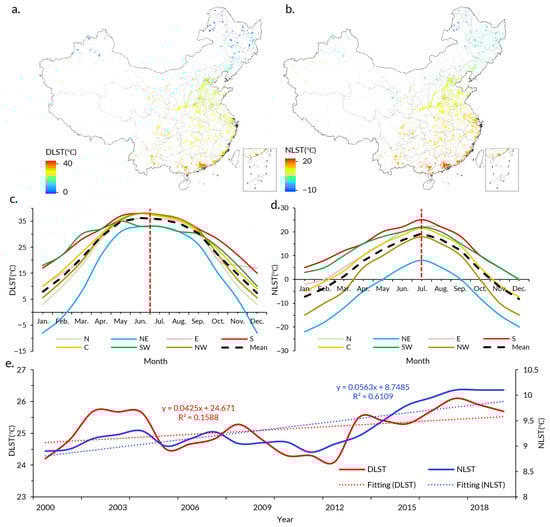
Figure 2.
Temporal and spatial change of urban LST data in China between 2000 and 2019: (a) the spatial distribution of the average DLST data in China; (b) the spatial distribution of the average NLST data in China; (c) the monthly changes in DLST in different regions; (d) the monthly changes in NLST in different regions; (e) the annual change trends of DLST and NLST data from 2000 to 2019. The red dashed lines in subfigures (c,d) represent the highest point positions of the corresponding LST.
Temporally, urban LST data in China exhibit pronounced seasonal variability (Figure 2c). The DLST peaks in summer (June to August, 34.92 °C) and reaches its lowest values in winter (December to February, 6.81 °C). Although similar in patterns, the magnitude of DLST data varies regionally. For instance, Southern China consistently shows higher DLST values than Northern China. The NLST also demonstrates significant seasonal fluctuations, with higher values in summer (19.43 °C) and lower in winter (−9.17 °C, Figure 2d). Both the DLST and NLST reach their annual maxima in mid-June. From 2000 to 2019, the annual mean LST increased (Figure 2e). Notably, the long-term trends of DLST and NLST data differ, with the NLST exhibiting a more pronounced warming tendency.
3.2. Spatiotemporal Dynamics of UHI Data in China
Spatially, the urban UHI intensity in China ranges from 0 to 8 °C for both the DUHI and NUHI, but exhibits distinct spatial patterns. The daytime UHI intensity (DUHI) concentrates in eastern coastal regions and densely urbanized inland areas such as the Yangtze River Delta (Figure 3a). These regions exhibit scattered and fragmented patterns of high DUHI values. The dispersed distribution likely results from solar radiation and heterogeneous urban surface, limiting spatial clustering of DUHI. In contrast, the NUHI displays more concentrated, extensive patterns in regions such as Beijing–Tianjin–Hebei, Northeastern China (Figure 3b), and Northwestern China. These contiguous zones indicate that NUHI levels are stronger and more spatially coherent. This pattern can be attributed to enhanced radiative cooling differences between urban and rural areas at night, slower heat release in cities due to anthropogenic activities and built-up materials, and the resulting persistence and spatial extension of heat island effects during nighttime.
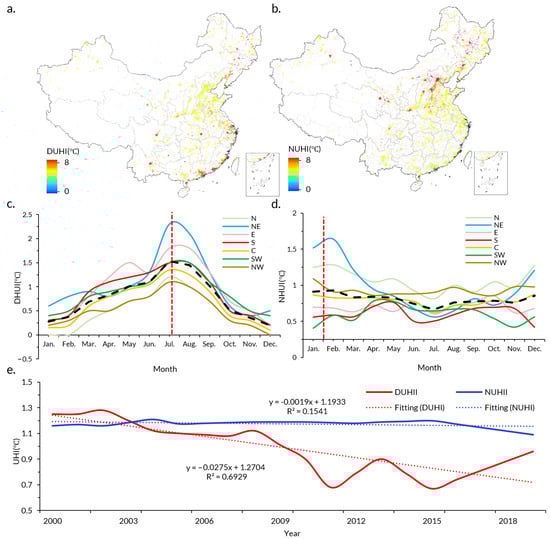
Figure 3.
Temporal and spatial change of UHI in China between 2000–2019: (a) the spatial distribution of the average DUHI data in China; (b) the spatial distribution of the average NUHI data in China; (c) the monthly changes in DUHI in different regions; (d) the monthly changes in NUHI in different regions; (e) the annual change trends of DUHI and NUHI from 2000 to 2019. The red dashed lines in subfigures (c,d) represent the highest point positions of the corresponding LST.
Temporally, the UHI data in China exhibit pronounced seasonal variability (Figure 3c). The DUHI peaks in summer (June to August, 1.26 °C) and reaches its lowest values in winter (December to February, 0.25 °C). The DUHI levels reach their annual maximum in July, delayed by half a month from the DLST ‘s peak time. Although the seasonal patterns are similar nationwide, DUHI magnitudes vary regionally. For instance, Northeast China shows higher DLST than Northwest China. The NUHI remains relatively stable annually, averaging around 0.8 °C (Figure 3d). However, Northeast China showed a trend of first decreasing and then increasing, reaching its lowest point in July (0.58 °C) and its highest point in mid-January (1.70 °C). From 2000 to 2019, the annual mean UHI intensity decreased overall (Figure 3e). Notably, the long-term trends of DUHI and NUHI data differ, with the DUHI exhibiting a more pronounced decreasing tendency.
3.3. Spatiotemporal Dynamics of Urban Air Pollution in China
The spatial distributions of PM2.5, PM10, and NO2 across China during summer (June–August) exhibit pronounced regional heterogeneity. Elevated concentrations of PM2.5 and PM10 were predominantly clustered in Northwest and Northern China (Figure 4a,b). The northwestern hotspots, encompassing Kashgar, Hotan, Aksu, and Bayingolin, stem mainly from natural dust due to the arid climate and sparse vegetation. In contrast, northern and southwestern pollution comes from anthropogenic activities, including industrial emissions and fossil fuel combustion. NO2 hotspots are spread widely across Northern, Central, Eastern, and Southern China. Levels are especially high in cities such as Suzhou, Tangshan, Tianjin, Shanghai, and Wuxi (Figure 4c). Approximately 1.37% of cities exceeded the Grade II limit (40 μg/cm3) specified in China’s Ambient Air Quality Standards (GB 3095-2012) []. This NO2 pollution largely originated from fossil fuel combustion and vehicular emissions.
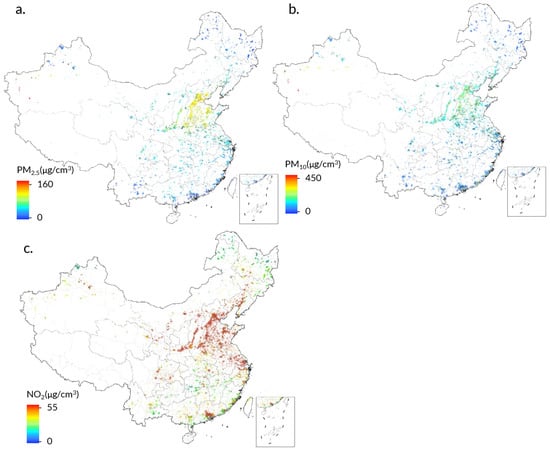
Figure 4.
Spatial distribution of average air pollutants in China in summer during 2000–2019: (a–c) the spatial distributions of PM2.5, PM10, and NO2, respectively.
Air pollutants in China exhibit pronounced seasonal variations (Figure 5). PM2.5 concentrations are higher in winter (73.81 μg/cm3) and lower in summer (35.22 μg/cm3, Figure 5a). Although the seasonal patterns of PM2.5 are similar nationally, concentrations are higher in Northern and Northwest China than in southern and southwestern regions. PM10 concentrations also display strong seasonal variability, with elevated levels in winter (118.19 μg/cm3) and reduced levels in summer (61.57 μg/cm3, Figure 5b). NO2 exhibits a more complex pattern, increasing in winter (peak: 43.23 μg/cm3) and decreasing in summer (low: 23.80 μg/cm3), but with a smaller amplitude than for PM2.5 and PM10 (Figure 5c). Regional disparities are evident, with higher NO2 concentrations in Northern China, likely linked to intensive industrial and vehicular emissions. Interannually, PM10 levels decreased slightly (Figure 5d), potentially reflecting air quality policies. In contrast, NO2 levels increased markedly, tracking economic growth and rising vehicle numbers. These divergent trends highlight differing responses of pollutants to socioeconomic development and environmental regulation.
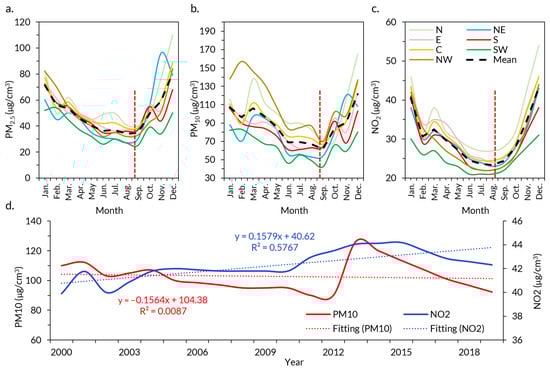
Figure 5.
Changes in average air pollutants in China: (a–c) the monthly trends of changes in PM2.5, PM10, and NO2, respectively. (d). the yearly trends of changes in PM2.5 and PM10, respectively. The red dashed lines in subfigures (a–c) represent the lowest point positions of the corresponding LST.
3.4. Temporal Consistency Between the Thermal Environment and Air Pollutant Changes
On a monthly climatological scale across the year, significant associations can be observed between air pollutants and the thermal environment (Figure 6). Both DLST and NLST levels decrease significantly with increasing concentrations of PM2.5, PM10, and NO2. PM2.5 shows the strongest coupling, with high coefficients of determination (R2 = 0.9205 for DLST and R2 = 0.9419 for NLST). The DUHI decreases with rising pollutant concentrations, most notably with PM2.5 (R2 = 0.8666), suggesting that elevated pollution levels attenuate the DUHI effect. In contrast, the NUHI shows a weak positive correlation with pollutants such as PM2.5 (R2 = 0.4548). These findings indicate that higher pollutant concentrations over the monthly cycle cool surface temperatures (DLST, NLST) and suppress the DUHI but slightly intensify the NUHI.
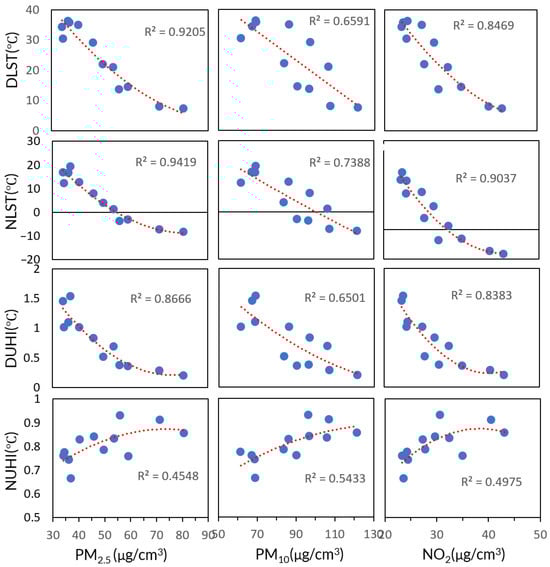
Figure 6.
Monthly climatology consistency between the air pollutant concentration and thermal environment in Chinese cities during the year. Seasonality is not removed.
An analysis of long-term time series data from 2000 to 2019 revealed a significant and progressively strengthening coupling mechanism between air pollutants and the urban thermal environment. The correlation coefficients between pollutant concentrations and thermal indicators exhibit consistent positive trends (slopes > 0; R2: 0.68 with DLST, 0.61 with NLST, 0.59 with DUHI, and 0.67 with NUHI), indicating a systematic intensification of this synergistic relationship (Figure 7a–d). Particulate matter maintains strong correlations with thermal metrics (mean r: 0.15 with DLST, 0.13 with NLST, 0.03 with DUHI, and 0.25 with NUHI). These correlations are also strengthening over time (slopes > 0; R2: 0.08 with DLST, 0.25 with NLST, 0.33 with DUHI, and 0.50 with NUHI). While the trend with the DLST is weak (R2 = 0.08, Figure 7a), the correlation with the NUHI has strengthened notably (R2 = 0.50, Figure 7d), suggesting a significant thermal greenhouse effect from particulates at night. Nitrogen oxides have shifted to strongly positive and strengthening associations (slopes > 0; R2: 0.53 with DLST, 0.73 with NLST, 0.32 with DUHI, and 0.62 with NUHI). This reflects a reinforced coupling mechanism, likely driven by concurrent anthropogenic heat and pollutant emissions. These findings underscore the necessity of integrated policies targeting co-reductions in air pollution and urban heat island effects, particularly nighttime emissions, to support the development of low-carbon, climate-resilient cities.
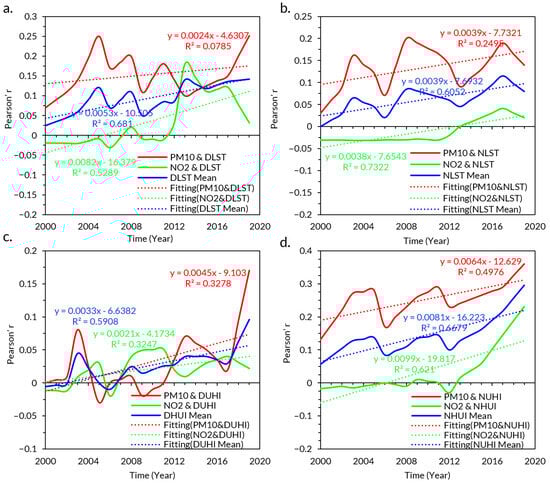
Figure 7.
The interannual trend of correlation between the urban thermal environment and air pollutants in China during 2000–2019: (a) the trend of the correlation between air pollutants and DLST; (b) the trend of the correlation between air pollutants and NLST; (c) the trend of the correlation between air pollutants and DUHI; (d) the trend of the correlation between air pollutants and NUHI. The positive slopes of all trend lines are statistically significant (p < 0.05). The correlation between the thermal environment and pollutant environment gradually shifted from an insignificant correlation to significant correlation (p < 0.05), and all types of correlations after 2013 showed significance (p < 0.05).
3.5. Spatial Coupling Degree Between Thermal Environment and Air Pollutant
Spatially, the coupling between the UHI intensity and PM2.5 and PM10 exhibits similar geographic patterns (Figure 8). Over 90% of Chinese cities fall into the high-coordination category, except for some in the southwestern region, which suggests that the interaction between the urban thermal environment and air pollution is the predominant pattern across China. For DUHI, the proportions of cities exhibiting high coordination between DUHI and air pollutants are as follows: PM2.5 (90.08%) < NO2 (91.53%) < PM10 (96.31%). In contrast, far fewer cities show medi-coordination (PM10 (1.91%) < NO2 (6.73%) < PM2.5 (8.17%)). Notably, the proportion of cities with medi-coordination between DUHI and PM2.5 or NO2 is slightly higher than that for PM10. No cities exhibited a lack of coordination between the DUHI and any these pollutants.
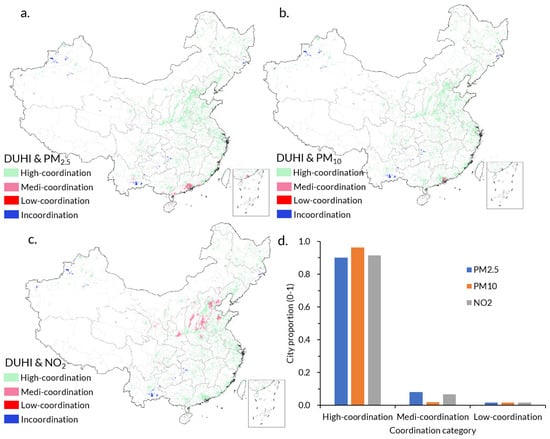
Figure 8.
Spatial coupling of daytime urban heat pollution environment in China: (a) the spatial coupling between DUHI and PM2.5; (b) the spatial coupling between DUHI and PM10; (c) the spatial coupling between DUHI and NO2; (d) the proportion statistics of different coupling levels between DUHI and urban air pollutant concentrations.
For the NUHI, high coordination is widespread with particulate matter levels (PM2.5: 95.97%; PM10: 96.83%) but less so with NO2 (55.69%). Those with medi-coordination follow the trend of PM10 (1.40%) < PM2.5 (2.28%) < NO2 (42.56%). In contrast, medi-coordination with NO2 is 18 and 30 times more frequent than with PM2.5 and PM10, respectively. This indicates that NO2 substantially enhances the probability of coordinated heat–pollution amplification during nights. Urban managers should prioritize integrated strategies that simultaneously target NUHI and NO2 pollution (Figure 9).
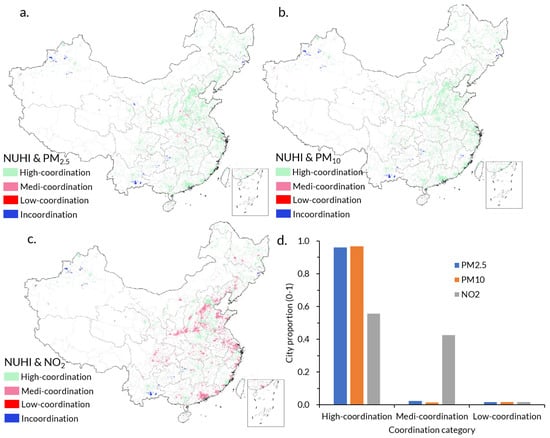
Figure 9.
Spatial coupling of nighttime urban heat–pollution environment in China: (a) the spatial coupling between NUHI and PM2.5; (b) the spatial coupling between NUHI and PM10; (c) the spatial coupling between NUHI and NO2; (d) the proportion statistics of different coupling levels between NUHI and urban air pollutant concentrations.
3.6. Synergistic Driving Factors of Thermal Pollution Environment Dynamics
The correlation analysis systematically revealed the multifactorial synergistic mechanisms underlying the urban heat–pollution nexus (Table 3). Anthropogenic activities showed the strongest associations, with PD and NAI exhibiting strong positive correlations with NO2 pollution (r = 0.51 and 0.47, respectively; p < 0.01). This indicates that energy consumption use from human activities jointly worsens UHI effects and air pollution. The urban form also significantly aggravates environmental issues. The US and BD show positive correlations with thermal pollution (US and NO2: r = 0.38, p < 0.01). These findings support planning strategies that control expansion, optimize the morphology, and reduce the building density.
Table 3.
The correlations between various factors and urban heat–pollution environments.
Urban heat–pollution interactions diverge diurnally. Daytime heating is more influenced by urban structures, while nighttime heating is driven by energy input (solar radiation: r = 0.71, p < 0.05) and anthropogenic activities. Natural factors provide effective mitigation effects. Wing most significantly alleviates daytime heating (r = −0.65, p < 0.01), supporting ventilation corridors. The tree cover provides substantial cooling (r = −0.56, p < 0.01), and precipitation strongly suppresses the NUHI (r = −0.76, p < 0.01), validating sponge city infrastructures. From a governance perspective, reducing emissions at the source—such as constraining industrial land use (IP and NO2: r = 0.31, p < 0.01)—should be prioritized. In existing built-up areas, particularly high-density residential zones (RP and NO2: r = 0.41, p < 0.01), “urban cooling systems” with green spaces and water bodies can mitigate impacts. Ultimately, an integrated strategy of “emission reduction–green infrastructure–ventilation enhancement” can disrupt the heat–pollution–carbon feedback loop and facilitate the development of low-carbon, climate-resilient cities.
4. Discussion
4.1. Theoretical Application
The observed overall increase in LST alongside a decrease in UHI intensity presents an intriguing paradox. This pattern indicates that non-urban (rural) areas have warmed faster than urban areas over the study period, thereby reducing the average urban–rural temperature difference. While background warming elevated the annual mean LST more rapidly at night than during the day, the urban–rural temperature difference (UHI intensity) declined overall, suggesting a faster warming rate in non-urban areas. The decline in DUHI is also likely attributable to large-scale urban greening initiatives [,,], the increased albedo of modern building materials [,], and possibly the cooling effect of aerosols [], which our monthly analysis confirmed was significant. The more modest decline in NUHI aligns with its different driving mechanisms. The NUHI is dependent more on the heat release from urban fabrics and direct anthropogenic heat []. The persistence of these factors, compounded by the potential radiative forcing of pollutants such as PM2.5 and NO2 at night, makes the NUHI more resilient to mitigation efforts, explaining its weaker declining trend.
A key finding is the strong and strengthening coupling between NO2 and the NUHI. Over 40% of cities showed a medi-coordination relationship. This can be explained by a shared anthropogenic origin and reinforcing physical mechanisms. NO2 is primarily emitted from high-temperature combustion processes [], which simultaneously release substantial waste heat that directly contributes to the NUHI [,]. Furthermore, NO2, as a key precursor for nitrate aerosol formation and an absorber of solar radiation, can influence atmospheric stability and radiative forcing. At night, the collapse of the atmospheric boundary layer traps both pollutants and heat near the surface, creating a synergistic “pollution–heat dome” effect [,,]. This co-location and mutual reinforcement of potential interaction strategies targeting NO2 emissions could yield significant co-benefits for both air quality and nighttime thermal comfort.
Our results show the dual role of particulate matter. Monthly, the strong negative correlation (R2 > 0.92 between PM2.5 and LST) confirms the “global dimming” effect, where aerosols scatter and absorb solar radiation, cooling surfaces and dampening the DUHI [,]. However, the PM–NUHI correlation strengthened long-term (trend R2 = 0.50), suggesting a more complex interaction. This strengthening may be linked to the atmospheric warming effect of aerosols, which can stabilize the lower atmosphere, suppress convective mixing, and enhance the greenhouse effect, thereby exacerbating the nighttime heat island phenomenon.
4.2. Implications for Environmental Management
Our study reveals strong coupling between the NUHI effect and NO2 in China. This coupling shows moderate coordination in 42.56% of cities and a strengthening long-term synergistic trend (R2 = 0.62). Anthropogenic activities and the urban form are primary drivers. For example, population density correlates with NO2 (r = 0.51), and building density with daytime UHIs (r = 0.27). Conversely, wind speed (r = −0.65 with daytime UHIs) and vegetation cover (r = −0.56) are key natural mitigating factors.
This study recommends time-specific strategies. Daytime strategies should focus on ventilation corridors and particulate matter control. Nighttime strategies should prioritize NO2 reduction and “sponge city” infrastructure for evaporative cooling [,]. Furthermore, urban planning optimization, such as establishing urban growth boundaries and mandating green space ratios, along with a data-driven dynamic monitoring system, should be adopted to break down administrative barriers. This integrated approach creates a synergistic governance framework of “emission reduction–green expansion–ventilation enhancement,” ultimately achieving co-control of heat, pollution, and carbon emissions.
4.3. Policy Governance Suggestions
4.3.1. Controlling Anthropogenic Heat–Pollution–Carbon Synergy
Effective mitigation efforts must prioritize curtailing emissions at their source. Our analysis identified a strong positive correlation between indicators of anthropogenic activity—specifically population density, nighttime activity intensity, and carbon emissions—and NO2 pollution (r = 0.51, 0.47, and 0.48, respectively; p < 0.01). This shows that energy consumption from transportation, building operations, and nighttime economic activities is a primary driver of the synergistic heat–pollution nexus. The most robust finding of this study is the strong and strengthening coupling between the NUHI and NO2. Therefore, moving beyond generic emission control, policies must specifically target sectors with characteristic nighttime emission peaks. Policy interventions should focus on decarbonizing nighttime energy and transportation systems, including the large-scale adoption of electric public transit, stringent enforcement of building energy efficiency standards, and incentivizing low-carbon technologies for nighttime operations. Furthermore, the significant correlation between industrial land use and NO2 levels (r = 0.31, p < 0.01) highlights the necessity for industrial restructuring and spatial relocation, whereby high-emission facilities are upgraded or relocated away from environmentally sensitive urban cores to mitigate both pollutant and waste heat generation.
4.3.2. Regulating the Urban Form and Land Use
The urban spatial configuration is a critical amplifier of the heat–pollution synergy. Our results demonstrate that the US and high BD significantly exacerbate UHIs and air pollution, with the US showing a strong correlation with NO2 (r = 0.38, p < 0.01) and BD positively correlated with the daytime UHI intensity (DUHI, r = 0.27, p < 0.05). These findings provide robust evidence for planning strategies aimed at containing urban expansion [,], optimizing morphological compactness, and reducing development intensity. This can be achieved by instituting urban growth boundaries, promoting polycentric development models, and avoiding excessive densification that impedes ventilation. Ventilation corridors aligned with prevailing winds must be mandated and protected, with strict building height and density controls within them, to leverage the cooling effect of wind. Urban growth boundaries must be implemented to curb sprawl and promote compact, polycentric development, thereby reducing the complexity of the urban shape and associated pollution trapping. At the parcel level, the strong link between residential land (RP) and NO2 (r = 0.41, p < 0.01), contrasted with the significant cooling effect of tree cover (TP, r = −0.56 with DUHI, p < 0.01), necessitates the implementation of mandatory green space ratios in high-density zones. Integrating green roofs, vertical greening, and pocket parks into built-up areas can effectively offset environmental pressures through enhanced ecosystem services.
4.3.3. Systematically Enhancing the Natural Mitigation Capacity
Natural elements provide efficient and cost-effective environmental regulators. Wind speed strongly negatively correlates with the daytime UHI intensity (r = −0.65, p < 0.01). This underscores the need to establish and protect urban ventilation corridors. Urban planning should identify and protect wind paths along prevailing directions. It must also control building heights and densities in these corridors to maintain aerodynamic permeability. Simultaneously, the potent suppressive effect of precipitation (P) on the nighttime UHI intensity (NUHI, r = −0.76, p < 0.01) highlights the efficacy of evaporative cooling. This finding supports the large-scale implementing “sponge city” principles and distributed cool island networks. Specific strategies should maximize permeable surfaces, rainwater gardens, wetland parks, and retention ponds to prolong the presence of surface water, and integrate blue-green infrastructures to form a cooling network that mitigates urban temperatures.
4.3.4. Towards a Multi-Dimensional Governance Framework
Effective implementation requires institutional innovation and policy coordination. The coupled nature of the heat–pollution–carbon nexus demands breaking down administrative silos in environmental management. We must integrate UHI mitigation efforts, air quality standards, and carbon reduction targets into a unified urban planning and governance framework. Governance efforts should also be adaptive and time-specific. Daytime strategies should prioritize shading and ventilation. Nighttime strategies should focus on energy management and evaporative cooling. Crucially, a data-driven, dynamic monitoring and evaluation system must be established. Remote sensing and IoT technologies can be used to track UHI and pollution dynamics. This will enable the identification of intervention zones, facilitate targeted actions, and create a feedback loop for policy refinement. Ultimately, this will steer development toward low-carbon and climate-resilient pathways.
4.4. Limitations and Uncertainties
This study provides a comprehensive national-scale analysis of the spatiotemporal heat–pollution coupling in China. However, some limitations remain. This study may overlook intra-urban heterogeneity. Local effects such as microclimatic variations induced by specific architectural styles, street canyon geometries, or highly localized pollution sources are not captured in this macro-scale analysis. This may mask key local interaction mechanisms, thereby keeping policy recommendations at the strategic level. Further refined research will be conducted on key areas in the future.
The air pollution data mainly come from ground monitoring networks. These networks are unevenly distributed, with higher density levels in eastern cities and sparser coverage in western and rural areas. This study identifies associations and synergies but not causality, due to the complex, bidirectional heat–pollution interactions. Future research could address these limitations by integrating higher-resolution data, multi-level modeling, and mechanistic experiments to better elucidate causal pathways and refine intervention strategies.
Secondly, this study integrates cross-sectional data from different years (e.g., urban morphology data from ~2018–2020) with long-term time-series data (2000–2019 for LST and pollutants). While we assume that urban structural and natural factors are relatively stable and representative over the study period, this temporal mismatch might attenuate the strength of the identified correlations in the driver analysis. Future research would benefit from utilizing fully synchronous time series data for all variables to more precisely quantify these relationships.
5. Conclusions
This study reveals a tightening synergy between urban heat and air pollution in China. We observed a decoupled trend, with rising background temperatures alongside declining urban–rural differences (UHI), with the daytime UHI intensity (DUHI) decreasing more than its nighttime counterpart (NUHI). Critically, this long-term analysis shows that this synergy is strengthening, especially between particulate matter and the NUHI.
A key finding is the dual role of pollutants. Monthly, they show a strongly negative correlation with LST, suppressing the DUHI, yet slightly intensifying the NUHI. More critically, the long-term trend analysis uncovered a consistently strengthening positive correlation, particularly between particulate matter and the NUHI (R2 = 0.50), indicating an evolving synergy. Spatially, over 90% of cities showed high coordination between UHIs and particulate matter. This pattern was driven by anthropogenic emissions, the urban form, and variable natural mitigation.
Our findings underscore that the heat–pollution nexus is not static but a reinforcing system, which is especially potent at night. Thus, isolated policies are inadequate. Achieving sustainable, low-carbon, and climate-resilient urban development in China necessitates integrated governance. This requires simultaneous action to reduce emissions, optimize spatial structures, and enhance ecological regulations to disrupt this feedback loop. These insights also apply to other rapidly urbanizing regions globally.
Author Contributions
Conceptualization, S.L.; methodology, J.Z.; software, W.C.; validation, S.D.; data curation, S.L.; writing—original draft preparation, S.L.; writing—review and editing, L.W. and S.L.; visualization, J.Z.; supervision, W.C.; funding acquisition, S.L. All authors have read and agreed to the published version of the manuscript.
Funding
This research was funded by the National Natural Science Foundation of China, grant number U2244230 and 42401082; and the Open Funds of the Key Laboratory of Mountain Hazards and Engineering Resilience, Chinese Academy of Sciences, grant number KLMHER-K17.
Data Availability Statement
The data supporting the findings of this study were obtained from multiple public sources. The land surface temperature data come from the surface temperature product of MDOIS (https://lpdaac.usgs.gov/products/myd11a2v061/ accessed on 21 May 2025). Air pollution data come from the air quality project released by the Chinese Ministry of Environmental Protection (https://www.cnemc.cn/ accessed on 23 February 2025). Urban boundary data come from the Global Urban Boundaries (http://data.ess.tsinghua.edu.cn/ accessed on 17 January 2025). The 3D building data come from the Multi-Attribute Building dataset (CMAB) in China (https://arxiv.org/abs/2408.05891v1 accessed on 23 February 2025). DEM data comes from the Global Digital Elevation Model (https://srtm.csi.cgiar.org/ accessed on 21 May 2025). We have provided detailed sources and links for other auxiliary data in the data sources section.
Acknowledgments
We confirm that all individuals mentioned in the acknowledgements section have consented to their inclusion. Additionally, we also want to thank the anonymous reviewers for their valuable suggestions and comments that contributed to improving the quality of the manuscript.
Conflicts of Interest
The authors declare no conflicts of interest.
Abbreviations
The following abbreviations are used in this manuscript:
| LST | Land surface temperature |
| NLST | Nighttime LST |
| DLST | Daytime LST |
| UHI | Urban heat island |
| NUHI | Nighttime UHI intensity |
| DUHI | Daytime UHI intensity |
| UA | Urban area |
| US | Urban shape |
| BD | 3D building density |
| DEM | Digital elevation model |
| T | Temperature |
| P | Precipitation |
| WS | Wind speed |
| TSR | Total solar radiation |
| PD | Population density |
| NAI | Nighttime activity intensity |
| CE | Carbon emission |
| TP | Tree cover proportion |
| RP | Residential proportion |
| IP | Industrial proportion |
References
- Abbassi, Y.; Ahmadikia, H.; Baniasadi, E. Impact of wind speed on urban heat and pollution islands. Urban Clim. 2022, 44, 101200. [Google Scholar] [CrossRef]
- Arunab, K.S.; Mathew, A. Quantifying urban heat island and pollutant nexus: A novel geospatial approach. Sustain. Cities Soc. 2024, 101, 105117. [Google Scholar] [CrossRef]
- Bagienski, Z. Traffic air quality index. Sci. Total Environ. 2015, 505, 606–614. [Google Scholar] [CrossRef] [PubMed]
- Biagi, B.; Brattich, E.; Cintolesi, C.; Barbano, F.; Di Sabatino, S. Dynamical and chemical impacts of urban green areas on air pollution in a city environment. Urban Clim. 2025, 60, 102343. [Google Scholar] [CrossRef]
- Ciacci, C.; Banti, N.; Di Naso, V.; Bazzocchi, F. Green strategies for improving urban microclimate and air quality: A case study of an Italian industrial district and facility. Build. Environ. 2023, 244, 110762. [Google Scholar] [CrossRef]
- Fan, Y.F.; Hunt, J.L.; Wang, Q.; Yin, S.; Li, Y.G. Water tank modelling of variations in inversion breakup over a circular city. Build. Environ. 2019, 164, 106342. [Google Scholar] [CrossRef]
- Chen, W.; Zhang, J.J.; Huang, C.Y.; Fu, S.; Liang, S.; Wang, K. Measuring heat transfer index (HTI): A new method to quantify the spatial influence of land surface temperature between adjacent urban spaces. Sustain. Cities Soc. 2025, 122, 106268. [Google Scholar] [CrossRef]
- Han, L.; Zhang, R.J.; Wang, J.Q.; Cao, S.J. Spatial synergistic effect of urban green space ecosystem on air pollution and heat island effect. Urban Clim. 2024, 55, 101940. [Google Scholar] [CrossRef]
- Gobakis, K.; Kolokotsa, D.; Synnefa, A.; Saliari, M.; Giannopoulou, K.; Santamouris, M. Development of a model for urban heat island prediction using neural network techniques. Sustain. Cities Soc. 2011, 1, 104–115. [Google Scholar] [CrossRef]
- Liu, S.; Zhang, J.; Li, J.; Li, Y.; Zhang, J.; Wu, X. Simulating and mitigating extreme urban heat island effects in a factory area based on machine learning. Build. Environ. 2021, 202, 108051. [Google Scholar] [CrossRef]
- Jiang, Y.; Lin, W.P.; Xu, D.; Xu, D. Spatio-temporal variation of the relationship between air pollutants and land surface temperature in the Yangtze River Delta Urban Agglomeration, China. Sustain. Cities Soc. 2023, 91, 104429. [Google Scholar] [CrossRef]
- Lai, L.W.; Cheng, W.L. Air quality influenced by urban heat island coupled with synoptic weather patterns. Sci. Total Environ. 2009, 407, 2724–2733. [Google Scholar] [CrossRef]
- Lopes, H.S.; Vidal, D.G.; Cherif, N.; Silva, L.; Remoaldo, P.C. Green infrastructure and its influence on urban heat island, heat risk, and air pollution: A case study of Porto (Portugal). J. Environ. Manag. 2025, 376, 124446. [Google Scholar] [CrossRef] [PubMed]
- Luan, Q.Z.; Yang, M.C.; Feng, T.Q.; Huang, W.L. Analysis of the urban turbidity island effect: A case study in Beijing City, China. Environ. Res. Lett. 2023, 18, 024010. [Google Scholar] [CrossRef]
- Milesi, C.; Churkina, G. Measuring and Monitoring Urban Impacts on Climate Change from Space. Remote Sens. 2020, 12, 3494. [Google Scholar] [CrossRef]
- Park, K.; Baik, J.J. Nonlinear changes in urban heat island intensity, urban breeze intensity, and urban air pollutant concentration with roof albedo. Sci. Rep. 2024, 14, 24911. [Google Scholar] [CrossRef]
- Parida, B.R.; Bar, S.; Kaskaoutis, D.; Pandey, A.C.; Polade, S.D.; Goswami, S. Impact of COVID-19 induced lockdown on land surface temperature, aerosol, and urban heat in Europe and North America. Sustain. Cities Soc. 2021, 75, 103336. [Google Scholar] [CrossRef]
- Shen, P.Y.; Wang, M.L.; Ma, H.; Ma, N. On the two-way interactions of urban thermal environment and air pollution: A review of synergies for identifying climate-resilient mitigation strategies. Build. Simul. 2025, 18, 259–279. [Google Scholar] [CrossRef]
- Chen, W.; Zhang, J.J.; Zhang, Y.P.; Fu, S.; Yi, K.X.; Dai, Y.X. Heating pattern and effects of built-up land in response to influencing factors: A statistical estimation of 172 Chinese cities. J. Clean. Prod. 2024, 474, 143589. [Google Scholar] [CrossRef]
- Suthar, G.; Kaul, N.; Khandelwal, S.; Singh, S. Predicting land surface temperature and examining its relationship with air pollution and urban parameters in Bengaluru: A machine learning approach. Urban Clim. 2024, 53, 101830. [Google Scholar] [CrossRef]
- Simpson, C.H.; Brousse, O.; Heaviside, C. Estimated mortality attributable to the urban heat island during the record-breaking 2022 heatwave in London. Environ. Res. Lett. 2024, 19, 094047. [Google Scholar] [CrossRef]
- Suthar, G.; Singh, S.; Kaul, N.; Khandelwal, S. Understanding the multifaceted influence of urbanization, spectral indices, and air pollutants on land surface temperature variability in Hyderabad, India. J. Clean. Prod. 2024, 470, 143284. [Google Scholar] [CrossRef]
- Taha, H. Cool Cities: Counteracting Potential Climate Change and its Health Impacts. Curr. Clim. Change Rep. 2015, 1, 163–175. [Google Scholar] [CrossRef]
- Tang, Y.F.; Chen, H.; Yang, M.; Tan, Z.C.; Zhao, F.Y.; Guo, J.H.; Fang, Y.P. Weak geostrophic wind driven ventilation in street canyons with trees and green walls: Cooperating or opposing dispersions of airborne pollutants? Build. Environ. 2024, 259, 111654. [Google Scholar] [CrossRef]
- Wang, Y.; Li, Y.; Di Sabatino, S.; Martilli, A.; Chan, P.W. Effects of anthropogenic heat due to air-conditioning systems on an extreme high temperature event in Hong Kong. Environ. Res. Lett. 2018, 13, 034015. [Google Scholar] [CrossRef]
- Wang, Y.Y.; Guo, Z.Y.; Han, J. The relationship between urban heat island and air pollutants and them with influencing factors in the Yangtze River Delta, China. Ecol. Indic. 2021, 129, 107976. [Google Scholar] [CrossRef]
- Ngarambe, J.; Joen, S.J.; Han, C.H.; Yun, G.Y. Exploring the relationship between particulate matter, CO, SO2, NO2, O3 and urban heat island in Seoul, Korea. J. Hazard. Mater. 2021, 403, 123615. [Google Scholar] [CrossRef]
- Weng, Q.H.; Firozjaei, M.K.; Sedighi, A.; Kiavarz, M.; Alavipanah, S.K. Statistical analysis of surface urban heat island intensity variations: A case study of Babol city, Iran. GIScience Remote Sens. 2019, 56, 576–604. [Google Scholar] [CrossRef]
- Wu, S.H.; Wang, Y.; Chen, C.W.; Cao, Z.X.; Cao, J.X.; Yu, Z.L.; Song, H. Valley city ventilation under the calm and stable weather conditions: A review. Build. Environ. 2021, 194, 107668. [Google Scholar] [CrossRef]
- Wu, Q.Y.; Huang, Y.H.; Irga, P.; Kumar, P.; Li, W.G.; Wei, W.; Shon, H.K.; Lei, C.W.; Zhou, J.L. Synergistic control of urban heat island and urban pollution island effects using green infrastructure. J. Environ. Manag. 2024, 370, 122985. [Google Scholar] [CrossRef]
- Zhang, P.Y.; Zhang, J.B.; Liu, Z.Y.; Liu, Y.; Chen, Z. Relationship between land surface temperature and air quality in urban and suburban areas: Dynamic changes and interaction effects. Sustain. Cities Soc. 2025, 118, 106043. [Google Scholar] [CrossRef]
- Yin, M.Q.; He, B.J. Performance-based urban ventilation corridor for actual achievement of environmental benefits. Build. Environ. 2025, 270, 112536. [Google Scholar] [CrossRef]
- Zhong, S.; Qian, Y.; Sarangi, C.; Zhao, C.; Leung, R.; Wang, H.L.; Yan, H.P.; Yang, T.; Yang, B. Urbanization Effect on Winter Haze in the Yangtze River Delta Region of China. Geophys. Res. Lett. 2018, 45, 6710–6718. [Google Scholar] [CrossRef]
- Wan, Z. New refinements and validation of the collection-6 MODIS land-surface temperature/emissivity product. Remote Sens. Environ. 2014, 140, 36–45. [Google Scholar] [CrossRef]
- Fang, Y.H.; Gu, K.K. Exploring coupling effect between urban heat island effect and PM2.5 concentrations from the perspective of spatial environment. Environ. Eng. Res. 2022, 27, 200559. [Google Scholar] [CrossRef]
- Wu, Q.; Hong, S.; Yang, L.; Mu, H.; Huang, C.; Niu, X.; Zhong, Y.; Yi, J.; He, C. Coupling coordination relationships between air pollutant concentrations and emissions in China. Atmos. Pollut. Res. 2023, 14, 101678. [Google Scholar] [CrossRef]
- Sun, Q.; Zhao, X.; Hua, Y. Dynamic Coupling Between Atmospheric CO2 Concentration and Land Surface Temperature in Major Urban Agglomerations in China: Insights for Sustainable Urban Development. Sustainability 2024, 16, 9484. [Google Scholar] [CrossRef]
- GB 3095-2012; China’s Ambient Air Quality Standards. Ministry of Ecology and Environment of the People’s Republic of China: Beijing, China, 2012.
- Zhang, X.; Brandt, M.; Tong, X.; Tong, X.; Zhang, W.; Reiner, F.; Li, S.; Tian, F.; Yue, Y.; Zhou, W.; et al. A strong but uneven increase in urban tree cover in China over the recent decade. Nature Cities 2025, 2, 460–469. [Google Scholar] [CrossRef]
- Liu, S.D.; Zhang, J.; Wang, L.; Ciais, P.; Zhang, J.J.; Penuelas, J.; Nath, B.; Jacquet, I.; Wu, X.; Ding, S.P.; et al. Mapping previously undetected trees reveals overlooked changes in pan-tropical tree cover. Nat. Commun. 2025, 16, 5561. [Google Scholar] [CrossRef]
- Liu, S.; Zhang, J.; Wu, X.; Chen, W.; Jie, Z. Potential thermal constraints for sustainable industrial city: Refined simulation and prediction of extreme urban heat island effect. Sustain. Cities Soc. 2024, 105, 105342. [Google Scholar] [CrossRef]
- Liu, S.; Zhang, J.; Wang, K.; Wu, X.; Chen, W.; Liang, S.; Zhang, Y.; Fu, S. Structural indicator synergy for mitigating extreme urban heat island effects in industrial city: Simulation and verification based on machine learning. Ecol. Indicators 2023, 157, 111216. [Google Scholar] [CrossRef]
- Liu, S.; Zhang, J.; Zhang, J. New sights on the impact of spatial composition of production factors for socioeconomic recovery in the post-epidemic era: A case study of cities in central and eastern China. Sustain. Cities Soc. 2022, 85, 104061. [Google Scholar] [CrossRef]
- Ma, Y.J.; Xin, J.Y.; Wang, Z.F.; Tian, Y.L.; Wu, L.; Tang, G.Q.; Zhang, W.Y.; de Arellano, J.V.G.; Zhao, D.D.; Jia, D.J.; et al. How do aerosols above the residual layer affect the planetary boundary layer height? Sci. Tot. Environ. 2022, 814, 151953. [Google Scholar] [CrossRef]
- Sethi, S.S.; Vinoj, V. Transported dust modulates aerosol pollution domes over rapidly urbanizing Indian cities. Commun. Earth Environ. 2025, 6, 554. [Google Scholar] [CrossRef]
- Alpert, P.; Kishcha, P.; Kaufman, Y.J.; Schwarzbard, R. Global dimming or local dimming?: Effect of urbanization on sunlight availability. Geophys. Res. Lett. 2005, 32. [Google Scholar] [CrossRef]
- He, Y.Y.; Wang, K.C.; Zhou, C.; Wild, M. A Revisit of Global Dimming and Brightening Based on the Sunshine Duration. Geophys. Res. Lett. 2018, 45, 4281–4289. [Google Scholar] [CrossRef]
- Liu, S.; Geng, Y.; Zhang, J.; Kang, X.; Shi, X.; Zhang, J. Ecological trap in tourism-urbanization: Simulating the stagnation and restoration of urbanization from the perspective of government incentives. Ecol. Econ. 2021, 185, 107054. [Google Scholar] [CrossRef]
- Liu, S.; Zhang, J.; Geng, Y.; Li, J.; Wang, Y.; Zhang, J. Plausible response of urban encroachment on ecological land to tourism growth and implications for sustainable management, a case study of Zhangjiajie, China. Ecol. Indicators 2021, 132, 108253. [Google Scholar] [CrossRef]
Disclaimer/Publisher’s Note: The statements, opinions and data contained in all publications are solely those of the individual author(s) and contributor(s) and not of MDPI and/or the editor(s). MDPI and/or the editor(s) disclaim responsibility for any injury to people or property resulting from any ideas, methods, instructions or products referred to in the content. |
© 2025 by the authors. Licensee MDPI, Basel, Switzerland. This article is an open access article distributed under the terms and conditions of the Creative Commons Attribution (CC BY) license (https://creativecommons.org/licenses/by/4.0/).