Highlights
What are the main findings?
- A constrained generalized variational retrieval method incorporating a cloud cost function was developed for the FY-4A/GIIRS observations, enabling full field-of-view retrievals of cloud fraction and precipitable water vapor (PWV).
- By integrating cloud parameters as auxiliary inputs to the radiative transfer model, the method substantially improved the simulation of infrared brightness temper-atures over cloudy regions and reduced model biases.
What are the implications of the main findings?
- The high-frequency, full field-of-view retrievals were used to derive precipitable water vapor (PWV) fields that closely matched ERA5 total column water vapor, exhibiting enhanced sensitivity to the evolution of high-impact weather systems such as typhoons.
- The simplified methodology proposed in this study provides a robust basis for the future assimilation and operational utilization of infrared data over cloud-affected regions in numerical weather prediction models.
Abstract
Owing to their high vertical resolution, remote sensing data from meteorological satellite hyperspectral infrared sounders are well-suited for the identification, monitoring, and early warning of high-impact weather events. The effective utilization of full field-of-view (FOV) observations from satellite infrared sounders in high-impact weather applications remains a major research focus and technical challenge worldwide. This study proposes a generalized variational retrieval framework to estimate full FOV cloud fraction and precipitable water vapor (PWV) from observations of the Geostationary Interferometric Infrared Sounder (GIIRS) onboard the Fengyun-4A (FY-4A) satellite. Based on this method, experiments are performed using high-frequency FY-4A/GIIRS observations during the landfall periods of Typhoon Lekima (2019) and Typhoon Higos (2020). A three-step channel selection strategy based on information entropy is first designed for FY-4A/GIIRS. A constrained generalized variational retrieval method coupled with a cloud cost function is then established. Cloud parameters, including effective cloud fraction and cloud-top pressure, are initially retrieved using the Minimum Residual Method (MRM) and used as initial cloud information. These parameters are iteratively optimized through cost-function minimization, yielding full FOV cloud fields and atmospheric profiles. Full FOV brightness temperature simulations are conducted over cloudy regions to quantitatively evaluate the retrieved cloud fractions, and the derived PWV is further applied to the identification and analysis of hazardous weather events. Experimental results demonstrate that incorporating cloud parameters as auxiliary inputs to the radiative transfer model improves the simulation of FY-4A/GIIRS brightness temperature in cloud-covered areas and reduces brightness temperature biases. Compared with ERA5 Total Column Water Vapour (TCWV) data, the PWV derived from full FOV profiles containing cloud parameter information shows closer agreement and, at certain FOVs, more effectively indicates the occurrence of high-impact weather events. The simplified methodology proposed in this study provides a robust basis for the future assimilation and operational utilization of infrared data over cloud-affected regions in numerical weather prediction models.
1. Introduction
Precipitation fields dominated by high-impact weather (HIW) systems, such as severe convective storms, typically exhibit pronounced spatial locality, sudden intensity enhancement, and temporal clustering. Specifically, heavy rainfall tends to concentrate within limited geographical areas, can intensify rapidly within a short time, and often accumulates most of its total amount during a brief period. These characteristics make such precipitation events highly prone to triggering flash flooding (e.g., urban waterlogging) within a short timescale and can also induce secondary disasters such as landslides and debris flows [1]. From a physical perspective, the occurrence and evolution of short-duration heavy precipitation are governed by multiple factors, including atmospheric instability, dynamic lifting mechanisms, and moisture availability [2]. Compared with radar observations, geostationary satellite observations can identify precursor signals of HIW events at an earlier stage. Relative to polar-orbiting satellites, although geostationary satellites have the disadvantage of being unable to provide high-accuracy and high-spatial-resolution global observations, they offer higher temporal resolution, enabling wide-area, rapid, and continuous atmospheric monitoring, which is crucial for accurate detection and forecasting of HIW events. However, hyperspectral infrared sounder data from geostationary meteorological satellites still hold considerable yet underexploited potential for capturing environmental conditions prior to the onset of HIW events and for tracking the life cycle of typhoons [3,4].
In numerical weather prediction (NWP) operations, satellite data assimilation accounts for a large proportion of the total assimilated observations, and hyperspectral infrared soundings play a particularly critical role [5]. However, most operational NWP centers currently assimilate only clear-sky observations from satellite infrared sounders [6], and the assimilation of cloud-affected data remains relatively limited [7]. Since HIW events are often accompanied by the formation, development, and dissipation of clouds [8]—for instance, in typhoon and frontal precipitation systems—the ability of geostationary satellite infrared data to provide all-weather, wide-coverage, high-resolution cloud imagery makes them highly suitable for monitoring such systems [9]. Moreover, incorporating atmospheric information contained within clouds into NWP models can improve forecast accuracy [10]. Considering that approximately 60% of the globe is covered by clouds at any given time, the assimilation and use of hyperspectral infrared data over cloudy regions hold significant potential for improving NWP performance [11].
Numerous studies have focused on the processing (including cloud detection and cloud screening) and application (such as cloudy-sky data assimilation) of hyperspectral infrared observations in cloudy regions. Classical approaches mainly include the clear-sky field-of-view (FOV) method [12], clear-channel method [13], cloud-affected brightness temperature simulation, cloud parameter retrieval [14], and cloudy-sky data assimilation [15]. The development trend in this field is focused on the operational assimilation of all-sky infrared observations simulated using cloud and water emissivity parameters derived from fast radiative transfer models [16]. In studies of infrared brightness temperature simulation in cloudy regions, Vukicevic et al. [17] demonstrated that infrared observations can effectively capture the overall structural characteristics of clouds. Meirold-Mautner et al. [18] successfully simulated satellite infrared and microwave brightness temperatures for midlatitude weather systems using radiative transfer models combined with mesoscale cloud models, providing important insights into the understanding of midlatitude weather processes. Chevallier and Kelly [19] simulated geostationary 11 μm channel brightness temperatures under cloudy conditions by utilizing cloud microphysical parameters from numerical model outputs in conjunction with radiative transfer calculations [20]. The experimental results demonstrated that the fused cloud-top heights achieved higher accuracy than those obtained from any single observation source. However, all such approaches rely on cloud parameters from numerical model outputs, which introduces certain limitations. Due to the complexity and uncertainty of cloud prediction in numerical models, brightness temperature simulation errors in cloudy and precipitating regions are generally larger than those under clear-sky conditions.
Regarding cloud parameter retrieval methods, Eyre and Menzel [14] first introduced the Minimum Residual Method (MRM). The key advantage of the MRM is that it requires only observed and simulated brightness temperatures from satellite infrared channels to retrieve cloud parameters for individual pixels. These parameters include the effective cloud fraction and the effective cloud-top pressure. Owing to its simplicity and computational efficiency, the method is well suited for operational numerical weather prediction applications. White et al. [21] retrieved cloud-top pressure using a neural network approach applied to satellite imager data.
Building on such retrievals, several studies have further explored the assimilation of cloud-affected infrared brightness temperatures [15,22]. For example, Pavelin et al. [22] (2008) proposed the so-called “Cloudy 1D-Var” method, which explicitly accounts for cloud properties. In this approach, cloud parameters are estimated for a given field of view assuming a single-layer graybody cloud. Wang and Zhang [23] applied variational assimilation of cloud-affected hyperspectral infrared brightness temperatures and obtained improved results. Lee et al. [24] combined MRM with machine learning for assimilation of cloudy infrared atmospheric sounding interferometer (IASI) observations.
Regarding the all-sky assimilation of satellite infrared observations, Geer et al. [16] introduced the research progress at major operational forecasting centers on the assimilation of observations affected by clouds and precipitation. They pointed out that satellite data assimilation is moving beyond the “clear-sky” approach and proposed that the key to the all-sky method is the ability to construct models that can simulate clouds and precipitation with sufficient accuracy to directly assimilate all observations. Geer [5] conducted a study on the observation errors of all-sky infrared radiance assimilation and found that, compared with clear-sky conditions, the observation errors under cloudy conditions exhibited stronger inter-channel correlations and larger variances. Furthermore, Geer et al. [25] carried out all-sky assimilation of infrared radiances sensitive to mid- and upper-tropospheric moisture and clouds, and found that, in tropical regions, all-sky assimilation was more beneficial than clear-sky assimilation, improving short-term forecasts of tropospheric and stratospheric dynamics. Minamide and Posselt [26] improved the prediction of tropical cyclone intensification by assimilating high-resolution all-sky Geostationary Operational Environmental Satellite data and found that the assimilation of all-sky satellite radiances made a significant contribution to improving the forecasts of the onset of tropical cyclone (TC) intensification. Their study emphasized the potential of all-sky satellite radiance assimilation to achieve more accurate forecasts by improving the representation of the inner-core structure of tropical cyclones. Xie et al. [27] conducted all-sky assimilation experiments using observations from the Geostationary Interferometric Infrared Sounder (GIIRS) onboard the Fengyun-4A (FY-4A) satellite [28] and studied their impact on the prediction of binary typhoons (Maysak and Haishen (2020)). Their results showed that the assimilation of FY-4A/GIIRS all-sky observations improved the subsequent forecasts of typhoon tracks and landfall precipitation.
Atmospheric profiles of temperature, humidity, and precipitable water vapor (PWV) are critical for forecasters in diagnosing and predicting weather systems. Since HIW events are typically associated with cloud development, achieving full FOV atmospheric retrievals under cloudy conditions would significantly enhance HIW monitoring and forecasting [22]. At present, radiosonde observations and their derived parameters remain an important reference for forecasters in operational weather forecasting. However, the sparse spatial distribution of radiosonde stations limits the spatial resolution of these observations. Compared with the rapidly evolving synoptic and mesoscale environment during high-impact weather events, the temporal frequency of some numerical weather prediction (NWP) products remains insufficient. High-frequency observations from geostationary satellites are expected to mitigate this limitation. For example, FY-4A/GIIRS offers the advantages of high temporal and vertical resolution [28]. Its temporal resolution allows for coverage of a given region over China every 15 min, and the observation interval is even shorter in “targeted observation” mode. The use of hyperspectral infrared brightness temperatures from geostationary satellites in cloudy regions has promoted the development of improved monitoring and forecasting techniques for high-impact weather. Wang et al. [1] retrieved full FOV temperature profiles from FY-4A/GIIRS—including cloudy pixels—using an ensemble learning approach and successfully applied them to typhoon monitoring. In addition to the widely recognized role of hyperspectral infrared retrievals of temperature and humidity profiles in weather prediction [29,30,31,32,33], PWV derived from such profiles also provides valuable reference information for the early warning of high-impact weather events. Maier and Knuteson [34] demonstrated through case studies that FY-4A/GIIRS profile products can capture rapid transitions (16 h) of the atmosphere from stable to unstable conditions. Gao et al. [35] evaluated the accuracy of FY-4A/GIIRS temperature profile products and investigated their application to wintertime precipitation-type classification over southern China. Kahn et al. [36] reported that temperature and specific humidity retrievals from low-Earth-orbit (LEO) hyperspectral infrared sounders have a positive impact on weather forecasts.
Although the assimilation of satellite hyperspectral infrared data using three-dimensional variational (3D-Var), four-dimensional variational (4D-Var), ensemble Kalman filter and all-sky assimilation techniques has been demonstrated to add value to operational numerical weather prediction (NWP) forecasts [37,38], these approaches remain limited in their ability to represent the rapid environmental changes associated with high-impact weather events on timescales of only a few hours or less. This limitation is largely attributed to the model “spin-up” time required by NWP systems. This study aims to address the difficulty of effectively applying satellite infrared radiance observations in cloudy regions. Therefore, a generalized variational method is developed to simultaneously retrieve cloud fraction and PWV for all FOV pixels, including both clear-sky and cloudy areas. This method is designed to utilize the high-frequency observations from FY-4A/GIIRS to improve the accuracy of brightness temperature simulations under cloudy conditions and to generate PWV products. The proposed approach first performs optimal channel selection for FY-4A/GIIRS, then retrieves cloud parameters and atmospheric profiles through variational iteration, where the cloud parameters include effective cloud fraction and cloud-top pressure. Finally, PWV is obtained by vertically integrating the retrieved atmospheric profiles. The combined cloud fraction and PWV information is then applied to the monitoring and analysis of high-impact typhoon events.
The main innovations and contributions of this study are summarized as follows:
- (1)
- A new generalized variational retrieval method coupled with a cloud cost function is proposed. In this method, a physical constraint term for cloud parameters is introduced into the classical variational framework [39]. This approach enables the simultaneous and synergistic retrieval of cloud fraction and atmospheric profiles for all FOV pixels and has been preliminarily and effectively applied to FY-4A/GIIRS observations in cloudy regions.
- (2)
- A complete method was developed from optimal channel selection to the initial retrieval of cloud parameters. A three-step channel selection approach based on information entropy [40] was developed, and the Minimum Residual Method (MRM) [14,24] was employed to provide the initial cloud parameters for the generalized variational retrieval. This simplified scheme, which combines physical retrieval and optimization strategies, improves the simulation accuracy of FY-4A/GIIRS brightness temperatures in cloudy regions.
- (3)
- Full field-of-view (FOV) precipitable water vapor (PWV) products with high temporal frequency were generated and applied to the monitoring of typhoon events associated with hazardous weather. Unlike most previous studies that can only provide clear-sky PWV, the proposed method generates full-FOV PWV products by integrating atmospheric profiles containing cloud information. The results preliminarily demonstrate the advantages of this approach in the identification and early warning of high-impact weather events, providing a foundation for disaster weather monitoring and future assimilation of cloud-affected observations.
The remainder of this paper is organized as follows: Section 2 introduces the data and models used in the experiments. Section 3 describes the methods adopted in this study. Section 4 presents the results of cloud fraction and PWV retrieval experiments based on FY-4A/GIIRS data. Section 5 presents discussions. Section 6 summarizes the main conclusions and discusses prospects for future work.
2. Data and Model
2.1. Data
2.1.1. FY-4A/GIIRS Data
The FengYun-4A (FY-4A) satellite is equipped with the Geostationary Interferometric Infrared Sounder (GIIRS), which employs a multi-dimensional detector array architecture consisting of 32 × 4 elements [41]. FengYun-4A/GIIRS is based on Fourier transform spectroscopy, which enables the acquisition of multi-band infrared radiance characteristics. It possesses dual-band detection capability in the longwave infrared region (wavenumber range 700–1130 cm−1, 689 channels) and the midwave infrared region (wavenumber range 1650–2250 cm−1, 961 channels), with a spatial resolution of approximately 16 km [42]. Benefiting from the high temporal and spatial sampling capability of the geostationary platform and the fine vertical layering provided by the hyperspectral sensor, FengYun-4A/GIIRS demonstrates a distinct advantage in the continuous monitoring and early warning of high-impact weather systems. During high-impact weather events, it can perform frequent “intelligent” observations over specific target regions [1]. This provides essential data support for meteorological disaster early warning and establishes a foundation for satellite data assimilation and target-adaptive observation of high-impact weather.
2.1.2. FY-4A/AGRI Data and Cloud Mask Product
The FengYun-4A satellite carries the Advanced Geosynchronous Radiation Imager (AGRI), which consists of 14 spectral channels, including three in the visible band, three in the near-infrared band, and eight in the infrared band [43]. The central wavelengths of the infrared channels are 3.72, 6.25, 7.10, 8.50, 10.80, 12.00, and 13.50 μm. Among them, the 10.8 μm channel is a window channel, and the data have a spatial resolution of 4 km.
In addition to the Level-1 observation data of FengYun-4A/AGRI, a full-disk cloud mask product with a spatial resolution of 4 km is also provided. The FengYun-4A/AGRI cloud mask product is derived using a threshold-based method, which discriminates cloudy and clear-sky pixels based on the radiative differences in relevant meteorological parameters combined with multi-channel brightness temperatures. The detailed algorithm and processing procedure are described in Min et al. [44].
2.1.3. ERA5 and FNL Data
The latest ERA5 (the fifth generation ECMWF atmospheric reanalysis) reanalysis dataset produced by the European Centre for Medium-Range Weather Forecasts (ECMWF) has high accuracy and the highest spatio-temporal resolutions among all the reanalysis datasets [45]. ERA5 products are generated through the assimilation of multi-source observations. This dataset provides high-precision atmospheric variable information, including thermodynamic variables and the Total Column Water Vapour (TCWV) product, with a temporal resolution of one hour and a horizontal spatial resolution of 0.25° × 0.25°.
The background field data used in this study are derived from the Final Operational Global Analysis (FNL) dataset provided by the National Centers for Environmental Prediction (NCEP), which offers a global reanalysis with a horizontal resolution of 1° × 1° and a temporal resolution of six hours [46].
2.1.4. Precipitation Products and Data
In this study, the Integrated Multi-satellitE Retrievals for GPM (IMERG) precipitation product and ground-based rain gauge observations were used as auxiliary validation datasets for evaluating the experimental results. The IMERG product has a spatial resolution of 0.1° × 0.1° and a temporal resolution of 30 min [47]. The IMERG precipitation product is produced by the National Aeronautics and Space Administration (NASA) and is available at https://gpm.nasa.gov/data/directory (accessed on 15 May 2025). The ground-based rain gauge precipitation data, which provide high reliability for “truth” validation, were obtained from the China National Meteorological Data Service Center (CMDC) at http://data.cma.cn/ (accessed on 15 May 2025).
2.2. Experimental Data
High-frequency observation data from the FY-4A/GIIRS were used as experimental data for the retrieval of cloud fraction and PWV. Two representative typhoon cases were selected for analysis: Typhoon Lekima (International No. 1909, 2019) and Typhoon Higos (International No. 2007, 2020). Typhoon Lekima made landfall in China, affecting approximately 14.02 million people across the provinces of Zhejiang, Jiangsu, and Anhui, with direct economic losses reaching 51.53 billion CNY [48]. Typhoon Higos formed over the northern South China Sea on 18 August 2020 (Coordinated Universal Time, hereafter UTC) and subsequently moved northwestward, intensifying continuously [1]. Higos made landfall along the coast of Zhuhai, Guangdong Province, at 06:00 UTC on 19 August, with a maximum sustained wind speed of 35 m/s (Category 12 on the Beaufort scale). The typhoon caused widespread transport disruptions in the Pearl River Delta region, including the suspension of multiple train services and large-scale flight delays and cancellations at several airports.
For Typhoon Lekima, the experimental dataset covered the period from 20:00 UTC on 8 August 2019 to 11:00 UTC on 10 August 2019, corresponding to the high-frequency FY-4A/GIIRS observations before and after landfall. The spatial coverage extended approximately from 100°E to 127°E and 24°N to 42°N. For Typhoon Higos, the data period was from 12:00 UTC on 18 August 2020 to 12:00 UTC on 19 August 2020, covering the period around landfall, with a spatial domain of approximately 98.5°E–136.0°E and 7.0°N–33.5°N. All times mentioned in this paper are expressed in Coordinated Universal Time (UTC).
2.3. Data Preprocessing
2.3.1. Apodization of FY-4A/GIIRS Data
Before using the channel brightness temperature observations of FY-4A/GIIRS, an apodization processing was performed [49]. The three-point Hamming apodization function with coefficients 0.23, 0.54, and 0.23 was applied to the channel data to reduce spectral sidelobes and ringing effects [1].
2.3.2. Cloud Fraction Identification Based on the Cloud Mask Product
The FY-4A/AGRI cloud mask product was used in this study to determine clear-sky and cloudy FOVs for FY-4A/GIIRS. The 16 km FOVs of the infrared sounder were mapped to the 4 km FOVs of the radiation imager, and the cloud confidence levels of the four overlapping pixels within each area were statistically analyzed. A FOV was classified as “clear-sky” if all corresponding AGRI pixels were labeled as “confidently clear”; otherwise, it was classified as “cloudy” [50].
2.3.3. Background Field Data
Based on the geolocation (latitude and longitude) of the FengYun-4A/GIIRS FOVs, the NCEP/FNL data were interpolated to the sounder FOVs using a bilinear interpolation method. The interpolated background field data were used for channel brightness temperature simulation and for the preliminary retrieval of cloud parameters via the MRM, serving further as the initial field for subsequent variational retrieval iterations.
2.4. Model
2.4.1. Observation Operator: Fast Radiative Transfer Model
In this study, the RTTOV model [20] was employed to simulate the brightness temperatures of the midwave channels of FY-4A/GIIRS and to conduct variational iteration. The RTTOV model consists of four modules: the forward model, the tangent linear model, the adjoint model, and the K model. Among them, the forward model maps variables in the model space (such as temperature and humidity profiles) into the observation space of satellite channel brightness temperatures. The input parameters of RTTOV are listed in Table 1. Referring to the studies of Pavelin et al. [22], Wang and Zhang [23], and Lee et al. [24], Table 1 also summarizes the differences in input parameters between clear-sky and cloudy infrared brightness temperature simulations for satellite channels.

Table 1.
Input parameters of RTTOV mode in this experiment.
2.4.2. Generalized Variational Retrieval Model
The generalized variational retrieval model used in this study was developed on the basis of the one-dimensional variational (1DVar) system established by the Numerical Weather Prediction Satellite Application Facility (NWP SAF) [23,24]. The original 1DVar framework, available from https://nwp-saf.eumetsat.int/site/ (accessed on 23 April 2025), was extended by incorporating the FY-4A/GIIRS data interface and by modifying or adding several program modules. These modifications mainly include the definition of new variables, data reading, quality control procedures, and the construction and optimization of the cloud cost function.
3. Methods
3.1. Constrained Generalized Variational Retrieval Coupled with a Cloud Cost Function
Variational retrieval is based on the Bayesian optimal estimation theory, which combines observational information with prior knowledge from background fields to obtain an optimal atmospheric state that represents the “physical solution” (model information and physical processes) on a statistical scale through minimization of an objective function [6].
To make effective use of cloud-affected hyperspectral infrared radiances [6], this study constructs a generalized variational retrieval method with an additional constraint term—referred to as the cloud cost function —following Wang and Zhang [23]. The objective function is defined as:
The background term and the observation term in the objective function are defined as follows:
where represents the control variables, denotes cloud parameters (effective cloud fraction and cloud-top pressure), and is the background state, also referred to as the first guess, including temperature, humidity, pressure, and wind information.
and represent the background and observation error covariance matrices, respectively. The superscripts and indicate matrix inversion and transpose. represents the observations, and is the observation operator. For satellite data, corresponds to a radiative transfer model that maps model-space variables into the observation space. In this study, the Radiative Transfer for TOVS (RTTOV) model [20] was employed, which is capable of simulating cloudy infrared brightness temperatures.
In this study, the cloud cost function is constructed using cloud fraction and cloud-top pressure, and is defined as follows:
where and denote the tuning parameters for the cloud-top pressure and cloud fraction cost functions, respectively; represents the retrieved effective cloud-top pressure; represents the retrieved effective cloud fraction; and denote the model-defined pressure levels corresponding to high and low cloud tops, respectively; and and denote the maximum and minimum cloud fractions (i.e., cloud cover). It should be noted that, when setting the tuning parameters, the magnitude difference between and must be carefully considered.
3.2. Cloud Parameter Retrieval Using the Minimum Residual Method
According to radiative transfer theory [20], the simulated radiance for channel can be expressed as:
Here, denotes the effective cloud fraction of the FOV; represents the clear-sky radiance; and represents the simulated cloudy-sky radiance corresponding to a cloud-top pressure of . In this study, it is assumed that if an FOV is cloudy, the cloud is represented by a single-layer structure. The radiance values can be converted into brightness temperatures using the Planck function.
The deviation between the observed radiation and the simulated radiation of channel is defined as follows:
Based on the optimally selected combination of channels, the cloud parameters can be retrieved by minimizing the objective function of the MRM [14,24]. The cloud parameters in this study include the effective cloud fraction and the effective cloud-top pressure . The objective function is defined as follows:
The minimization process for retrieving the effective cloud fraction and effective cloud-top pressure is carried out in two steps, as follows:
Step 1: Based on the pressure layers defined in the employed radiative transfer model (e.g., RTTOV), an effective cloud-top pressure is prescribed. This value is then substituted into Equation (9), and the minimization is performed to obtain :
Step 2: The values from the selected channels are substituted into Equation (7), and the minimization is performed to obtain the effective cloud-top pressure . Here, represents the final effective cloud-top pressure jointly determined from all channels.
3.3. Channel Optimal Selection Based on Information Entropy “Three-Step Method”
Channel optimal selection is one of the key techniques for effectively utilizing satellite hyperspectral infrared data [51]. It can reduce the ill-posedness of variational retrievals caused by redundant information, thereby mitigating the so-called “curse of dimensionality” in channel selection [52]. In this study, an information entropy–based “three-step method” is developed for the optimal selection of mid-infrared channels of FY-4A/GIIRS [40]. The “three-step method” proceeds as follows:
Step 1: Establish a channel blacklist. This study establishes a pre-selection criterion to exclude certain channels based on channel observations and simulated brightness temperatures. The criterion includes channels with high noise, large radiative transfer simulation errors, and those sensitive to surface emissivity. A channel blacklist for FY-4A/GIIRS is created to provide a high-quality data foundation for subsequent optimal channel selection. The specific blacklist is constructed following the approach proposed by Wang et al. [1].
Step 2: Perform a preliminary selection of channels based on the channel weighting functions of the satellite sensors to form an initial channel subset.
Step 3: On the basis of the preliminary subset, apply the Entropy Reduction (ER) method to perform optimal channel selection. The combination of the channel weighting function and the ER method allows the optimization process to account for both the physical characteristics of the channels and the information content. The ER method will be discussed in greater detail later in Section 3.3.2.
3.3.1. Channel Preselection Based on Weighting Functions
The Weighting Function (WF) characterizes the contribution of atmospheric layers at different altitudes to the satellite-observed radiance in each spectral channel. The peak position of a WF indicates the channel’s effective sensing layer. The WF is defined as:
where denotes the channel transmittance, represents the channel central frequency, is the satellite zenith angle, denotes the atmospheric pressure, and indicates the partial derivative.
The channel preselection process based on the weighting function proceeds as follows:
Step 1: Remove multi-peaked channels. Only single-peaked channels are retained to ensure the uniqueness of the atmospheric information detected by each channel.
Step 2: Select channels by atmospheric (pressure) layer. Within the same pressure layer of the radiative transfer model (e.g., the 850 hPa level), channels exhibiting the maximum WF peak and the steepest WF gradient are preferentially selected. This minimizes uncertainty in the detected information and prevents the introduction of meteorological signals from adjacent layers.
Step 3: Exclude surface-sensitive channels. Considering issues such as surface emissivity, channels whose WF peaks occur near the surface are excluded to eliminate the influence of surface signals on the variational retrieval results.
3.3.2. Channel Optimal Selection Based on the Entropy Reduction Method
From the perspective of information theory, the principle of channel optimal selection is to obtain, under a given constraint on the number of selected channels, a subset that yields the most accurate variational retrieval results. The selection criterion is that the process terminates when either (1) the number of selected channels reaches the predefined limit, for example, m channels or (2) the cumulative information content (CIC) contributed by the newly added channels no longer shows a significant increase [53]. In this study, the incremental increase is denoted as , and a threshold of is set.
In this study, after removing the channels listed in the blacklist and completing the preselection process, the channel corresponding to the maximum Entropy Reduction (ER) value is selected at each iteration.
Let the updated ER value at the i iteration be defined as:
where denotes the retrieval (or analysis) error covariance matrix updated at the iteration, and represents the background error covariance matrix.
Here, refers to the normalized Jacobian matrix corresponding to the selected channels [6]. The initial value of is set equal to the matrix . is the identity matrix. is the standard deviation of the error for the -th channel.
4. Results
4.1. Generalized Variational Retrieval Experiment Flowchart
The generalized variational retrieval experiment of FY-4A/GIIRS for full FOV cloud fraction and PWV consists of six main components: data preprocessing, channel optimal selection, initial cloud parameter retrieval, generalized variational retrieval, PWV calculation, and application to high-impact weather events. It should be noted that in this study, only the cloud fraction information derived from the cloud parameter retrieval was ultimately used for analysis. The flowchart in Figure 1 illustrates the process of retrieving cloud parameters and PWV using FY-4A/GIIRS data.
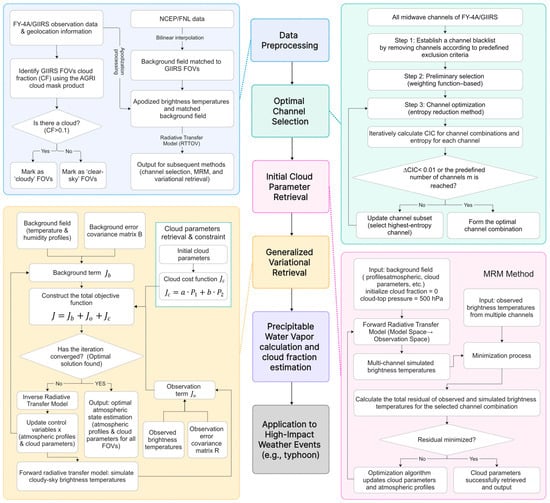
Figure 1.
Flowchart of cloud parameter and PWV retrieval using FY-4A/GIIRS data.
In the flowchart, the generalized variational retrieval (GVR) serves as the core of the entire method. It constructs an objective function coupled with a “cloud cost function” as a physical constraint term. The cloud parameters obtained from the MRM are used as the initial values for the GVR. Through iterative minimization, the GVR simultaneously retrieves cloud parameters and atmospheric temperature and humidity profiles for all FOV pixels, including both clear-sky and cloudy regions. The channel combinations used in the MRM are derived from the results of the optimal channel selection.
4.2. FY-4A/GIIRS Channel Optimal Selection Experiment
Figure 2a shows the distribution of the weighting functions for the midwave infrared channels of FY-4A/GIIRS. Figure 2b presents the distribution of the channel-observed brightness temperatures corresponding to the Jacobian peak levels [6] at different pressure layers at 00:00:00 UTC on 19 August 2020. Figure 2c displays the distribution of the selected channel subset obtained through the information entropy “three-step method,” with the selected channels marked by “star” symbols. Figure 2d illustrates the information content of the channels selected during the iterative process and the corresponding cumulative information content of the channel subsets. The total number of channel combinations (subsets) was set to 100. The simulated brightness temperatures of FY-4A/GIIRS, derived from the mid-latitude summer atmospheric profiles using the RTTOV model, were used as the background brightness temperatures in Figure 2c.
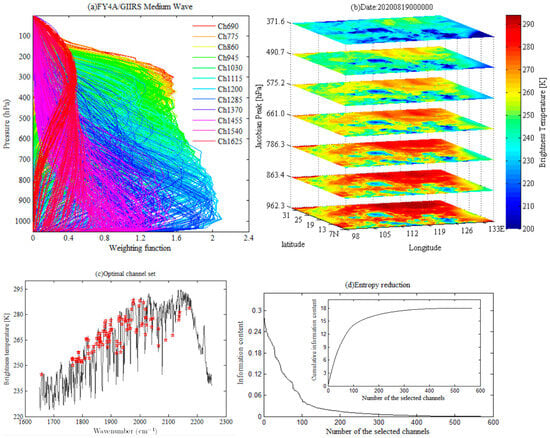
Figure 2.
Channel information and optimal selection. (a) Channel weighting functions; (b) Distribution of observed brightness temperatures at different vertical layers; (c) Channel combinations (subsets) and the red star marks the selected channel; (d) Information entropy and cumulative information content during the iterative process.
4.3. Full Field-of-View Cloud Fraction Retrieval: Case Study of Typhoon Higos
This section takes Typhoon Higos (2020) as a representative case to investigate the retrieval of cloud fraction using the midwave infrared channels of FY-4A/GIIRS. First, the information entropy “three-step method” was applied to obtain the optimal combination (see Figure 2c) of FY-4A/GIIRS channels, forming a channel subset. Second, based on this subset, the MRM was employed to derive FOV cloud parameters, including effective cloud fraction and effective cloud-top pressure. These cloud parameters were then used as initial values in the variational retrieval iteration, where they were incorporated—together with atmospheric variables such as temperature and humidity profiles—into the minimization of the variational cost function. Finally, through the generalized variational iteration, both the cloud parameters and the background fields (temperature and humidity profiles) were updated, producing the final meteorological field information for all FOVs.
4.3.1. Initial Cloud Fraction Retrieval and Simulated Brightness Temperature Analysis in Cloudy Regions
In this part, the initial cloud parameters derived from the MRM were used for analysis. Figure 3 presents the results for FY-4A/GIIRS channel 1068 at 06:00:00 UTC on 19 August 2020 during Typhoon Higos. The simulated brightness temperatures are categorized into two cases: clear-sky simulation (Figure 3a,c) and cloudy-sky simulation (Figure 3b,d). The clear-sky simulation assumes that all FOVs are cloud-free, representing the simulated brightness temperatures under clear-sky conditions, corresponding to the “clear-sky case” in Table 1. The cloudy-sky simulation incorporates the retrieved cloud parameters as input to the RTTOV model to generate simulated brightness temperatures for all FOVs under cloudy conditions, corresponding to the “cloudy-sky case” in Table 1. Figure 3e shows the observed channel brightness temperatures, Figure 3f illustrates the channel brightness temperature deviation (O–B, Observation minus Background) under the cloudy-sky simulation, Figure 3g presents the cloud fraction retrieved using the MRM, and Figure 3h shows the cloud fraction distribution obtained by matching the FY-4A/AGRI cloud mask product to the FY-4A/GIIRS FOVs (hereafter referred to as the “matching method”).
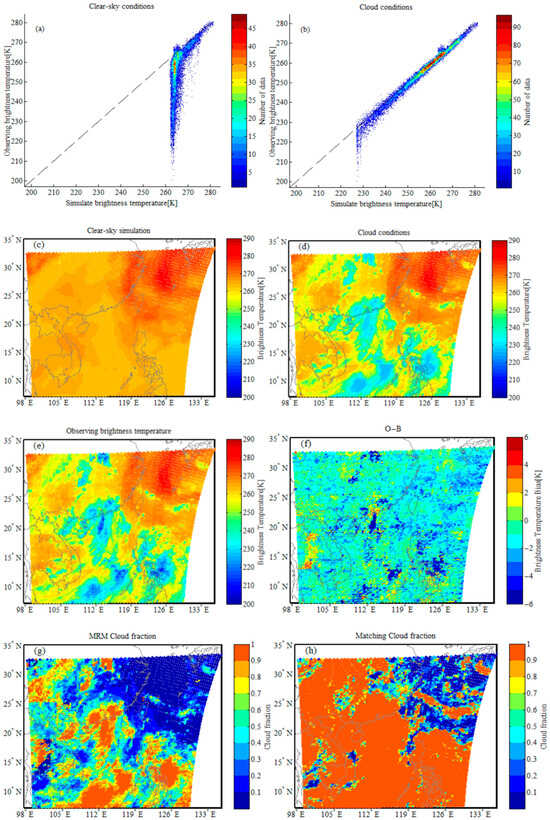
Figure 3.
FY-4A/GIIRS clear-sky and cloudy-sky simulated brightness temperatures, observed brightness temperatures, brightness temperature deviations, and cloud fraction distributions. (a) Scatterplot of clear-sky simulation; (b) Scatterplot of cloudy-sky simulation; (c) Plan view of clear-sky simulation; (d) Plan view of cloudy-sky simulation; (e) Observed brightness temperatures; (f) Brightness temperature deviation under cloudy-sky simulation; (g) Cloud fraction retrieved by MRM; (h) Cloud fraction derived from the cloud mask–matched product.
As shown in Figure 3, compared with the clear-sky simulated brightness temperatures (Figure 3a,c), the cloudy-sky simulations (Figure 3b,d) exhibit a stronger correlation with the observed brightness temperatures. However, some FOVs still show relatively large brightness temperature deviations, which are mainly associated with the dense cloud regions within the typhoon system. As seen in Figure 3c, the simulated brightness temperatures under clear-sky conditions are generally higher than those under cloudy-sky conditions. This indicates that when the RTTOV radiative transfer model is run without cloud parameters, it cannot accurately reproduce the brightness temperature characteristics in cloudy regions. This limitation becomes particularly evident during the development of high-impact weather systems such as typhoons, where the model struggles to capture the spatial and temporal variations in channel brightness temperatures, thereby restricting its effectiveness for severe weather monitoring. When the RTTOV model incorporates cloud parameters, the cloudy-sky simulations agree more closely with the observed brightness temperatures, successfully reproducing the structural morphology of clouds while significantly reducing the brightness temperature deviations. The cloud fraction retrieved using the MRM shows good consistency with the observed brightness temperature distributions from FY-4A/GIIRS. Although the clear-sky FOVs derived from MRM agree well with those from the matching method, MRM identifies a greater number of clear-sky FOVs, which can increase the amount of data available for subsequent variational data assimilation.
4.3.2. Temporal Variation in Retrieved Cloud Fraction and Analysis of Brightness Temperature Deviations
Considering that the NCEP/FNL reanalysis data have relatively limited temporal coverage within a day, they nevertheless provide high accuracy. In contrast, geostationary satellite data offer superior temporal immediacy. Therefore, the high-frequency observations from FY-4A/GIIRS can be used to monitor the evolution of cloud systems during high-impact weather events such as typhoons. Figure 4 presents the cloud fraction retrieved from FY-4A/GIIRS at different observation times during Typhoon Higos, shown in Figure 4a–f, along with the corresponding FY-4A/AGRI infrared window channel cloud imagery at the same times, shown in Figure 4g–l.
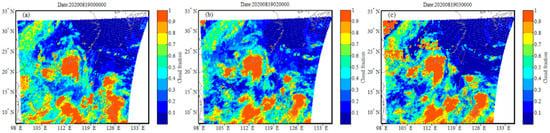
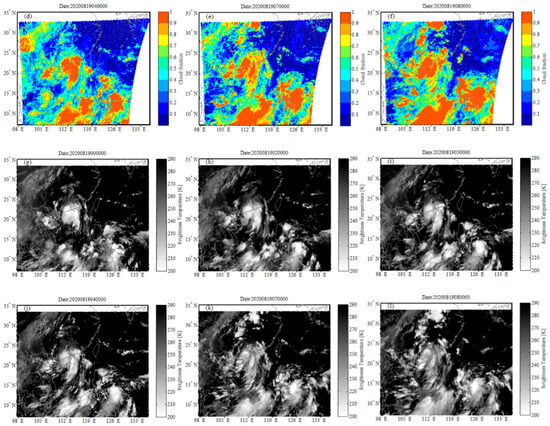
Figure 4.
Temporal evolution of retrieved cloud fraction and FY-4A/AGRI cloud imagery. (a–f) Temporal variation in cloud fraction retrieved from FY-4A/GIIRS; (g–l) Distribution of FY-4A/AGRI infrared window channel cloud imagery. The data period is from 00:00 to 08:00 UTC on 19 August 2020.
As shown in Figure 4, the cloud fraction retrieved from the high-frequency FY-4A/GIIRS observations exhibit good consistency with the cloud system distributions derived from FY-4A/AGRI imagery. The time-sequential panels clearly reveal the evolution and development of the cloud systems. On this basis, the retrieved cloud information can be further combined with other meteorological variables (see Section 4.4.2) to support early warning of meteorological disasters.
Figure 5 presents the mean distribution of the absolute brightness temperature deviations for 100 channels under clear-sky (Scenario 1) and cloudy-sky (Scenario 2) simulations. The data used span the period from 00:00 UTC to 06:00 UTC on 19 August 2020.
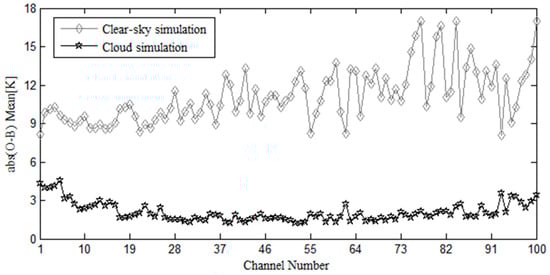
Figure 5.
Mean absolute brightness temperature deviations of clear-sky and cloudy-sky simulations. The data period is from 00:00 to 06:00 UTC on 19 August 2020.
Scenario 1: The assumption is that all FOVs are clear-sky, which is denoted as the clear-sky simulation. Two situations may occur under this scenario: (1) The FOV is indeed clear in reality. The brightness temperature under clear-sky conditions (BT_clear) is simulated using RTTOV. Because the background field cannot be perfectly accurate, a discrepancy |O − BT_clear| exists between the simulated clear-sky brightness temperature and the actual observed brightness temperature (O); (2) The FOV actually contains clouds. This constitutes the primary source of error. The brightness temperature (O) observed by the satellite infrared detector mainly reflects information from the cloud top, whereas BT_clear represents the simulated brightness temperature under the clear-sky assumption. Consequently, a large difference |O − BT_clear| occurs, as the comparison involves the simulated brightness temperature of a “warmer surface” (BT_clear) and the observed brightness temperature of a “colder cloud top” (O). Therefore, when all FOVs (both clear and cloudy) are treated as clear-sky, the mean bias is dominated and amplified by the large deviations in cloud-covered regions. The mean absolute brightness temperature bias for the i-th channel under the clear-sky assumption is defined as follows:
In this equation, the first term on the right-hand side represents the sum of brightness temperature deviations for FOVs that are truly clear-sky under Scenario 1, whereas the second term corresponds to the deviations for FOVs that are actually cloudy. Here, denotes the total number of FOVs, and represent the numbers of truly clear-sky and cloudy FOVs, respectively, denotes the observed brightness temperature, and denotes the simulated brightness temperature.
Scenario 2: The assumption is that all FOVs are cloudy, denoted as the cloud simulation. Two actual situations may occur under this assumption: (1) The FOV is actually clear-sky. Similarly to the first part of Scenario 1, a discrepancy |O − BT_simulated| still exists; (2) The FOV is indeed cloudy. First, the presence of clouds is identified using the MRM, through which cloud parameters are retrieved. Second, the cloud radiative transfer scheme in RTTOV is applied to perform the simulation. This scheme simulates two major radiative components: one originating from the cloud top, and the other from the relatively warmer lower atmosphere or surface that may be transmitted through cloud gaps, depending on the retrieved cloud parameters. Finally, the simulated brightness temperature (BT_simulated) incorporates cloud physical effects and thus more closely matches the actual observation (O). Consequently, the deviation |O − BT_simulated| is considerably smaller than that in Scenario 1 under the clear-sky assumption. Therefore, the mean bias under this scenario consists of two parts: small deviations in clear-sky regions and relatively smaller, corrected deviations in cloudy regions. Under the all-cloud assumption, the mean absolute brightness temperature bias for the -th channel is defined as follows:
In this equation, the first term on the right-hand side represents the truly clear-sky FOVs under Scenario 2, while the second term corresponds to the FOVs that are actually cloudy.
Furthermore, Table 2 and Table 3 list the numbers of channels in Scenarios 1 and 2, respectively, that fall within different ranges of mean absolute bias values.
Table 2.
Clear-sky simulation: Number of channels per mean absolute bias interval, showing large bias due to unaccounted clouds.
Table 3.
Cloud simulation: Number of channels per mean absolute bias interval, demonstrating significantly reduced bias after incorporating cloud parameters.
Combining Figure 5, Table 2 and Table 3, when cloud parameters are incorporated into the radiative transfer model, the mean absolute deviations of the simulated channel brightness temperatures decrease significantly overall, with some channel deviations reduced to less than 1.3 K. It can be observed from the number of channels in different deviation intervals that, in the cloud-included simulation, 63 channels exhibit mean absolute deviations below 2.0 K, whereas the minimum mean absolute deviation in the clear-sky simulation is 8.1028 K. This difference can be attributed to the fact that, when all FOVs are assumed to be clear-sky, the simulated brightness temperature (BT_clear) introduces large errors in cloudy regions. During the subsequent GVR process, once cloud parameters are correctly identified and retrieved, GVR adjusts the state vector—including cloud parameters as well as temperature and humidity profiles—to obtain the optimal solution. This procedure further reduces simulation errors in cloudy regions, thereby decreasing the overall mean deviation.
4.4. Full FOV Cloud Fraction and Atmospheric Precipitable Water Retrieval: Case Study of Typhoon Lekima
From the analysis in Section 4.3, it can be concluded that when the cloud parameters derived from the MRM are introduced as initial values, the simulated brightness temperatures of the channels in the cloudy regions of Typhoon Higos are significantly improved. Based on this result, this section uses Typhoon Lekima (2019) as a case study to conduct retrieval experiments of full FOV cloud fraction and PWV.
4.4.1. Analysis of Cloud Fraction Information
Figure 6 shows the distribution of correlation coefficients between the simulated and observed brightness temperatures for 100 FY-4A/GIIRS channels over the high-frequency observation region of Typhoon Lekima. Three cases are discussed: (a) When all FOVs within the selected region are assumed to be under clear-sky simulation, the correlation coefficients between simulated and observed brightness temperatures for each channel are shown in Figure 6a; (b) When the cloud parameters derived from the MRM are applied to the cloudy-sky simulation, the corresponding correlation coefficients for each channel are shown in Figure 6b; (c) When the cloud parameters updated through generalized variational retrieval iteration are used for the cloudy-sky simulation, the correlation coefficients are shown in Figure 6c. In these experiments, the cloud parameters retrieved by the MRM were used as the initial values for the cloud fraction iteration in the generalized variational retrieval process.
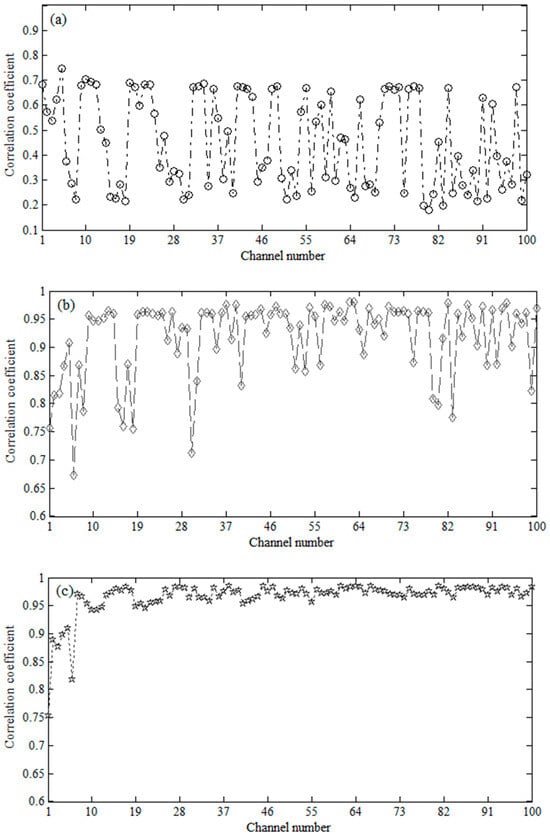
Figure 6.
Correlation analysis between simulated and observed brightness temperatures. (a) Clear-sky simulation; (b) Cloudy-sky simulation—MRM; (c) Cloudy-sky simulation—Generalized variational iteration.
As shown in Figure 6, when all FOVs within the selected region are assumed to be cloud-free for the simulation of FY-4A/GIIRS channel brightness temperatures, the correlation coefficients between the simulated and observed brightness temperatures vary across channels—some are relatively low, while others reach values around 0.7. This variation is mainly associated with differences in the vertical height of the channels’ weighting function peaks relative to the cloud-top layers. When the initial cloud parameters are incorporated into the brightness temperature simulation, the correlation between simulated and observed brightness temperatures improves noticeably. Furthermore, when the cloud parameters updated through the generalized variational retrieval iteration are applied, the correlation coefficients for most channels within the selected subset exceed 0.8, with some reaching as high as 0.95.
Furthermore, Figure 7 presents the cloud imagery and cloud fraction distributions at 00:00:00 UTC on 10 August 2019. Figure 7a shows the FY-4A/AGRI infrared window channel cloud imagery; Figure 7b displays the cloud fraction distribution obtained by matching the FY-4A/AGRI cloud mask product (CLM) to GIIRS FOVs (hereafter referred to as the “matching cloud fraction”); Figure 7c illustrates the cloud fraction distribution retrieved using the MRM, which serves as the initial cloud fraction for the generalized variational retrieval iteration; and Figure 7d shows the final cloud fraction distribution after the generalized variational iteration. The blank area in the lower-left corner of Figure 7 corresponds to the scanning boundary of FY-4A/GIIRS, where no valid observation data are available.
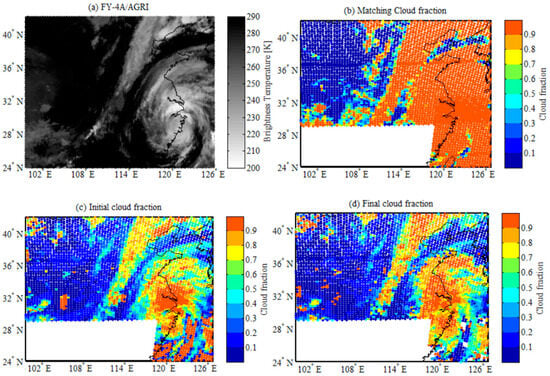
Figure 7.
Cloud imagery and cloud fraction distributions. (a) FY-4A/AGRI cloud imagery; (b) Matching cloud fraction; (c) Initial cloud fraction; (d) Final cloud fraction.
As shown in Figure 7, the cloud fraction obtained from the FY-4A/AGRI cloud mask product (CLM) yields relatively fewer clear-sky FOVs, resulting in the loss of a considerable amount of useful information during the variational retrieval process. Furthermore, such sparse data coverage can hinder the effective extraction of key features in high-impact weather monitoring, particularly those related to cloud structures associated with moist processes. The cloud fraction retrieved using the MRM still shows some misclassified FOVs—for example, in the lower-right portion of Figure 7c. In contrast, the final cloud fraction after the generalized variational retrieval iteration exhibits much better consistency with the FY-4A/AGRI cloud imagery, with significant improvements in regions where the MRM initially misclassified clouds.
4.4.2. Analysis of Atmospheric Precipitable Water Retrieval
On a climatic scale, PWV and cloud fraction generally exhibit a significant positive correlation. Humid climatic regions contain abundant water vapor, which provides sufficient material for cloud formation, thereby resulting in higher mean cloud fractions. An increase in PWV can amplify the greenhouse effect by influencing the radiative properties of clouds [54]. However, on a weather scale, the relationship between PWV and cloud fraction becomes more complex. During the early stage of storm development, the accumulation of PWV is often accompanied by an increase in cloud fraction. In contrast, during periods of intense precipitation, the cloud fraction remains high, whereas PWV decreases due to the condensation and fallout of water vapor, which may lead to a temporary negative correlation. PWV is a necessary condition for cloud formation and thus serves as an important indicator of cloud development [55]. In this study, the precipitable water vapor (PWV) for each corresponding FOV was further derived by vertically integrating the atmospheric profiles, serving as an auxiliary indicator for the identification of high-impact weather events.
The atmospheric profiles were obtained from the full FOV meteorological variables retrieved through the generalized variational retrieval framework. According to Zhu et al. [56], PWV refers to the total depth of liquid water that would result if all the water vapor contained in a vertical atmospheric column of unit cross-sectional area were condensed. It is an important parameter for quantifying the total atmospheric moisture content.
The PWV is calculated from the atmospheric fields retrieved through the generalized variational iteration, using the following equation [57,58]:
where denotes the specific humidity at each pressure layer, is the surface pressure, and represents the tropopause pressure.
Figure 8 presents the cloud imagery and PWV associated with Typhoon Lekima at 00:00:00 UTC on 10 August 2019. Figure 8a shows the FY-4A/AGRI cloud imagery; Figure 8b displays the ERA5 Total Column Water Vapour (TCWV) product; Figure 8c presents the PWV derived by integrating FNL atmospheric profiles (denoted as FNL PWV); Figure 8d shows the PWV obtained by integrating the atmospheric profiles retrieved from FY-4A/GIIRS (denoted as GIIRS PWV); Figure 8e depicts the precipitation values from automatic rain gauge stations; and Figure 8f shows the IMERG precipitation product.
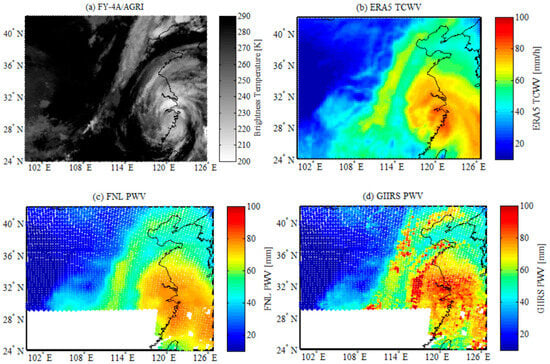
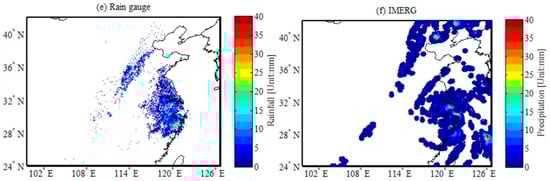
Figure 8.
Cloud imagery, precipitable water, and precipitation distributions. (a) FY-4A/AGRI cloud imagery; (b) ERA5 TCWV product; (c) FNL PWV; (d) GIIRS PWV; (e) Rain gauge precipitation; (f) IMERG precipitation product.
As shown in Figure 8, the retrieved PWV exhibits a pronounced high-value region along the northwestern outer spiral rainband of Typhoon Lekima (2019), with local PWV values approaching 100 mm. These values are noticeably higher than those of the corresponding TCWV fields in the ERA5 reanalysis, and they align well with the distribution of observed precipitation. In some cases, a single high-value FOV or localized region can play a critical role in the monitoring and early warning of high-impact weather events. The retrieval results not only effectively compensate for the limitations of reanalysis data in representing the moisture characteristics of typhoon spiral rainbands, but also provide important guidance for identifying and forecasting short-duration heavy rainfall induced by mesoscale and sub-synoptic systems embedded within the rainbands. Therefore, the PWV retrieved in this study can be effectively applied to the monitoring of high-impact weather, offering valuable scientific reference and support for meteorological disaster early warning.
It is worth noting that the results presented here are qualitative comparisons; quantitative validation and detailed analyses will be carried out in future work.
5. Discussion
The generalized variational retrieval method developed in this study incorporates the Minimum Residual Method (MRM), simplified cloud simulation, and physical constraints. The following paragraphs provide corresponding discussions based on the research and analyses presented in prior sections.
- (1)
- Channel combinations in the MRM. The combination of satellite channels is the core and prerequisite for applying the MRM [14,24]. MRM utilizes the characteristic that different channels exhibit different sensitivities to clouds and the atmosphere, and retrieves cloud parameters by minimizing the overall residuals between the observed and simulated brightness temperatures across all available channels. The sensitivities of different channels of hyperspectral infrared sounders to the atmosphere and clouds are mainly reflected in their weighting functions. In this study, the “different channel combinations” in the MRM are not arbitrarily selected but are determined based on the optimal three-step channel selection strategy using information entropy.
- (2)
- Uncertainty analysis caused by the simplified cloud model. In this study, cloudy FOVs are assumed to be represented by a single-layer cloud structure. This is a reasonable and commonly used simplification adopted for computational efficiency considerations [59]. In the retrieval of hyperspectral infrared sounder data, the single-layer cloud assumption remains a widely applied and fundamental simplification model. However, it must be recognized that simplifying multilayer clouds that may exist in the real atmosphere into a single layer inevitably introduces uncertainties. These uncertainties are mainly reflected in the following aspects: the retrieved cloud-top height may not represent the actual highest cloud top; the retrieved cloud fraction may become an “equivalent value” for the entire cloud layer, thus failing to capture the true vertical structure [60]; and the subsequent retrieval of cloud microphysical parameters (e.g., effective particle radius) may also be affected by such uncertainties.
- (3)
- Physical basis for retrieving atmospheric parameters under cloud-covered FOVs. The variational retrieval method developed for FY-4A/GIIRS can estimate atmospheric variables beneath clouds, mainly owing to the following physical facts and methodological advantages. First, the incomplete cloud coverage and three-dimensional cloud structures. In weather systems such as typhoons, fine three-dimensional cloud structures often exist, including cloud gaps or optically thin edge regions [61]. Hyperspectral infrared sounders contain thousands of channels with varying sensitivities to cloud optical thickness, allowing certain channels to partially penetrate thin clouds or cloud gaps and thereby acquire information about the atmosphere beneath the clouds. Second, the advantages of the variational retrieval method. The core of the variational approach lies in the synergistic use of all selected channel observations. Even when thick clouds cause most channels to become saturated, the method can still utilize the limited but effective signals from a few channels that are sensitive to the middle and lower atmosphere and can partially penetrate cloudy regions (such as atmospheric window channels). These signals, combined with the background field, jointly constrain the temperature and humidity profiles beneath the clouds. This capability forms the physical foundation for the current all-sky assimilation of satellite infrared brightness temperature observations and is key to further improving numerical weather prediction [16].
- (4)
- Key constraints in the retrieval method for cloud-covered FOVs. In variational retrieval, the background field is usually derived from the forecast field of numerical weather prediction (NWP) models. In regions with cloud coverage and sparse observational information, the background field provides essential initial guesses and constraints [62]. The background field embodies the physical laws governing atmospheric dynamical and thermodynamical processes and thus provides a reasonable vertical structure of temperature and humidity profiles. Its role within the variational framework is to prevent physically unrealistic jumps in the retrieval results [63]. The function of the retrieval method is to use satellite observations to correct or adjust the information contained in the background field. Under typhoon conditions, although the background field may not be perfect, it can still provide typical features of water vapor distribution within the typhoon circulation, such as PWV near the eyewall region. The retrieval method employs a radiative transfer model (e.g., RTTOV) as the forward operator, which explicitly describes how radiation is absorbed, emitted, and scattered under different cloud and atmospheric conditions. This ensures that the retrieval process strictly follows the laws of physics. The background term in the cost function serves as a constraint to ensure that the final retrieval does not deviate excessively from a physically reasonable state. The strategy of using the background field as a supplement and physical constraint in regions with insufficient observational information is also a key principle in all-sky data assimilation, ensuring the stability and physical consistency of the retrieval results [16].
- (5)
- Analysis of the applicability of the generalized variational retrieval method. The variational retrieval method for cloud parameters and PWV developed in this study holds theoretical potential for global application. However, its practical performance may be influenced by regional weather extremes (e.g., strong convection) and requires localized validation in different climatic zones. Additionally, global implementation would require substantial computational resources. As a result, the operational application of the method in this study is constrained by both computational resources and the timeliness of variational retrieval. Future work will focus on improving computational efficiency through algorithm optimization. The exploration of acceleration techniques, such as machine learning, will be pursued to enhance processing speed while maintaining accuracy, thus better meeting the demands of real-time weather forecasting. Furthermore, the method’s applicability will be comprehensively evaluated using diverse global datasets, with particular focus on its performance in regions with complex weather systems and key areas along the Belt and Road Initiative.
6. Conclusions
High-impact weather events are often accompanied by the formation, development, and evolution of cloud systems. The effective utilization of infrared detector observations from meteorological satellites over cloudy regions has long been a global research focus and technical challenge. Taking Typhoons Lekima and Higos as examples, this study investigated the retrieval of full FOV cloud fraction and precipitable water vapor (PWV) based on the generalized variational retrieval framework using FY-4A/GIIRS observations. The main conclusions are summarized as follows:
- (1)
- Retrieval of initial cloud parameters.
Initial cloud parameters, including effective cloud fraction and effective cloud-top pressure, were retrieved at each FOV using the Minimum Residual Method (MRM). The retrieved cloud fraction showed good agreement with the FY-4A/AGRI cloud imagery, and the identified clear-sky FOVs were largely consistent with the FY-4A/AGRI cloud mask product (CLM). However, a few FOVs were misclassified as cloudy. Compared with clear-sky simulations, incorporating MRM-derived initial cloud parameters significantly improved the accuracy of brightness temperature simulations in cloudy regions, producing distributions more consistent with the observed typhoon cloud structures.
- (2)
- Generalized variational retrieval of cloud parameters.
The cloud parameters at each FOV were retrieved by introducing a cloud cost function as a constraint term within the variational assimilation functional. The cloud parameters obtained through the generalized variational iteration significantly improved the accuracy of FY-4A/GIIRS infrared brightness temperature simulations over cloudy regions. In the Typhoon Lekima case, the correlation coefficients between simulated and observed brightness temperatures exceeded 0.95 for most channels under cloudy-sky conditions, while the misclassified regions identified by the MRM were corrected. These results demonstrate the high reliability and accuracy of the generalized variational retrieval approach.
- (3)
- Retrieval and application of atmospheric precipitable water vapor (PWV).
The PWV values for the corresponding FOVs were obtained by vertically integrating the atmospheric fields retrieved through the generalized variational iteration. Results from the Typhoon Lekima experiment indicate that the retrieved PWV exhibits pronounced high-value regions along the northwestern outer spiral rainbands, with values notably higher than those of the corresponding ERA5 TCWV reanalysis data. This indicates that the PWV derived in this study may be more sensitive and effective in capturing the occurrence and evolution of high-impact weather events. However, extensive experiments and validations are required in future work.
Although the present study has achieved promising results, several limitations remain. The findings are based on a limited number of case studies and samples; thus, more extensive experiments will be conducted in future work. This study considered only cloud parameters, without accounting for the potential influence of cloud-related atmospheric profile variables on the simulated brightness temperatures. In addition, no numerical weather prediction (NWP) experiments were conducted in this work. Future research will build upon the current framework to address these aspects and will further extend the proposed methodology to FY-4B/GIIRS data, aiming to enhance the capability for high-impact weather monitoring, forecasting, and early warning.
Author Contributions
Conceptualization, G.W., S.Y. and X.Z.; methodology, G.W. and S.Y.; software, G.W., B.X., and Q.L.; validation, X.Z., Q.L., Y.L., Y.P. and C.F.; formal analysis, G.W., Y.L. and T.Z.; investigation, C.F. and F.X.; resources, B.X. and T.Z.; data curation, Q.L. and F.X.; writing—original draft preparation, G.W. and B.X.; writing—review and editing, S.Y. and B.X.; visualization, Y.L., and Y.P.; supervision, G.W.; project administration, G.W., S.Y. and X.Z.; funding acquisition, G.W. All authors have read and agreed to the published version of the manuscript.
Funding
This study was jointly supported by the Outstanding Youth Science Fund for Universities in Anhui Province of Anhui Province Higher Education Scientific Research Project (Grant 2022AH020093), the Natural Science Foundation of Anhui Province (Grant 2408085MD102, 2308085QD129), the Chaohu University Scientific Research Startup Funding Project (Grant KYQD-202211, KYQD-202114), the Discipline Construction Quality Improvement Project of Chaohu University (Grant XLZ202404), the Innovation and Development Special Project of Anhui Provincial Meteorological Bureau(Grant CXB202201), the Industrial-Academic-Research Collaboration Project(Grant hxkt20250187) and Natural Science Research Project of Anhui Educational Committee (Grant KJ2021A1027).
Data Availability Statement
The data presented in this study are available on request from the corresponding author and first author. The original data presented in the study are openly available in Zenodo at https://doi.org/10.5281/zenodo.17510993.
Acknowledgments
All datasets used in this study—including FY-4A/GIIRS, FY-4A/AGRI, the cloud mask product, FNL reanalysis data, ERA5 reanalysis data, IMERG product and rain gauge precipitation data—are publicly available. The FY-4A/GIIRS, FY-4A/AGRI, and cloud mask datasets can be downloaded from the National Satellite Meteorological Center of China (NSMC) website: http://satellite.nsmc.org.cn/portalsite/default.aspx?currentculture=en-US (accessed on 7 May 2025). The NCEP FNL (Final) reanalysis data are available from https://gdex.ucar.edu/datasets/d083002/ (accessed on 9 May 2025). The ERA5 reanalysis data can be downloaded from the Copernicus Climate Data Store: https://cds.climate.copernicus.eu/datasets (accessed on 10 May 2025). The IMERG product are available from https://gpm.nasa.gov/data/directory (accessed on 15 May 2025). The ground-based rain gauge precipitation data are available from http://data.cma.cn/ (accessed on 15 May 2025). We gratefully acknowledge the Numerical Weather Prediction Satellite Application Facility (NWP SAF) for providing the variational assimilation code freely online (https://nwp-saf.eumetsat.int/site/ (accessed on 23 April 2025)). We also thank the anonymous reviewers and the editorial team for their valuable comments, suggestions, and efforts during the review and handling of this manuscript.
Conflicts of Interest
The authors declare no conflicts of interest.
References
- Wang, G.; Han, W.; Yuan, S.; Wang, J.; Yin, R.Y.; Ye, S.; Xie, F. Retrieval of high-frequency temperature profiles by FY-4A/GIIRS based on generalized ensemble learning. J. Meteor. Soc. Japan 2024, 102, 241–264. [Google Scholar] [CrossRef]
- Liu, Z.Q.; Min, M.; Li, J.; Sun, F.L.; Di, D.; Ai, Y.F.; Li, Z.L.; Qin, D.Y.; Li, G.C.; Lin, Y.J.; et al. Local severe storm tracking and warning in pre-convection stage from the new generation geostationary weather satellite measurements. Remote Sens. 2019, 11, 383. [Google Scholar] [CrossRef]
- Kalmus, P.; Kahn, B.H.; Freeman, S.W.; van den Heever, S.C. Trajectory-enhanced AIRS observations of environmental factors driving severe convective storms. Mon. Weather Rev. 2019, 147, 1633–1653. [Google Scholar] [CrossRef]
- Smith, W.L.; Zhang, Q.; Shao, M.; Weisz, E. Improved severe weather forecasts using LEO and GEO satellite soundings. J. Atmos. Ocean. Technol. 2020, 37, 1203–1218. [Google Scholar] [CrossRef]
- Geer, A.J. Correlated observation error models for assimilating all-sky infrared radiances. Atmos. Meas. Tech. 2019, 12, 3629–3657. [Google Scholar] [CrossRef]
- Lim, A.H.; Li, Z.; Nebuda, S.E.; Jung, J.A. Assimilation of radiance tendency observations from geostationary satellites in NCEP’s Global Forecast System. Q. J. R. Meteorol. Soc. 2025, e70005. [Google Scholar] [CrossRef]
- Xie, Q.; Li, D.Q.; Yang, Y.; Ma, Y.Y.; Pan, X.; Chen, M. Impact of assimilating atmospheric motion vectors from Himawari-8 and clear-sky radiance from FY-4A GIIRS on binary typhoons. Atmos. Res. 2023, 282, 106550. [Google Scholar] [CrossRef]
- McNally, A.P. A note on the occurrence of cloud in meteorologically sensitive areas and the implications for advanced infrared sounders. Q. J. R. Meteorol. Soc. 2002, 128, 2551–2556. [Google Scholar] [CrossRef]
- Wang, G.; Wang, D.Y.; Han, W.; Yin, J. Typhoon cloud system identification and forecasting using the Feng-Yun 4A/Advanced Geosynchronous Radiation Imager based on an improved fuzzy clustering and optical flow method. Adv. Meteorol. 2019, 2019, 5890794. [Google Scholar] [CrossRef]
- Feng, J.; Qin, X.H.; Wu, C.Q.; Zhang, P.; Yang, L.; Shen, X.S.; Han, W.; Liu, Y.Z. Improving typhoon predictions by assimilating the retrieval of atmospheric temperature profiles from the FengYun-4A’s Geostationary Interferometric Infrared Sounder (GIIRS). Atmos. Res. 2022, 280, 106391. [Google Scholar] [CrossRef]
- Menzel, W.P.; Schmit, T.J.; Zhang, P.; Li, J. Satellite-based atmospheric infrared sounder development and applications. Bull. Am. Meteorol. Soc. 2018, 99, 583–603. [Google Scholar] [CrossRef]
- English, S.J.; Eyre, J.R.; Smith, J.A. A cloud-detection scheme for use with satellite sounding radiances in the context of data assimilation for numerical weather prediction. Q. J. R. Meteorol. Soc. 1999, 125, 2359–2378. [Google Scholar] [CrossRef]
- McNally, A.P.; Watts, P.D. A cloud detection algorithm for high-spectral-resolution infrared sounders. Q. J. R. Meteorol. Soc. 2003, 129, 3411–3423. [Google Scholar] [CrossRef]
- Eyre, J.R.; Menzel, W.P. Retrieval of cloud parameters from satellite sounder data: A simulation study. J. Appl. Meteorol. Clim. 1989, 28, 267–275. [Google Scholar] [CrossRef]
- Pangaud, T.; Fourrie, N.; Guidard, V.; Dahoui, M.; Rabier, F. Assimilation of AIRS radiances affected by Mid-to-Low-Level clouds. Mon. Weather Rev. 2009, 137, 4276–4292. [Google Scholar] [CrossRef]
- Geer, A.J.; Lonitz, K.; Weston, P.; Kazumori, M.; Okamoto, K.; Zhu, Y.Q.; Liu, E.H.; Collard, A.; Bell, W.; Migliorini, S.; et al. All-sky satellite data assimilation at operational weather forecasting centres. Q. J. R. Meteorol. Soc. 2018, 144, 1191–1217. [Google Scholar] [CrossRef]
- Vukicevic, T.; Greenwald, T.; Zupanski, M.; Zupanski, D.; Haar, T.V.; Jones, A.S. Mesoscale cloud state estimation from visible and infrared satellite radiances. Mon. Weather Rev. 2004, 132, 3066–3077. [Google Scholar] [CrossRef]
- Meirold-Mautner, I.; Prigent, C.; Defer, E.; Pardo, J.R.; Chaboureau, J.-P.; Pinty, J.-P.; Mech, M.; Crewell, S. Radiative transfer simulations using mesoscale cloud model outputs: Comparisons with passive microwave and infrared satellite observations for midlatitudes. J. Atmos. Sci. 2007, 64, 1550–1568. [Google Scholar] [CrossRef]
- Chevallier, F.; Kelly, G. Model clouds as seen from space: Comparison with geostationary imagery in the 11-m window channel. Mon. Weather Rev. 2002, 130, 712–722. [Google Scholar] [CrossRef]
- Saunders, R.; Hocking, J.; Turner, E.; Rayer, P.; Rundle, D.; Brunel, P.; Vidot, J.; Roquet, P.; Matricardi, M.; Geer, A.; et al. An update on the RTTOV fast radiative transfer model (currently at version 12). Geosci. Model Dev. 2018, 11, 2717–2737. [Google Scholar] [CrossRef]
- White, C.H.; Heidinger, A.K.; Ackerman, S.A. Probing the explainability of neural network cloud-top pressure models for LEO and GEO imagers. Artif. Intell. Earth Syst. 2022, 1, e210001. [Google Scholar] [CrossRef]
- Pavelin, E.G.; English, S.J.; Eyre, J.R. The assimilation of cloud-affected infrared satellite radiances for numerical weather prediction. Q. J. R. Meteorol. Soc. 2008, 134, 737–749. [Google Scholar] [CrossRef]
- Wang, G.; Zhang, J.W. Generalised variational assimilation of cloud-affected brightness temperature using simulated hyper-spectral atmospheric infrared sounder data. Adv. Space Res. 2014, 54, 49–58. [Google Scholar] [CrossRef]
- Lee, A.; Sohn, B.-J.; Pavelin, E.; Kim, Y.; Kang, H.-S.; Saunders, R.; Noh, Y.-C. Assessment of cloud retrieval for IASI 1D-var cloudy-sky assimilation and improvement with an ANN approach. Weather Forecast. 2020, 35, 1363–1380. [Google Scholar] [CrossRef]
- Geer, A.J.; Migliorini, S.; Matricardi, M. All-sky assimilation of infrared radiances sensitive to mid- and upper-tropospheric moisture and cloud. Atmos. Meas. Tech. 2019, 12, 4903–4929. [Google Scholar] [CrossRef]
- Minamide, M.; Posselt, D.J. Improving tropical cyclone intensification prediction using high-resolution all-sky Geostationary Operational Environmental Satellite data assimilation. Q. J. R. Meteorol. Soc. 2025, 151, e4958. [Google Scholar] [CrossRef]
- Xie, Q.; Li, D.Q.; Yang, Y.; Zhao, Y.H.; Li, H.; Zhu, S.J.; Pan, X. Exploring the assimilation of all-Sky FY-4A GIIRS radiances and its forecasts for binary Typhoons. IEEE J. Sel. Top. Appl. Earth Obs. Remote Sens. 2025, 18, 5949–5959. [Google Scholar] [CrossRef]
- Yang, J.; Zhang, Z.Q.; Wei, C.Y.; Lu, F.; Guo, Q. Introducing the new generation of Chinese geostationary weather satellites, FengYun-4. Bull. Am. Meteorol. Soc. 2017, 98, 1637–1658. [Google Scholar] [CrossRef]
- Jang, H.-S.; Sohn, B.-J.; Chun, H.-W.; Li, J.; Weisz, E. Improved AIRS temperature and moisture soundings with local a priori information for the 1DVAR method. J. Atmos. Ocean Tech. 2017, 34, 1083–1095. [Google Scholar] [CrossRef]
- Zhu, L.; Bao, Y.; Petropoulos, G.P.; Zhang, P.; Lu, F.; Lu, Q.; Wu, Y.; Xu, D. Temperature and humidity profiles retrieval in a plain area from Fengyun-3D/HIRAS sensor using a 1D-VAR assimilation Scheme. Remote Sens. 2020, 12, 435. [Google Scholar] [CrossRef]
- Xue, Q.M.; Guan, L.; Shi, X.N. One-dimensional variational retrieval of temperature and humidity profiles from the FY4A GIIRS. Adv. Atmos. Sci. 2022, 39, 471–486. [Google Scholar] [CrossRef]
- Huang, P.Y.; Guo, Q.; Han, C.P.; Zhang, C.M.; Yang, T.H.; Huang, S. An improved method combining ANN and 1D-Var for the retrieval of atmospheric temperature profiles from FY-4A/GIIRS hyperspectral data. Remote Sens. 2021, 13, 481. [Google Scholar] [CrossRef]
- Malmgren-Hansen, D.; Laparra, V.; Nielsen, A.A.; Camps-Valls, G. Statistical retrieval of atmospheric profiles with deep convolutional neural networks. ISPRS J. Photogramm. Remote Sens. 2019, 158, 231–240. [Google Scholar] [CrossRef]
- Maier, J.; Knuteson, R. Data fusion of GEO FY-4A GIIRS and LEO hyperspectral infrared sounders with surface observations: A Hong Kong case study. J. Atmos. Ocean. Tech. 2022, 39, 259–270. [Google Scholar] [CrossRef]
- Gao, Y.; Mao, D.Y.; Wang, X.; Qin, D.Y. Evaluation of FY-4A temperature profile products and application to winter precipitation type diagnosis in southern China. Remote Sens. 2022, 14, 2363. [Google Scholar] [CrossRef]
- Kahn, B.H.; Berndt, E.B.; Case, J.L.; Kalmus, P.M.; Richardson, M.T. A nowcasting approach for low-earth-orbiting hyperspectral infrared soundings within the convective environment. Weather Forecast. 2023, 38, 1295–1312. [Google Scholar] [CrossRef]
- Esmaili, R.B.; Smith, N.; Berndt, E.B.; Dostalek, J.F.; Kahn, B.H.; White, K.; Barnet, C.D.; Sjoberg, W.; Goldberg, M. Adapting satellite soundings for operational forecasting within the hazardous weather testbed. Remote Sens. 2020, 12, 886. [Google Scholar] [CrossRef]
- Kalluri, S.; Barnet, C.; Divakarla, M.; Esmaili, R.; Nalli, N.; Pryor, K.; Reale, T.; Smith, N.; Tan, C.; Wang, T.; et al. Validation and utility of satellite retrievals of atmospheric profiles in detecting and monitoring significant weather events. Bull. Am. Meteorol. Soc. 2022, 103, E570–E590. [Google Scholar] [CrossRef]
- Deng, C.H.; Di, D.; Li, J. The effect of surface observations on enhancing the GIIRS thermodynamic profile retrieval. Remote Sens. 2024, 16, 4634. [Google Scholar] [CrossRef]
- Noh, Y.-C.; Sohn, B.-J.; Kim, Y.; Joo, S.; Bell, W.; Saunders, R. A new infrared atmospheric sounding interferometer channel selection and assessment of its impact on Met Office NWP forecasts. Adv. Atmos. Sci. 2017, 34, 1265–1281. [Google Scholar] [CrossRef]
- Zhang, L.; Niu, Z.Y.; Weng, F.Z.; Dong, P.M.; Huang, W.; Zhu, J. Impacts of direct assimilation of the FY-4A/GIIRS long-wave temperature sounding channel data on forecasting typhoon In-Fa (2021). Remote Sens. 2023, 15, 355. [Google Scholar] [CrossRef]
- Ma, Z.; Li, J.; Han, W.; Li, Z.L.; Zeng, Q.C.; Menzel, W.P.; Schmit, T.J.; Di, D.; Liu, C.-Y. Four-dimensional wind fields from geostationary hyperspectral infrared sounder radiance measurements with high temporal resolution. Geophys. Res. Lett. 2021, 48, e2021GL093794. [Google Scholar] [CrossRef]
- Wang, G.; Han, W.; Ye, S.; Yuan, S.; Wang, J.; Xie, F. FY-4A/AGRI infrared brightness temperature estimation of precipitation based on multi-model ensemble learning. Earth Space Sci. 2024, 11, e2023EA003311. [Google Scholar] [CrossRef]
- Min, M.; Wu, C.Q.; Li, C.; Liu, H.; Xu, N.; Wu, X.; Chen, L.; Wang, F.; Sun, F.L.; Qin, D.Y.; et al. Developing the science product algorithm testbed for Chinese next-generation geostationary meteorological satellites: Fengyun-4 series. J. Meteor. Res. 2017, 31, 708–719. [Google Scholar] [CrossRef]
- Hersbach, H.; Bell, B.; Berrisford, P.; Hirahara, S.; Horanyi, A.; Munoz-Sabater, J.; Nicolas, J.; Peubey, C.; Radu, R.; Schepers, D.; et al. The ERA5 global reanalysis. Q. J. R. Meteorol. Soc. 2020, 146, 1999–2049. [Google Scholar] [CrossRef]
- Niu, Z.Y.; Wang, L.W.; Kumar, P. Scale analysis of typhoon In-Fa (2021) based on FY-4A geostationary interferometric infrared sounder (GIIRS) observed and all-sky-simulated brightness temperature. Remote Sens. 2023, 15, 4035. [Google Scholar] [CrossRef]
- Sounak, K.B.; Chandrasekar, V. Cross-validation of observations between the GPM dual-frequency precipitation radar and ground based dual-polarization radars. Remote Sens. 2018, 10, 1773. [Google Scholar] [CrossRef]
- Ye, G.J.; Yu, H.; Ao, X.Y.; Zhang, X. The urban effects on the planetary boundary layer wind structures of Typhoon Lekima (2019). Atmos. Res. 2025, 313, 107756. [Google Scholar] [CrossRef]
- Di, D.; Li, J.; Han, W.; Bai, W.G.; Wu, C.Q.; Menzel, W.P. Enhancing the fast radiative transfer model for FengYun-4 GIIRS by using local training profiles. J. Geophys. Res.-Atmos. 2018, 123, 12583–12596. [Google Scholar] [CrossRef]
- Zhang, Q.; Yu, Y.; Zhang, W.M.; Luo, T.L.; Wang, X. Cloud detection from FY-4A’s geostationary interferometric infrared sounder using machine learning approaches. Remote Sens. 2019, 11, 3035. [Google Scholar] [CrossRef]
- Rabier, F.; Fourrie, N.; Chafai, D.; Prunet, P. Channel selection methods for infrared atmospheric sounding interferometer radiances. Q. J. R. Meteorol. Soc. 2002, 128, 1011–1027. [Google Scholar] [CrossRef]
- Fowler, A.M. A sampling method for quantifying the information content of IASI channels. Mon. Weather Rev. 2017, 145, 709–725. [Google Scholar] [CrossRef]
- Vittorioso, F.; Guidard, V.; Fourrie, N. An infrared atmospheric sounding interferometer-new generation (IASI-NG) channel selection for numerical weather prediction. Q. J. R. Meteorol. Soc. 2021, 147, 3297–3317. [Google Scholar] [CrossRef]
- Soden, B.J.; Held, I.M. An assessment of climate feedbacks in coupled ocean-atmosphere models. J. Clim. 2006, 19, 3354–3360. [Google Scholar] [CrossRef]
- Trenberth, K.E.; Dai, A.; Rasmussen, R.M.; Parsons, D.B. The changing character of precipitation. Bull. Am. Meteorol. Soc. 2003, 84, 1205–1218. [Google Scholar] [CrossRef]
- Zhu, L.Y.; Zhou, R.L.; Di, D.; Bai, W.G.; Liu, Z.J. Retrieval of atmospheric water vapor content in the environment from AHI/H8 using both physical and random forest methods—A case study for typhoon Maria (201808). Remote Sens. 2023, 15, 498. [Google Scholar] [CrossRef]
- Wang, H.; Wei, M.; Li, G.P.; Zhou, S.H.; Zeng, Q.F. Analysis of precipitable water vapor from GPS measurements in Chengdu region: Distribution and evolution characteristics in autumn. Adv. Space Res. 2013, 52, 656–667. [Google Scholar] [CrossRef]
- Liu, Y.; Wang, G.; Zhang, T.; Wang, P.; Xu, B.; Xia, J. Research on applicability of GNSS PWV data in Northeast China and its application in intelligent precipitation prediction. Earth Space Sci. 2025, 12, e2025EA004344. [Google Scholar] [CrossRef]
- Turner, D.D.; Löhnert, U. Information content and uncertainties in thermodynamic profiles and liquid cloud properties retrieved from the ground-based Atmospheric Emitted Radiance Interferometer (AERI). J. Appl. Meteorol. Clim. 2014, 53, 752–771. [Google Scholar] [CrossRef]
- Heidinger, A.K.; Pavolonis, M.J.; Holz, R.E.; Baum, B.A.; Berthier, S. Using CALIPSO to explore the sensitivity to cirrus height in the infrared observations from NPOESS/VIIRS and GOES-R/ABI. J. Geophys. Res.-Atmos. 2010, 115, D00H20. [Google Scholar] [CrossRef]
- Heidinger, A.K.; Pavolonis, M.J. Gazing at cirrus clouds for 25 years through a split window. Part I: Methodology. J. Appl. Meteorol. Clim. 2009, 48, 1100–1116. [Google Scholar] [CrossRef]
- Eyre, J.R.; English, S.J.; Forsythe, M. Assimilation of satellite data in numerical weather prediction. Part I: The early years. Q. J. R. Meteorol. Soc. 2020, 146, 49–68. [Google Scholar] [CrossRef]
- Lorenc, A.C. Analysis methods for numerical weather prediction. Q. J. R. Meteorol. Soc. 1986, 112, 1177–1194. [Google Scholar] [CrossRef]
Disclaimer/Publisher’s Note: The statements, opinions and data contained in all publications are solely those of the individual author(s) and contributor(s) and not of MDPI and/or the editor(s). MDPI and/or the editor(s) disclaim responsibility for any injury to people or property resulting from any ideas, methods, instructions or products referred to in the content. |
© 2025 by the authors. Licensee MDPI, Basel, Switzerland. This article is an open access article distributed under the terms and conditions of the Creative Commons Attribution (CC BY) license (https://creativecommons.org/licenses/by/4.0/).