Highlights
What are the main findings?
- CWSI captured long-term drought dynamics across the Huang-Huai-Hai Plain, showing overall alleviation from 2005–2020.
- NDVI, LST, and Rainfall were dominant and stable drought drivers, while SAT, DSR, and DEM had spatially variable effects.
What are the implications of the main findings?
- A novel LISA–RF framework was developed to spatially identify varying drought drivers.
- The findings support region-specific drought monitoring and management strategies.
Abstract
Agricultural drought poses a critical constraint to food security and regional sustainable development, particularly in the Huang-Huai-Hai Plain, a major grain-producing region characterized by high spatial heterogeneity in drought risk. Previous studies have demonstrated that the Crop Water Stress Index (CWSI) outperforms traditional meteorological indices in detecting agricultural droughts in various regions. However, there is limited research specifically focusing on its spatiotemporal dynamics and the complex relationships with environmental factors, particularly in the Huang-Huai-Hai Plain. To fill this gap, this study first estimated CWSI using remote sensing evapotranspiration data and systematically assessed the spatiotemporal dynamics of agricultural drought in the Huang-Huai-Hai Plain from 2005 to 2020. Then, an integrated analytical framework that combines Local Indicators of Spatial Association (LISA) with Random Forest (RF) modeling has been proposed to identify primary environmental drivers. Results revealed a general downward trend in CWSI over the study period, with drought hotpots primarily concentrated in the central plains and along the eastern foothills of the Taihang Mountains. LISA identified four distinct spatial cluster types and revealed significant spatial associations between CWSI and six environmental variables. The major driving factors of CWSI included vegetation conditions (NDVI), land surface temperature (LST), rainfall, and temperature-related factors (SAT, DSR), with LST and SAT exhibiting the strongest correlations with CWSI in multiple regions. Among these, LST and SAT exhibited strong positive correlations with CWSI in multiple regions. By integrating spatial clustering and variable importance analysis, we found that agricultural drought patterns are shaped by interacting environmental factors, with region-specific dominant mechanisms. This study provides a novel analytical framework that bridges remote sensing, spatial statistics, and machine learning, offering valuable insights and tools for drought monitoring and attribution at regional scales.
1. Introduction
Drought is a complex and multifaceted environmental phenomenon resulting from the interplay of climatic, hydrological, pedological, and anthropogenic factors [1,2]. It can exert profound impacts on water resources, agricultural productivity, ecosystems, and socio-economic stability [3]. Droughts are generally classified into three major types: meteorological, hydrological, and agricultural droughts, based on the nature of the affected system [4]. Among these, agricultural drought is of particular importance, as it refers to deficits in soil moisture within the crop root zone that directly hinder crop development and reduce yield potential [5,6]. Agricultural drought arises from the combined effects of precipitation, evapotranspiration, vegetation response, and land surface energy balance [6,7,8,9]. Given its direct implications for food security and rural livelihoods, a comprehensive understanding of the spatiotemporal dynamics of agricultural drought and its environmental drivers is essential for enhancing early warning systems, improving agricultural planning, and fostering regional sustainable development.
Agricultural drought indices are widely used to assess drought severity and monitor its effects on crop growth [10,11]. Because crop yield is closely tied to root-zone soil moisture, many commonly used indices, such as the Palmer Drought Severity Index (PDSI), Standardized Precipitation Evapotranspiration Index (SPEI), and Temperature Vegetation Dryness Index (TVDI), indirectly reflect agricultural drought by incorporating precipitation, evapotranspiration, or soil water balance [12]. For example, PDSI considers precipitation, soil moisture, evapotranspiration, and runoff, offering a comprehensive view of drought conditions [13]. However, its high data requirements and complex calculations limit its applicability for near-real-time or large-scale monitoring. SPEI integrates both precipitation and potential evapotranspiration (PET) and allows multi-temporal analysis, but its accuracy depends on long-term meteorological data, making it unsuitable in regions with limited station records [14]. TVDI, derived from the relationship between Land Surface Temperature (LST) and vegetation index, captures the degree of surface dryness by measuring the deviation of LST from its expected value under a given vegetation condition [15]. It enables spatially continuous monitoring of soil moisture stress over vegetated areas and is particularly useful in data-scarce environments [16,17]. However, TVDI is sensitive to land cover heterogeneity and surface roughness, and its accuracy can be affected by atmospheric and radiometric noise. Given these limitations, drought indices that directly integrate surface energy balance and vegetation water stress represent a promising alternative for monitoring agricultural drought. The Crop Water Stress Index (CWSI), derived from remotely sensed actual evapotranspiration (ET) and PET, directly reflects vegetation water stress and land surface energy balance [18,19,20,21]. By integrating both atmospheric water demand and surface moisture availability, CWSI provides a dynamic, spatially explicit, and responsive measure of agricultural drought [22]. It eliminates the reliance on dense ground-based observations and allows for consistent monitoring across both time and space, particularly in regions with limited meteorological infrastructure [23,24,25,26]. CWSI is widely used for monitoring crop water status, irrigation, and drought risk, and the availability of long-term satellite ET and PET datasets facilitates large-scale drought monitoring [27]. In addition, CWSI can capture fine-scale spatial variability within agricultural landscapes, respond rapidly to short-term meteorological changes, and be combined with other geospatial and statistical methods to assess drought-environment interactions. These features make CWSI particularly suitable for large-scale drought assessment, water resource management, and early warning systems in complex and heterogeneous agricultural areas [28].
The Huang-Huai-Hai Plain, located in eastern China, is one of the nation’s most critical agricultural production zones, characterized by intensive cultivation dominated by winter wheat–summer maize rotation [29,30]. With its flat terrain, fertile soils, and well-developed agricultural infrastructure, the region plays a pivotal role in national food security [31,32]. However, in recent years, climate change and intensified human activities have led to increasing water scarcity and more frequent drought events, posing serious challenges to sustainable agricultural development [33,34]. Given the significant spatial variability in land use, vegetation cover, and climatic conditions, effective drought monitoring in this region requires spatially continuous and physically grounded indicators [35,36]. Previous studies have shown that the CWSI outperforms other indices in capturing drought characteristics in this area [37]. Nevertheless, most existing studies remain limited to temporal analysis or simple correlations, often overlooking the spatial heterogeneity of drought-environment interactions across large regions [35,38]. This absence of spatially explicit and methodologically robust analysis has impeded a comprehensive understanding of the complex interactions between drought and environmental factors in the region, thereby constraining the formulation of targeted and effective drought mitigation strategies.
To address the above limitations, this study employs the CWSI in combination with Local Indicators of Spatial Association (LISA) and Random Forest (RF) methods to examine the spatial heterogeneity between agricultural drought and environmental factors across the Huang-Huai-Hai region, thereby revealing their spatial coupling patterns [39,40]. To better understand the environmental drivers of drought, this study considers six key variables: Normalized Difference Vegetation Index (NDVI), LST, Rainfall, Surface Air Temperature (SAT), Downward Shortwave Radiation (DSR), and Digital Elevation Model (DEM). These variables represent vegetation conditions, surface energy, water inputs, and topographic context, offering a multi-dimensional view of the ecological, hydrological, and meteorological foundations of drought processes [41,42]. By integrating spatial correlation analysis with explanatory modeling, this approach provides a robust analytical framework for understanding the spatially heterogeneous mechanisms driving agricultural drought variation in the Huang-Huai-Hai Plain. The main research components are as follows: (1) analyzing the spatiotemporal evolution of drought intensity using CWSI, including drought classification and trend detection; (2) identifying spatial clustering relationships between agricultural drought and environmental variables using LISA; (3) constructing RF models within LISA-defined clusters to assess the relative importance of each environmental factor influencing agricultural drought.
2. Materials and Methods
2.1. Description of the Study Area
The Huang-Huai-Hai Plain, located in eastern China, is one of the country’s three major grain-producing regions and a representative area of intensive double-cropping agriculture [29,43]. The region covers Henan, Shandong, and the Beijing-Tianjin-Hebei area, and is characterized by flat topography, fertile soils, and abundant arable land, making it highly suitable for agricultural development (Figure 1a,b) [44,45]. The dominant cropping system is the winter wheat-summer maize rotation, which is highly dependent on water availability. Climatically, the region belongs to the warm temperate semi-humid monsoon zone, with hot, rainy summers and cold, dry winters. The average annual precipitation ranges from 500 to 800 mm, but its spatial and interannual distribution is uneven (Figure 1c,d) [46,47]. In recent years, climate change and growing human pressures, especially the overextraction of groundwater, have increased the frequency and severity of drought events, posing serious threats to crop yields and regional food security [30]. The region also faces mounting water resource stress, as groundwater has become the primary source of irrigation [48]. Inefficient water use and widespread traditional irrigation methods have further aggravated drought risks [49]. Therefore, understanding the spatiotemporal dynamics of drought and its driving mechanisms is crucial for sustainable agricultural development and water resource management in the Huang-Huai-Hai Plain.
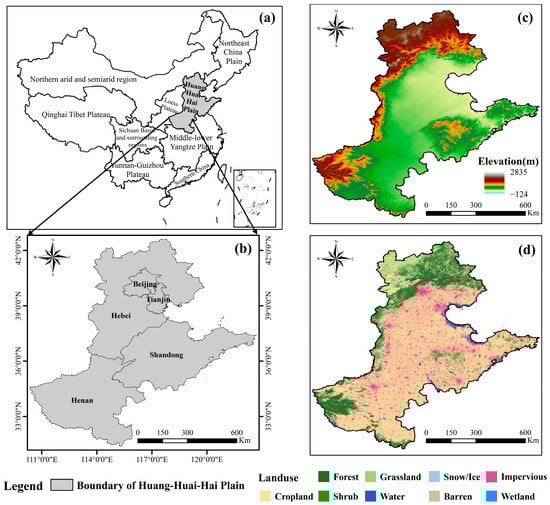
Figure 1.
Overview of the study area. (a) geographical location, (b) division of provinces and cities, (c) elevation, and (d) land use. Provincial administrative boundary data comes from https://map.tianditu.gov.cn/ (accessed on 1 June 2025) (GS(2024)0650).
2.2. Data Sources
This study utilized multiple remote sensing and ancillary datasets to analyze the spatiotemporal variation in drought and its influencing factors in the Huang-Huai-Hai Plain over the period 2005 to 2020. Detailed information on the datasets is provided in Table 1.

Table 1.
A summary of the data used in this study.
The ET and PET datasets used in this study were derived from the MOD16A2GF product (NASA Earth Science Data Systems, National Aeronautics and Space Administration, Washington, DC, USA), which provides global evapotranspiration data at a spatial resolution of 500 m and a temporal resolution of 8-day [50]. As an improved and quality-controlled version, MOD16A2GF offers more accurate estimates of terrestrial evapotranspiration and is particularly suitable for large-scale hydrological and drought monitoring. It has therefore been widely adopted in agricultural and ecological applications. All calculations were performed on the Google Earth Engine (GEE) platform (https://code.earthengine.google.com/ (accessed on 15 June 2025)), where four MODIS tiles covering the Huang-Huai-Hai Plain were extracted. To obtain annual-scale CWSI, ET and PET were first used to calculate 8-day CWSI values. These were then averaged for each pixel over all 8-day periods within the same year to produce annual CWSI images. This process was carried out without any resampling, preserving the original 500 m spatial resolution of the MOD16A2GF product. The resulting annual average CWSI values provide reliable support for regional-scale analysis of water fluxes and drought assessment.
The NDVI dataset used in this study was obtained from the Annual NDVI Spatial Distribution Dataset of China, which is based on the MOD13A1 product [51]. This dataset provides 16-day composite NDVI values at a spatial resolution of 500 m, processed using the Maximum Value Composite (MVC) method. It offers an effective representation of vegetation coverage distribution and its temporal dynamics across different regions of China. In this study, NDVI data from 2005 to 2020 were used to support the assessment of vegetation activity and drought conditions in the Huang-Huai-Hai Plain. The data were obtained from the Geographic Data Sharing Infrastructure, Global Resources Data Cloud (www.gis5g.com).
LST plays a critical role in drought monitoring, as it is closely related to surface energy balance and soil moisture conditions [52]. An increase in LST typically indicates reduced evapotranspiration and increased surface dryness, making it a reliable proxy for detecting water stress and drought-related thermal anomalies [53]. In this study, we employed the global monthly LST dataset, which was generated using a multi-temporal weighted averaging method (https://zenodo.org/records/6618442 (accessed on 15 June 2025)). The dataset provides high-quality LST products with a spatial resolution of 1 km for the period 2005–2020. With an RMSE of 1.60 K, it effectively reduces the influence of instantaneous fluctuations and captures both intra-annual variability and interannual trends in surface temperature. Owing to its temporal stability, this dataset is particularly suitable for large-scale drought analysis and long-term environmental monitoring. For this study, LST data covering the Huang-Huai-Hai Plain were extracted and averaged annually to obtain mean annual LST values from 2005 to 2020. These data were used to characterize the spatiotemporal thermal dynamics associated with surface water stress and to support the interpretation of regional drought patterns.
Rainfall and SAT are fundamental climatic variables for drought assessment, as water deficits and elevated temperatures are primary drivers of both meteorological and drought. Reduced precipitation directly limits soil moisture availability, while increased SAT enhances evapotranspiration, exacerbating water stress conditions. In this study, Rainfall and SAT data were obtained from the China Meteorological Forcing Dataset (CMFD, https://cstr.cn/18406.11.Atmos.tpdc.302088 (accessed on 15 June 2025)), which provides high-resolution gridded climate data at a spatial resolution of 1 km and a temporal coverage spanning multiple decades [54]. The CMFD integrates data from ground-based meteorological observations, satellite remote sensing, and reanalysis products, ensuring both spatial continuity and temporal accuracy. Monthly Rainfall and SAT data from 2005 to 2020 were aggregated to annual means to match the temporal resolution of other drought-related variables. These datasets were used to explore the spatiotemporal climate patterns driving surface moisture stress in the Huang-Huai-Hai Plain and to support attribution analysis of drought dynamics.
Incoming shortwave radiation data were obtained from the Global Land Surface Satellite Dataset (GLASS) DSR product (developed by Beijing Normal University, Beijing, China) (https://glass.hku.hk/download.html (accessed on 15 June 2025)), which provides high-quality radiation estimates at a spatial resolution of 0.05° [55,56]. The original daily DSR data were spatially resampled to match a 500 m resolution and temporally aggregated into annual mean values for the study period from 2005 to 2020. To ensure spatial consistency across datasets, each 0.05° grid cell was accurately mapped onto the corresponding 500 m pixels covering the Huang-Huai-Hai Plain through resampling. These radiation data serve as a critical input for analyzing surface energy balance and its role in influencing drought conditions in the region.
DEM at 500 m resolution was included to consider the topographic influence on drought patterns. The DEM data were sourced from the Shuttle Radar Topography Mission (SRTM, https://www.earthdata.nasa.gov/data/instruments/srtm (accessed on 15 June 2025)) and processed to match the spatial extent and resolution of the other datasets [57]. All datasets were preprocessed for spatial reprojection, resampling, and temporal aggregation to ensure compatibility. This harmonization allows for integrated analysis of the spatiotemporal variations and influencing factors of drought in the Huang-Huai-Hai Plain.
2.3. Methods
In this study, the CWSI was first calculated based on ET and PET data across the Huang-Huai-Hai Plain. Subsequently, the spatiotemporal variation characteristics of CWSI were systematically analyzed. To further explore the spatial associations between drought and the six associated environmental factors, NDVI, LST, Rainfall, SAT, DSR, and DEM, and LISA were employed to identify significant clustering patterns. Finally, RF models were applied within each cluster type to evaluate the relative importance of the six environmental variables in influencing drought conditions. The specific process is shown in Figure 2.
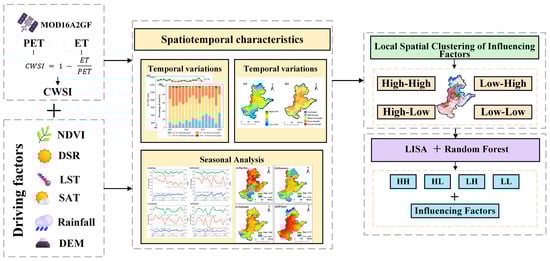
Figure 2.
Framework for the research process.
2.3.1. Crop Water Stress Index (CWSI)
The CWSI is a widely applied indicator for quantitatively assessing vegetation water stress by examining the balance between actual ET and PET. In this study, CWSI was calculated using the following formula [21]:
where ET denotes actual evapotranspiration, representing the water consumption by crops under prevailing soil moisture conditions; and PET denotes potential evapotranspiration, indicating the atmospheric water demand assuming unlimited soil moisture availability. The CWSI ranges from 0 to 1, with higher values indicating more severe water stress. By employing annually aggregated ET and PET data derived from remote sensing, CWSI effectively captures the spatiotemporal variability of crop water stress in the Huang-Huai-Hai Plain, providing a solid foundation for drought monitoring and subsequent attribution analysis. To analyze the temporal variation, the average CWSI, ET, and PET values across the entire study area were calculated for each year from 2005 to 2020, forming annual time series. For spatial variation, the mean CWSI values over the 2005 to 2020 period were calculated for each pixel to generate a spatial distribution map (Section 3.1). Furthermore, to better illustrate the intra-annual variation in CWSI, the spatiotemporal patterns were analyzed for the four seasons: spring, summer, autumn, and winter (Section 3.1).
2.3.2. Theil–Sen Median Trend and Mann–Kendall Test
To analyze the interannual trend of the CWSI in the Huang-Huai-Hai Plain from 2005 to 2020, this study applied a combined approach using the Theil–Sen median trend estimator and the Mann–Kendall nonparametric test [58]. The Theil–Sen median method is a nonparametric statistic that is robust to outliers and does not require any assumptions about data distribution [1]. It estimates the overall trend by calculating the median slope among all possible pairs of points in the time series. A positive slope indicates an increasing trend, whereas a negative slope indicates a decreasing trend. The Mann–Kendall test assesses the presence of a statistically significant monotonic trend in the time series without relying on distributional assumptions and allows for missing values. A significance level of α = 0.05 was used, and when the absolute value of the test statistic exceeds the critical value , the trend is considered significant. This combined method provides a robust and reliable quantitative analysis of CWSI temporal trends.
2.3.3. Local Indicators of Spatial Association (LISA)
Previous studies have primarily focused on the overall relationship between individual environmental factors and drought, often overlooking spatial variations within the study area [59]. Spatial zoning in such studies typically relies on single-variable thresholds, for example, using NDVI to divide regions into dense, moderate, and sparse vegetation zones for subsequent CWSI analysis. However, this univariate approach may fail to capture local differences in how environmental variables relate to drought severity. To overcome this limitation, the present study employs LISA to delineate spatial clusters by simultaneously considering both the magnitude of environmental variables and their spatial association with CWSI. Specifically, the Huang-Huai-Hai Plain was divided into four cluster types using LISA, allowing a more refined assessment of how drought severity relates to environmental drivers in different localized contexts. This approach highlights the spatial heterogeneity of drought mechanisms and improves the interpretability of environmental influences across the region. This study explores six environmental variables, including NDVI, LST, Rainfall, SAT, DSR, and DEM, and applied LISA to investigate their spatial relationships with CWSI. Unlike global spatial autocorrelation metrics that capture overall spatial trends, LISA, proposed by Anselin in 1995 [59], identifies localized spatial clusters and reveals spatial heterogeneity. The LISA statistic for a given spatial unit i is calculated as [59]:
where is the local spatial autocorrelation index for unit , and are the observed values for unit and its neighboring unit , is the mean of all observations, is the spatial weight between unit and , and is the total number of spatial units. Based on the LISA results, each spatial unit is classified into one of four cluster types: High–High (HH), Low–Low (LL), High–Low (HL), or Low–High (LH). The HH and LL types indicate statistically significant positive spatial clustering, representing areas with consistently high or low values. In contrast, HL and LH indicate significant negative spatial associations, representing spatial outliers where a high value is surrounded by low values, or vice versa.
2.3.4. Random Forests (RF)
To further investigate the environmental drivers of drought, RF models were introduced to analyze the spatial clustering patterns between CWSI and six environmental variables identified by LISA. The RF models were applied to quantitatively assess the relative importance of each variable within different cluster types, including HH, LL, HL, and LH. This approach effectively bridges LISA-based spatial clustering analysis with quantitative attribution methods, enabling the identification of dominant environmental drivers of drought in different regions and supporting region-specific drought management strategies. For each cluster type, hotspot and non-hotspot samples were extracted to construct a binary classification dataset (1 = cluster pixel, 0 = non-cluster pixel), using the six environmental variables as input features. The RF model was trained using the Gini index to measure node impurity, and variable importance was calculated as the mean decrease in impurity across all trees in the forest [60]:
where is the total number of trees and is the impurity reduction caused by variable in tree . The RF model was trained using 70% of the samples, with the remaining 30% used for testing. Standard classification metrics, including accuracy, precision, recall, and F1-score, were used to evaluate model performance and validate the reliability of the variable importance rankings. We selected RF due to its robustness to nonlinearities and multicollinearity among drivers, its interpretable feature-importance for attribution, and its practical stability with regional gridded data and multiple LISA defined clusters.
3. Results
3.1. Spatiotemporal Characteristics of CWSI in the Huang-Huai-Hai Plain
To examine the temporal evolution of agricultural drought in the Huang-Huai-Hai Plain, annual CWSI values and the underlying evapotranspiration dynamics (ET and PET) from 2005 to 2020 were analyzed (Figure 3a). During the study period, ET exhibited a statistically significant increasing trend (slope = 4.311 mm/yr, R2 = 0.528), suggesting improved water availability or crop physiological water use over time. In contrast, PET showed a marginally decreasing trend (slope = –0.336 mm/yr), though the associated R2 value (0.003) indicates an almost negligible explanatory power. The CWSI series, reflecting crop water stress conditions, demonstrated a clear downward trend (slope = –0.002/yr, R2 = 0.441), indicating an overall reduction in drought severity across the region. These findings indicate a gradual alleviation of surface drought conditions in the Huang-Huai-Hai Plain from 2005 to 2020. This trend is consistent with the simultaneous increase in ET and relative stabilization of PET, supporting the interpretation that surface moisture stress has gradually alleviated during the observed years.
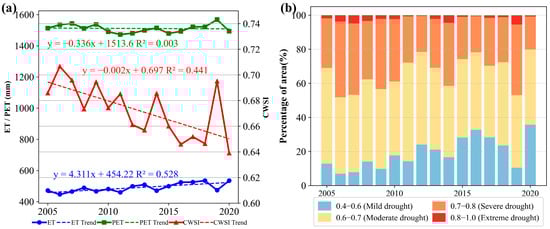
Figure 3.
Temporal variations from 2005 to 2020. (a) CWSI, ET, and PET, (b) percentage of CWSI drought class.
To further quantify drought severity, according to the national standards for meteorological drought classification in China [61], the CWSI values were categorized into five drought intensity levels, including no drought (0–0.4), mild (0.4–0.6), moderate (0.6–0.7), severe (0.7–0.8), and extreme drought (0.8–1.0), and their spatial proportion over time was analyzed (Figure 3b). The results reveal a pronounced temporal shift in drought structure. From 2005 to 2012, the landscape was predominantly characterized by moderate to severe drought conditions. However, starting around 2013, there was a noticeable increase in the proportion of mild drought areas, while the proportion of moderate and severe drought regions significantly declined. By 2020, areas without drought accounted for more than 30% of the region, compared to less than 10% in the early years. The proportion of extreme drought remained relatively small but persisted throughout the study period.
To further clarify the seasonal variability of drought evolution, the interannual changes in ET, PET, and CWSI were examined for each season from 2005 to 2020 (Figure 4). The results reveal distinct seasonal contrasts in evapotranspiration behavior and crop water stress across the Huang-Huai-Hai Plain. During the warm and humid growing seasons (spring to summer), ET increased markedly, particularly in summer, where it nearly doubled over the study period. Although PET showed slight fluctuations, its consistently high magnitude, together with the sharp rise in CWSI, highlights that enhanced evaporative demand outpaced the actual water supply, intensifying crop water stress under warming conditions. In contrast, during the cool seasons (autumn and winter), PET exhibited a gradual decline, while ET fluctuated modestly without a significant upward trend. Correspondingly, CWSI remained relatively stable or slightly decreased, implying that lower atmospheric demand and periodic moisture recovery mitigated drought stress during these periods. Overall, the seasonal evolution of CWSI reflects the interplay between hydro-climatic forcing and surface energy balance. The most pronounced water stress occurred in summer, while spring and winter exhibited relatively favorable moisture conditions, and autumn served as a transitional phase.
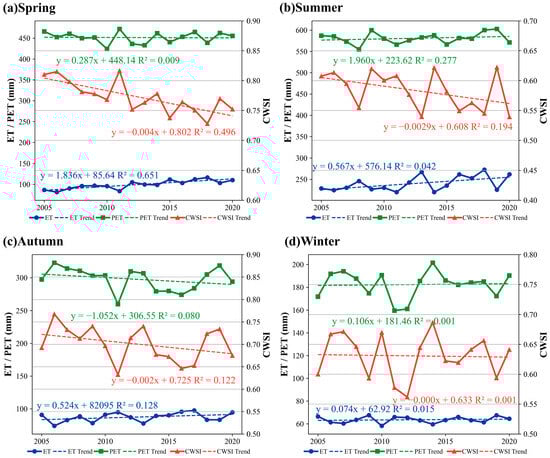
Figure 4.
Seasonal temporal dynamics of CWSI. (a) Spring, (b) summer, (c) autumn, and (d) winter.
In addition to temporal dynamics, the spatial distribution of drought severity across the Huang-Huai-Hai Plain from 2005 to 2020 was analyzed (Figure 5). The spatial distribution of the multi-year average CWSI (Figure 5a) reveals notable spatial heterogeneity. Higher CWSI values, indicating more severe crop water stress, were primarily concentrated in the central and southern parts of the study area, especially in eastern and central Henan, southwestern Shandong, and southern Hebei. In contrast, lower CWSI values were observed in the northern parts of the region, including northern Hebei, Beijing, Tianjin, and northern Shandong, suggesting more favorable moisture conditions. The long-term drought classification map (Figure 5b) based on the average CWSI further confirms the spatial divergence. Mild drought dominated the northern part of the plain, while moderate to severe drought conditions prevailed in the central and southern regions. Some localized hotspots of extreme drought were identified, primarily along the Taihang Mountains in the central part of the plain, where drought stress was most intense. The trend analysis based on the Theil–Sen median slope and Mann–Kendall test (Figure 5c) shows that large areas in the northern and northwestern parts of the region exhibited significant decreasing trends in CWSI (blue areas), indicating an improvement in drought conditions. Conversely, some localized regions in the south and southeast experienced significant increases in CWSI (red areas), suggesting worsening drought stress. Moreover, by comparing Figure 5b,c, it can be observed that areas classified as experiencing mild to moderate drought in the eastern region showed significant increasing trends in CWSI, indicating a growing severity of drought in these zones. In contrast, regions suffering from extreme drought, particularly along the Taihang Mountains in the west, exhibited significant decreasing trends in CWSI, suggesting a gradual alleviation of drought stress in the most severely affected areas.
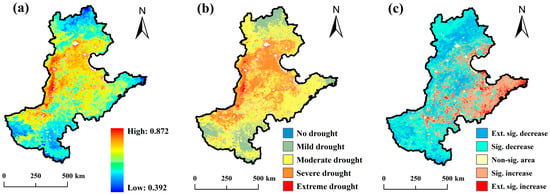
Figure 5.
The spatial distribution of CWSI. (a) Multi-year average CWSI, (b) long-term drought class, and (c) trend changes (Ext. sig. means Extremely significant, Sig. means Significant.).
In addition to the long-term spatial patterns in Figure 5, the multi-year seasonal distributions (Figure 6) reveal clear intra-annual contrasts across the Huang–Huai–Hai Plain. Spring (Figure 6a) exhibits widespread high CWSI, with pronounced hotspots over the central plain and parts of the north, indicating elevated water stress during the early growing period. Summer (Figure 6b) shows the lowest CWSI overall, especially across the northern plain and coastal belts, consistent with monsoonal rainfall and enhanced moisture availability. Autumn (Figure 6c) displays a re-intensification of drought stress along a central corridor stretching from eastern/central Henan into southwestern Shandong, while surrounding areas remain moderate. Winter (Figure 6d) presents persistently high CWSI over most of the region, except for a cooler, low-CWSI zone in the far north. Seasonal contrasts are high in spring and winter, low in summer, and moderate to high in autumn. They align spatially with the annual hotspots shown in Figure 5 and reflect the combined influence of hydro-climatic seasonality and surface conditions.
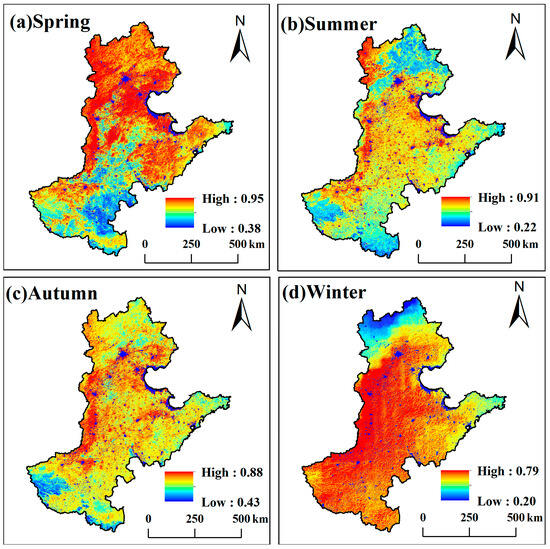
Figure 6.
Seasonal patterns of CWSI. (a) Spring, (b) summer, (c) autumn, and (d) winter.
3.2. Local Spatial Clustering of Influencing Factors
To examine the spatial association between drought and environmental variables, we employed the LISA method to identify localized clustering patterns between CWSI and six key environmental factors. To capture temporal evolution, four representative years (2005, 2010, 2015, and 2020) were selected, considering both data consistency and interannual climatic variability. Figure 7 presents the LISA cluster maps for these years, highlighting the spatial distribution of HH, HL, LH, and LL clusters across the Huang–Huai–Hai Plain. By construction, the bivariate LISA in Figure 7 encodes the local co-variation between each driver (first term) and CWSI (second term) as follows: HH = high driver–high CWSI, HL = high driver–low CWSI, LH = low driver–high CWSI, and LL = low driver–low CWSI. Spatial correspondence with Figure 5 shows that the high-CWSI corridor across the central plain and the eastern Taihang foothills co-locates with extensive LST-HH and SAT-HH clusters, consistent with energy-driven water stress, while adjacent areas display Rainfall-LH/HL patterns indicating precipitation deficits or mismatches. In contrast, low-CWSI regions in the northern and coastal parts more frequently align with Rainfall-HH/LL and SAT-LL/LH, suggesting relatively favorable hydrothermal conditions or compensating effects among drivers. These correspondences clarify how the local driver clusters (Figure 7) organize and explain the regional CWSI pattern (Figure 5).
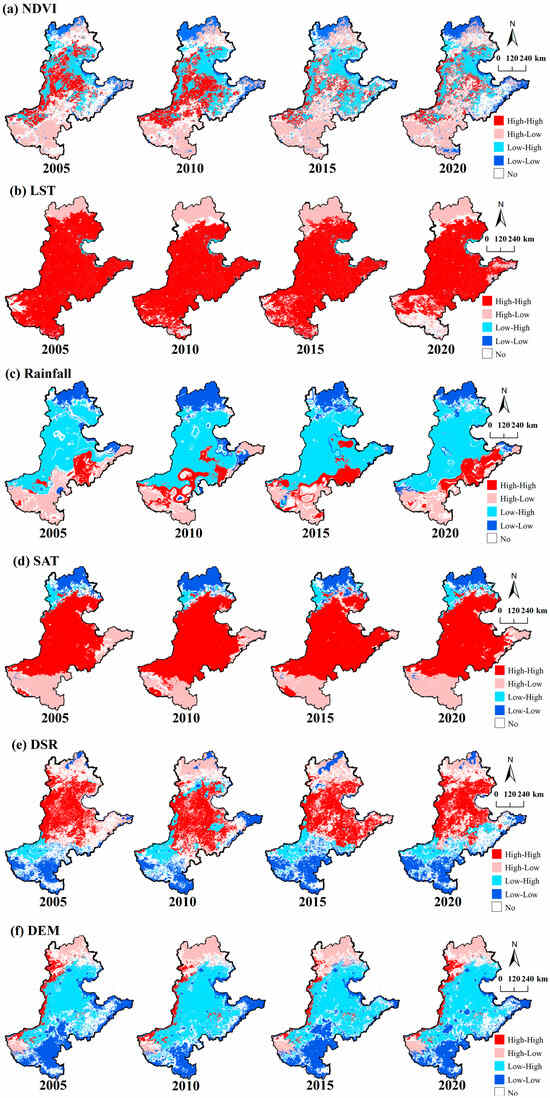
Figure 7.
Local Spatial Clustering Patterns between CWSI and Influencing Factors. (a) NDVI, (b) LST, (c) Rainfall, (d) SAT, (e) DSR, and (f) DEM.
The spatial association between CWSI and NDVI exhibited clear temporal and spatial variations (Figure 7a). In 2005, HH clusters were concentrated in the central region, indicating areas where dense vegetation still experienced significant drought stress. By 2010, LL clusters became dominant in the southeastern and coastal areas, suggesting regions with both low vegetation cover and high drought. This pattern persisted through 2015 and intensified in 2020, where a large proportion of the eastern and southern plain exhibited HL clustering, reflecting deteriorating vegetation conditions in severely drought-affected zones.
LISA results for LST consistently showed extensive HH clustering across all four years (Figure 7b). Nearly the entire Huang-Huai-Hai Plain was covered by HH areas, highlighting a strong and stable spatial correlation between land surface temperature and drought intensity. This persistent HH pattern indicates that elevated surface temperature is a major spatial driver of crop water stress in this region. SAT showed similar clustering behavior to LST (Figure 7d). HH clusters dominated the central and northern regions across all years, especially in 2010 and 2020. These areas consistently experienced high temperatures and high CWSI, suggesting temperature-driven drought stress is spatially persistent and widespread across the region. In contrast to LST, SAT exhibited distinct LH and LL clusters in the northern part of the plain. This pattern indicates that while certain areas experienced high air temperatures, the corresponding CWSI values were relatively low. Such decoupling may be attributed to compensatory factors such as enhanced precipitation, effective irrigation, or crop adaptation strategies that mitigated the impact of high air temperature on drought stress.
In contrast, the spatial clustering of Rainfall and CWSI exhibited a clear latitudinal gradient (Figure 7c). In the northern part of the study area, particularly northern Hebei, LL clusters dominated, indicating regions with both low precipitation and high drought intensity. In the central plain, most areas showed LH clustering, where low rainfall was associated with elevated CWSI values, suggesting strong drought stress under precipitation deficits. In contrast, the southern plain, especially southern Henan and southern Shandong, was characterized by HL clusters, implying that even in areas with relatively higher precipitation, drought stress remained significant, possibly due to enhanced evapotranspiration or other compounding factors. Additionally, over time, HH clusters shifted spatially from inland regions to the coastal areas of Shandong, indicating an expanding spatial overlap between high rainfall and high CWSI values. This spatiotemporal shift reflects the complex and region-specific mechanisms through which precipitation influences drought conditions.
Compared to other variables, the spatial association between DSR and CWSI was more fragmented (Figure 7e). In 2005 and 2010, HH clusters were mostly observed in the central plain, while LL clusters gradually emerged in 2015 and expanded significantly by 2020, particularly in the southeast. The shift in dominant cluster types over time suggests temporal instability in the radiation-drought relationship.
The spatial clustering between DEM and CWSI remained relatively stable throughout the study period (Figure 7f). LL clusters were primarily located in low-elevation areas, such as southern Henan and the coastal regions of Shandong, suggesting that lower elevations generally experienced less drought stress. In contrast, HH clusters were observed in mountainous and hilly regions, including areas along the Taihang Mountains and central Shandong uplands, indicating that higher elevations may also be associated with elevated CWSI under certain conditions. Additionally, the northern part of the plain, especially northern Hebei, exhibited HL clustering, suggesting that despite higher elevations, these regions maintained lower CWSI values, potentially influenced by favorable vegetation cover or irrigation practices.
3.3. Interpreting LISA Hotspots with RF Feature Analysis
Following the identification of significant local spatial clustering patterns between CWSI and influencing factors in Section 3.2, Section 3.3 aims to quantitatively evaluate the contribution of each variable within these clustered regions. Although LISA effectively reveals localized spatial associations, it does not provide a quantitative assessment of the relative importance of each environmental factor in driving drought patterns. To address this limitation and enhance the attribution analysis, RF models were applied to assess the variable importance within different cluster types (HH, HL, LH, and LL). This approach allows for a more detailed understanding of the dominant environmental drivers influencing drought stress in specific spatial contexts.
Model evaluation was conducted using standard classification metrics, including precision, recall, F1-score, and accuracy. However, since the focus of this study is on the spatially clustered regions that reflect drought hotspots (1 = cluster pixel,), only the model performance for this class is reported and discussed. Non-cluster pixels were not the target of the analysis and are thus excluded from the performance summary. This targeted evaluation ensures that the RF results directly support the interpretation of the core drought-prone zones. Overall, the classification performance across different cluster types and years was consistently high, with F1-scores ranging from 0.88 to 0.98 and accuracy values exceeding 0.96 (Table 2). These robust results indicate that the RF models effectively distinguish between clustered and non-clustered areas, supporting reliable identification of key environmental drivers.
Table 2.
Evaluation metrics of random forest models for LISA-defined cluster types (2005–2020).
Based on the LISA clustering results between CWSI and environmental factors, RF models were constructed for each cluster type (HH, HL, LH, LL) to identify the most important drivers of drought under different spatial interaction patterns. Figure 8 presents the RF-based variable importance scores across four selected years (2005, 2010, 2015, and 2020), where each row represents a specific cluster (e.g., NDVI-HH), and each column shows the relative importance of the six influencing variables (NDVI, LST, Rainfall, SAT, DSR, and DEM). The higher the score, the greater the explanatory power of that variable in the corresponding spatial context.
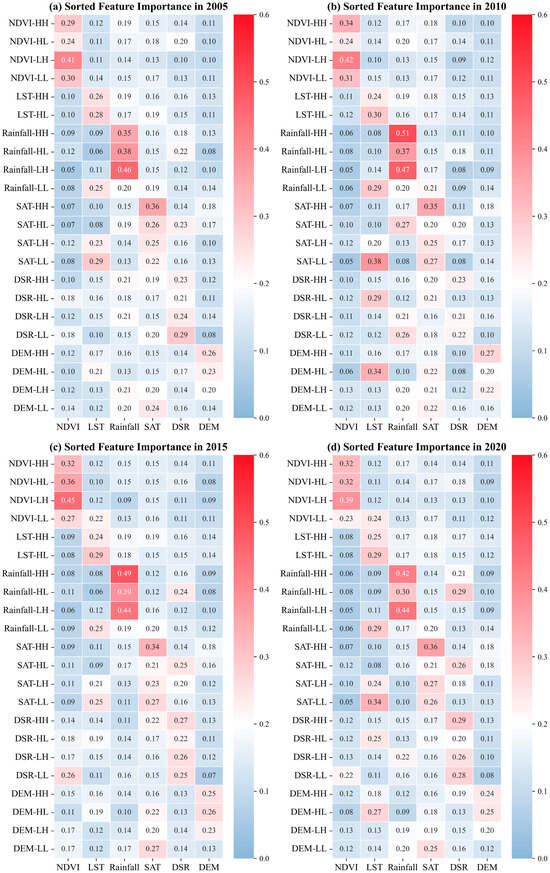
Figure 8.
Random Forest feature importance rankings for (a) 2005, (b) 2010, (c) 2015, and (d) 2020.
Across all cluster types and years, the variable importance scores of environmental factors showed minimal variation over time, indicating that the influence of each factor on drought patterns remained relatively consistent throughout the period from 2005 to 2020. This temporal consistency suggests that the temporal dimension had limited impact on the relative importance of drought drivers during the study period. NDVI, LST, and Rainfall consistently exhibit high importance scores across different spatial cluster types, indicating their stable and dominant roles in shaping drought patterns. This suggests strong spatial autocorrelation and robust explanatory power for drought variations. In contrast, the importance of SAT, DSR, and DEM varies significantly across cluster types. This inconsistency implies that these factors have more localized effects on drought, likely acting through indirect or synergistic interactions with other variables rather than serving as direct drivers.
NDVI: Specifically, in NDVI-based clusters, the importance scores of NDVI are notably high in both HH and LL cluster types. This indicates a dual regulatory role of vegetation cover on CWSI. In HH areas, high vegetation density leads to increased evapotranspiration demand, thereby driving higher CWSI values. Conversely, in LL areas, sparse vegetation may result in low CWSI values not because of actual moisture abundance, but due to limited evapotranspiration capacity caused by reduced vegetation cover, suppressing ET rather than reducing PET. Notably, in LH clusters, NDVI consistently shows the highest importance score across all years, exceeding 0.4. This pattern suggests that in areas with high drought stress but low vegetation coverage, CWSI is highly sensitive to changes in vegetation, and even minor NDVI fluctuations can lead to substantial changes in CWSI. This highlights the crucial role of vegetation dynamics in modulating drought severity under water-limited conditions. It further emphasizes the importance of vegetation management in drought-prone regions, where degradation or recovery of vegetation can significantly alter local water stress levels.
LST: Similarly, across all study years, for LST-based clusters, LST showed higher importance scores in HL clusters than in HH clusters. This pattern suggests that in areas experiencing severe drought but relatively low LST (i.e., HL), rising LST plays a more critical role in driving CWSI variation. Specifically, even when ET remains low, elevated LST can substantially increase PET, thereby raising CWSI values and intensifying perceived drought stress. Moreover, NDVI consistently recorded the lowest importance scores across all LST clusters, while the contributions of other variables remained relatively stable. This indicates that in drought regions dominated by LST, the dynamics of CWSI are primarily governed by energy-related factors rather than vegetation-mediated processes.
Rainfall: In Rainfall-based clusters, particularly the rain HH, HL, and LH, rainfall consistently received the highest importance scores. This underscores its role as the primary driving factor behind drought stress in these regions. The prominence of rainfall highlights a typical water-limited drought mechanism, where insufficient precipitation directly reduces ET, resulting in elevated CWSI values. In contrast, within the rain LL cluster, all variables except NDVI exhibited relatively balanced importance scores. This suggests that under conditions of adequate rainfall and mild drought, CWSI is influenced by a combination of environmental factors rather than a single dominant driver. It also indicates a more complex interaction between climatic and biophysical conditions in regulating drought dynamics in humid regions.
SAT: In SAT-based clusters, the importance of SAT remains consistently high across all years, with relatively small differences among environmental variables, except for NDVI, which consistently ranks the lowest. This indicates that in high-temperature clusters, variations in CWSI are significantly driven by temperature-induced mechanisms. Rising SAT leads to increased PET, thereby elevating CWSI. The consistently low importance of NDVI suggests that vegetation plays a limited role in regulating drought in these regions, possibly due to heat-induced vegetation degradation or delayed vegetative response. Notably, in LH and LL, LST shows higher importance scores, even surpassing SAT. This phenomenon suggests that in low-temperature clusters, LST may more directly reflect crop status or surface energy exchange processes than SAT.
DSR: Similarly, in DSR-based clusters, the variable importance scores of different environmental factors are relatively similar, suggesting that the influence of solar radiation on drought may depend on its combined interaction with LST and vegetation conditions, rather than acting as an isolated driver. Meanwhile, NDVI and DEM consistently exhibit lower importance scores across various DSR-based clusters, indicating that in radiation-dominated regions, vegetation response and topographic features play a comparatively minor role in shaping drought patterns, which are more strongly governed by atmospheric variables.
DEM: In DEM-based clusters, the importance scores of all environmental factors show minimal variation, and DEM itself consistently receives relatively low scores, typically around 0.2. This suggests that topographic factors exert only a limited direct influence on drought dynamics, likely functioning more through indirect regulation, such as affecting moisture accumulation, vegetation distribution, or the formation of local microclimates. Notably, in the HL clusters observed in 2010 (Figure 8b) and 2020 (Figure 8d), both LST and SAT show significantly elevated importance scores, with LST even surpassing DEM. This indicates that in regions where drought patterns exhibit spatial variation along topographic gradients, thermal conditions become increasingly dominant drivers, possibly due to amplified surface temperature fluctuations in undulating terrains, which directly impact evapotranspiration and consequently the CWSI.
Overall, NDVI, LST, Rainfall, SAT, DSR, and DEM alternated as base factors across different clusters and years, revealing the spatial heterogeneity and complexity of drought-driving mechanisms. These findings highlight the importance of localized approaches to drought monitoring and response. They also validate the spatial clustering structure identified by the LISA method and support the development of region-specific strategies for drought monitoring and management.
4. Discussion
CWSI demonstrated distinct advantages as a drought monitoring metric in this context. Unlike conventional meteorological indices or soil moisture models, CWSI directly captures crop water stress by integrating ET and PET, offering a dynamic view of the surface energy and moisture balance [21,41]. Its spatial continuity, temporal sensitivity, and independence from dense ground-based observations make it especially suitable for regions like the Huang-Huai-Hai Plain, which feature intensive agriculture but sparse meteorological infrastructure. The index effectively captured interannual drought variability and revealed trends of improving surface moisture conditions, likely linked to shifts in climate patterns and water resource management [62]. These attributes highlight the practicality of CWSI in supporting large-scale drought monitoring and adaptive agricultural planning.
Moreover, the integration of LISA and RF models further highlights the spatial diversity of drought formation mechanisms, emphasizing the importance of location-specific drought management strategies. The spatial clustering patterns identified by LISA show strong agreement with the variable importance rankings derived from the RF model, confirming the significant spatial coupling between drought conditions and environmental factors. The six selected environmental variables each offer distinct advantages, collectively capturing vegetation dynamics, water availability, energy fluxes, and topographic influences relevant to drought processes [63]. Among them, NDVI, LST, and Rainfall consistently exhibited high importance across various spatial clusters, indicating their dominant role in driving drought variation. In contrast, the importance of SAT, DSR, and DEM varied more substantially between clusters. This suggests that drought in different regions may be governed by diverse mechanisms, including biological regulation, energy constraints, or water limitation [63,64]. These findings not only reveal the complex nature of agricultural drought but also provide a scientific basis for developing regionally tailored drought response and management strategies.
Despite these contributions, the study has certain limitations. First, the use of annual-scale CWSI data may mask short-term drought events during critical crop growth stages [65]. Future studies should consider seasonal or phenological timeframes. Second, the clustering analysis relied solely on six environmental variables (NDVI, LST, Rainfall, SAT, DSR, DEM) and did not explicitly include land-use/land-cover (LULC) or human management factors (e.g., irrigation intensity, groundwater conditions), which may further modulate regional drought patterns and thus limit the direct applicability of the findings to policy-making across administrative or climatic zones [66]. We made this choice to maintain physical interpretability and avoid multicollinearity with NDVI and energy-related variables, while keeping the analysis region-wide and indicator-driven. Future work will incorporate time-varying LULC and management datasets to refine attribution and to better disentangle biophysical versus anthropogenic controls. Third, while the RF model quantifies variable importance, it does not account for interactions among variables. Future research may incorporate interpretable models such as spatial methods like Geographically Weighted Regression (GWR) to enhance explanatory capacity and spatial resolution [67].
5. Conclusions
The Huang-Huai-Hai Plain is one of China’s most critical agricultural regions, increasingly affected by drought due to ongoing climate change and intensive land use. This study utilized the CWSI to effectively characterize surface moisture stress by integrating actual and potential evapotranspiration. In comparison with traditional drought indices, CWSI offers improved spatial resolution and is particularly suitable for large-scale monitoring in regions with limited ground-based observations. By integrating CWSI with LISA and RF models, this study established a spatially explicit framework for identifying drought clusters and attributing them to six key environmental variables: NDVI, LST, Rainfall, SAT, DSR, and DEM. This framework provides novel insights into the spatial drivers and mechanisms of agricultural drought. The main findings are summarized as follows:
- (1)
- From 2005 to 2020, drought stress in the Huang-Huai-Hai Plain generally alleviated, accompanied by rising ET and relatively stable PET. Seasonally, CWSI was highest in summer, moderate in autumn, and relatively favorable in spring and winter; spatially, persistent drought hotspots occurred in eastern Henan, southwestern Shandong, and southern Hebei, while western areas such as the Taihang Mountains showed signs of recovery.
- (2)
- LISA-based analyses showed spatially varying links between drought severity and environmental factors. The coupling between NDVI and CWSI varied over time, while LST and SAT consistently exhibited stable HH clusters throughout the study period, confirming temperature as a dominant and persistent driver of drought. Rainfall showed a pronounced latitudinal variation, DSR exhibited temporal variability with shifting cluster patterns, and DEM maintained relatively stable spatial associations, with HH clusters in upland areas and LL clusters in low-lying regions.
- (3)
- Variable importance scores derived from the LISA and RF models exhibited temporal consistency throughout the study period. NDVI, LST, and Rainfall consistently exhibited high importance across different cluster types, indicating their stable and dominant roles in shaping drought dynamics. In contrast, SAT, DSR, and DEM showed notable variability among clusters, suggesting that their influence on drought is more localized or indirect, acting through interactions with other factors rather than as primary drivers. These findings highlight the spatial complexity of drought mechanisms and the need to develop drought monitoring and management strategies tailored to regional environmental conditions.
Author Contributions
Writing—original draft, X.-X.H.; visualization, X.-X.H.; formal analysis, X.-X.H. and Y.L.; data curation, X.-X.H. and Y.L.; writing—review and editing, X.Z. and Q.M.; validation, X.Z.; supervision, X.Z. and Q.M.; methodology, Y.L. and G.S.; investigation, G.S. and Q.M. All authors have read and agreed to the published version of the manuscript.
Funding
This work was supported in part by the Hebei Provincial Natural Science Foundation General Program (No. D2025403038), and in part by the Youth Top Talent Project of Hebei Provincial Department of Education (No. BJ2025106).
Data Availability Statement
The original contributions presented in the study are included in the article, further inquiries can be directed to the corresponding author.
Conflicts of Interest
The authors declare that they have no known competing financial interests or personal relationships that could have appeared to influence the work reported in this paper.
References
- Cao, S.; He, Y.; Zhang, L.; Sun, Q.; Zhang, Y.; Li, H.; Liu, Y. Spatiotemporal Dynamics of Vegetation Net Ecosystem Productivity and Its Response to Drought in Northwest China. GIScience Remote Sens. 2023, 60, 2194597. [Google Scholar] [CrossRef]
- Wilhite, D.A.; Sivakumar, M.V.K.; Pulwarty, R. Managing Drought Risk in a Changing Climate: The Role of National Drought Policy. Weather Clim. Extrem. 2014, 3, 4–13. [Google Scholar] [CrossRef]
- Qi, G.; Song, J.; Chen, S.; Gong, Y.; Bai, H.; She, D.; Xia, J.; Fu, Y.H. Increasing Impacts of Compound Extreme Droughts on Vegetation Productivity in China. J. Hydrol. 2025, 660, 133447. [Google Scholar] [CrossRef]
- Esfahanian, E.; Nejadhashemi, A.P.; Abouali, M.; Adhikari, U.; Zhang, Z.; Daneshvar, F.; Herman, M.R. Development and Evaluation of a Comprehensive Drought Index. J. Environ. Manag. 2017, 185, 31–43. [Google Scholar] [CrossRef]
- Panu, U.S.; Sharma, T.C. Challenges in Drought Research: Some Perspectives and Future Directions. Hydrol. Sci. J. 2002, 47, S19–S30. [Google Scholar] [CrossRef]
- van Genderen, J.L. Drought: Past Problems and Future Scenarios. Int. J. Digit. Earth 2012, 5, 456–457. [Google Scholar] [CrossRef]
- Esfahanian, E.; Nejadhashemi, A.P.; Abouali, M.; Daneshvar, F.; Alireza, A.R.; Herman, M.R.; Tang, Y. Defining Drought in the Context of Stream Health. Ecol. Eng. 2016, 94, 668–681. [Google Scholar] [CrossRef]
- Wu, H.; Su, X.; Huang, S.; Singh, V.P.; Zhou, S.; Tan, X.; Hu, X. Decreasing Dynamic Predictability of Global Agricultural Drought with Warming Climate. Nat. Clim. Change 2025, 15, 411–419. [Google Scholar] [CrossRef]
- Li, Q.; Wang, P.; Li, Y.; Tang, J.; Li, X.; Zhang, Y.; Han, D.; Wang, Q.; Zhao, Y.; Yang, Z. Hazard Assessment of Compound Drought and Heat Events on Summer Maize from Agricultural and Meteorological Perspectives. Agric. Water Manag. 2025, 313, 109479. [Google Scholar] [CrossRef]
- Yang, C.; Liu, C.; Gu, Y.; Wang, Y.; Xing, X.; Ma, X. A Novel Comprehensive Agricultural Drought Index Accounting for Precipitation, Evapotranspiration, and Soil Moisture. Ecol. Indic. 2023, 154, 110593. [Google Scholar] [CrossRef]
- Wu, H.; Su, X.; Singh, V.P.; Feng, K.; Niu, J. Agricultural Drought Prediction Based on Conditional Distributions of Vine Copulas. Water Resour. Res. 2021, 57, e2021WR029562. [Google Scholar] [CrossRef]
- Chen, H.; Yang, N.; Song, X.; Lu, C.; Lu, M.; Chen, T.; Deng, S. A Novel Agricultural Drought Index Based on Multi-Source Remote Sensing Data and Interpretable Machine Learning. Agric. Water Manag. 2025, 308, 109303. [Google Scholar] [CrossRef]
- Wu, B.; Ma, Z.; Yan, N. Agricultural Drought Mitigating Indices Derived from the Changes in Drought Characteristics. Remote Sens. Environ. 2020, 244, 111813. [Google Scholar] [CrossRef]
- Chen, X.; Li, Y.; Yao, N.; Liu, D.L.; Javed, T.; Liu, C.; Liu, F. Impacts of Multi-Timescale SPEI and SMDI Variations on Winter Wheat Yields. Agric. Syst. 2020, 185, 102955. [Google Scholar] [CrossRef]
- Bian, Z.; Roujean, J.L.; Fan, T.; Dong, Y.; Hu, T.; Cao, B.; Li, H.; Du, Y.; Xiao, Q.; Liu, Q. An Angular Normalization Method for Temperature Vegetation Dryness Index (TVDI) in Monitoring Agricultural Drought. Remote Sens. Environ. 2023, 284, 113330. [Google Scholar] [CrossRef]
- Chen, A.; Jiang, J.; Luo, Y.; Zhang, G.; Hu, B.; Wang, X.; Zhang, S. Temperature Vegetation Dryness Index (TVDI) for Drought Monitoring in the Guangdong Province from 2000 to 2019. PeerJ 2023, 11, e16337. [Google Scholar] [CrossRef]
- Wei, Y.; Li, Q.; Tao, H.; Lu, C.; Luo, X.; Mahemujiang, A.; Jiang, Y. Agricultural Drought Monitoring in Arid Irrigated Areas Based on TVDI Combined with ICEEMDAN-ARIMA Model. Smart Agric. 2025, 7, 117–131. [Google Scholar]
- Zhao, A.; Zhang, A.; Cao, S.; Feng, L.; Pei, T. Spatiotemporal Patterns of Water Use Efficiency in China and Responses to Multi-Scale Drought. Theor. Appl. Clim. 2020, 140, 559–570. [Google Scholar] [CrossRef]
- Ma, R.; Cui, X.; Wang, D.; Wang, S.; Wang, H.; Yao, X.; Li, S. Spatial and Temporal Characteristics of Water Use Efficiency in Typical Ecosystems on the Loess Plateau in the Last 20 Years, with Drivers and Implications for Ecological Restoration. Remote Sens. 2022, 14, 5632. [Google Scholar] [CrossRef]
- Idso, S.B.; Jackson, R.D.; Pinter, P.J.; Reginato, R.J.; Hatfield, J.L. Normalizing the Stress-Degree-Day Parameter for Environmental Variability. Agric. Meteorol. 1981, 24, 45–55. [Google Scholar] [CrossRef]
- Jackson, R.D.; Idso, S.B.; Reginato, R.J.; Pinter, P.J. Canopy Temperature as a Crop Water Stress Indicator. Water Resour. Res. 1981, 17, 1133–1138. [Google Scholar] [CrossRef]
- Mao, X.; Zheng, J.; Lu, B.; Wang, R.; Han, W.; Harris, P. Spatiotemporal Drought Forecasting in Xinjiang’s Irrigated Agriculture: Model Comparison and Multi-Source Data Integration. J. Hydrol. 2025, 660, 133483. [Google Scholar] [CrossRef]
- Gu, S.; Liao, Q.; Gao, S.; Kang, S.; Du, T.; Ding, R. Crop Water Stress Index as a Proxy of Phenotyping Maize Performance under Combined Water and Salt Stress. Remote Sens. 2021, 13, 4710. [Google Scholar] [CrossRef]
- Bellvert, J.; Marsal, J.; Girona, J.; Gonzalez-Dugo, V.; Fereres, E.; Ustin, S.L.; Zarco-Tejada, P.J. Airborne Thermal Imagery to Detect the Seasonal Evolution of Crop Water Status in Peach, Nectarine and Saturn Peach Orchards. Remote Sens. 2016, 8, 39. [Google Scholar] [CrossRef]
- Liu, Q.; Qu, Z.; Hu, X.; Bai, Y.; Yang, W.; Yang, Y.; Bian, J.; Zhang, D.; Shi, L. Combining UAV Remote Sensing Data to Estimate Daily-Scale Crop Water Stress Index: Enhancing Diagnostic Temporal Representativeness. Agric. Water Manag. 2024, 305, 109130. [Google Scholar] [CrossRef]
- Xu, J.; Lv, Y.; Liu, X.; Dalson, T.; Yang, S.; Wu, J. Diagnosing Crop Water Stress of Rice Using Infra-Red Thermal Imager under Water Deficit Condition. IJAB 2016, 18, 565–572. [Google Scholar] [CrossRef]
- Xuan, F.; Liu, H.; Xue, J.; Li, Y.; Liu, J.; Huang, X.; Tan, Z.; Elbasit, M.A.M.A.; Gu, X.; Su, W. The Novel Triangular Spectral Indices for Characterizing Winter Wheat Drought. Int. J. Appl. Earth Obs. Geoinf. 2024, 134, 104151. [Google Scholar] [CrossRef]
- Liao, Q.; Gu, S.; Gao, S.; Du, T.; Kang, S.; Tong, L.; Ding, R. Crop Water Stress Index Characterizes Maize Productivity under Water and Salt Stress by Using Growth Stage-Specific Non-Water Stress Baselines. Field Crops Res. 2024, 317, 109544. [Google Scholar] [CrossRef]
- Zhao, H.; Zhou, G.; Qi, Y. Effects of Sowing Date Adjustment on Yield and Quality of Winter Wheat and Summer Maize in Northern Area of North China. Sci. Agric. Sin. 2024, 57, 2964–2985. [Google Scholar]
- Zhou, B.; Wang, Z.-M.; Yue, Y. Comparison of Yield and Light-Temperature Resource Use Efficiency between Wheat–Maize and Maize–Maize Cropping Systems. ACTA Agron. Sin. 2015, 41, 1393–1405. [Google Scholar] [CrossRef]
- Zhao, J.; Peng, H.; Yang, J.; Huang, R.; Huo, Z.; Ma, Y. Response of Winter Wheat to Different Drought Levels Based on Google Earth Engine in the Huang-Huai-Hai Region, China. Agric. Water Manag. 2024, 292, 108662. [Google Scholar] [CrossRef]
- Ren, S.; Guo, B.; Wu, X.; Zhang, L.; Ji, M.; Wang, J. Winter Wheat Planted Area Monitoring and Yield Modeling Using MODIS Data in the Huang-Huai-Hai Plain, China. Comput. Electron. Agric. 2021, 182, 106049. [Google Scholar] [CrossRef]
- Liu, R.; Sun, S.; Ju, L. Evolutionary characteristics and spatiotemporal trend of meteorological drought in the HuangHuai-hai Plain. Trans. Chin. Soc. Agric. Eng. 2023, 39, 85–92. [Google Scholar]
- Gele, T.; Bao, Y.; Ersi, C.; Sudu, B.; Wei, S.; Zhang, J.; Tong, Z.; Liu, X. Occurrence, Evolution and Causes of Different Drought Levels Affecting Winter Wheat in the Huang-Huai-Hai Plain, China. Agric. Water Manag. 2025, 317, 109640. [Google Scholar] [CrossRef]
- Su, Y.; Guo, B.; Zhou, Z.; Zhong, Y.; Min, L. Spatio-Temporal Variations in Groundwater Revealed by GRACE and Its Driving Factors in the Huang-Huai-Hai Plain, China. Sensors 2020, 20, 922. [Google Scholar] [CrossRef] [PubMed]
- Qiao, J.; Deng, L.; Liu, H.; Wang, Z. Spatiotemporal Heterogeneity in Ecosystem Service Trade-Offs and Their Drivers in the Huang-Huai-Hai Plain, China. Landsc. Ecol. 2024, 39, 42. [Google Scholar] [CrossRef]
- Wu, T.; Li, B.; Guo, H. Analysis of drought variation characteristics in North China Plain based on optimized remote sensing drought index. Acta Ecol. Sin. 2023, 43. [Google Scholar] [CrossRef]
- Ma, Z.; Sun, P.; Zhang, Q. Remote sensing drought monitoring of North China based on MODIS data. Sci. Geogr. Sin. 2022, 42, 152–162. [Google Scholar]
- Zhao, C.; Feng, Y.; Liu, W.; Wang, H.; Wang, T.; Liu, Y.; Sun, F. Provincial-Scale Assessment of Vulnerability and Resilience to Drought in China. Sci. Total Environ. 2024, 934, 173199. [Google Scholar] [CrossRef]
- Wu, T.; Xu, L.; Chen, N. Spatial Pattern and Attribution of Ecosystem Drought Recovery in China. J. Hydrol. 2024, 638, 131578. [Google Scholar] [CrossRef]
- Ma, Y.; Ren, J.; Kang, S.; Niu, J.; Tong, L. Spatial-Temporal Dynamics of Meteorological and Agricultural Drought in Northwest China: Propagation, Drivers and Prediction. J. Hydrol. 2025, 650, 132492. [Google Scholar] [CrossRef]
- Ding, Y.; Zhang, L.; He, Y.; Cao, S.; Wei, X.; Guo, Y.; Ran, L.; Filonchyk, M. Spatiotemporal Evolution of Agricultural Drought and Its Attribution under Different Climate Zones and Vegetation Types in the Yellow River Basin of China. Sci. Total Environ. 2024, 914, 169687. [Google Scholar] [CrossRef]
- Dong, J.; Fu, Y.; Wang, J.; Tian, H.; Fu, S.; Niu, Z.; Han, W.; Zheng, Y.; Huang, J.; Yuan, W. Early-Season Mapping of Winter Wheat in China Based on Landsat and Sentinel Images. Earth Syst. Sci. Data 2020, 12, 3081–3095. [Google Scholar] [CrossRef]
- Jin, G.; Chen, K.; Wang, P.; Guo, B.; Dong, Y.; Yang, J. Trade-Offs in Land-Use Competition and Sustainable Land Development in the North China Plain. Technol. Forecast. Soc. Change 2019, 141, 36–46. [Google Scholar] [CrossRef]
- Wang, X.; Zhang, W.; Zhao, X.; Wang, D.; Li, Y. Sustaining Carbon Storage: An Analysis of Land Use and Conservation Strategies in China’s Huang-Huai-Hai Plain. Sustainability 2025, 17, 139. [Google Scholar] [CrossRef]
- Wang, K.; Sun, S.; Li, Y.; Hu, X.; Qi, X.; Wang, J.; Li, C.; Gao, F. Response of Regional Agricultural Water Use to the Change of Climate and Plantation Structure in the Typical Agricultural Region of China. J. Water Clim. Change 2022, 13, 1370–1388. [Google Scholar] [CrossRef]
- Zhao, Y.; Xiao, L.; Tang, Y.; Yao, X.; Cheng, T.; Zhu, Y.; Cao, W.; Tian, Y. Spatio-Temporal Change of Winter Wheat Yield and Its Quantitative Responses to Compound Frost-Dry Events—An Example of the Huang-Huai-Hai Plain of China from 2001 to 2020. Sci. Total Environ. 2024, 940, 173531. [Google Scholar] [CrossRef]
- Liu, X.; Wang, Y. The Adjustment of Grain Crop Planting Structure and Its Effect on the Consumption of Water and Soil Resources in North China. J. Anhui Agric. Sci. 2023, 51, 211–214. [Google Scholar]
- Zhang, Y.; Guo, Y.; Sheng, Y. Impact of planting structure changes on agricultural water requirement in North China Plain. Chin. J. Eco-Agric. 2020, 28, 8–16. [Google Scholar]
- de Oliveira, M.L.; dos Santos, C.A.C.; de Oliveira, G.; Silva, M.T.; da Silva, B.B.; de Cunha, J.E.B.L.; Ruhoff, A.; Santos, C.A.G. Remote Sensing-Based Assessment of Land Degradation and Drought Impacts over Terrestrial Ecosystems in Northeastern Brazil. Sci. Total Environ. 2022, 835, 155490. [Google Scholar] [CrossRef]
- Zhang, X.; Jia, W.; He, J. Spatial and Temporal Variation of Ecological Quality in Northeastern China and Analysis of Influencing Factors. J. Clean. Prod. 2023, 423, 138650. [Google Scholar] [CrossRef]
- Liu, X.; Li, Z.-L.; Li, Y.; Wu, H.; Zhou, C.; Si, M.; Leng, P.; Duan, S.-B.; Yang, P.; Wu, W.; et al. Local Temperature Responses to Actual Land Cover Changes Present Significant Latitudinal Variability and Asymmetry. Sci. Bull. 2023, 68, 2849–2861. [Google Scholar] [CrossRef]
- Zhao, E.; Qu, N.; Wang, Y.; Gao, C.; Zeng, J. Tebs: Temperature–Emissivity–Driven Band Selection for Thermal Infrared Hyperspectral Image Classification with Structured State-Space Model and Gated Attention. Int. J. Appl. Earth Obs. Geoinf. 2025, 142, 104710. [Google Scholar] [CrossRef]
- He, J.; Yang, K.; Tang, W.; Lu, H.; Qin, J.; Chen, Y.; Li, X. The First High-Resolution Meteorological Forcing Dataset for Land Process Studies over China. Sci Data 2020, 7, 25. [Google Scholar] [CrossRef]
- Zhang, X.; Wang, D.; Liu, Q.; Yao, Y.; Jia, K.; He, T.; Jiang, B.; Wei, Y.; Ma, H.; Zhao, X.; et al. An Operational Approach for Generating the Global Land Surface Downward Shortwave Radiation Product from MODIS Data. IEEE Trans. Geosci. Remote Sens. 2019, 57, 4636–4650. [Google Scholar] [CrossRef]
- Zhang, X.; Liang, S.; Zhou, G. Generating Global LAnd Surface Satellite Incident Shortwave Radiation and Photosynthetically Active Radiation Products from Multiple Satellite Data. Remote Sens. Environ. 2014, 152, 318–332. [Google Scholar] [CrossRef]
- Xu, H.; Yang, J.; Lin, Y.; Xu, N.; Li, M.; Xu, Y.; Liu, X.; Li, F. Construction of a Composite Cooling Network for the Mitigation of Urban Heat Risk in Fuzhou. Front. Environ. Sci. 2024, 12, 1462700. [Google Scholar] [CrossRef]
- Cao, S. Spatiotemporal Characteristics of Drought and Its Impact on Vegetation in the Vegetation Region of Northwest China. Ecol. Indic. 2021, 133, 108420. [Google Scholar] [CrossRef]
- Anselin, L. Local Indicators of Spatial Association—LISA. Geogr. Anal. 1995, 27, 93–115. [Google Scholar] [CrossRef]
- Breiman, L. Random Forests. Mach. Learn. 2001, 45, 5–32. [Google Scholar] [CrossRef]
- GB/T 20481-2017; Meteorological Drought Levels. National Climate Center: Beijing, China, 2017.
- Pei, H.; Shen, Y.; Liu, C. Nitrogen and water cycling of typical cropland in the North China Plain. Chin. J. Appl. Ecol. 2015, 26, 283–296. [Google Scholar]
- Li, C.; Fu, B.; Wang, S.; Stringer, L.C.; Wang, Y.; Li, Z.; Liu, Y.; Zhou, W. Drivers and Impacts of Changes in China’s Drylands. Nat. Rev. Earth Environ. 2021, 2, 858–873. [Google Scholar] [CrossRef]
- Christian, J.I.; Basara, J.B.; Hunt, E.D.; Otkin, J.A.; Furtado, J.C.; Mishra, V.; Xiao, X.; Randall, R.M. Global Distribution, Trends, and Drivers of Flash Drought Occurrence. Nat. Commun. 2021, 12, 6330. [Google Scholar] [CrossRef]
- Vadez, V.; Grondin, A.; Chenu, K.; Henry, A.; Laplaze, L.; Millet, E.J.; Carminati, A. Crop Traits and Production under Drought. Nat. Rev. Earth Environ. 2024, 5, 211–225. [Google Scholar] [CrossRef]
- Zhang, Y.; Wu, Z.P.; Singh, V. Agricultural Drought Characteristics in a Typical Plain Region Considering Irrigation, Crop Growth, and Water Demand Impacts. Agric. Water Manag. 2023, 282, 108266. [Google Scholar] [CrossRef]
- Ma, Q.; Yang, Y.; Bai, Z.; Yang, Y.; Han, S.; Ren, D.; Shang, G.; Jiao, X.; Guo, X.; Wu, M.; et al. Decoupling Driving Factors and High-Precision Prediction of Food Security in Central Asia Based on a Coupled PLS-SEM and PSO-LSSVM Model. Food Energy Secur. 2025, 14, e70089. [Google Scholar] [CrossRef]
Disclaimer/Publisher’s Note: The statements, opinions and data contained in all publications are solely those of the individual author(s) and contributor(s) and not of MDPI and/or the editor(s). MDPI and/or the editor(s) disclaim responsibility for any injury to people or property resulting from any ideas, methods, instructions or products referred to in the content. |
© 2025 by the authors. Licensee MDPI, Basel, Switzerland. This article is an open access article distributed under the terms and conditions of the Creative Commons Attribution (CC BY) license (https://creativecommons.org/licenses/by/4.0/).