Article

A Microwave–Optical Multi-Stage Synergistic Daily 30 m Soil Moisture Downscaling Framework

1
School of Geoscience, Yangtze University, Wuhan 430100, China
2
State Key Laboratory of Information Engineering in Surveying, Mapping and Remote Sensing, Wuhan University, Wuhan 430079, China
3
Agricultural Water Conservancy Department, Changjiang River Scientific Research Institute, Wuhan 430010, China
*
Author to whom correspondence should be addressed.
These authors contributed equally to this work.
Remote Sens. 2025, 17(22), 3677; https://doi.org/10.3390/rs17223677 (registering DOI)
Submission received: 30 September 2025 / Revised: 5 November 2025 / Accepted: 7 November 2025 / Published: 9 November 2025

Highlights

What are the main findings?
  • The microwave–optical multi-stage synergistic downscaling framework (MMSDF) generates daily 30 m soil moisture products by integrating SMAP, optical, and SAR data.
  • Using an intermediate 1 km estimate, reliance on in situ stations was reduced to achieve 30-meter data extraction by calibrating the Water Cloud Model (WCM).
What is the implication of the main finding?
  • MMSDF improves correlation from 0.34 to 0.54 compared to SMAP L4, enhancing agricultural and drought monitoring.
  • In situ independent calibration enables large-scale operational deployment for high-resolution soil moisture monitoring.

Abstract

Accurate daily surface soil moisture (SSM) mapping at high spatial resolution (e.g., 30 m) remains challenging due to individual satellite sensor limitations. Although passive microwave sensors provide frequent coarse-resolution observations and synthetic aperture radar (SAR) offers high-resolution data intermittently, achieving both simultaneously requires sensor synergy. This paper introduces the microwave–optical multi-stage synergistic downscaling framework (MMSDF) to generate daily 30 m SSM products. The framework integrates SMAP L4 (9 km), MODIS data (500 m–1 km), harmonized Landsat Sentinel-2 (HLS, 30 m), radiometric terrain corrected Sentinel-1 (RTC-S1, 30 m), and auxiliary geographic data. It comprises three stages: (1) downscaling SMAP L4 to 1 km via random forest; (2) calibrating Sentinel-1 water cloud model (WCM) using intermediate 1 km SSM to retrieve 30 m SSM without in situ calibration; and (3) fusing daily 1 km SSM and intermittent 30 m WCM-derived retrievals using the spatial–temporal fusion model (ESTARFM) to generate seamless daily 30 m SSM maps. Validation against in situ measurements from 16 sites in Hunan Province, China (summer 2024) yielded R of 0.54 and RMSE of 0.045 cm 3 / cm 3 . Results demonstrate the framework’s capability to synergize multi-source data for high-resolution daily SSM estimates valuable for hydrological and agricultural applications.

1. Introduction

Surface soil moisture (SSM) is a critical variable in the Earth’s hydrological cycle, governing key processes such as evapotranspiration, runoff generation, and vegetation productivity [1]. Accurate, high-resolution monitoring of SSM is essential for advancing applications in agricultural water management, drought assessment, and climate modeling [2,3]. While satellite remote sensing provides a viable means for large-scale SSM estimation, no single sensor type simultaneously delivers the spatial detail, temporal frequency, and all-weather capability required for fine-scale applications. This limitation arises from the inherent trade-offs among different remote sensing technologies, creating a knowledge gap in generating seamless, high-resolution daily SSM products.
Passive microwave (PMW) remote sensing, particularly at L-band (e.g., SMAP, SMOS), has emerged as a cornerstone for global SSM monitoring due to its high sensitivity to soil water content, strong vegetation penetration, and reliable all-weather performance [4,5,6]. However, PMW-based products are constrained by coarse spatial resolutions (typically >9 km), which limits their utility for local-scale studies. In contrast, optical and thermal infrared (Optics/TIR) sensors provide high-resolution data on land surface parameters such as land surface temperature (LST) and vegetation indices (e.g., NDVI, EVI) that are empirically linked to SSM [7,8]. Studies have demonstrated that these data enable indirect SSM estimation through semi-empirical models like the Temperature-Vegetation Dryness Index (TVDI) [9], but their operational use is hampered by cloud cover, leading to significant temporal gaps [10]. Active microwave remote sensing, specifically Synthetic Aperture Radar (SAR), offers an alternative with all-weather, high-resolution capabilities. SAR signals are sensitive to soil dielectric properties, allowing for direct SSM retrieval, but inversion is complicated by surface roughness and vegetation effects, and temporal coverage is often limited by satellite revisit cycles [11,12,13].
The complementary strengths of PMW, Optics/TIR, and SAR data have motivated research into multi-source fusion approaches to overcome individual sensor limitations. Since the launch of SMAP, numerous downscaling studies have focused on enhancing the spatial resolution of its PMW products. For instance, physical models like DISPATCH have been used to disaggregate PMW data using Optics/TIR-derived soil evaporative efficiency [14], while semi-empirical methods such as TVDI have integrated LST and vegetation indices to infer SSM at finer scales [9,15]. Machine learning algorithms, including random forest (RF) and neural networks, have further advanced this field by learning non-linear relationships between coarse-resolution SSM and high-resolution predictors [16,17]. These studies collectively found that Optics/TIR data can effectively enhance spatial detail, but cloud-induced data gaps remain a critical barrier to generating continuous daily products [18,19,20,21].
To address cloud-related gaps, researchers have incorporated SAR data into downscaling frameworks. Sentinel-1 SAR observations have been used as predictive features in machine learning models [12,22], to refine physical model parameters [23], or for direct fusion with PMW data through change detection [24,25]. However, these approaches often struggle with the complex integration of multi-source data, leading to issues such as spatiotemporal mismatches, limited physical consistency, and variable accuracy across landscapes [26,27,28]. Specifically, prior work has revealed that purely data-driven methods may lack generalization without physical constraints, and the reliance on optical data persists as a bottleneck for all-weather daily coverage [29]. These gaps highlight the need for a structured framework that systematically combines PMW, Optics/TIR, and SAR data through physically guided steps to achieve robust, high-resolution SSM estimates.
Machine learning methods have emerged as powerful tools for soil moisture downscaling due to their ability to capture complex, non-linear relationships in multi-source remote sensing data. Studies employing traditional statistical models like Geographically Weighted Regression (GWR) have demonstrated improved spatial detail by accounting for local variations in land surface characteristics [30,31,32]. Advanced techniques such as random forest (RF) have further enhanced downscaling accuracy by effectively handling high-dimensional feature spaces and reducing overfitting [27,33,34,35]. Support Vector Regression (SVR) has shown robustness in modeling non-linear mappings between coarse-resolution soil moisture and fine-scale predictors [36,37,38], while Artificial Neural Networks (ANNs) have achieved state-of-the-art performance by learning deep feature representations from heterogeneous data sources [17,39,40,41]. These data-driven approaches collectively reveal that machine learning can effectively bridge scale gaps, but they often struggle with physical consistency and generalizability across diverse regions. Recent hybrid methods that integrate machine learning with physical models [42] or geostatistical techniques [43] have aimed to combine the strengths of data-driven and physics-based approaches, yielding more robust outcomes in specific applications.
Despite these advances, the synergistic integration of PMW, Optics/TIR, and SAR data remains challenging due to several unresolved issues. Key limitations include the inherent spatiotemporal heterogeneity among data sources, difficulties in modeling complex non-linear relationships between soil moisture and multi-sensor signals [26], and the limited physical consistency of purely data-driven models, which often lack constraints to ensure hydrological realism [27,28,29]. Consequently, two critical gaps impede the operational generation of high-quality soil moisture products: (1) reliance on optical data results in significant temporal gaps under cloudy conditions, hindering the production of seamless daily datasets; and (2) validation studies report variable performance across different landscapes, indicating limited adaptability and accuracy consistency.
In response to these challenges, this study proposes a microwave–optical multi-stage synergistic downscaling framework (MMSDF) designed to generate daily 30 m surface soil moisture (SSM) products by integrating SMAP L4 passive microwave data, MODIS and HLS optical/thermal data, and Sentinel-1 SAR data. The framework systematically addresses the identified knowledge gaps through a residual-constrained methodology and a novel calibration strategy, leveraging the complementary strengths of multi-source satellite observations to produce accurate, high-resolution daily SSM maps. The specific research objectives are as follows:
  • To develop a residual-constrained downscaling approach using a random forest model to enhance SMAP L4 SSM from a 9 km to a 1 km daily resolution, addressing the spatial limitations of passive microwave data.
  • To calibrate a Water Cloud Model (WCM) for Sentinel-1 SAR data using intermediate 1 km SSM estimates, enabling 30 m SSM retrieval without in situ measurements and mitigating cloud-induced gaps in optical data.
  • To implement a spatiotemporal fusion model (ESTARFM) that combines 1 km downscaled SSM with intermittent 30 m WCM-derived SSM, generating a seamless daily 30 m product and validating its accuracy against in situ networks.

2. Study Area and Data

2.1. Study Area

This study selected Hunan Province (24°38′N–30°08′N, 108°47′E–114°15′E), a key agricultural province in the middle reaches of the Yangtze River, China. Located in a subtropical monsoon climate zone with annual precipitation of approximately 1450 mm, the province has abundant cultivated land (18.4% of the total area) and serves as a major grain production base. The study focuses on the summer of 2024, a critical period for agricultural activities and soil moisture monitoring. Figure 1 shows the geographical location and spatial distribution of soil moisture stations.
To establish a reliable validation system, this study collected in situ data from 442 automated soil moisture monitoring stations in the Hunan Provincial Hydrological Network. After quality screening (removing stations with >20% data loss, requiring ≥3 daily observations, and ensuring correlation with the SMAP L4 product R > 0.3 ), 171 stations were retained. The UTM-MGRS grid cell 49REL, containing 16 high-quality observation sites, was selected as the core test area for model development and validation. Table 1 provides detailed site information.

2.2. Remote Sensing and Auxiliary Data

All remote sensing data were obtained through the NASA EarthData platform, including SMAP L4 soil moisture, MODIS surface reflectance and temperature, HLS optical imagery, Sentinel-1 SAR, GPM precipitation, and NASADEM elevation data. The study utilized multi-source satellite data from summer 2024 (1 June–31 August), summarized in Table 2. All data were georeferenced to UTM Zone 49N within grid 49REL using appropriate resampling methods.
SMAP L4 data: The SMAP Level 4 global 9 km soil moisture product (SPL4SMGP V007) provides surface soil moisture estimates (0–5 cm) by assimilating L-band brightness temperature into the NASA GEOS-5 model [44]. Daily data from 09:00–12:00 UTC were selected to match satellite overpass timing.
Optical data: MODIS MCD43A4 (500 m) and HLS L30/S30 (30 m) surface reflectance products were used after atmospheric and BRDF correction [45]. Six common bands (blue, green, red, NIR, SWIR1, SWIR2) were selected, with quality screening applied to remove cloud-affected pixels.
SAR data: Radiometric Terrain Corrected Sentinel-1 (RTC-S1) from NASA JPL OPERA provided 30 m resolution VV and VH backscatter coefficients [46]. Data underwent orbital correction, thermal noise removal, and terrain correction, with backscatter values ( σ 0 ) converted to dB units ( σ dB 0 ) by Equation (1).
σ dB 0 = 10 · log 10 σ 0
Auxiliary data: GPM IMERG precipitation (0.1°, daily), MODIS MOD11A1 land surface temperature (1 km, daily), and NASADEM elevation (30 m) were included. All auxiliary data were reprojected to UTM Zone 49N and temporally aligned with satellite observations.

2.3. Data Processing Framework

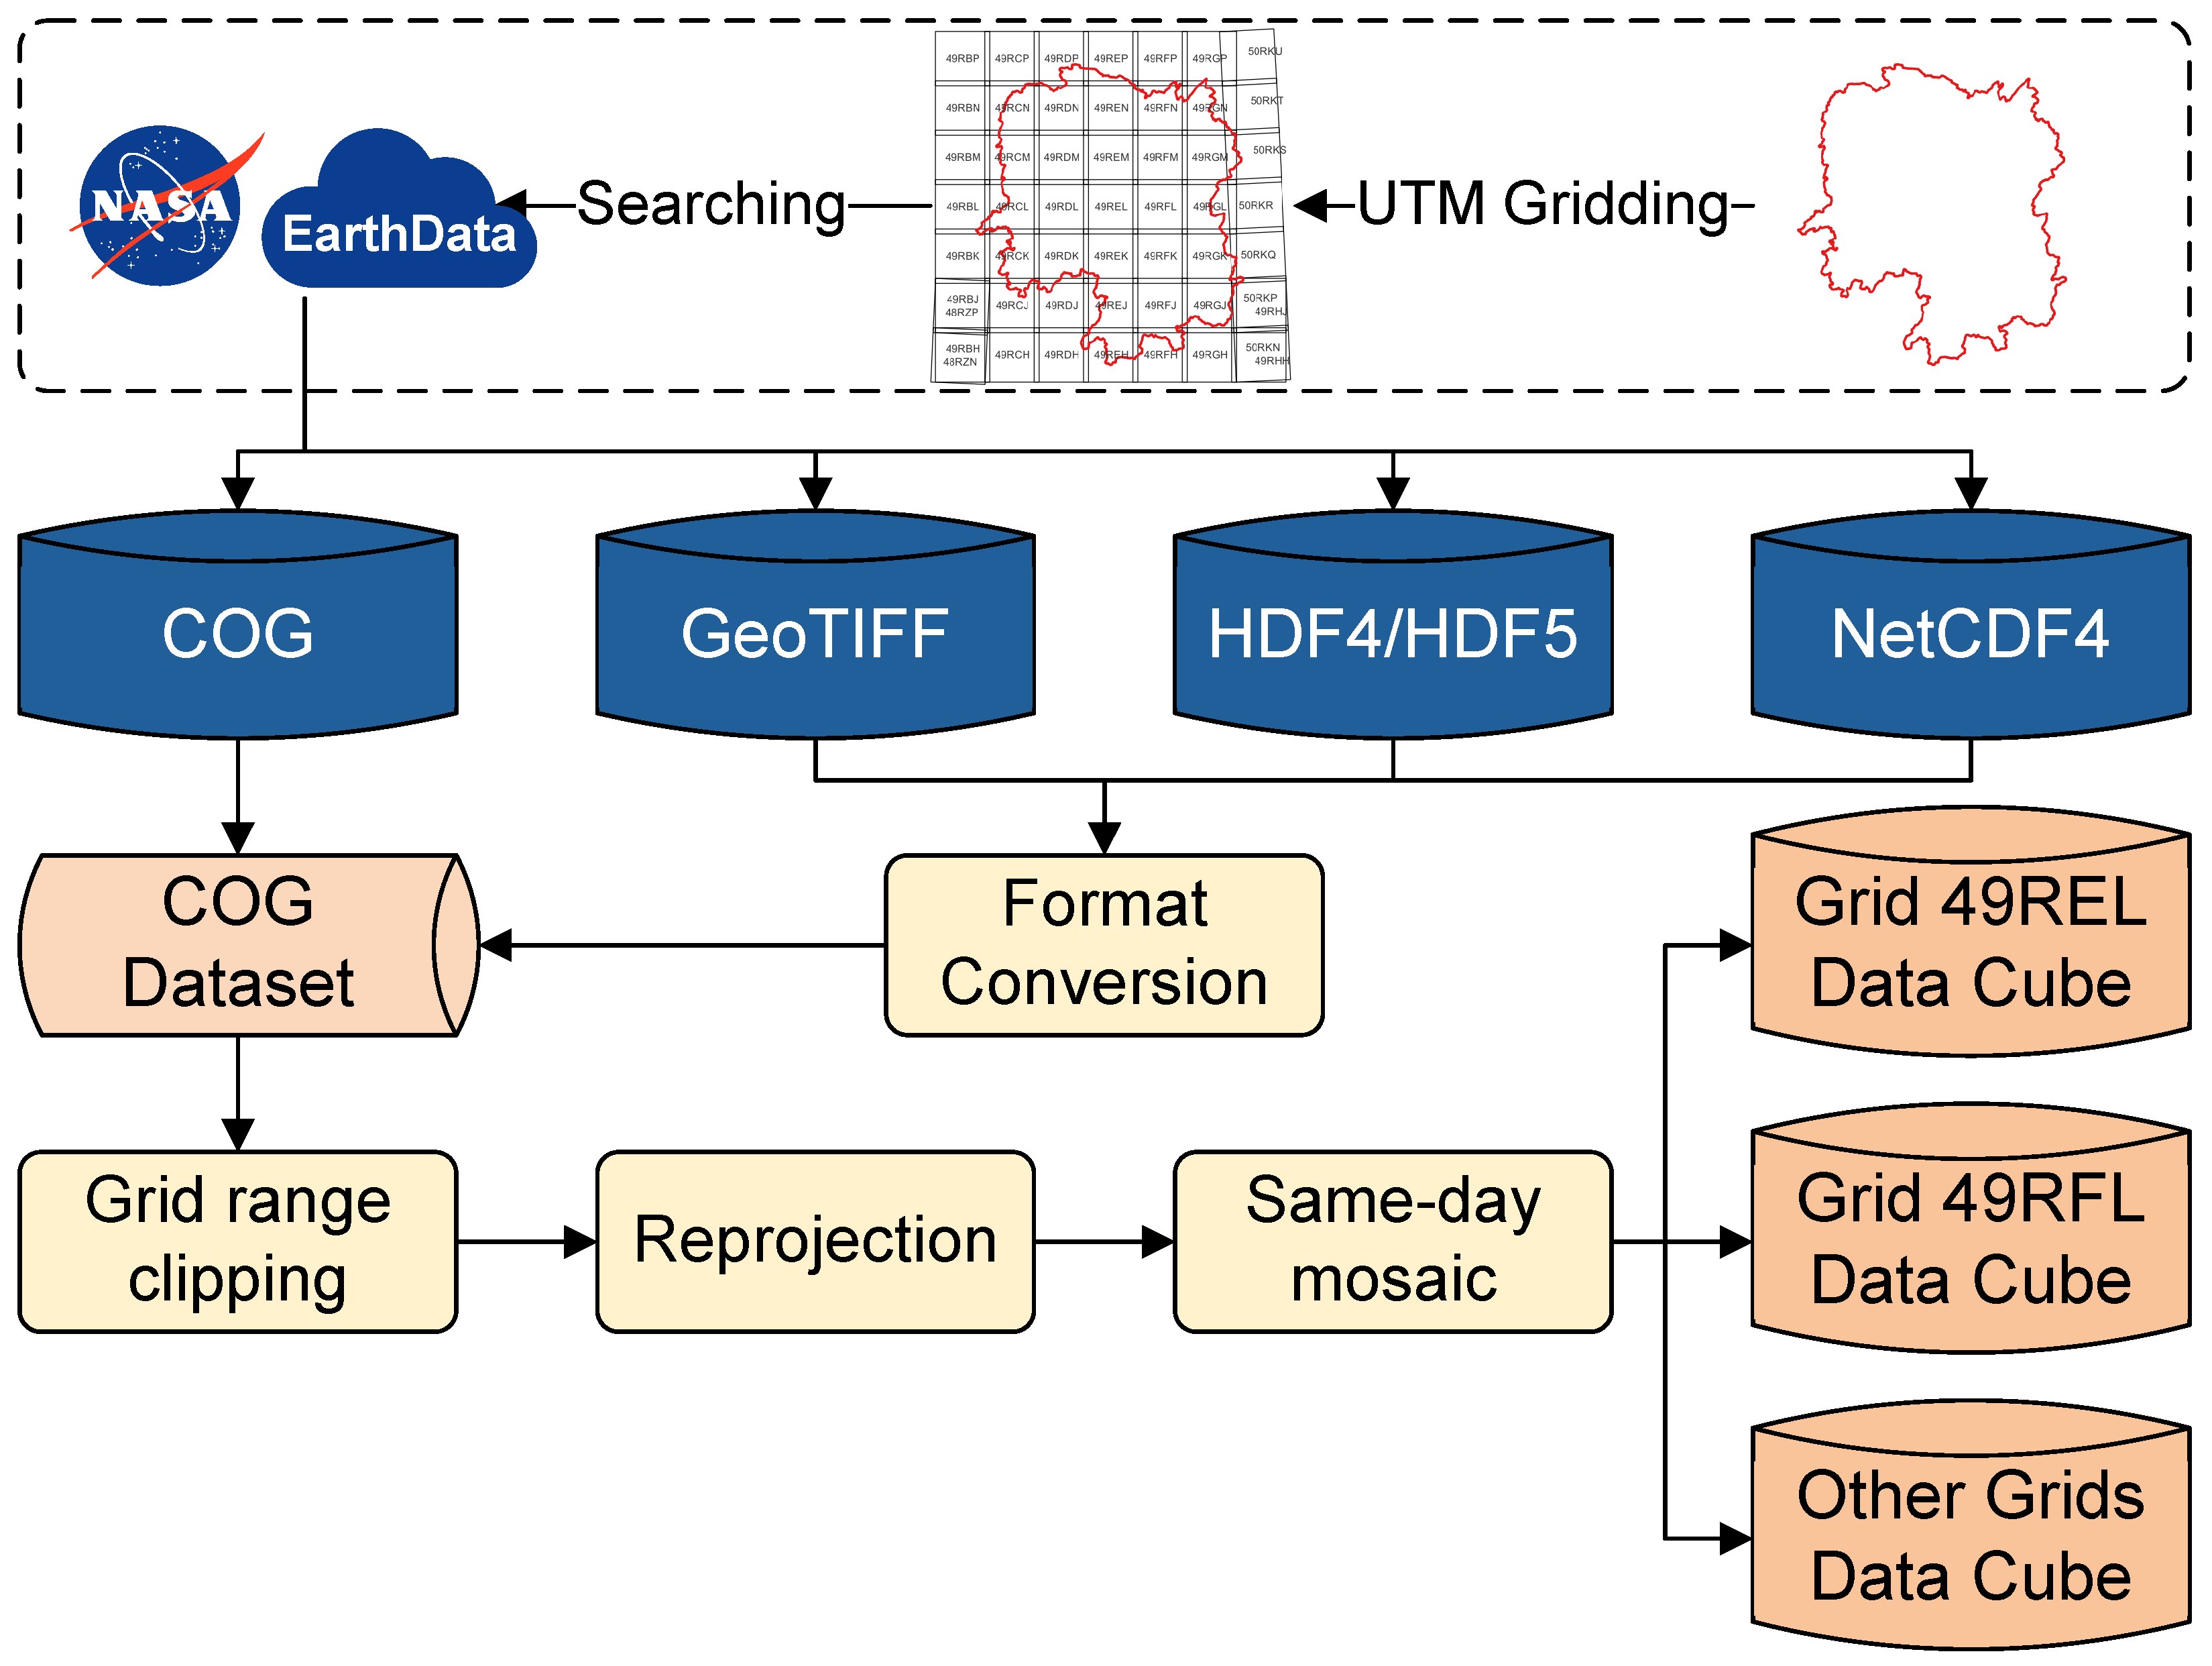
To facilitate the synergistic use of multi-source remote sensing data, a standardized preprocessing workflow was implemented (Figure 2). The study area was partitioned using the UTM-MGRS grid system, with all datasets retrieved from the NASA EarthData platform. Data harmonization included format conversion to COG, reprojection to UTM Zone 49N, spatial clipping to grid boundaries, and resampling to target resolutions. For datasets with multiple acquisitions per day, seamless mosaicking was performed. This resulted in a spatiotemporally aligned data cube organized by MGRS grid and time.
During summer 2024, 43 HLS frames (21 L30, 22 S30) and 9 Sentinel-1 RTC frames were acquired. After cloud masking, 30 HLS images remained valid for analysis. Data quality was graded based on spatial coverage: Level 1 (no valid pixels at in situ sites), Level 2 (partial coverage), and Level 3 (complete coverage). Table 2 summarizes the operational latency and effective revisit frequency of all datasets, crucial for understanding data fusion feasibility and product update frequency.

3. Methods

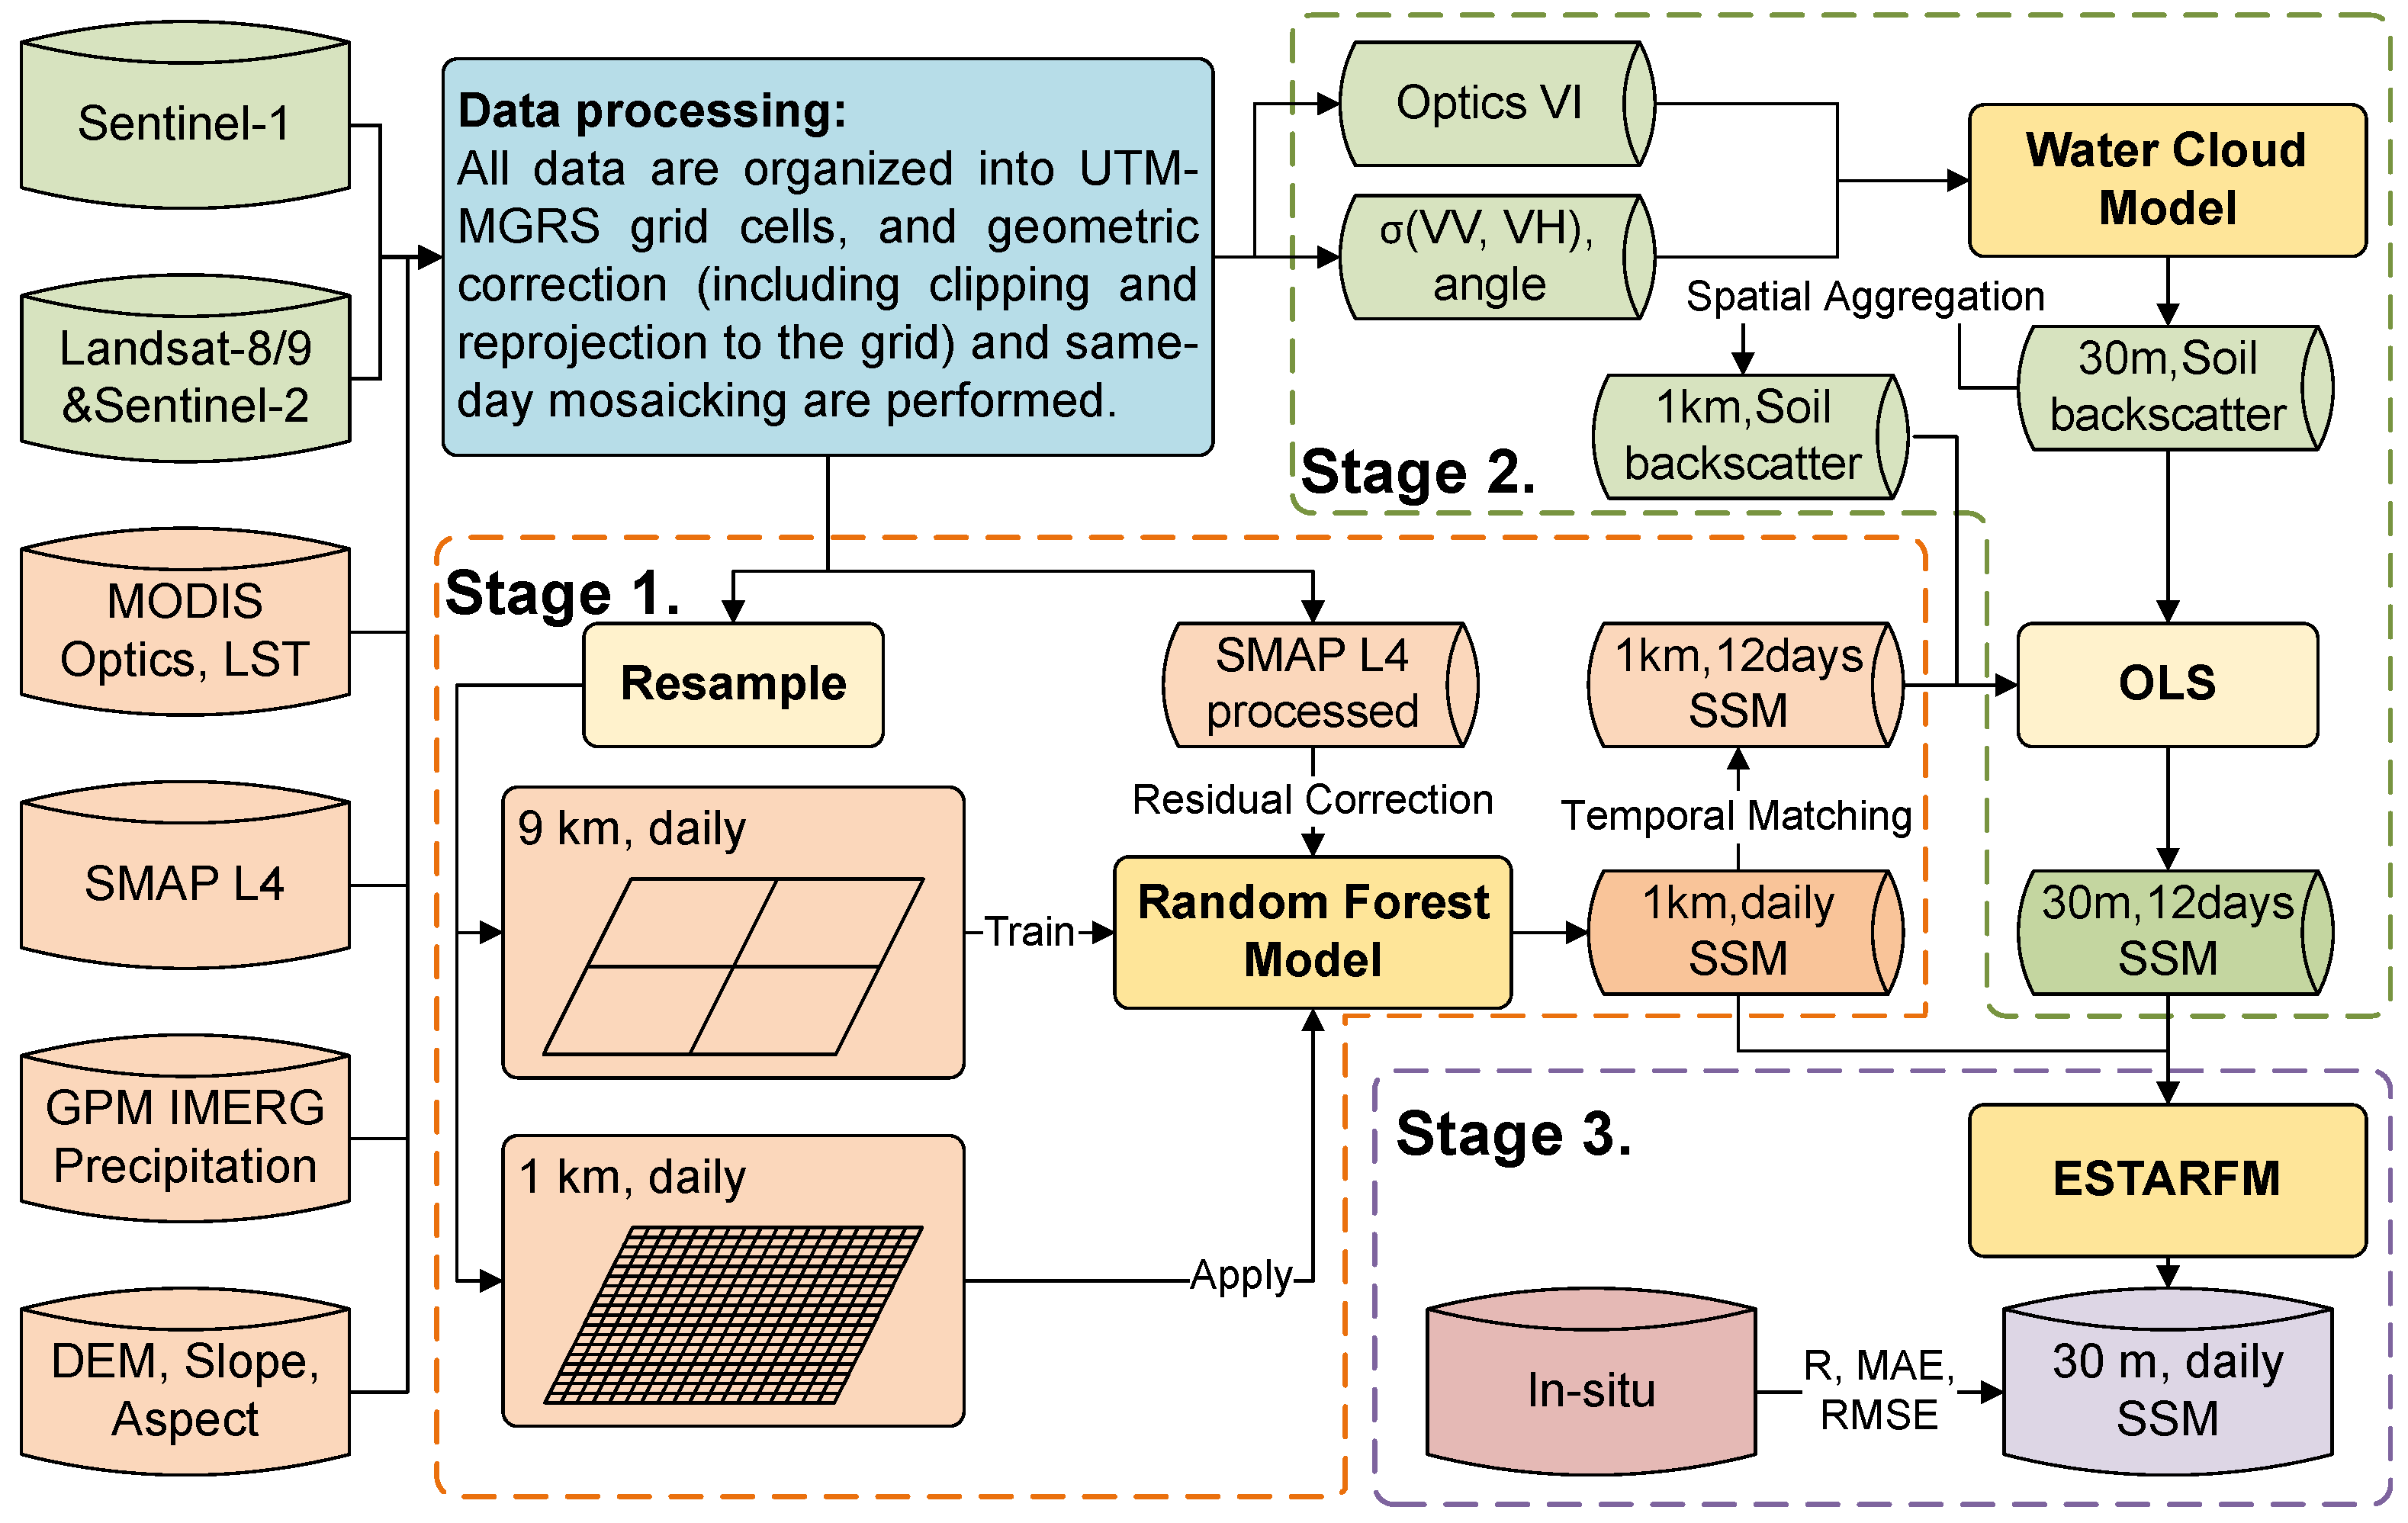
This study proposes a microwave–optical multi-stage synergistic downscaling framework (MMSDF) to generate daily 30 m surface soil moisture (SSM) products by systematically integrating multi-source satellite observations. As illustrated in Figure 3, the framework consists of three sequential stages: (1) random forest (RF)-based downscaling with residual correction to transition from 9 km to 1 km resolution; (2) synthetic aperture radar (SAR)-derived SSM retrieval at 30 m resolution using the water cloud model (WCM), calibrated with intermediate downscaled SSM; and (3) spatiotemporal fusion via the Enhanced Spatiotemporal Adaptive Reflectance Fusion Model (ESTARFM) to achieve daily 30 m resolution. All data processing adopts a uniform Universal Transverse Mercator projection aligned with the military grid reference system (UTM-MGRS), ensuring consistency across distinct grid cells. Input datasets—including radiometrically terrain-corrected Sentinel-1 (RTC-S1), Harmonized Landsat Sentinel-2 (HLS), Moderate Resolution Imaging Spectroradiometer (MODIS) products, Soil Moisture Active Passive (SMAP) L4, Global Precipitation Measurement (GPM) mission data, and digital elevation model (DEM)—underwent preprocessing steps such as reprojection, resampling (e.g., bicubic convolution for downscaling, median aggregation for upscaling), and conversion to cloud-optimized GeoTIFF (COG) format to enhance computational efficiency.

3.1. Stage 1: Residual Correction-Based Soil Moisture Downscaling (9 km to 1 km)

The initial downscaling from 9 km to 1 km resolution employs a random forest (RF) regression model, selected for its proficiency in handling non-linear relationships and robustness with high-dimensional datasets. The model integrates multiple auxiliary variables: (1) surface moisture indicators, such as the Land Surface Water Index (LSWI), derived from MODIS MCD43A4 Nadir BRDF-Adjusted Reflectance (NBAR) data; (2) land surface temperature (LST) from MODIS MCD11A1; (3) topographic parameters (elevation, slope, aspect) from NASA Shuttle Radar Topography Mission (SRTM) DEM; (4) precipitation data from GPM Integrated Multi-satellitE Retrievals for GPM (IMERG) V06; and (5) geographic coordinates. The LSWI, a key indicator of vegetation water content and surface wetness, is calculated as
LSWI = ρ NIR ρ SWIR ρ NIR + ρ SWIR
where ρ NIR and ρ SWIR represent near-infrared and shortwave infrared reflectance, respectively.
A two-scale resampling strategy was implemented: auxiliary features were upsampled to 9 km via median aggregation for model training with SMAP L4 SSM data, and downsampled to 1 km via bicubic convolution for high-resolution prediction. To preserve the fidelity of SMAP L4 observations, a residual correction mechanism was introduced. The RF model establishes a mapping function f R F at the 9 km scale, with daily residuals Δ 9 km computed between predictions and SMAP data. These residuals are interpolated to 1 km ( Δ 1 km ) and added to the 1 km RF predictions, yielding 1 km daily corrected SSM estimates SSM 1 km daily :
SSM 9 km daily = f R F ( X 9 km ) + Δ 9 km
SSM 1 km daily = f R F ( X 1 km ) + Δ 1 km
where X 9 km and X 1 km represent the feature vectors at 9 km and 1 km resolutions, respectively. These vectors comprise the integrated auxiliary variables—LSWI, LST, elevation, slope, aspect, precipitation, and coordinates—which are derived through a two-scale resampling strategy to ensure spatial consistency with the target resolutions.

3.2. Stage 2: Water Cloud Model-Based Soil Moisture Inversion (30 m, Intermittent)

To address the persistent limitations of optical remote sensing under cloud-covered conditions, this stage employs Sentinel-1 Synthetic Aperture Radar (SAR) data for high-resolution soil moisture retrieval. SAR observations are unaffected by atmospheric conditions, providing reliable data even during periods of extensive cloud cover. The Water Cloud Model (WCM) [47] serves as the physical foundation for decomposing SAR backscatter signals ( σ total 0 ) into vegetation ( σ veg 0 ) and soil ( σ soil 0 ) contributions, establishing a direct linkage between SAR measurements and soil moisture dynamics.
The vegetation water content (VWC) is a critical parameter in the WCM, representing the amount of water stored in the vegetation per unit of area (kg/m2). VWC is estimated using the Normalized Difference Vegetation Index (NDVI), derived from Harmonized Landsat Sentinel-2 (HLS) optical data:
NDVI = ρ NIR ρ RED ρ NIR + ρ RED
However, optical-based NDVI is frequently compromised by cloud contamination, particularly during summer months, resulting in substantial data gaps. Temporal interpolation methods often fail to fully reconstruct missing values, leaving significant spatial voids. To overcome this, we integrate the Radar Vegetation Index (RVI) [48] from Sentinel-1 SAR data, which is impervious to cloud interference. The RVI is defined as
RVI = 4 · σ VH 0 σ VV 0 + σ VH 0
A linear conversion model is established to relate RVI to NDVI, enabling the filling of NDVI gaps while preserving the original NDVI values where available:
NDVI = c · RVI + d
Coefficients c and d are calibrated daily through pixel-wise matching between concurrent RVI and NDVI observations, ensuring temporal consistency. This hybrid approach leverages the complementary strengths of optical and SAR data, maintaining the accuracy of existing NDVI while filling gaps with SAR-derived estimates. VWC is subsequently calculated using an empirical relationship [49]:
VWC = 1.9134 · NDVI 2 0.3215 · NDVI
The WCM decomposes the total SAR backscatter ( σ total 0 ) into vegetation ( σ veg 0 ) and soil ( σ soil 0 ) components for the VV polarization mode. This mode demonstrates superior retrieval accuracy based on comparative analyses (Equations (9)–(11)):
σ VV , total 0 = σ VV , veg 0 + T VV 2 · σ VV , soil 0
σ VV , veg 0 = A · VWC · cos θ · ( 1 T VV 2 )
T VV 2 = exp 2 · B · VWC cos θ
where T VV 2 is the vegetation attenuation factor for VV polarization, θ is the radar incidence angle of the Sentinel-1 radiometric terrain correction (RTC) auxiliary data, and the parameters A = 0.0012 , B = 0.091 are adopted from the literature [50].
A remote sensing-based calibration strategy is employed to establish a relationship between SAR-derived soil backscatter and soil moisture without ground-based measurements. For each UTM-MGRS grid cell, temporally coincident datasets of 1 km daily SSM SSM 1 km daily from Stage 1 and σ VV , soil 0 at 30 m resolution are identified. The 30 m σ VV , soil 0 values are aggregated to 1 km resolution using median resampling to match the spatial scale of SSM 1 km daily . A linear regression is then performed between the resampled σ VV , soil , 1 km 0 and SSM 1 km daily over a 12-day moving window preceding each Sentinel-1 acquisition, yielding calibration parameters C and D:
SSM 1 km daily = C · σ VV , soil , 1 km 0 + D
These parameters are subsequently applied to the original 30 m σ VV , soil 0 to generate an intermittent 30 m SSM product SSM 30 m 12 days :
SSM 30 m 12 days = C · σ VV , soil , 30 m 0 + D
This approach ensures scale consistency and leverages the temporal stability of the relationship, producing a purely remote sensing-derived SSM estimate at high spatial resolution. The use of a 12-day moving window accounts for dynamic surface conditions while maintaining computational efficiency, and the entire process operates independently of in situ data, enhancing applicability in data-scarce regions.

3.3. Stage 3: Spatiotemporal Fusion-Based Soil Moisture Inversion (30 m, Daily)

The final stage employs the Enhanced Spatiotemporal Adaptive Reflectance Fusion Model (ESTARFM) [51,52] to generate daily 30 m surface soil moisture (SSM) by fusing the high-temporal-frequency 1 km RF downscaling results ( SSM 1 km daily ) with the high-spatial-resolution but intermittent WCM-derived SSM ( SSM 30 m 12 days ). This fusion process leverages the complementary characteristics of the input datasets: the 1 km data provide continuous temporal coverage, while the 30 m WCM data offer fine spatial details. The ESTARFM algorithm performs spatiotemporal registration to align the datasets, applies dynamic masking to account for surface heterogeneity, and optimizes pixel weights based on spectral and spatial similarities. The core fusion mechanism can be summarized as follows:
SSM 30 m daily = i = 1 n w i · SSM 30 m 12 days + Δ SSM 30 m
where w i represents the spatiotemporally adaptive weights derived from the similarity between input datasets, and Δ SSM 1 km denotes the temporal changes propagated from the 1 km scale. This process yields a spatially complete and temporally continuous daily 30 m SSM product ( SSM 30 m daily ), effectively bridging the gap between coarse temporal resolution and fine spatial resolution without relying on ground-based measurements. The implementation ensures computational efficiency while maintaining physical consistency across scales.

3.4. Experimental Setup

3.4.1. Downscaling 1 km Soil Moisture with Residual Correction

The downscaling process used soil moisture data from SMAP L4 as a baseline, with feature datasets spanning the entire study period (DOY: 153-244, Year: 2024). To address significant cloud-induced data gaps in MODIS products during the summer months (e.g., MCD43A4 has no data in the study area for DOY177 and DOY178, and MOD11A1 has no data in the study area for DOY208), temporal linear interpolation and Savitzky–Golay filtering were applied to MCD43A4 NBAR (LSWI) and MOD11A1 (LST) datasets prior to model integration. Feature data included LSWI, LST, SRTM DEM derivatives (elevation, slope, aspect), GPM IMERG precipitation, and geographic coordinates. A scale-adaptive resampling strategy was implemented: median aggregation for upscaling to 9 km resolution for model training, and bicubic convolution for downsampling to 1 km resolution for prediction.
The random forest model was trained using all valid pixels at 9 km resolution, with SMAP L4 data as the target variable. Daily predictions were generated at resolutions of 9 km and 1 km, followed by residual correction wherein differences between the 9 km predictions and the actual SMAP L4 values were calculated, interpolated to 1 km via bicubic convolution, and added to the initial 1 km predictions. This produced a daily soil moisture product of 1 km without gaps ( SSM 30 m daily ) while preserving the fidelity of the original SMAP observations.

3.4.2. Inversion of 30 m Soil Moisture Using Water Cloud Model

High-resolution soil moisture retrieval employed Sentinel-1 SAR data processed through the Water Cloud Model. Vegetation water content (VWC) was derived from HLS NDVI data, with temporal linear interpolation ensuring daily coverage. To compensate for persistent cloud gaps, a hybrid NDVI reconstruction approach integrated SAR-derived Radar Vegetation Index (RVI) through daily linear regression between concurrent RVI and available NDVI observations. VWC calculation was restricted to pixels with NDVI values between 0.1 and 0.9 to exclude water bodies and extreme values.
Model calibration established the relationship between the soil backscatter ( σ VV , soil , 30 m 0 ) and soil moisture through least squares regression. For each Sentinel-1 acquisition, 30 m backscatter values were aggregated to 1 km resolution and paired with temporally aligned SSM 1 km daily data over a 12-day moving window. The derived calibration coefficients were applied to original 30 m backscatter values, generating intermittent 30 m soil moisture estimates ( SSM 30 m 12 days ) without requiring in situ measurements.

3.4.3. Spatial–Temporal Fusion Parameter Settings

The fusion process integrated daily 1 km RF downscaling results ( SSM 1 km daily ) with intermittent 30 m WCM-derived soil moisture ( SSM 30 m 12 days ) using Equation (14). Three cloud-free reference dates (DOY 167, 227, 239) were selected from the available WCM results, representing key temporal stages during the summer study period. The 1 km soil moisture datasets were resampled to 30 m resolution using bicubic convolution to ensure spatial alignment.
A 5 × 5 pixel moving window incorporated land cover information from ESA WorldCover 10 m 2021 v200 [53] to account for surface heterogeneity. The fusion algorithm calculated spectral and spatial similarities between input datasets and derived spatiotemporal weights through neighborhood feature analysis. Daily predictions were generated by temporal weighting of reference pairs, producing a continuous 30 m soil moisture time series ( SSM 30 m daily ) from 15 June to 26 August 2024. This approach effectively combined the temporal consistency of 1 km data with the spatial detail of 30 m WCM retrievals.

4. Results

4.1. Performance of Stage 1: Residual-Constrained Downscaling to 1 km Resolution

The first research objective aimed to develop a residual-constrained downscaling approach to enhance the soil moisture of SMAP L4 from 9 km to 1 km daily resolution. The random forest model effectively captured the non-linear relationships between SMAP L4 SSM and the auxiliary variables, achieving significant spatial refinement while maintaining temporal consistency. Validation against in situ measurements demonstrated substantial improvement over the original SMAP L4 product, with the correlation coefficient increasing from 0.34 to 0.53 in the uncorrected version and stabilizing at 0.44 after residual correction (Table 3). The residual correction mechanism successfully preserved the fidelity of SMAP L4 observations, reducing systematic errors while improving spatial detail.
Scatter plot analysis (Figure 4) revealed improved agreement with in situ observations throughout the moisture range, particularly for intermediate soil moisture values. The residual-corrected product showed tighter clustering around the 1:1 line compared to the original SMAP L4, demonstrating the effectiveness of the downscaling approach in capturing fine-scale spatial variability while maintaining the temporal dynamics of the coarse-resolution product.

4.2. Performance of Stage 2: WCM Calibration for 30 m Retrieval

The second research objective focused on calibrating the Water Cloud Model for Sentinel-1 SAR data using intermediate 1 km soil moisture estimates, allowing 30 m retrieval without in situ measurements. The calibration strategy successfully established robust relationships between SAR backscatter and soil moisture, with remote sensing-based calibration performing comparable to in situ calibration approaches. The ablation study demonstrated that the proposed WCM calibration achieved similar accuracy (R = 0.54, RMSE = 0.058 cm3/cm3) to the in situ calibrated version (R = 0.53, RMSE = 0.069 cm3/cm3), validating the effectiveness of using the intermediate 1 km SSM for model parameterization.
The 30 m soil moisture products derived from WCM captured fine-scale heterogeneity related to land cover and topography, with the dynamic thresholding approach effectively handling surface variability. The integration of HLS data with Sentinel-1 observations enabled consistent vegetation parameter estimation, while the NDVI-based filtering successfully excluded water bodies and extreme values, ensuring physically plausible retrievals across diverse landscapes.

4.3. Performance of Stage 3: Daily 30 m Product via Spatiotemporal Fusion

The third research objective addressed the implementation of spatiotemporal fusion to generate seamless daily 30 m soil moisture products. The ESTARFM algorithm effectively combined the temporal continuity of 1 km downscaled SSM with the spatial detail of intermittent 30 m WCM retrievals, producing a continuous daily product that captured both temporal dynamics and spatial patterns.
Station-wise validation against 16 in situ stations (Table 4) demonstrated robust performance, with correlation coefficients ranging from 0.25 to 0.82 (mean R = 0.64) and RMSE values below 0.08 cm3/cm3 for 75% of stations. The minimal difference between RMSE and ubRMSE (below 0.02 cm3/cm3 for most stations) indicated limited systematic bias in the fused product.

4.4. Overall Framework Validation and Component Analysis

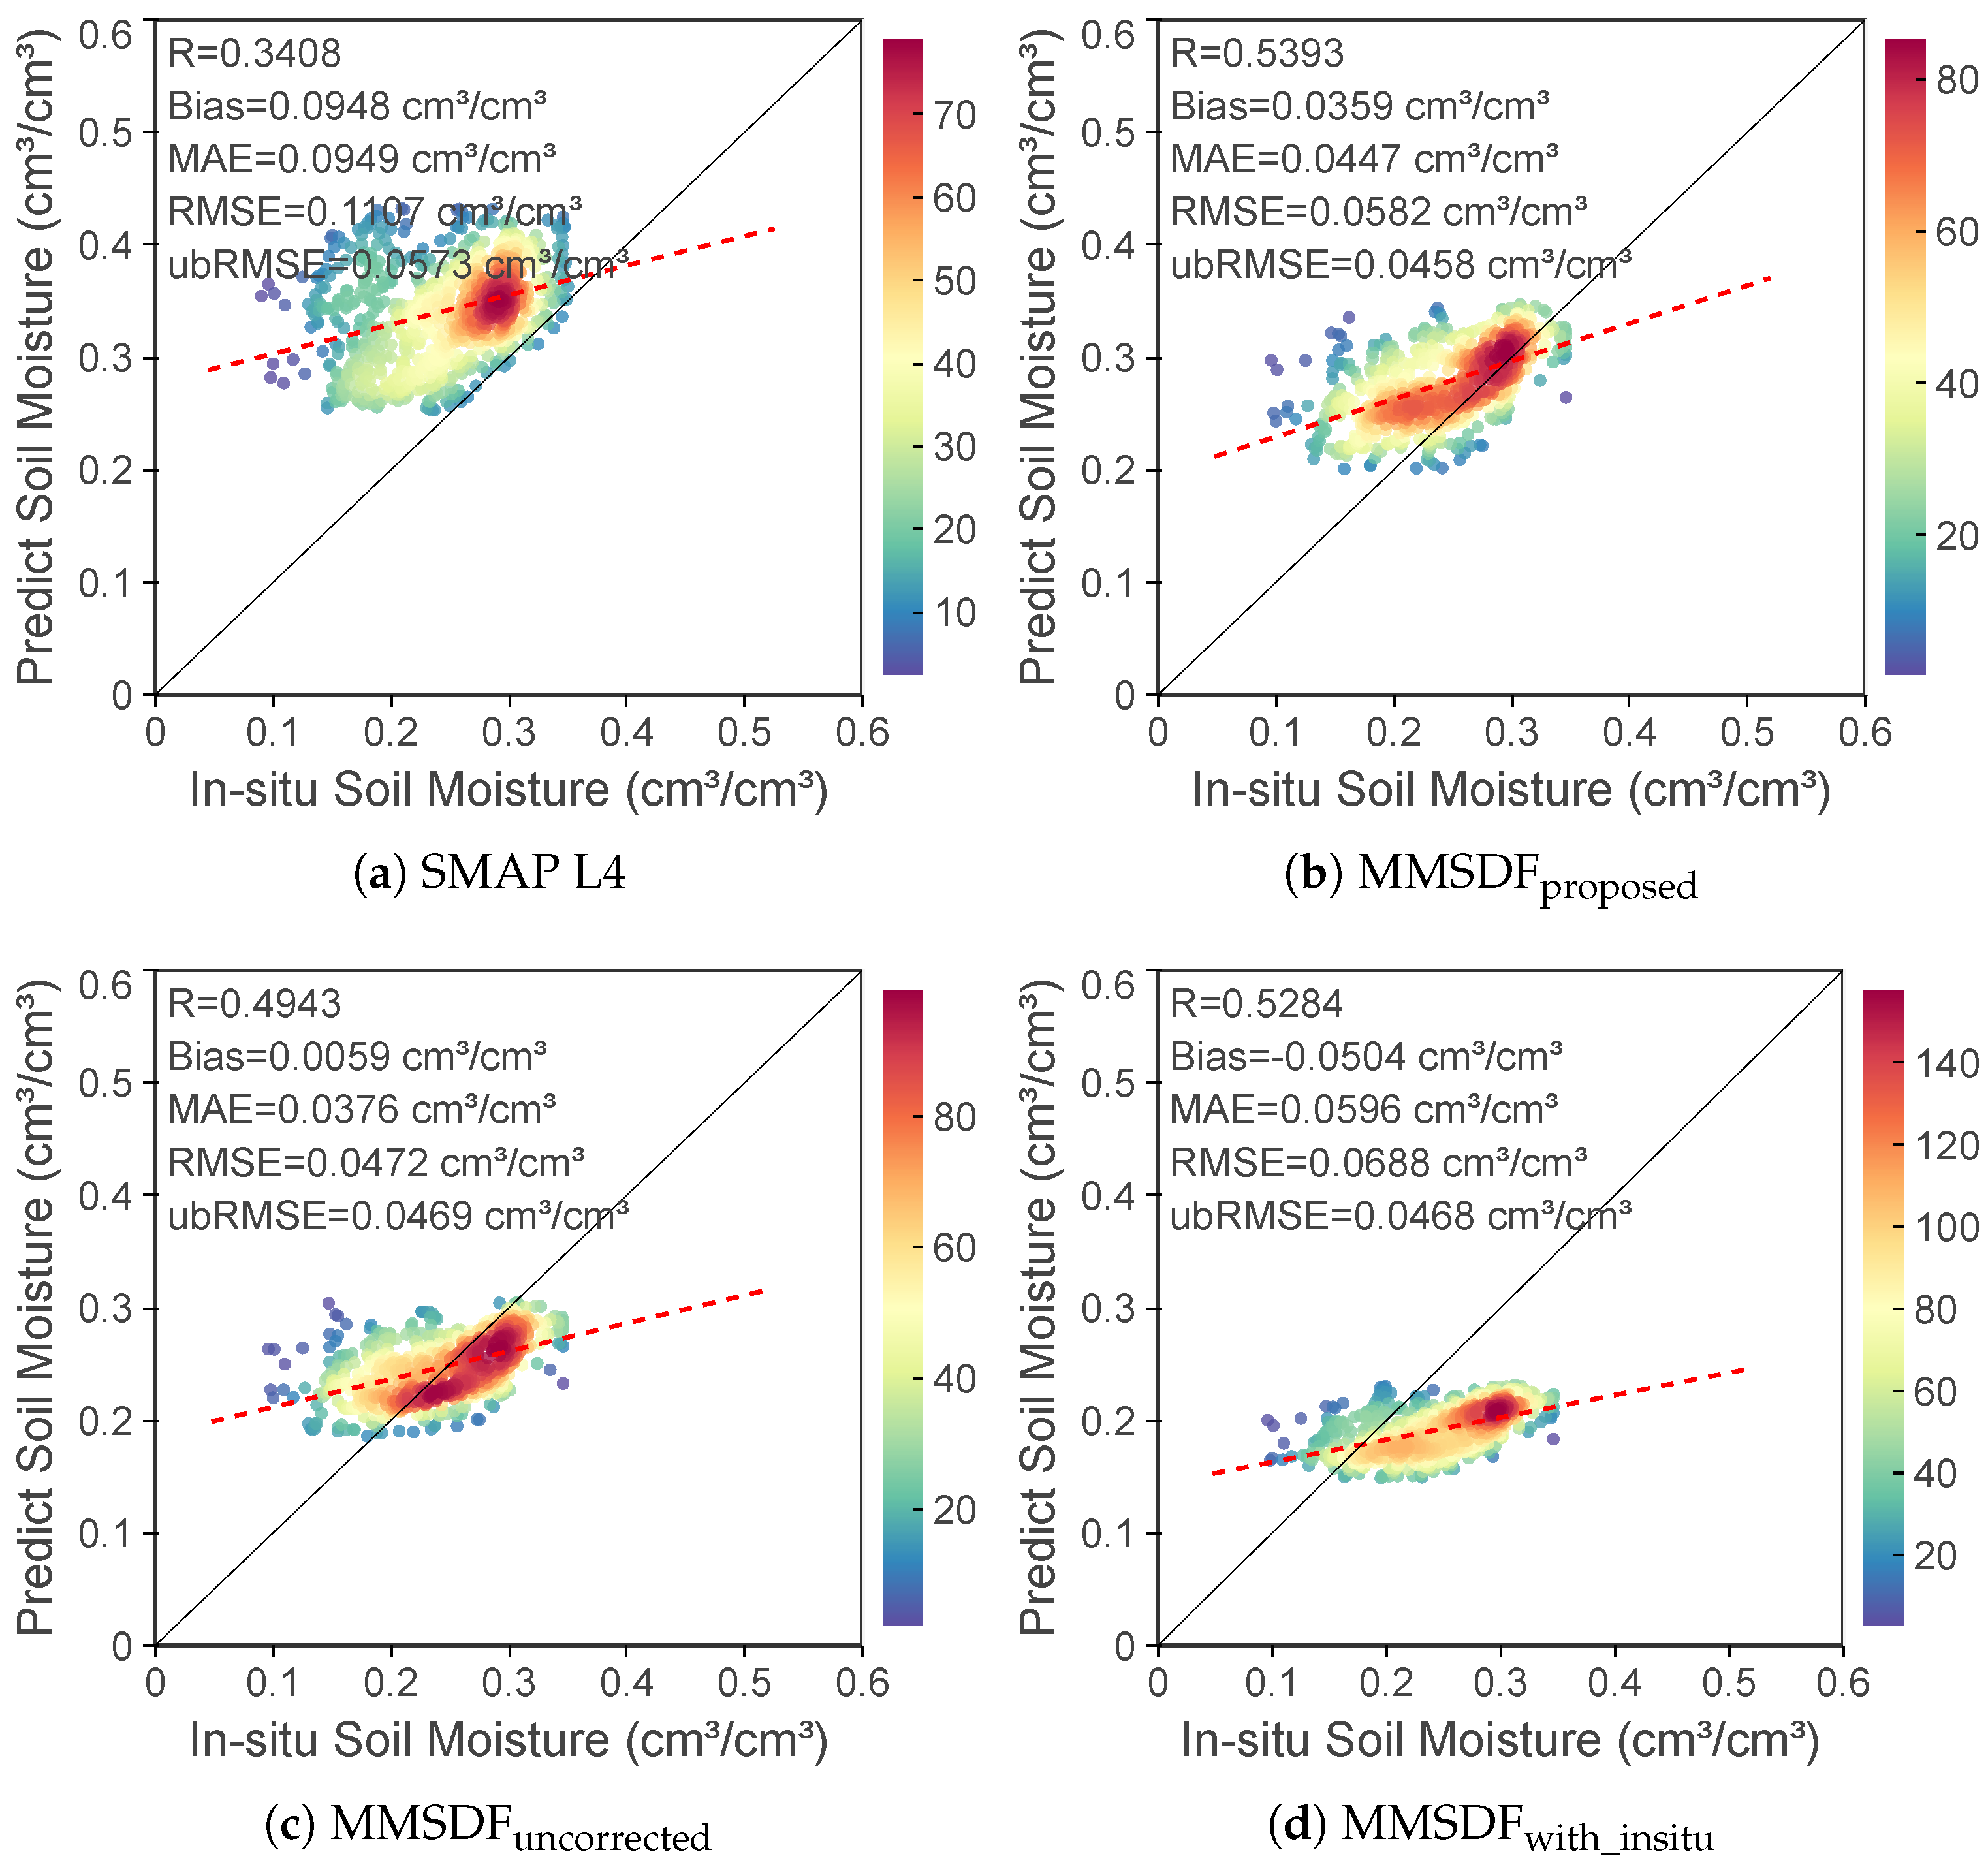
The comprehensive ablation study (Table 5, Figure 5) evaluated individual component contributions to the complete MMSDF framework. The proposed framework (Case b) achieved R = 0.54, bias = 0.036 cm3/cm3, and RMSE = 0.058 cm3/cm3, representing substantial improvements over the baseline SMAP L4 product (Case a: R = 0.34, RMSE = 0.111 cm3/cm3). The residual correction mechanism contributed significantly to performance, with its removal (Case c) degrading the correlation to R = 0.49, while remote sensing-based WCM calibration demonstrated comparable effectiveness to in situ approaches.
Scatter plot analysis (Figure 5) confirmed increased agreement of the complete framework with in situ observations, demonstrating balanced performance under dry, intermediate, and wet conditions. The systematic integration of multi-stage components enabled the framework to overcome individual sensor limitations while maintaining physical consistency across scales.
Temporal analysis (Figure 6) revealed an excellent capture of soil moisture dynamics, particularly during precipitation events (e.g., DOY 207 and 210). The fused product maintained temporal consistency with the 1 km inputs while incorporating the spatial detail from the WCM retrievals, effectively representing both gradual drying patterns and rapid wetting events.
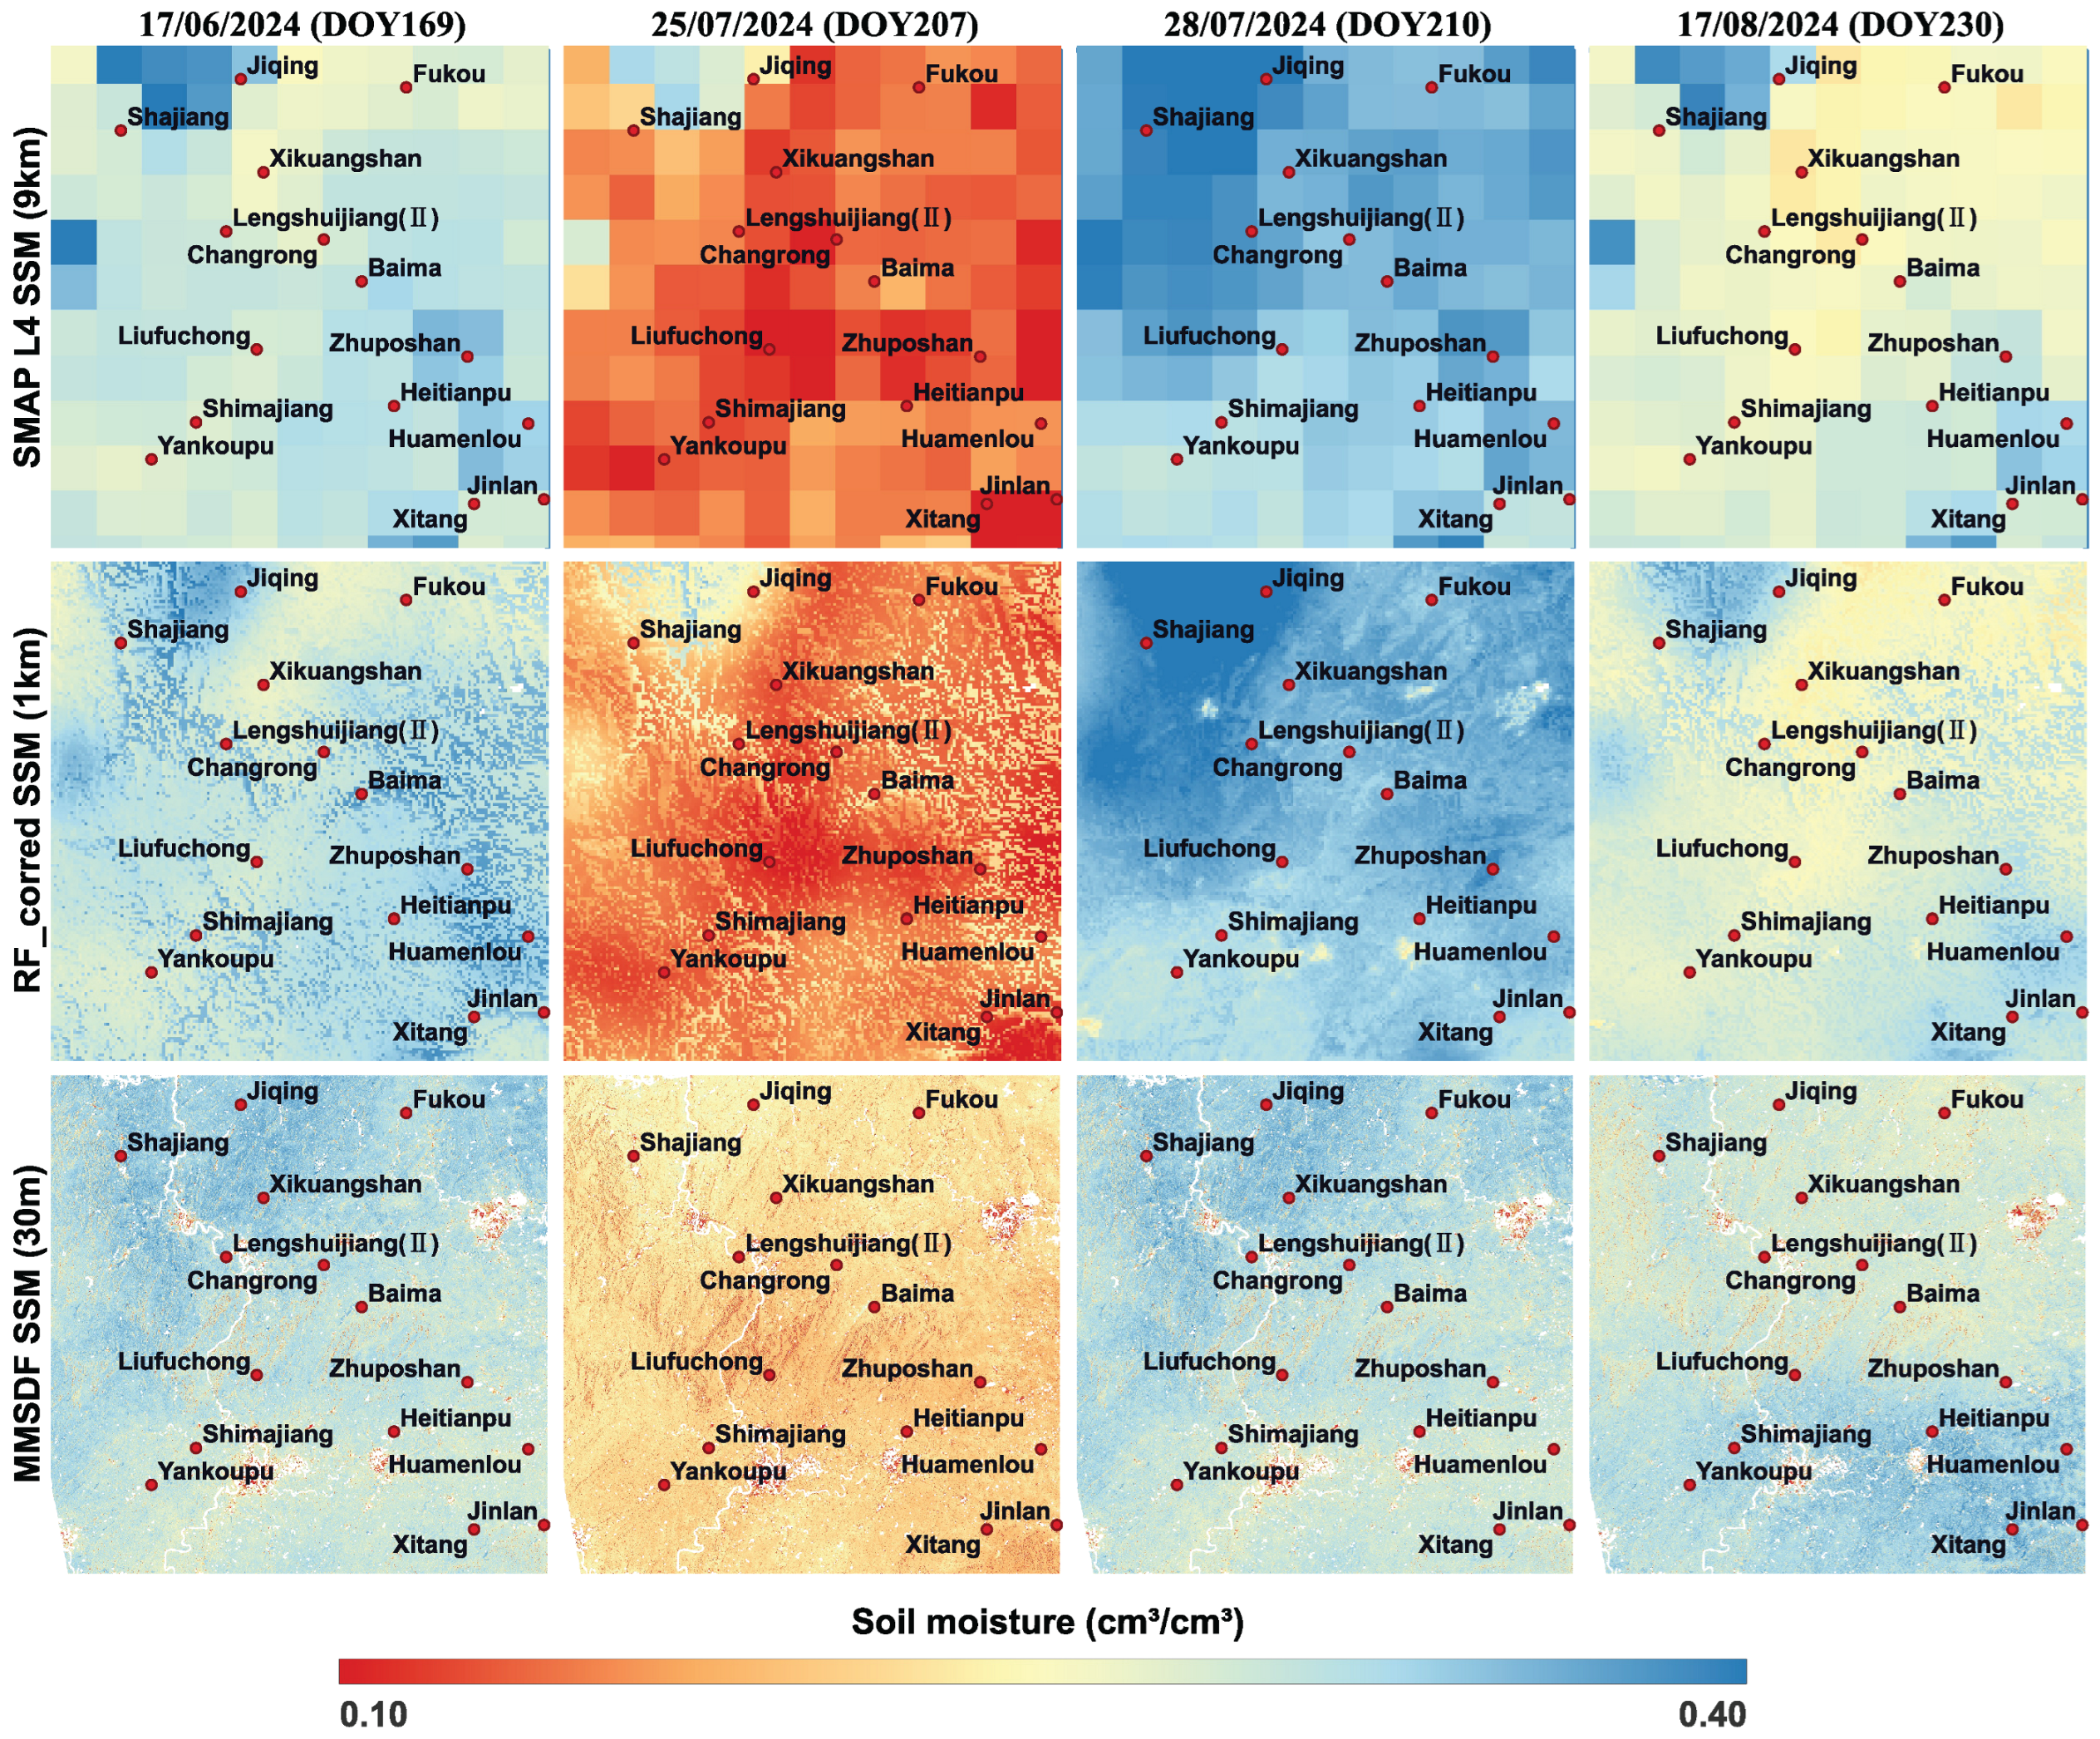
Spatial pattern analysis (Figure 7) demonstrated a progressive enhancement from 9 km to 1 km to 30 m resolution, and the final product successfully captured fine-scale heterogeneity related to topography, land cover, and hydrological features. The 30 m resolution allowed for the identification of field-scale variations and urban–rural gradients, providing unprecedented detail for local-scale applications.

5. Discussion

5.1. Methodological Advancements and Framework Performance

The development and validation of the MMSDF framework demonstrate how systematic multi-source data integration can address persistent challenges in high-resolution soil moisture monitoring. Our findings build upon established principles of microwave–optical synergy for soil moisture estimation, with the framework introducing a structured multi-stage approach that maintains physical consistency across scales. The residual correction mechanism represents a significant methodological innovation that addresses limitations in machine learning-based downscaling, where information loss from coarse-resolution products can occur. By preserving SMAP L4’s radiometric fidelity while enhancing spatial detail, this approach demonstrates how physical constraints can be effectively integrated into data-driven models. The performance improvement observed when including residual correction (with R increasing from 0.49 to 0.54) underscores its importance in maintaining hydrological realism.
The remote sensing-based WCM calibration strategy offers an innovative solution to the dependency on in situ measurements that has constrained the operational SAR-based soil moisture retrieval. Using intermediate 1 km SSM estimates as calibration targets, this approach achieves comparable accuracy to in situ calibration while eliminating the need for dense ground networks. This finding suggests that synergistic use of multi-scale satellite observations may provide viable alternatives to ground-based calibration in data-sparse regions. The ESTARFM-based spatiotemporal fusion successfully integrates temporal continuity with spatial detail, demonstrating how temporal gaps in high-resolution observations can be mitigated through intelligent data fusion. The framework’s ability to capture both gradual drying patterns and rapid wetting events while maintaining spatial detail at 30 m resolution represents a significant step toward operational high-resolution soil moisture monitoring.

5.2. Spatial Heterogeneity and Accuracy Analysis

In response to the accuracy variations between sites, we conducted a comprehensive analysis of retrieval performance relative to land cover heterogeneity. The validation results against 16 in situ stations reveal distinct patterns in accuracy metrics in different land cover classes (Table 6, Figure 8), providing insights into how surface characteristics influence retrieval performance. The analysis demonstrates that accuracy varies systematically with land cover type, reflecting the complex interaction between surface properties and remote sensing signals.
The built-up areas exhibited the lowest median RMSE (0.061 cm3/cm3) despite their inherent spatial heterogeneity, suggesting that the framework effectively handles urban environments where dielectric properties vary significantly. The relatively low ubRMSE (0.026 cm3/cm3) in these areas indicates minimal random error, possibly due to the stable structural characteristics of the built surfaces. The tree cover areas showed moderate accuracy (median RMSE = 0.064 cm3/cm3) but substantial variability in the correlation coefficients (IQR = 0.229), reflecting the influence of factors such as canopy structure, species composition, and topographic effects on microwave scattering. This variability aligns with theoretical expectations of SAR sensitivity to vegetation parameters and surface geometry.
Grassland areas demonstrated a good correlation (median R = 0.686) but higher RMSE values (0.072 cm3/cm3), potentially due to variations in grass height, density, and soil exposure that affect both optical and microwave responses. Cropland exhibited the highest median RMSE (0.085 cm3/cm3) and bias (0.082 cm3/cm3), likely reflecting the dynamic nature of agricultural surfaces where rapid changes in vegetation cover, soil tillage practices, and irrigation patterns create complex scattering environments. The substantial difference between RMSE and ubRMSE in cropland areas suggests that systematic errors related to vegetation parameterization or soil surface characterization may require additional attention.
These findings highlight the importance of considering land cover heterogeneity when interpreting high-resolution soil moisture products. The framework demonstrates varying levels of effectiveness in different surface types, with performance being influenced by the spatial complexity and temporal stability of the characteristics of the land cover. This analysis provides valuable information for future improvements, suggesting that land cover-adaptive approaches or additional surface parameterization may enhance accuracy in heterogeneous landscapes.

5.3. Limitations and Future Research Directions

Several limitations identified in this study point to important directions for future research. The regional specificity of the validation, conducted during a single season (summer 2024) in a subtropical monsoon region, necessarily constrains the generalizability of the findings. The framework’s reliance on region-specific relationships between auxiliary variables and soil moisture suggests that transfer to other climatic regimes would require careful consideration of local environmental characteristics. Similarly, the WCM parameters calibrated for this region may not apply directly to areas with different types of vegetation or soil textures, highlighting the need for a broader geographical validation.
The persistent dependence on optical data for vegetation characterization remains problematic during extended cloudy periods, potentially affecting the accuracy of both the downscaling and WCM retrieval stages. Although the integration of SAR data helps mitigate this limitation, complete independence from optical observations has not been achieved. Future work could explore the use of microwave-based vegetation indices or the integration of weather-resistant satellite data to improve all-weather capability.
The computational demands of the multi-stage framework, particularly the ESTARFM fusion and high-resolution processing, may present challenges for operational implementation at larger scales. Investigating optimized algorithms, cloud computing solutions, or simplified fusion approaches could enhance processing efficiency without significantly compromising accuracy.
To address the identified limitations, future research should focus on validating the framework across diverse climatic regions, multiple seasons, and longer time periods. Additionally, developing land cover-adaptive approaches that account for specific surface characteristics in different environments could improve robustness. The integration of additional data sources, such as SMAP-Sentinel combined products or new satellite missions, may further enhance performance and spatial-temporal coverage.
In conclusion, while the MMSDF framework demonstrates promising capabilities for high-resolution daily soil moisture monitoring, its operational deployment requires continued refinement to address regional specificity, seasonal robustness, and computational efficiency. The findings contribute to the ongoing development of multi-source synergistic approaches for earth observation, highlighting both the potential and challenges of integrating diverse remote sensing technologies for hydrological applications.

6. Conclusions

This study presents a microwave–optical multi-stage synergistic downscaling framework (MMSDF) to generate 30 m daily soil moisture products through systematic integration of SMAP L4, HLS optical imagery, and Sentinel-1 SAR data. The framework employs a three-stage approach: random forest-based downscaling with residual correction, Water Cloud Model calibration using remote sensing observations, and ESTARFM spatiotemporal fusion for continuous high-resolution products. Comprehensive validation against 16 meteorological stations demonstrates substantial improvements over baseline SMAP L4 products, achieving a 58% correlation improvement ( R = 0.54 vs. R = 0.34 ) and a 48% RMSE reduction (0.058 vs. 0.111 cm3/cm3). The framework successfully addresses fundamental trade-offs between spatial resolution and temporal coverage in satellite remote sensing, establishing a robust technical pathway for operational soil moisture monitoring at field scales under subtropical monsoon conditions.
Current limitations include persistent dependency on optical data for vegetation characterization during cloudy conditions, computational demands associated with multi-stage processing, and restricted validation to a single season and geographical region. Future research should focus on developing robust methods for parameterization of cloud vegetation, optimizing computational efficiency for operational deployment, and extending validation to diverse climatic conditions and seasonal cycles. The demonstrated ability of the framework to achieve reasonable accuracy without dense ground networks suggests potential value for applications in agricultural water management, drought assessment, and hydrological modeling, particularly in regions with limited monitoring infrastructure. Addressing these limitations through enhanced processing strategies and broader validation will further improve the robustness and applicability of the framework for environmental monitoring and water resource management.

Author Contributions

Conceptualization, H.X., Y.X. and X.Z.; methodology, H.X., T.W. and Y.Z.; software, H.X., T.W. and K.Z.; validation, H.X., Y.X. and Y.Z.; formal analysis, H.X. and T.W.; investigation, H.X.; resources, Y.X., Y.Z. and X.Z.; data curation, H.X.; writing—original draft preparation, H.X.; writing—review and editing, T.W., G.C. and X.Z.; visualization, H.X. and T.W.; supervision, G.C., X.Z. and Q.W.; project administration, Y.Z., G.C. and X.Z.; funding acquisition, G.C. and X.Z. All authors have read and agreed to the published version of the manuscript.

Funding

This work was supported in part by the National Natural Science Foundation of China (No. 42101346) and in part by the China Postdoctoral Science Foundation (No. 2020M680109).

Data Availability Statement

All image data in this article are publicly available from NASA EARTHDATA platform (https://earthdata.nasa.gov/, accessed on 7 March 2025).

Acknowledgments

The numerical calculations in this paper have been done on the supercomputing system in the Supercomputing Center of Wuhan University. During the preparation of this work, the authors used GPT-5 for grammatical modification and polishing. After using this tool/service, the authors reviewed and edited the content as needed and take full responsibility for the content of the publication. We are also thankful for the reviewers’ evaluation of our paper and the constructive comments they made.

Conflicts of Interest

The authors declare no conflicts of interest.

References

  1. Peng, J.; Loew, A.; Merlin, O.; Verhoest, N.E. A review of spatial downscaling of satellite remotely sensed soil moisture. Rev. Geophys. 2017, 55, 341–366. [Google Scholar] [CrossRef]
  2. Sishodia, R.P.; Ray, R.L.; Singh, S.K. Applications of remote sensing in precision agriculture: A review. Remote Sens. 2020, 12, 3136. [Google Scholar] [CrossRef]
  3. Yuan, Q.; Shen, H.; Li, T.; Li, Z.; Li, S.; Jiang, Y.; Xu, H.; Tan, W.; Yang, Q.; Wang, J.; et al. Deep learning in environmental remote sensing: Achievements and challenges. Remote Sens. Environ. 2020, 241, 111716. [Google Scholar] [CrossRef]
  4. Song, C.; Jia, L. A method for downscaling FengYun-3B soil moisture based on apparent thermal inertia. Remote Sens. 2016, 8, 703. [Google Scholar] [CrossRef]
  5. Liu, P.W.; Bindlish, R.; O’Neill, P.; Fang, B.; Lakshmi, V.; Yang, Z.; Cosh, M.H.; Bongiovanni, T.; Collins, C.H.; Starks, P.J.; et al. Thermal hydraulic disaggregation of SMAP soil moisture over the continental United States. IEEE J. Sel. Top. Appl. Earth Obs. Remote Sens. 2022, 15, 4072–4092. [Google Scholar] [CrossRef]
  6. Sharma, J.; Prasad, R.; Srivastava, P.K.; Yadav, S.A.; Yadav, V.P. Improving spatial representation of soil moisture through the incorporation of single-channel algorithm with different downscaling approaches. IEEE Trans. Geosci. Remote Sens. 2022, 60, 1–10. [Google Scholar] [CrossRef]
  7. Liu, C.; Zhang, X.; Wang, T.; Chen, G.; Zhu, K.; Wang, Q.; Wang, J. Detection of vegetation coverage changes in the Yellow River Basin from 2003 to 2020. Ecol. Indic. 2022, 138, 108818. [Google Scholar] [CrossRef]
  8. Chen, G.; Zhang, K.; Zhang, X.; Xie, H.; Yang, H.; Tan, X.; Wang, T.; Ma, Y.; Wang, Q.; Cao, J.; et al. Enhancing terrestrial net primary productivity estimation with EXP-CASA: A novel light use efficiency model approach. Remote Sens. Environ. 2025, 326, 114790. [Google Scholar] [CrossRef]
  9. Peng, J.; Loew, A.; Zhang, S.; Wang, J.; Niesel, J. Spatial downscaling of satellite soil moisture data using a vegetation temperature condition index. IEEE Trans. Geosci. Remote Sens. 2015, 54, 558–566. [Google Scholar] [CrossRef]
  10. Sun, H.; Cai, C.; Liu, H.; Yang, B. Microwave and meteorological fusion: A method of spatial downscaling of remotely sensed soil moisture. IEEE J. Sel. Top. Appl. Earth Obs. Remote Sens. 2019, 12, 1107–1119. [Google Scholar] [CrossRef]
  11. Li, J.; Wang, S.; Gunn, G.; Joosse, P.; Russell, H.A. A model for downscaling SMOS soil moisture using Sentinel-1 SAR data. Int. J. Appl. Earth Obs. Geoinf. 2018, 72, 109–121. [Google Scholar] [CrossRef]
  12. Bai, J.; Cui, Q.; Zhang, W.; Meng, L. An approach for downscaling SMAP soil moisture by combining Sentinel-1 SAR and MODIS data. Remote Sens. 2019, 11, 2736. [Google Scholar] [CrossRef]
  13. Meyer, R.; Zhang, W.; Kragh, S.J.; Andreasen, M.; Jensen, K.H.; Fensholt, R.; Stisen, S.; Looms, M.C. Exploring the combined use of SMAP and Sentinel-1 data for downscaling soil moisture beyond the 1 km scale. Hydrol. Earth Syst. Sci. Discuss. 2021, 26, 3337–3357. [Google Scholar] [CrossRef]
  14. Ojha, N.; Merlin, O.; Molero, B.; Suere, C.; Olivera-Guerra, L.; Ait Hssaine, B.; Amazirh, A.; Al Bitar, A.; Escorihuela, M.J.; Er-Raki, S. Stepwise disaggregation of SMAP soil moisture at 100 m resolution using Landsat-7/8 data and a varying intermediate resolution. Remote Sens. 2019, 11, 1863. [Google Scholar] [CrossRef]
  15. Chen, N.; He, Y.; Zhang, X. Nir-red spectra-based disaggregation of smap soil moisture to 250 m resolution based on oznet in southeastern australia. Remote Sens. 2017, 9, 51. [Google Scholar] [CrossRef]
  16. Nadeem, A.A.; Zha, Y.; Shi, L.; Ali, S.; Wang, X.; Zafar, Z.; Afzal, Z.; Tariq, M.A.U.R. Spatial downscaling and gap-filling of SMAP soil moisture to high resolution using MODIS surface variables and machine learning approaches over ShanDian River Basin, China. Remote Sens. 2023, 15, 812. [Google Scholar] [CrossRef]
  17. Alemohammad, S.H.; Kolassa, J.; Prigent, C.; Aires, F.; Gentine, P. Global downscaling of remotely sensed soil moisture using neural networks. Hydrol. Earth Syst. Sci. 2018, 22, 5341–5356. [Google Scholar] [CrossRef]
  18. Colliander, A.; Fisher, J.B.; Halverson, G.; Merlin, O.; Misra, S.; Bindlish, R.; Jackson, T.J.; Yueh, S. Spatial downscaling of SMAP soil moisture using MODIS land surface temperature and NDVI during SMAPVEX15. IEEE Geosci. Remote Sens. Lett. 2017, 14, 2107–2111. [Google Scholar] [CrossRef]
  19. Zhang, X.; Wang, T.; Chen, G.; Tan, X.; Zhu, K. Convective clouds extraction from Himawari–8 satellite images based on double-stream fully convolutional networks. IEEE Geosci. Remote Sens. Lett. 2019, 17, 553–557. [Google Scholar] [CrossRef]
  20. Zhao, W.; Wen, F.; Wang, Q.; Sanchez, N.; Piles, M. Seamless downscaling of the ESA CCI soil moisture data at the daily scale with MODIS land products. J. Hydrol. 2021, 603, 126930. [Google Scholar] [CrossRef]
  21. Song, P.; Zhao, T.; Shi, J.; Zhang, Y.; Zheng, J. A Novel Downscaling Approach based on Multi-Frequency Microwave Radiometry toward Finer Scale Global Soil Moisture Mapping. IEEE Trans. Geosci. Remote Sens. 2024, 62, 5302915. [Google Scholar] [CrossRef]
  22. Wakigari, S.A.; Leconte, R. Enhancing spatial resolution of SMAP soil moisture products through spatial downscaling over a large watershed: A case study for the Susquehanna River Basin in the Northeastern United States. Remote Sens. 2022, 14, 776. [Google Scholar] [CrossRef]
  23. Eweys, O.A.; Escorihuela, M.J.; Villar, J.M.; Er-Raki, S.; Amazirh, A.; Olivera, L.; Jarlan, L.; Khabba, S.; Merlin, O. Disaggregation of SMOS soil moisture to 100 m resolution using MODIS optical/thermal and Sentinel-1 radar data: Evaluation over a bare soil site in Morocco. Remote Sens. 2017, 9, 1155. [Google Scholar] [CrossRef]
  24. Wu, X.; Walker, J.P.; Rüdiger, C.; Panciera, R.; Gao, Y. Intercomparison of alternate soil moisture downscaling algorithms using active–passive microwave observations. IEEE Geosci. Remote Sens. Lett. 2016, 14, 179–183. [Google Scholar] [CrossRef]
  25. Weiß, T.; Jagdhuber, T.; Ramsauer, T.; Löw, A.; Marzahn, P. RTM-based downscaling of medium resolution soil moisture using Sentinel-1 data over agricultural fields. IEEE J. Sel. Top. Appl. Earth Obs. Remote Sens. 2024, 17, 15463–15479. [Google Scholar] [CrossRef]
  26. Xu, W.; Zhang, Z.; Long, Z.; Qin, Q. Downscaling SMAP soil moisture products with convolutional neural network. IEEE J. Sel. Top. Appl. Earth Obs. Remote Sens. 2021, 14, 4051–4062. [Google Scholar] [CrossRef]
  27. Liu, Y.; Jing, W.; Wang, Q.; Xia, X. Generating high-resolution daily soil moisture by using spatial downscaling techniques: A comparison of six machine learning algorithms. Adv. Water Resour. 2020, 141, 103601. [Google Scholar] [CrossRef]
  28. Mao, T.; Shangguan, W.; Li, Q.; Li, L.; Zhang, Y.; Huang, F.; Li, J.; Liu, W.; Zhang, R. A spatial downscaling method for remote sensing soil moisture based on random forest considering soil moisture memory and mass conservation. Remote Sens. 2022, 14, 3858. [Google Scholar] [CrossRef]
  29. Xu, Z.; Sun, H.; Gao, J.; Wang, Y.; Wu, D.; Zhang, T.; Xu, H. PhySoilNet: A deep learning downscaling model for microwave satellite soil moisture with physical rule constraint. Int. J. Appl. Earth Obs. Geoinf. 2024, 135, 104290. [Google Scholar] [CrossRef]
  30. Jin, Y.; Ge, Y.; Wang, J.; Chen, Y.; Heuvelink, G.B.; Atkinson, P.M. Downscaling AMSR-2 soil moisture data with geographically weighted area-to-area regression kriging. IEEE Trans. Geosci. Remote Sens. 2017, 56, 2362–2376. [Google Scholar] [CrossRef]
  31. Song, P.; Huang, J.; Mansaray, L.R. An improved surface soil moisture downscaling approach over cloudy areas based on geographically weighted regression. Agric. For. Meteorol. 2019, 275, 146–158. [Google Scholar] [CrossRef]
  32. Wen, F.; Zhao, W.; Wang, Q.; Sánchez, N. A value-consistent method for downscaling SMAP passive soil moisture with MODIS products using self-adaptive window. IEEE Trans. Geosci. Remote Sens. 2019, 58, 913–924. [Google Scholar] [CrossRef]
  33. Zhao, W.; Sánchez, N.; Lu, H.; Li, A. A spatial downscaling approach for the SMAP passive surface soil moisture product using random forest regression. J. Hydrol. 2018, 563, 1009–1024. [Google Scholar] [CrossRef]
  34. Wei, Z.; Meng, Y.; Zhang, W.; Peng, J.; Meng, L. Downscaling SMAP soil moisture estimation with gradient boosting decision tree regression over the Tibetan Plateau. Remote Sens. Environ. 2019, 225, 30–44. [Google Scholar] [CrossRef]
  35. Hu, F.; Wei, Z.; Zhang, W.; Dorjee, D.; Meng, L. A spatial downscaling method for SMAP soil moisture through visible and shortwave-infrared remote sensing data. J. Hydrol. 2020, 590, 125360. [Google Scholar] [CrossRef]
  36. Im, J.; Park, S.; Rhee, J.; Baik, J.; Choi, M. Downscaling of AMSR-E soil moisture with MODIS products using machine learning approaches. Environ. Earth Sci. 2016, 75, 1120. [Google Scholar] [CrossRef]
  37. Kim, S.; Jeong, J.; Zohaib, M.; Choi, M. Spatial disaggregation of ASCAT soil moisture under all sky condition using support vector machine. Stoch. Environ. Res. Risk Assess. 2018, 32, 3455–3473. [Google Scholar] [CrossRef]
  38. Jin, Y.; Ge, Y.; Liu, Y.; Chen, Y.; Zhang, H.; Heuvelink, G.B. A machine learning-based geostatistical downscaling method for coarse-resolution soil moisture products. IEEE J. Sel. Top. Appl. Earth Obs. Remote Sens. 2020, 14, 1025–1037. [Google Scholar] [CrossRef]
  39. Abbaszadeh, P.; Moradkhani, H.; Zhan, X. Downscaling SMAP radiometer soil moisture over the CONUS using an ensemble learning method. Water Resour. Res. 2019, 55, 324–344. [Google Scholar] [CrossRef]
  40. Lv, A.; Zhang, Z.; Zhu, H. A neural-network based spatial resolution downscaling method for soil moisture: Case study of qinghai province. Remote Sens. 2021, 13, 1583. [Google Scholar] [CrossRef]
  41. Wang, T.; Chen, G.; Zhang, X.; Liu, C.; Wang, J.; Tan, X.; Zhou, W.; He, C. LMFNet: Lightweight Multimodal Fusion Network for high-resolution remote sensing image segmentation. Pattern Recognit. 2025, 164, 111579. [Google Scholar] [CrossRef]
  42. Chakrabarti, S.; Judge, J.; Bongiovanni, T.; Rangarajan, A.; Ranka, S. Disaggregation of remotely sensed soil moisture in heterogeneous landscapes using holistic structure-based models. IEEE Trans. Geosci. Remote Sens. 2016, 54, 4629–4641. [Google Scholar] [CrossRef]
  43. Karamouz, M.; Alipour, R.S.; Roohinia, M.; Fereshtehpour, M. A remote sensing driven soil moisture estimator: Uncertain downscaling with geostatistically based use of ancillary data. Water Resour. Res. 2022, 58, e2022WR031946. [Google Scholar] [CrossRef]
  44. Entekhabi, D.; Njoku, E.G.; O’neill, P.E.; Kellogg, K.H.; Crow, W.T.; Edelstein, W.N.; Entin, J.K.; Goodman, S.D.; Jackson, T.J.; Johnson, J.; et al. The soil moisture active passive (SMAP) mission. Proc. IEEE 2010, 98, 704–716. [Google Scholar] [CrossRef]
  45. Claverie, M.; Ju, J.; Masek, J.G.; Dungan, J.L.; Vermote, E.F.; Roger, J.C.; Skakun, S.V.; Justice, C. The Harmonized Landsat and Sentinel-2 surface reflectance data set. Remote Sens. Environ. 2018, 219, 145–161. [Google Scholar] [CrossRef]
  46. Shiroma, G.H.; Fattahi, H.; Meyer, F.; Jeong, S.H.; Cinquini, L.; Collins, S.; Chapman, B.; Chan, S.K.; Handwerger, A.L.; Bekaert, D. The opera radiometric terrain corrected SAR backscatter from Sentinel-1 (RTC-S1) product. In Proceedings of the IGARSS 2023-2023 IEEE International Geoscience and Remote Sensing Symposium, Pasadena, CA, USA, 16–21 July 2023; IEEE: Piscataway, NJ, USA, 2023; pp. 880–883. [Google Scholar]
  47. Attema, E.; Ulaby, F.T. Vegetation modeled as a water cloud. Radio Sci. 1978, 13, 357–364. [Google Scholar] [CrossRef]
  48. Nasirzadehdizaji, R.; Balik Sanli, F.; Abdikan, S.; Cakir, Z.; Sekertekin, A.; Ustuner, M. Sensitivity analysis of multi-temporal Sentinel-1 SAR parameters to crop height and canopy coverage. Appl. Sci. 2019, 9, 655. [Google Scholar] [CrossRef]
  49. Wang, Z.; Zhao, T.; Shi, J.; Wang, H.; Ji, D.; Yao, P.; Zheng, J.; Zhao, X.; Xu, X. 1-km soil moisture retrieval using multi-temporal dual-channel SAR data from Sentinel-1 A/B satellites in a semi-arid watershed. Remote Sens. Environ. 2023, 284, 113334. [Google Scholar] [CrossRef]
  50. Bindlish, R.; Barros, A.P. Parameterization of vegetation backscatter in radar-based, soil moisture estimation. Remote Sens. Environ. 2001, 76, 130–137. [Google Scholar] [CrossRef]
  51. Zhu, X.; Chen, J.; Gao, F.; Chen, X.; Masek, J.G. An enhanced spatial and temporal adaptive reflectance fusion model for complex heterogeneous regions. Remote Sens. Environ. 2010, 114, 2610–2623. [Google Scholar] [CrossRef]
  52. Zhang, X.; Zhao, J.; Chen, G.; Wang, T.; Wang, Q.; Wang, K.; Miao, T. Spatio-Temporal Fusion of Landsat and MODIS Data for Monitoring of High-Intensity Fire Traces in Karst Landscapes: A Case Study in China. Remote Sens. 2025, 17, 1852. [Google Scholar] [CrossRef]
  53. Zanaga, D.; Van De Kerchove, R.; Daems, D.; De Keersmaecker, W.; Brockmann, C.; Kirches, G.; Wevers, J.; Cartus, O.; Santoro, M.; Fritz, S.; et al. ESA WorldCover 10 m 2021 v200. Zenodo 2022. [Google Scholar] [CrossRef]
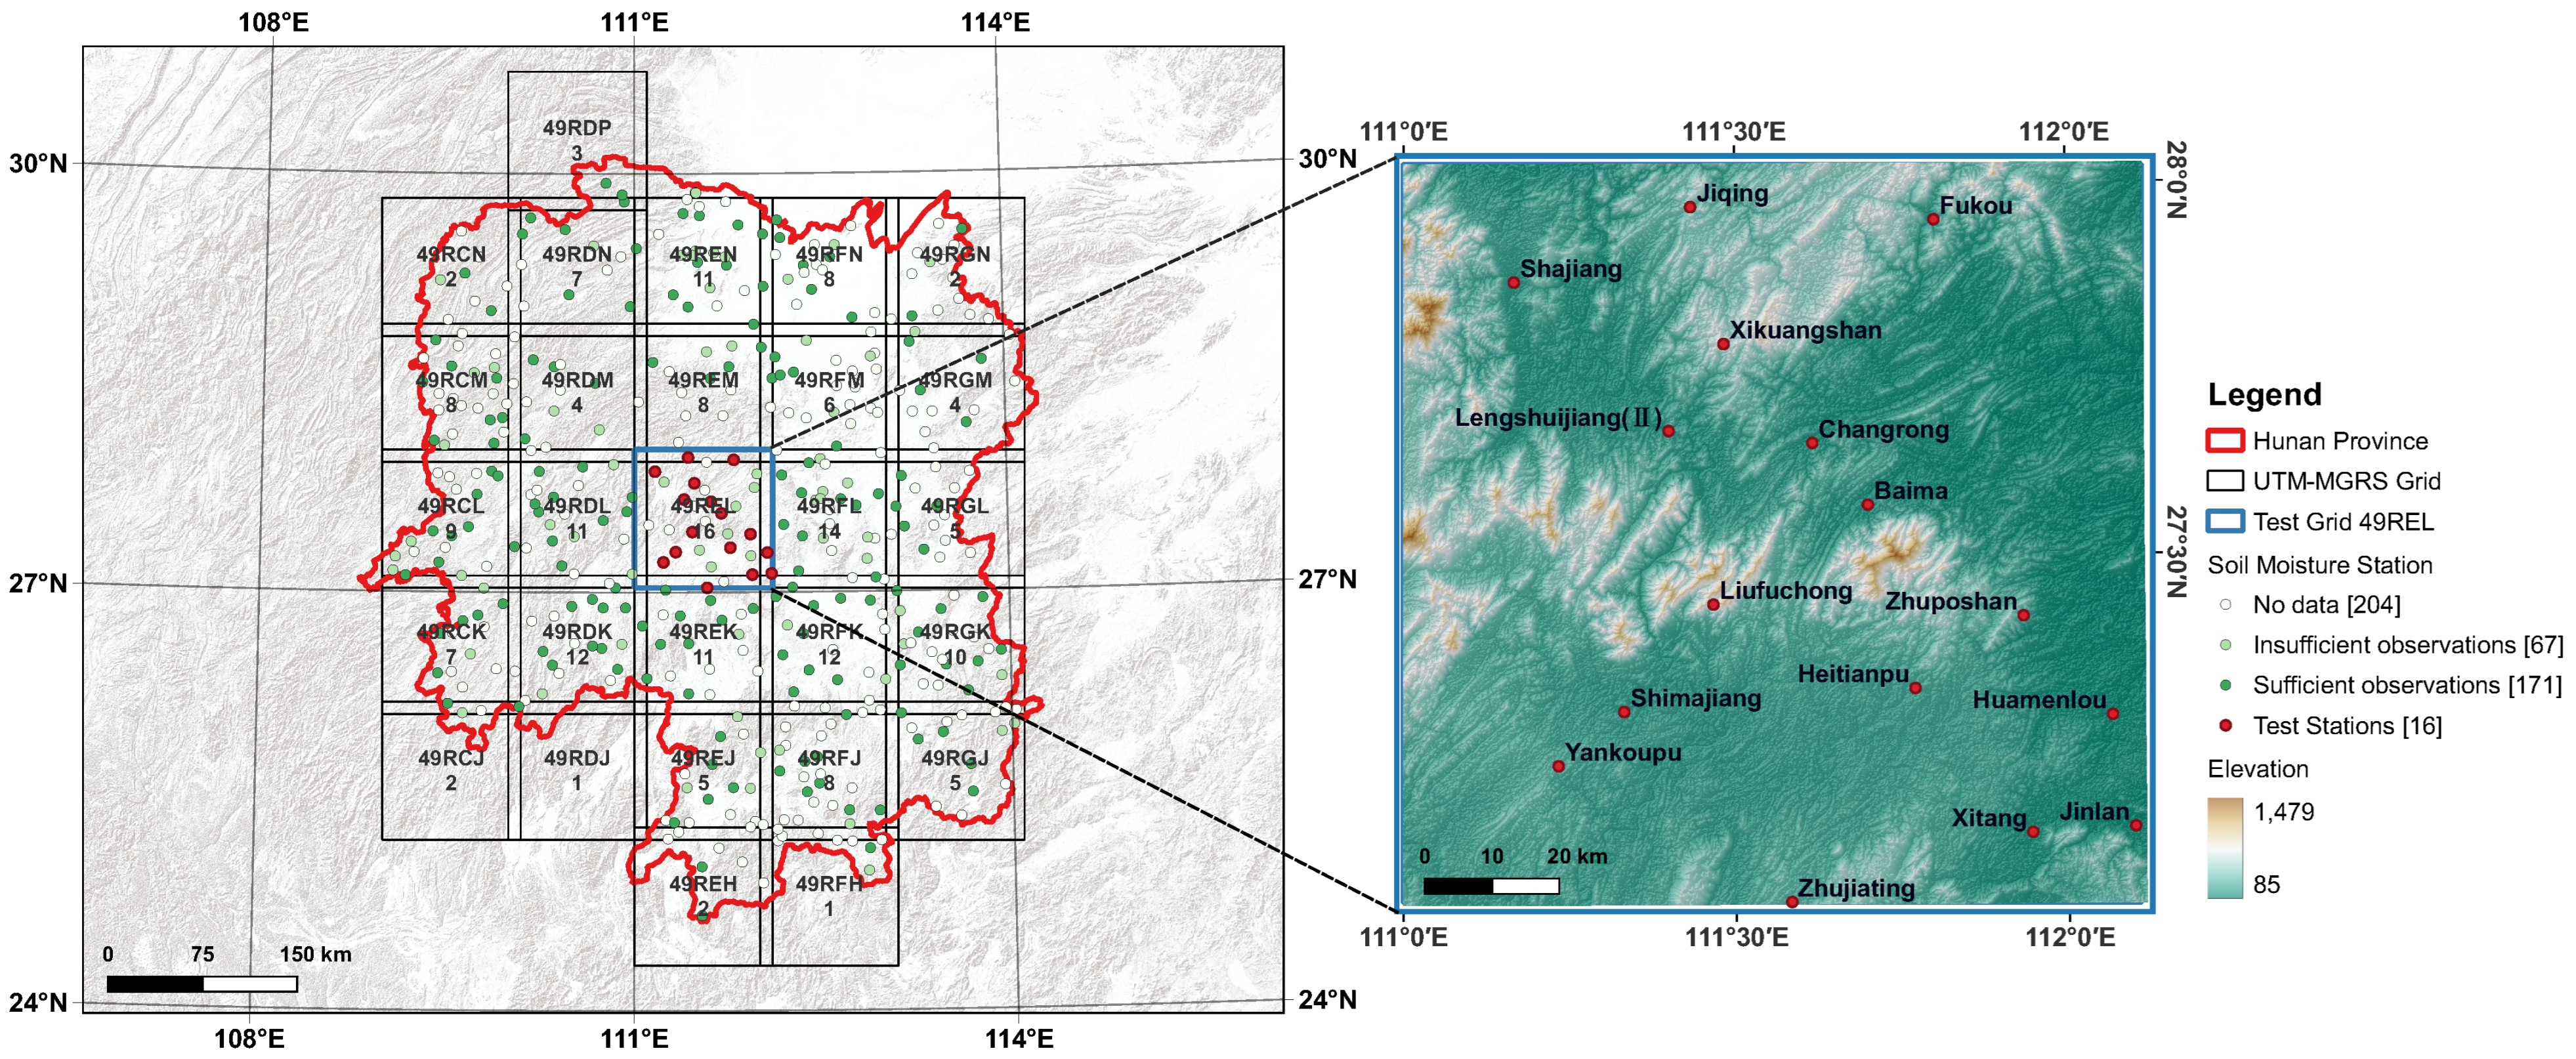
Figure 1. Study area location and soil moisture station distribution in Hunan Province, with UTM-MGRS grid 49REL highlighted as the test area.
Remotesensing 17 03677 g001
Figure 2. Multi-source data preprocessing workflow for UTM-MGRS grid-based analysis.
Remotesensing 17 03677 g002
Figure 3. Overview of the microwave–optical multi-stage synergistic downscaling framework (MMSDF).
Remotesensing 17 03677 g003
Figure 4. Comparison of 1 km daily soil moisture products with in situ observations (1 June–31 August 2024), where the red dashed line indicates the linear regression fit line.
Remotesensing 17 03677 g004
Figure 5. Scatter plots comparing framework configurations with in situ observations (1 June–31 August 2024), where the red dashed line indicates the linear regression fit line.
Remotesensing 17 03677 g005
Figure 6. Time series comparison of soil moisture products at representative validation stations.
Remotesensing 17 03677 g006
Figure 7. Spatial resolution progression: SMAP L4 (9 km), residual-corrected RF (1 km), and MMSDF output (30 m) for DOY 169, 207, 210, and 230 in 2024.
Remotesensing 17 03677 g007
Figure 8. Box plots of accuracy metrics by land cover class for the 16 validation stations, showing median values (central line), interquartile range (box), and full range (whiskers). Each color corresponds to a specific land cover category.
Remotesensing 17 03677 g008
Table 1. Site information for the 16 in situ stations in test area 49REL.
Station NameLocationElevation (m)R with SMAP L4
Jinlan(112.1000, 27.1333)1570.7403
Changrong(111.6167, 27.6500)1760.7609
Baima(111.7000, 27.5667)1860.7045
Huamenlou(112.0667, 27.2833)1220.8176
Zhuposhan(111.9333, 27.4167)2660.8359
Xitang(111.9455, 27.1257)1560.7779
Lengshuijiang (II)(111.4000, 27.6667)1870.6939
Heitianpu(111.7700, 27.3200)2750.7974
Zhujiating(111.5833, 27.0333)3430.7252
Liufuchong(111.4667, 27.4333)5290.7969
Yankoupu(111.2333, 27.2167)3440.8396
Xikuangshan(111.4833, 27.7833)5750.7568
Shajiang(111.1667, 27.8667)2130.7977
Shimajiang(111.3319, 27.2894)2120.8215
Jiqing(111.4336, 27.9675)3900.7389
Fukou(111.8015, 27.9496)3360.3638
Table 2. Multi-source remote sensing and auxiliary datasets used in this study.
Data TypeData ProductTime RangeSpatial Res.Temporal Res.LatencyEffective Period
Soil MoistureSPL4SMGP2015–present9 km3 h1.5 d2-3 d
Medium-res. N-BRDFHLS L302013–present30 m8 d1.7 d10 d
HLS S302015–present30 m5 d1.7 d7 d
Low-res. N-BRDFMCD43A42000–present500 m1 d12 d13 d
SARRTC-S12013–present30 m12 d3 d15 d
LSTMOD11A12000–present1 km1 d5 d6 d
PrecipitationGPM IMERGDL1998–present0.1°1 d2 d3 d
TerrainNASADEM30 m
Table 3. Accuracy assessment of 1 km downscaled soil moisture products from Stage 1.
ConfigurationRBiasMAERMSEubRMSE
SMAP L40.340.0950.0950.1110.057
SMAP L 4 resampled 1 km 0.380.0960.0960.1110.055
RF 1 km , uncorrected 0.530.1120.1120.1220.048
RF 1 km , with corrected 0.440.1060.1060.1190.054
Table 4. Station-wise accuracy evaluation against 16 in situ stations (1 June–31 August 2024).
Station NameRBiasMAERMSEubRMSE
Jinlan0.60300.00780.02000.02980.0288
Changrong0.71130.02940.05030.06090.0533
Baima0.65640.07330.08820.11040.0826
Huamenlou0.66080.19350.19350.20110.0550
Zhuposhan0.79000.05930.05930.06370.0232
Xitang0.70250.11030.11030.11390.0284
Lengshuijiang (II)0.51420.05510.05920.06960.0426
Heitianpu0.75110.07740.07740.08430.0333
Zhujiating0.63860.02790.03020.03690.0241
Liufuchong0.74300.00610.02630.03070.0301
Yankoupu0.68470.01430.02010.02380.0191
Xikuangshan0.72850.06910.06990.08290.0458
Shajiang0.52980.10260.10390.11820.0587
Shimajiang0.82070.00640.01510.01870.0176
Jiqing0.64100.08170.08170.08460.0221
Fukou0.24740.01470.05740.06280.0611
Table 5. Component analysis through ablation studies across framework configurations.
CaseConfigurationIn SituRBiasMAERMSEubRMSE
(a)SMAP L4×0.340.0950.0950.1110.057
(b) MMSDF proposed ×0.540.0360.0450.0580.046
(c) MMSDF uncorrected ×0.490.0060.0380.0470.047
(d) MMSDF with _ insitu 0.53 0.050 0.0600.0690.047
Table 6. Accuracy metrics (median ± IQR) by land-cover class for the 16 validation stations.
Land Cover ClassNumber of In SituRBiasMAERMSEubRMSE
Built-up40.694 ± 0.0420.053 ± 0.0610.054 ± 0.0580.061 ± 0.0580.026 ± 0.007
Tree cover50.656 ± 0.2290.055 ± 0.0450.059 ± 0.0020.064 ± 0.0070.043 ± 0.031
Grassland40.686 ± 0.0690.049 ± 0.0760.060 ± 0.0580.072 ± 0.0590.050 ± 0.012
Cropland30.641 ± 0.1450.082 ± 0.0480.082 ± 0.0440.085 ± 0.0500.022 ± 0.021
Disclaimer/Publisher’s Note: The statements, opinions and data contained in all publications are solely those of the individual author(s) and contributor(s) and not of MDPI and/or the editor(s). MDPI and/or the editor(s) disclaim responsibility for any injury to people or property resulting from any ideas, methods, instructions or products referred to in the content.