Highlights
What are the main findings?
- UEBNet, a novel instance segmentation model integrating DSCBAM, MFT, and AMSI modules, improves the accuracy of damaged building extraction from UAV imagery in complex post-earthquake scenarios.
- The model was rigorously validated using UAV data from the 2025 Tingri and 2023 Jishishan earthquakes, demonstrating superior performance and robustness against background clutter, scale variation, and irregular damage contours.
What is the implication of the main finding?
- Provides a reliable, high-precision deep learning solution for rapid post-earthquake building damage assessment, supporting efficient emergency response and disaster relief decision-making.
- Offers a scalable architectural framework and module design philosophy applicable to other complex remote sensing instance segmentation tasks beyond seismic damage evaluation.
Abstract
Unmanned aerial vehicle (UAV) remote sensing is critical in assessing post-earthquake building damage. However, intelligent disaster assessment via remote sensing faces formidable challenges from complex backgrounds, substantial scale variations in targets, and diverse spatial disaster dynamics. To address these issues, we propose UEBNet, a high-precision post-earthquake building instance segmentation model that systematically enhances damage recognition by integrating three key modules. Firstly, the Depthwise Separable Convolutional Block Attention Module suppresses background noise that visually resembles damaged structures. This is achieved by expanding the receptive field using multi-scale pooling and dilated convolutions. Secondly, the Multi-feature Fusion Module generates scale-robust feature representations for damaged buildings with significant size differences by processing feature streams from different receptive fields in parallel. Finally, the Adaptive Multi-Scale Interaction Module accurately reconstructs the irregular contours of damaged buildings through an advanced feature alignment mechanism. Extensive experiments were conducted using UAV imagery collected after the Ms 6.8 earthquake in Tingri County, Tibet Autonomous Region, China, on 7 January 2025, and the Ms 6.2 earthquake in Jishishan County, Gansu Province, China, on 18 December 2023. Results indicate that UEBNet enhances segmentation mean Average Precision () and bounding box mean Average Precision () by 3.09% and 2.20%, respectively, with equivalent improvements of 2.65% in F1-score and 1.54% in overall accuracy, outperforming state-of-the-art instance segmentation models. These results demonstrate the effectiveness and reliability of UEBNet in accurately segmenting earthquake-damaged buildings in complex post-disaster scenarios, offering valuable support for emergency response and disaster relief.
1. Introduction
Earthquake-induced building damage is the primary cause of economic losses and casualties [1]. The swift and accurate assessment of building damage post-earthquake is essential for emergency response and post-disaster reconstruction [2,3]. Due to the harsh post-earthquake disaster site environment, limited communication capabilities, and complex transportation conditions, traditional field survey methods used to map building damage areas are dangerous, inefficient, and costly. The advancement of high-resolution remote sensing technology has led to a growing utilisation of remote sensing imagery in seismic disaster assessment [4,5]. UAV remote sensing technology provides benefits such as high resolution, cheap cost, and enhanced mobility, attracting growing interest from researchers in disaster information collection and earthquake damage assessment [6,7,8,9,10,11,12].
Methods for extracting building information from post-earthquake drone imagery generally include visual interpretation, machine learning, and deep learning. The swift advancement of deep learning in computing has rendered deep learning-based remote sensing image information extraction a focal point of research and a prospective trend among experts [13,14,15]. For example, networks such as Mask R-CNN [16], U-Net [17], and Mask2Former [18] have been used by researchers to extract building damage data from post-earthquake UAV images autonomously. Duarte et al. [19] integrated three photos of varying resolutions into a CNN for the classification of building damage. This model is limited to classifying damaged buildings from images and cannot locate individual damaged targets. Xiong et al. [20] proposed a building picture segmentation approach utilising a 3D building model as a georeference, employing a CNN model based on VGGNet to enhance the accuracy of earthquake damage assessment for structures. In a case study of the old Beichuan town following the 2008 Wenchuan Ms 8.0 earthquake, the method achieved an 89.39% damage identification accuracy. Khankehizadeh et al. [21] proposed a new WETUM method for producing reliable building damage maps, attaining a Damage Detection Rate of 78.26% through the integration of spectral and geometric information. This method holds significant potential and application value for building damage detection in newly emerging earthquake-affected areas. Nonetheless, current object detection techniques are limited to providing bounding boxes for damaged structures [22] and are incapable of delineating their intricate features. To obtain fine-grained contours, Gomroki et al. [23] proposed an encoder–decoder semantic segmentation network based on post-earthquake remote sensing images to extract target contours. This method was experimentally validated on three satellite image datasets from the 2023 Turkey earthquake, the 2023 Morocco earthquake, and the 2023 Libya flood, all of which yielded good results. Xie et al. [10] designed a local–global context attention module and a feature fusion module utilising self-attention based on the U-Net network. When validated on remote sensing data of building damage from the 2010 Haiti earthquake, the IoU increased by 7.39%.
Due to the strong randomness and spatial heterogeneity of building damage in drone imagery [24], traditional semantic segmentation methods often struggle to maintain consistency in building instances, potentially dividing the same building into multiple damage categories, leading to inaccurate identification of individual building boundaries. As a result, recent research on post-earthquake building extraction has increasingly shifted towards instance segmentation methods [25,26] to improve boundary precision and category accuracy. Zhan et al. [27] improved the classic Mask R-CNN [16] to extract post-disaster damaged buildings. This method classifies damaged buildings into four categories: undamaged, slightly damaged, severely damaged, and collapsed. It achieves an accuracy rate of 92% in identifying severely damaged buildings, with an overall classification accuracy rate of roughly 88% across the four damage categories. However, as image resolution increases, training complexity grows exponentially. To mitigate computational overhead in building instance segmentation for high-resolution remote sensing images, Shen et al. [28] proposed DCT-Mask based on Mask R-CNN. This network uses a 300-dimensional Discrete Cosine Transform (DCT) vector to represent a 128 × 128 mask, achieving significant performance improvements. Nevertheless, each pixel value in the mask is determined by the entire DCT vector, and modifying part of the vector affects the global structure, potentially disrupting correctly segmented regions. To weaken this global coupling and further optimise segmentation boundaries, Wen et al. [29] proposed PatchDCT. This method disaggregates the mask derived from the DCT vector into several patches and enhances each patch utilising a specified classifier and regressor. The classifier identifies mixed, foreground, and background patches, and can rectify misclassified foreground and background patches from the initial DCT approach. Conversely, the regressor facilitates DCT vector prediction for mixed patches, hence enhancing the segmentation quality of boundary points. However, the aforementioned methods lack a targeted multi-scale feature fusion mechanism, leading to coarse boundaries during decoding and a significant performance decline in the extremely complex post-earthquake scenario.
For complex, unstructured post-earthquake scenarios characterised by irregular building boundaries and low visual distinction between rubble, debris, and damaged structures, we propose UEBNet, a novel instance segmentation framework with three key contributions:
- (1)
- At the feature encoding stage, a Depthwise Separable Convolutional Block Attention Module (DSCBAM) is designed to enhance the ability of the top-level features of the feature pyramid network (FPN) to represent key regions. This module combines multi-scale pooling with depthwise separable dilated convolutions to improve multi-scale semantic modelling capabilities, expand the receptive field, and fundamentally suppress strong background noise interference from bare fields, garbage piles, etc., thereby addressing the challenge of ‘accurate perception’ in post-earthquake scenes.
- (2)
- In the feature fusion layer, the Multi-feature Fusion Module (MFT) is constructed to fuse semantic features from different levels, enhancing the model’s perception of buildings with significant scale differences and incomplete shapes. This module ensures feature consistency and expressiveness, particularly excelling in boundary localization of small objects or damaged areas.
- (3)
- At the decoding and output end, the Adaptive Multi-Scale Interaction Module (AMSI) is innovatively developed. This module addresses the common issue of coarse mask semantic bias in existing methods through unique spatial decomposition, cross-attention, and selective fusion mechanisms. It precisely aligns and reinforces decoded features, enabling the perfect capture of the complete contours of irregular buildings.
2. Study Area and Dataset
2.1. Study Area
According to the China Earthquake Networks Center, an earthquake occurred at 9:05 a.m. Beijing Time on 7 January 2025, at Tingri County, Shigatse City, Tibet Autonomous Region, China (28.50°N, 87.45°E). The earthquake had a magnitude of Ms 6.8 and a focal depth of 10 km, making it the largest earthquake in the region in the past five years. The maximum intensity of this earthquake was IX, covering a region of 411 km2. The area with an intensity above VI covered approximately 23,986 km2 [30]. The earthquake resulted in 126 fatalities and affected 61,500 people.
In the rural areas near the epicentre, the majority of buildings were self-built houses. Constrained by local conditions and traditional living customs, these houses were typically constructed using locally sourced materials, predominantly wood-framed with mud brick or stone infill. They lacked systematic seismic design, often featuring irrational structural systems, which led to poor seismic performance [31]. In the seismic intensity zones IX and VIII, the proportions of earth-wood houses with poor seismic resistance were 97% and 88%, respectively. The overall collapse rate in intensity zone IX exceeded 60%. Consequently, the damage to housing was extremely severe. According to statistics, a total of 27,248 houses were damaged, of which 3612 collapsed [32]. Figure 1 depicts the location of the study region used in this paper.
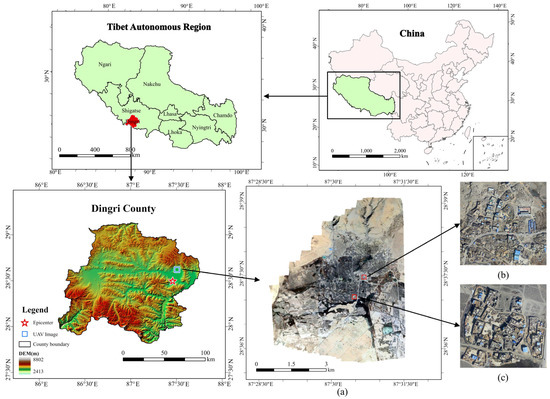
Figure 1.
The study area and post-earthquake UAV orthophotos of the Tingri earthquake. (a) UAV image. (b) Chajiang village. (c) Tonglai village.
In the study area, we used a Feima UAV (Feima Robotics, Shenzhen, China) equipped with a SONY ILCE-7RM4A camera (Sony Group Corporation, Tokyo, Japan), which has a focal length of 20 mm. The images of the area near Changsuo Township in Tingri County were acquired on 20 January 2025, from a flight altitude of 500 m. Following processing, a UAV orthoimage with a resolution of 5 cm was produced (as shown in Figure 1a). The red box in Figure 1a indicates the region cropped for model inference to test the model’s applicability, which includes Chajiang Village (Figure 1b) and Tonglai Village (Figure 1c). The remaining areas were used for model training, validation, and evaluation.
2.2. Post-Earthquake Buildings Dataset
To construct the instance segmentation dataset, this study used the professional software ArcGIS Pro (v3.0) to manually annotate the location and outlines of post-earthquake buildings. To ensure dataset quality, the UAV images were segmented into 640 × 640 pixel, four-band patches. As many of these images contained only background and no foreground information, they could not be considered valid samples and were therefore discarded. Finally, the annotated samples were converted into the COCO dataset format.
In total, we annotated 790 images, comprising 1929 damaged buildings and 199 intact buildings. Due to the significant difference in sample sizes between classes, focal loss was adopted in the model to balance the categories. Considering the small scale of the dataset, we employed K-fold cross-validation [33,34]. The training set consisted of 553 images, the validation set included 158 images, and the test set contained 79 images. Detailed information about the post-earthquake building dataset is provided in Table 1. Figure 2 shows sample instances from the dataset.

Table 1.
Specifications of the sub-datasets employed for training, validating, and testing.
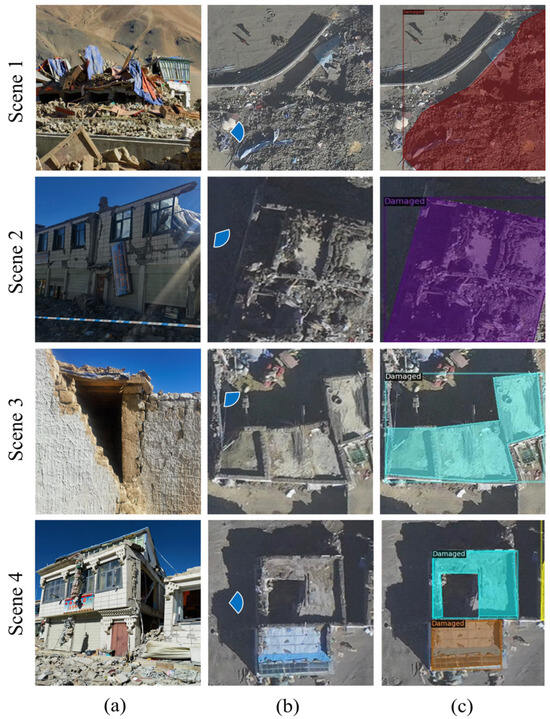
Figure 2.
Example of Tingri earthquake data samples: (a) field survey photos; (b) UAV images, where the observation location’s viewing angle is indicated by blue fan shapes; (c) sample labels, with different mask colours representing different instances.
3. Methodology
3.1. Overview of UEBNet
As shown in Figure 3, the overall framework of UEBNet consists of three core components: a backbone network, an enhanced feature pyramid neck, and a prediction regression head that incorporates multi-scale feature fusion.
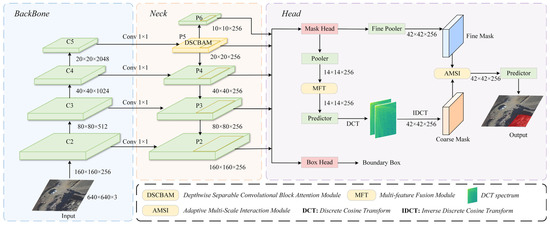
Figure 3.
The overall framework of UEBNet. C2–C5 and P2–P6 represent multi-level feature maps.
The input image is first fed into a standard ResNet backbone network for basic feature extraction, and then enters the FPN that has been specifically enhanced to handle post-earthquake scenes. At the top layer of the FPN, we embed the DSCBAM to suppress background noise and enhance key semantic information at an early stage.
Then, the multi-level feature maps generated by the FPN are used for the Region Proposal Network (RPN). For each Region of Interest (RoI), the model not only extracts its corresponding features but also processes them using the MFT. The MFT generates a fusion feature that is more robust to changes in object size by parallel processing multiple scale versions of the feature.
Next, the fused features are fed into the mask regression branch. This branch employs a coarse-to-fine prediction strategy. First, the features output by MFT are subjected to DCT transformation, and the inverse transformation of the first 300 DCT vectors is taken to obtain a coarse-grained global mask. To address the semantic bias issues arising from the direct fusion of coarse- and fine-grained features, we introduce the AMSI. Unlike traditional methods that rely on simple element-wise addition, the AMSI module cross-attention and selectively fuses coarse-grained mask information with high-resolution features from the FPN lower layers, thereby refining the mask.
Finally, the classifier and regressor of PatchDCT are used to predict the mask. Through this series of carefully designed modular components, UEBNet ensures that effective information is maximally retained and utilised at every stage of feature extraction, fusion, and final prediction, thereby achieving high-precision segmentation of irregular, multi-scale architectural targets.
3.2. Depthwise Separable Convolutional Block Attention Module
One of the challenges in disaster remote sensing assessment is how to separate effective target information from visually confusing backgrounds. Especially in post-earthquake scenarios, the features of damaged buildings are often overwhelmed by high-frequency noise such as debris, dust, and exposed ground surfaces. To enhance the model’s capacity to discern features in such complex interference, we present the Convolutional Block Attention Module (CBAM) [35], whose structure is shown in Figure 4a. CBAM learns ‘what to focus on’ and ‘where to look’ through serialised channel and spatial attention mechanisms, suppressing interference from irrelevant information. However, while improving accuracy, disaster response also imposes strict requirements on processing speed. The computational overhead of standard CBAM makes it difficult to achieve both. Therefore, we designed a lightweight DSCBAM at the top-level features of FPN. This module replaces ordinary convolutions with computationally cheaper depthwise separable convolutions, reducing the model’s parameter count and computational load while preserving feature extraction capabilities to meet the demand for rapid and precise post-disaster assessment.
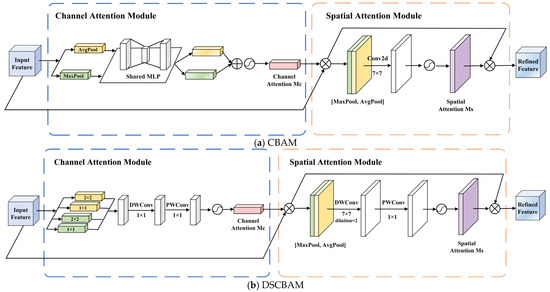
Figure 4.
Comparison of network structures between CBAM and DSCBAM.
The DSCBAM module structure is shown in Figure 4b, which includes a Channel Attention and a Spatial Attention. The channel attention module aims to model the interdependencies between channels in feature maps, automatically assigning weights to enhance focus on key features relevant to the current task. To capture richer contextual information, this module employs adaptive pooling operations, including 1 × 1 and 2 × 2 adaptive average pooling and max pooling, and fuses the resulting features. To further improve efficiency, the module replaces the traditional multi-layer perceptron (MLP) with a depthwise separable one-dimensional convolution structure, significantly reducing computational complexity. As shown in Figure 5, the depthwise separable convolution [36] first performs depthwise convolution on the input features to extract local features within each channel, then uses pointwise convolution (1 × 1) to facilitate information exchange between channels. This structure not only simulates the nonlinear transformation and feature fusion functions of the MLP but also markedly decreases the parameter count and computational complexity. After pooling, the feature vectors are reduced in dimension and fused through a linear adapter to generate a 256-dimensional feature vector. The ultimate channel attention weights are derived utilising the sigmoid activation function, and thereafter employed to reconfigure the original feature map.
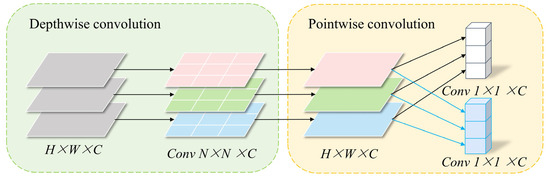
Figure 5.
Depthwise separable convolution.
Following channel attention optimisation, the feature maps proceed to the spatial attention module, which is designed to produce a spatial attention map that amplifies the feature response in critical areas. The spatial attention module initially executes global average pooling and max pooling across the channel dimension, subsequently concatenating the two resultant two-dimensional feature maps to create an effective spatial feature descriptor. Unlike traditional convolutions, we employ dilated depthwise separable convolutions, which consist of a 7 × 7 kernel, a depthwise convolution with a dilation rate of (2, 2) [37], and a 1 × 1 pointwise convolution. Dilated convolutions efficiently enlarge the receptive field without augmenting computing demands, allowing the model to acquire more extensive spatial contextual information. The spatial attention map produced by the sigmoid activation function is multiplied element-wise with the input feature map, optimising the feature distribution in the spatial dimension and further augmenting the model’s emphasis on critical locations.
3.3. Multi-Feature Fusion Module
The damage patterns of buildings after an earthquake exhibit characteristics of coexisting multiple scales, with the extent of damage varying randomly across buildings of different sizes. The mask head, which uses a single fixed-resolution RoI feature, cannot effectively perceive targets of different scales simultaneously. A receptive field optimised for large-scale debris scenes may overlook details of small-scale earthquake-damaged buildings, and vice versa. This inherent scale limitation results in incomplete semantic representation and reduced localisation accuracy along object boundaries.
To address this issue in post-disaster scenarios, we introduce a lightweight and effective MFT module aimed at enhancing feature quality prior to mask decoding. The MFT module is positioned after the RoIAlign operation as a refinement stage, integrating multi-scale contextual information. Unlike modules that rely on single-scale features, the MFT module simultaneously processes three feature maps obtained by upsampling and downsampling the original RoI-aligned features.
The structure of the MFT module is shown in Figure 6. Specifically, we first upscale the input features (w × h) to a higher spatial resolution (2w × 2h) via bilinear interpolation, while downsampling them by a factor of 0.5 to obtain a low-resolution version (0.5 w × 0.5 h). The three features of different scales undergo independent nonlinear transformations. The high spatial resolution branch employs max pooling and average pooling to compress feature maps spatially, thereby aggregating global information. Subsequently, to avoid the computational burden of large convolutional kernels, we utilise 1 × 1 convolutions to efficiently facilitate inter-channel feature interaction and dimensionality reduction. The remaining two branches both employ 3 × 3 convolutions to extract local spatial features.
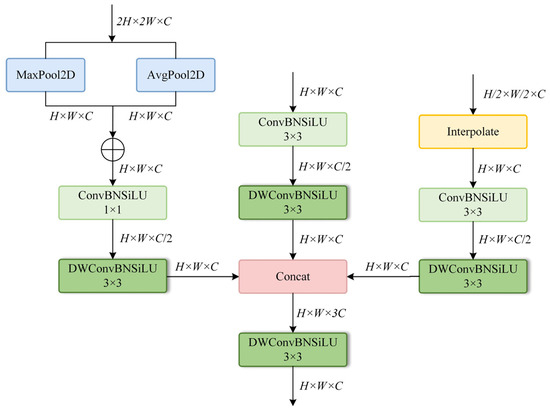
Figure 6.
Structure of the MFT module.
To balance feature extraction effectiveness with computational efficiency, each branch internally employs a lightweight depthwise separable convolution. It consists of a 3 × 3 depthwise convolution (groups = 128) and a 1 × 1 pointwise convolution, with the depthwise convolution responsible for spatial modelling and the pointwise convolution for channel recovery. After scale normalisation, all three feature maps are concatenated along the channel dimension to form an aggregated feature map with 768 channels (256 × 3). This aggregated feature map consolidates feature information from different processing paths, offering richer diversity. Finally, the aggregated feature map is fed into an output convolution layer, which consists of a depth-separable convolution, batch normalisation, and a SiLU activation function. Its primary function is to efficiently interact and fuse the multi-source features after concatenation and reduce the channel dimension back to 256. This step not only achieves effective feature integration but also ensures that the feature dimension of the module output matches that of subsequent network layers. This design fuses multi-scale information in a lightweight and modular manner, enabling the network to extract features with higher discriminative power and shape awareness, improving the performance of subsequent instance mask prediction tasks.
3.4. Adaptive Multi-Scale Interaction Module
Accurately delineating the contours of damaged buildings after an earthquake is another challenge in instance segmentation for post-disaster remote sensing assessment. Unlike the clear object boundaries in conventional scenes, the edges of collapsed buildings are structurally chaotic and disordered. In such cases, although UEBNet employs an iterative refinement strategy from coarse to fine to generate masks, the key to determining the final segmentation accuracy lies in how to effectively fuse the initial coarse-grained mask with the fine-grained features from the backbone network. Simple element-wise addition fusion ignores the semantic differences between the two types of features: coarse-grained features emphasise global structure, while fine-grained features emphasise local texture. This may lead to poor feature interaction when handling complex object boundaries or partially collapsed buildings.
To address this issue, we designed an AMSI module to replace simple additive fusion with a more expressive interaction mechanism. Unlike methods that rely on actual frequency transformations, AMSI simulates multi-scale feature responses by applying convolutional kernels with different receptive fields. Specifically, as shown in Figure 7a, the Spatial Convolution Module (SCM) decomposes fine-grained feature maps into two parallel branches: one branch uses small convolutional kernels to emphasise local textures, while the other branch uses dilated convolutions to capture broader semantic context. Although no explicit frequency transformation is performed, this decomposition simulates the behaviour of high-frequency and low-frequency responses in the spatial domain. Concurrently, lightweight 1 × 1 convolutions convert the coarse-grained mask features obtained via DCT into query embeddings. Two cross-attention branches are then applied, enabling the coarse-grained features to query the two fine-grained branches, thereby achieving adaptive alignment between structure and detail. Finally, the Selective Feature Fusion (SFF) module dynamically merges the two attention outputs based on learned spatial attention weights. The fused features are added back to the fine-grained features via residual connections and passed to the downstream prediction layer. The SFF module structure is shown in Figure 7b. The AMSI module design achieves content-aware multi-level fusion, respecting the complementarity between structure and detail, enhancing the model’s ability to analyse irregular boundaries and maintain semantic consistency, particularly in complex post-disaster scenarios.
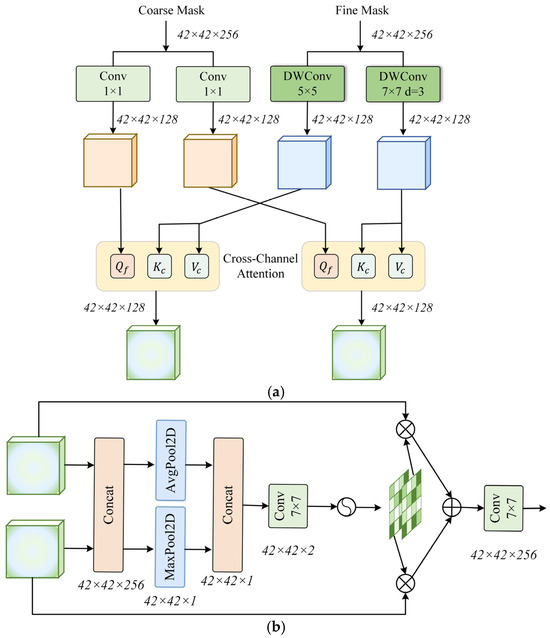
Figure 7.
Structure of the AMSI module: (a) SCM module; (b) SFF module.
3.5. Loss Function
The total loss function used in our framework consists of four components: a focal loss for bounding box classification, a coarse DCT regression loss over the entire mask, a patch-wise classification loss, and a patch-wise DCT regression loss for mixed patches. The specific calculation process is shown in Equations (1)–(4) below.
The overall objective is defined as:
where and are scalar weights, both of which are 0.5 in this article.
The focal loss [38] is used to alleviate class imbalance in building classification and is defined as:
where [0, 1] is the predicted probability for the ground-truth class, is the focusing parameter (we set ), and is the class balancing factor (set to 0.25).
The coarse DCT [28] loss measures the difference between predicted and ground-truth DCT vectors of the full-resolution mask:
where and denote the i-th element of predicted and ground-truth DCT vectors, respectively. N is the vector length, and R is a regression function.
The patch classification loss is a cross-entropy loss [39] over three categories. The patch-wise DCT regression loss [29] is applied only to patches classified as mixed:
where and are the predicted and ground-truth DCT vectors of the i-th mixed patch, and is the total number of mixed patches.
4. Experimental Results and Discussion
4.1. Experimental Configuration
Our model is built using the PyTorch (v1.12.1) framework. The hardware configuration for this experiment is a PC with an Nvidia GeForce RTX 2080 Ti GPU (32 GB), Intel Core i7 CPU, and Ubuntu 18.04. We use the standard partition of training and validation sets in both datasets. Images are cropped to a size of 640 × 640 for training. In the training phase, the random flip is used for data augmentation.
If not specified, we employ ResNet50 with pre-trained weights as the default backbone. The model training process employs an initial learning rate of 0.0005, a batch size of 2, and a total of 120 epochs, optimized using the Adam optimizer.
4.2. Evaluation Metrics
Quantitative evaluation measures are necessary to assess the model’s performance. In this study, mean Average Precision (mAP) and F1-score are adopted to comprehensively evaluate the detection and segmentation performance of the model. The evaluation metrics can be formulated as follows:
Here, TP and FP represent the true positive and false positive [40], respectively, while TN and FN denote the true negative and false negative. P and R represent Precision and Recall, respectively. The F1-score is the harmonic mean of Precision and Recall. Overall Accuracy (OA) measures the proportion of correctly predicted samples out of the total number of samples. Average Precision (AP) describes the model’s prediction performance based on Precision and Recall. At a given Intersection over Union (IoU), when Recall is plotted on the horizontal axis and Precision on the vertical axis, a PR curve is obtained. The value of corresponds to the area under the PR curve.
mAP is the average across 10 IoU thresholds, ranging from 0.50 to 0.95 with a step size of 0.05, and can be calculated using Equation (11):
Furthermore, we employ frames per second (FPS) to assess the recognition efficacy of various approaches. The equation is as follows, with T denoting the duration required by the model to infer a single image:
4.3. Quantitative Comparisons with SOTA
To validate the effectiveness and advanced nature of UEBNet for post-earthquake building instance segmentation, we compared it with several state-of-the-art (SOTA) instance segmentation methods. All experiments were conducted using the Tingri post-earthquake building dataset. The methods for comparison included Mask R-CNN [16], DCT-Mask [28], YOLOv8 [41], PointRend [42], YOLACT [43], SOLOv2 [44], PatchDCT [29], Mask2Former [18]. For all models, the backbone network was ResNet50 with pre-trained weights.
The quantitative results, as shown in Table 2, clearly indicate that UEBNet surpasses existing state-of-the-art (SOTA) models across all key evaluation metrics. Specifically, UEBNet realised a segmentation mean Average Precision () of 42.26%, an improvement of 3.09% over PatchDCT. Furthermore, its F1-score and Overall Accuracy (OA) reached 78.74% and 94.15%, respectively, demonstrating effective classification performance. Its superior performance stems from the model’s ability to enhance key features and fuse multi-scale features within complex post-disaster scenes.
Table 2.
Quantitative results for all models of instance masks. Best results are shown in boldface.
We also conducted a qualitative comparison on the validation set between the DCT-Mask, PointRend, PatchDCT, and UEBNet models to visually demonstrate their recognition performance on post-earthquake buildings. The visualisation results are shown in Figure 8 and include the following representative scenarios: completely collapsed buildings with irregular boundaries; a single damaged building; multiple damaged buildings; and a scene with intact buildings.
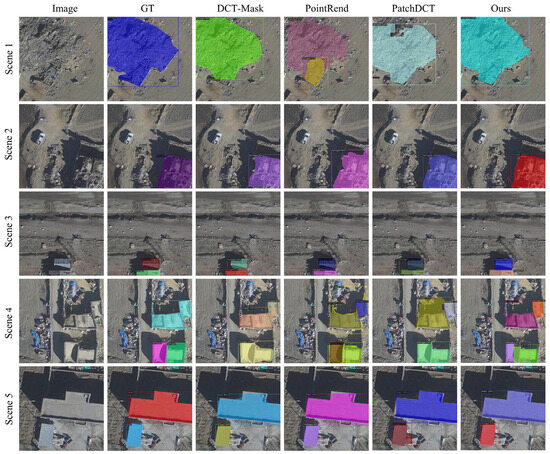
Figure 8.
Examples of instance segmentation results from different models on the Tingri earthquake dataset.
All four models were able to accurately locate post-earthquake buildings, but they varied in the precision of their segmentation boundaries and their adaptability to complex scenes. DCT-Mask and PointRend showed poor segmentation capability for multiple buildings, failing to distinguish well between adjacent structures in Scene 4. This exposes their deficiencies in global context awareness and in modelling relationships between instances. Although PointRend uses iterative refinement for points with high uncertainty, its sampling strategy may not effectively decouple the boundaries of different instances in dense regions. Meanwhile, DCT-Mask, which applies global DCT encoding to the entire instance, struggles to handle the fine gaps between instances. PatchDCT was unable to effectively fuse fine and coarse features, resulting in very poor recognition of damaged building boundaries, especially for the ruins of completely collapsed buildings, with obvious omissions seen in Scene 1.
In contrast, the UEBNet model performed well in localising the boundaries of both damaged and intact buildings. This is due to the synergy between the DSCBAM and AMSI modules. The DSCBAM module uses dilated convolutions to capture a wider area around the target, providing more comprehensive context. Simultaneously, its attention mechanism enables the model to focus on the target region, fundamentally reducing interference from background noise. The AMSI module employs a cross-attention mechanism where coarse structural features actively query fine-grained texture features, aligning structure with detail to precisely reconstruct the irregular contours of collapsed buildings. For example, in Scene 1, where the Ground Truth (GT) indicates that the collapsed building has an extremely complex shape and is similar in color to the bare ground, UEBNet achieved more continuous and precise boundaries. Furthermore, UEBNet also excelled in multi-object recognition and in identifying targets of different sizes. This is because the MFT module creates three parallel streams to process different scales, improving the model’s robustness to size variations. In synergy, UEBNet’s three innovative modules work to resolve the inherent limitations of traditional methods in complex post-earthquake scenarios.
4.4. Ablation Experimental
To systematically analyse the independent contributions of the three core components within UEBNet, we designed four five sets of ablation studies. By strategically disabling specific functional modules within the complete framework, we were able to quantify the key roles played by DSCBAM, MFT, and AMSI in the post-earthquake building recognition task. Moreover, we have specifically compared the CBAM module with the enhanced DSCBAM module to demonstrate the efficacy and necessity of our improvements. The experimental configurations and results are shown in Table 3, where ‘DS’ refers to the DSCBAM module, is the segmentation precision for the Damaged class, and is the segmentation precision for the Intact class. The ablation study began with a baseline architecture (Case 1), which represents a simplified version of UEBNet with all core enhancement modules removed. In this configuration, the model retained only the ResNet, a standard FPN, and the basic head of PatchDCT, using the original FPN features directly for candidate region generation and a simple element-wise addition to fuse coarse and fine masks. Subsequently, we progressively ‘re-activated’ UEBNet’s built-in components: Case 2 reintegrated the CBAM module at the top layer of the FPN. Case 3 replaced the CBAM module with the DSCBAM module. Building on this, Case 4 further enabled the MFT module within the mask head. Case 5 represented the complete UEBNet framework, with all three core components working in synergy.
Table 3.
Results of the ablation experiment.
In Table 3, the experimental results demonstrate that model performance improved incrementally as modules were added. Moreover, the DSCBAM module achieves higher accuracy and faster FPS than the CBAM module. Figure 9 and Figure 10 visualise the segmentation results of the five experiments, showing the impact of adding different modules to the baseline model. The visual comparison between Case 2 and Case 3 demonstrates that the attention mechanism enables the model to focus more on architecture-related features, thereby enhancing localisation accuracy and reducing false negatives and false positives. The improved DSCBAM module exhibits superior performance. Case 4 shows that the MFT module enhances the model’s ability to localise the boundaries of buildings at different scales, proving its role in improving global contextual consistency and local detail precision. The results for Case 5 reflect that the AMSI module respects the complementary nature of structure and detail, enhancing the model’s ability to resolve irregular boundaries and maintain semantic consistency. These results prove that each proposed module improves performance to same extent, and that their contributions are not merely additive; their integration further improves performance.
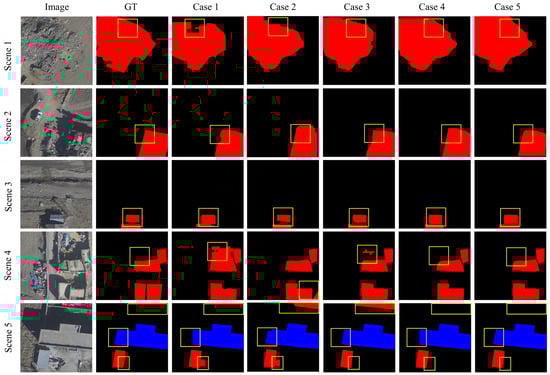
Figure 9.
Comparison of segmentation masks in ablation experiments. The red mask represents the Damaged class, the blue mask represents the Intact class, and the yellow boxes indicate areas where segmentation is difficult.
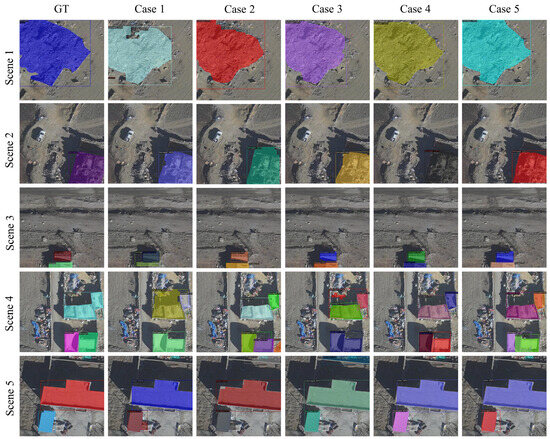
Figure 10.
Example of segmentation results from the ablation experiment.
It should be noted that despite a reduction in FPS, the UEBNet model still offers distinct advantages within the specific context of post-disaster assessment. Firstly, disaster response applications demand exceptionally high accuracy and reliability. Even a 2–3% increase in segmentation precision enables the correct evaluation of hundreds of buildings across extensive disaster zones. The costs of false negatives and false positives are extraordinarily high. Therefore, even at the expense of increased computational complexity, pursuing greater accuracy remains a worthwhile scientific endeavour in this field. Secondly, the reliability of the UEBNet model in complex scenarios is of greater importance. Simplistic models falter in challenging scenarios, such as precisely segmenting highly irregular collapsed boundaries or separating densely clustered structures. The UEBNet, incorporating three innovative modules, partially resolves this dilemma. However, it cannot be denied that model lightweighting facilitates rapid deployment and extreme rescue operations, making it a crucial area of future research.
4.5. Applicability of UEBNet Model
To evaluate the practical application performance of the UEBNet model, we conducted inference tests on the regions shown in Figure 1b,c from Section 2.1. As illustrated in Figure 11, UEBNet successfully detected and segmented the various types of buildings within the areas, with the boundaries showing a high degree of conformity to the actual outlines. The classification results were also consistent with those from visual interpretation, exhibiting low rates of misclassification and omission. These results fully confirm that the UEBNet model possesses good accuracy and robustness, even when handling intricate backdrops and multi-scale targets.
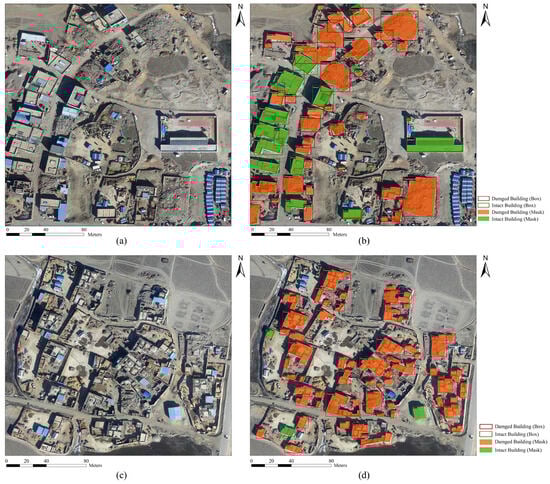
Figure 11.
Building extraction results of the UEBNet model for Chajiang Village (a,b) and Tonglai Village (c,d), where (a,c) are the original images, and (b,d) are the segmentation results.
4.6. Generalisation Capability of the Model in Jishishan Earthquake
In practical applications, the generalisation capability of a post-earthquake building extraction model is crucial. To evaluate the generalisation performance of the proposed UEBNet, we conducted tests using UAV imagery (resolution: 0.14 m) of Dahejia Town, captured after the Ms 6.2 Jishishan earthquake in Gansu Province, China, on 18 December 2023. As shown in Figure 12, we collected data from this region to be used for model training and evaluation. Figure 13 shows sample instances from the dataset.
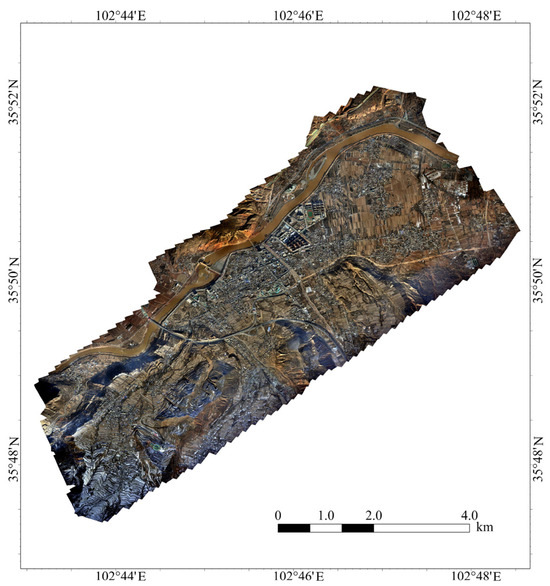
Figure 12.
Post-earthquake UAV imagery of the Jishishan earthquake.
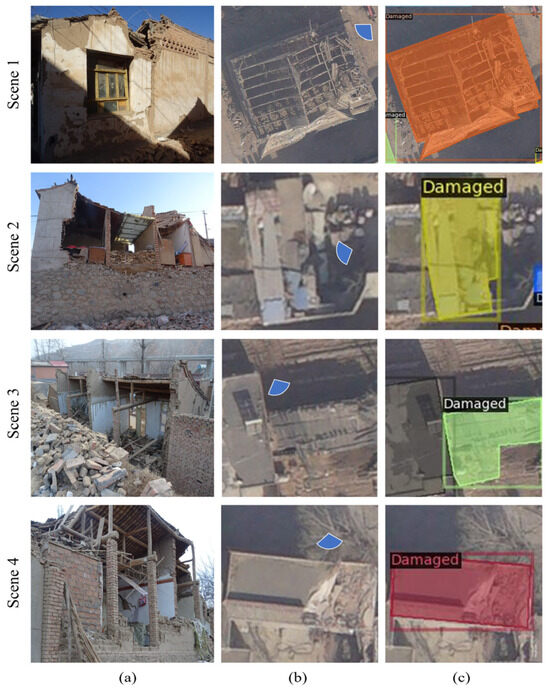
Figure 13.
Example of Jishishan earthquake data samples: (a) field survey photos; (b) UAV images, where the observation location’s viewing angle is indicated by blue fan shapes; (c) sample labels, with different mask colours representing different instances.
The test results for UEBNet and the SOTA models are presented in Table 4 and Figure 14. The results indicate that UEBNet still achieved the best performance on the Jishishan earthquake data, with an OA of 95.33%. As depicted in Figure 14, UEBNet can accurately locate buildings and capture their irregular boundaries, performing well even in multi-target scenarios, which demonstrates its strong generalisation capability. To further assess UEBNet’s practical application performance, we conducted inference tests on parts of two villages in Jishishan County, with the results shown in Figure 15. UEBNet successfully detected and precisely segmented the various types of buildings within these areas, and their boundaries showed a high degree of conformity to the actual outlines. The classification results were consistent with visual interpretation, exhibiting low rates of misclassification and omission. These results fully confirm the generalisation capability of the UEBNet model across different earthquake events.
Table 4.
Quantitative results for all models of instance masks. Best results are shown in boldface.
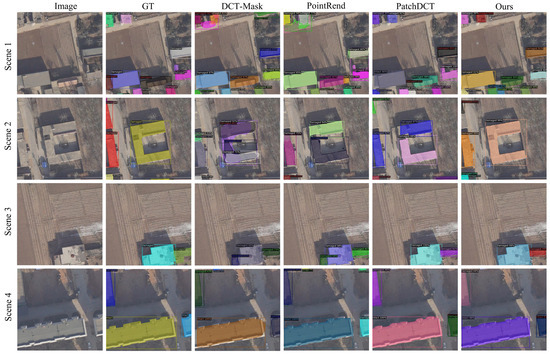
Figure 14.
Instance segmentation results of different models on the post-earthquake building dataset from the Jishishan earthquake.
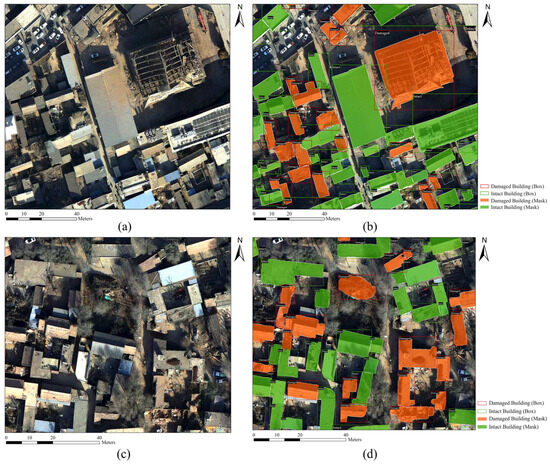
Figure 15.
Building extraction results of the UEBNet model for Dahe Village (a,b) and Zhoujia Village (c,d) in Jishishan County, where (a,c) are the original images, and (b,d) are the segmentation results.
We observed that UEBNet’s metrics for the Jishishan earthquake were lower than in the Tingri earthquake scenario. For example, the for the Jishishan earthquake in Table 4 was 39.12%, lower than the 42.26% for the Tingri earthquake in Table 2. This trend was also present in the other models. We believe this performance difference stems primarily from three factors: Firstly, there was a discrepancy in the resolution of the UAV imagery collected from the two earthquakes, with the Tingri imagery having a higher resolution (5 cm). Secondly, due to weather conditions, there was light haze in the Jishishan earthquake, which reduced UAV image clarity. Thirdly, structures in Jishishan County are predominantly timber-and-earth or brick-and-concrete constructions, with most village dwellings featuring interconnected roofs and dense housing layouts. These exhibit localised cracking or partial collapse. In contrast, buildings in Tingri County are chiefly timber-and-earth or earth-and-stone structures, with unconnected dwellings. Most display either complete overall collapse or partial collapse.
4.7. Hyperparameter Sensitivity Analysis
To validate the model’s robustness to hyperparameter selection, we conducted a comprehensive parameter sensitivity analysis. We focused primarily on three key hyperparameters within the loss function: , which controls the weighting of coarse mask regression loss; , which controls the weighting of fine patch loss; and γ, the focal parameter in Focal Loss used to address class imbalance. Given that the UEBNet model employs a coarse-to-fine optimisation process, where global structure prediction and local detail refinement are equally important, we set , hereafter referred to as λ. Using the Tingri seismic dataset and fixing all other training settings, we systematically adjusted these parameters, evaluating performance primarily via and metrics. The results are presented in Table 5.
Table 5.
Results of hyperparameter sensitivity analysis. Default configurations are indicated with an underscore. Best results are shown in boldface.
The results indicate that the model achieves peak performance under default configurations (λ = 0.50, γ = 2.00). Specifically, when γ = 2.00, performance peaks at λ = 0.50. As λ shifts towards either 0.25 or 1.00, performance declines, demonstrating the critical importance of assigning balanced weights to the coarse mask loss and fine patch loss. Even when γ deviates from 2.00, λ = 0.50 remains the optimal choice, demonstrating the robustness of this value.
When λ = 0.50, performance peaks at γ = 2.00. As γ decreases or increases, both metrics exhibit a downward trend, indicating that a moderate focus factor is crucial for handling class imbalance. Excessively large or small values of γ diminish performance. When λ deviates from 0.50, γ = 2.00 remains the optimal choice, though overall performance declines.
Although performance declines when deviating from the default configuration, accuracy remains above 40% at γ = 2.00 when λ is set to 0.50 and 0.75, demonstrating a degree of robustness. However, performance degradation is severe in extreme parameter regions.
Sensitivity analysis indicates that UEBNet exhibits notable sensitivity to hyperparameters λ and γ, with the default configuration (λ = 0.50, γ = 2.00) representing the optimal choice. This analysis not only validates our parameter selection but also provides crucial tuning references for researchers applying this method to similar tasks.
5. Conclusions
In this study, we focused on the highly challenging task of instance segmentation for damaged buildings in post-earthquake UAV remote sensing imagery. To address the core difficulties of complex backgrounds, variable target scales, and irregular boundaries in post-disaster scenes, we designed and implemented a novel high-performance segmentation network model, UEBNet. By synergistically optimizing the DSCBAM module, the MFT module, and the AMSI module, the model systematically improves segmentation accuracy. We verified the effectiveness and superiority of UEBNet through extensive experiments. It achieved SOTA performance across all key evaluation metrics, demonstrating exceptional capability, particularly when processing partially damaged and irregularly shaped buildings. UEBNet not only provides an efficient and precise technical tool for post-earthquake emergency response and damage assessment but also offers new design concepts and a robust baseline model for addressing similar complex visual tasks.
Despite its numerous advantages, UEBNet still faces challenges in practical post-earthquake emergency response. Its two-stage instance segmentation architecture requires significant computational resources, which to some extent limits its rapid deployment and real-time processing capabilities in emergency scenarios.
Future work will investigate model simplification and compression to enhance efficiency while maintaining accuracy. Furthermore, considering the limitations of remote sensing observations, we will aim to increase the precision of remote sensing-based seismic damage instance segmentation by integrating on-site investigations and seismological knowledge.
Author Contributions
Conceptualization, Z.G., S.W. and K.Y.; methodology, Z.G. and S.W.; software, Z.G.; validation, Z.G.; formal analysis, Z.G. and S.W.; investigation, Z.G.; resources, S.W. and X.Z.; data curation, Z.G.; writing—original draft preparation, Z.G.; writing—review and editing, S.W., K.Y. and Y.W.; visualization, Z.G.; supervision, S.W.; funding acquisition, S.W. All authors have read and agreed to the published version of the manuscript.
Funding
This research was funded by the Fundamental Research Funds of the Institute of Earthquake Forecasting, China Earthquake Administration, Grant CEAIEF20230202; the National Natural Science Foundation of China, Grant 42271090; and the Fundamental Research Funds of the Institute of Earthquake Forecasting, China Earthquake Administration, Grant CEAIEF20240508 and CEAIEF20240405.
Data Availability Statement
Dataset available on request from the authors.
Acknowledgments
The authors would like to thank the anonymous reviewers for their very competent comments and helpful suggestions.
Conflicts of Interest
The authors declare no conflicts of interest.
References
- Li, Q.Y.; Mou, L.C.; Sun, Y.; Hua, Y.S.; Shi, Y.L.; Zhu, X.X. A Review of Building Extraction From Remote Sensing Imagery: Geometrical Structures and Semantic Attributes. IEEE Trans. Geosci. Remote Sens. 2024, 62, 4702315. [Google Scholar] [CrossRef]
- Reuland, Y.; Lestuzzi, P.; Smith, I.F.C. A model-based data-interpretation framework for post-earthquake building assessment with scarce measurement data. Soil. Dyn. Earthq. Eng. 2019, 116, 253–263. [Google Scholar] [CrossRef]
- Valentijn, T.; Margutti, J.; van den Homberg, M.; Laaksonen, J. Multi-Hazard and Spatial Transferability of a CNN for Automated Building Damage Assessment. Remote Sens. 2020, 12, 2839. [Google Scholar] [CrossRef]
- An, L.; Zhang, J.; Ricardo, M.; Zhang, L. A review and prospective research of earthquake damage assessment and remote sensing. Natl. Remote Sens. Bull. 2024, 28, 860–884. [Google Scholar] [CrossRef]
- Fan, Y.; Wu, W.; Wang, W.; Liu, M.; Win, Q. Research progress of disaster remote sensing in China. Natl. Remote Sens. Bull. 2021, 20, 1170–1184. [Google Scholar] [CrossRef]
- Ge, J.Y.; Tang, H.; Yang, N.S.; Hu, Y.J. Rapid identification of damaged buildings using incremental learning with transferred data from historical natural disaster cases. Isprs J. Photogramm. Remote Sens. 2023, 195, 105–128. [Google Scholar] [CrossRef]
- Jhan, J.P.; Kerle, N.; Rau, J.Y. Integrating UAV and Ground Panoramic Images for Point Cloud Analysis of Damaged Building. IEEE Geosci. Remote Sens. Lett. 2022, 19, 6500805. [Google Scholar] [CrossRef]
- Nedjati, A.; Vizvari, B.; Izbirak, G. Post-earthquake response by small UAV helicopters. Nat. Hazards 2016, 80, 1669–1688. [Google Scholar] [CrossRef]
- Wang, J.Q.; Guo, H.N.; Su, X.; Zheng, L.; Yuan, Q.Q. PCDASNet: Position-Constrained Differential Attention Siamese Network for Building Damage Assessment. IEEE Trans. Geosci. Remote Sens. 2024, 62, 5622318. [Google Scholar] [CrossRef]
- Xie, Y.K.; Feng, D.J.; Chen, H.Y.; Liu, Z.C.; Mao, W.F.; Zhu, J.; Hu, Y.; Baik, S.W. Damaged Building Detection From Post-Earthquake Remote Sensing Imagery Considering Heterogeneity Characteristics. IEEE Trans. Geosci. Remote Sens. 2022, 60, 4708417. [Google Scholar] [CrossRef]
- Zhang, R.; Li, H.; Duan, K.; You, S.; Liu, K.; Wang, F.; Hu, Y. Automatic detection of earthquake-damaged buildings by integrating UAV oblique photography and infrared thermal imaging. Remote Sens. 2020, 12, 2621. [Google Scholar] [CrossRef]
- Yu, B.; Sun, Y.; Hu, J.; Chen, F.; Wang, L. Post-disaster building damage assessment based on gated adaptive multi-scale spatial-frequency fusion network. Int. J. Appl. Earth Obs. Geoinf. 2025, 141, 104629. [Google Scholar] [CrossRef]
- Hui, J.; Du, M.K.; Ye, X.; Qin, Q.M.; Sui, J. Effective Building Extraction From High-Resolution Remote Sensing Images With Multitask Driven Deep Neural Network. IEEE Geosci. Remote Sens. Lett. 2019, 16, 786–790. [Google Scholar] [CrossRef]
- Li, Y.S.; Li, X.W.; Zhang, Y.J.; Peng, D.F.; Bruzzone, L. Cost-efficient information extraction from massive remote sensing data: When weakly supervised deep learning meets remote sensing big data. Int. J. Appl. Earth Obs. Geoinf. 2023, 120, 103345. [Google Scholar] [CrossRef]
- Mo, S.Y.; Shi, Y.F.; Yuan, Q.; Li, M.Y. A Survey of Deep Learning Road Extraction Algorithms Using High-Resolution Remote Sensing Images. Sensors 2024, 24, 1708. [Google Scholar] [CrossRef] [PubMed]
- He, K.M.; Gkioxari, G.; Dollár, P.; Girshick, R. Mask R-CNN. IEEE Trans. Pattern Anal. Mach. Intell. 2020, 42, 386–397. [Google Scholar] [CrossRef] [PubMed]
- Ronneberger, O.; Fischer, P.; Brox, T. U-Net: Convolutional Networks for Biomedical Image Segmentation. In Proceedings of the 18th International Conference on Medical Image Computing and Computer-Assisted Intervention (MICCAI), Munich, Germany, 5–9 October 2025; pp. 234–241. [Google Scholar] [CrossRef]
- Cheng, B.W.; Misra, I.; Schwing, A.G.; Kirillov, A.; Girdhar, R. Masked-attention Mask Transformer for Universal Image Segmentation. In Proceedings of the IEEE/CVF Conference on Computer Vision and Pattern Recognition (CVPR), New Orleans, LA, USA, 18–24 June 2022; pp. 1280–1289. [Google Scholar] [CrossRef]
- Duarte, D.; Nex, F.; Kerle, N.; Vosselman, G. Multi-Resolution Feature Fusion for Image Classification of Building Damages with Convolutional Neural Networks. Remote Sens. 2018, 10, 1636. [Google Scholar] [CrossRef]
- Xiong, C.; Li, Q.; Lu, X. Automated regional seismic damage assessment of buildings using an unmanned aerial vehicle and a convolutional neural network. Autom. Constr. 2020, 109, 102994. [Google Scholar] [CrossRef]
- Khankeshizadeh, E.; Mohammadzadeh, A.; Arefi, H.; Mohsenifar, A.; Pirasteh, S.; Fan, E.; Li, H.X.; Li, J.A.T. A Novel Weighted Ensemble Transferred U-Net Based Model (WETUM) for Postearthquake Building Damage Assessment From UAV Data: A Comparison of Deep Learning- and Machine Learning-Based Approaches. IEEE Trans. Geosci. Remote Sens. 2024, 62, 4701317. [Google Scholar] [CrossRef]
- Cao, X.; Zou, H.; Li, J.; Ying, X.; He, S. OBBInst: Remote sensing instance segmentation with oriented bounding box supervision. Int. J. Appl. Earth Obs. Geoinf. 2024, 128, 103717. [Google Scholar] [CrossRef]
- Gomroki, M.; Hasanlou, M.; Chanussot, J.; Hong, D.F. EMYNet-BDD: EfficientViTB Meets Yolov8 in the Encoder-Decoder Architecture for Building Damage Detection Using Postevent Remote Sensing Images. IEEE J. Sel. Top. Appl. Earth Obs. Remote Sens. 2024, 17, 13120–13134. [Google Scholar] [CrossRef]
- Zhong, S.; Wang, L. Review of Research on Object Detection in UAV Aerial Images. Laser Optoelectron. Progress. 2025, 62, 1000005. [Google Scholar] [CrossRef]
- Yu, K.; Wang, S.; Wang, Y.; Gu, Z.; Wang, Y. DBA-RTMDet: A High-Precision and Real-Time Instance Segmentation Method for Identification of Damaged Buildings in Post-Earthquake UAV Imagery. IEEE J. Sel. Top. Appl. Earth Obs. Remote Sens. 2025, 18, 19577–19593. [Google Scholar] [CrossRef]
- Zou, R.; Liu, J.; Pan, H.; Tang, D.; Zhou, R. An improved instance segmentation method for fast assessment of damaged buildings based on post-earthquake uav images. Sensors 2024, 24, 4371. [Google Scholar] [CrossRef] [PubMed]
- Zhan, Y.H.; Liu, W.; Maruyama, Y. Damaged Building Extraction Using Modified Mask R-CNN Model Using Post-Event Aerial Images of the 2016 Kumamoto Earthquake. Remote Sens. 2022, 14, 1002. [Google Scholar] [CrossRef]
- Shen, X.; Yang, J.; Wei, C.; Deng, B.; Huang, J.; Hua, X.-S.; Cheng, X.; Liang, K. Dct-mask: Discrete cosine transform mask representation for instance segmentation. In Proceedings of the IEEE/CVF Conference on Computer Vision and Pattern Recognition, Virtual, 19–25 June 2021; pp. 8720–8729. [Google Scholar] [CrossRef]
- Wen, Q.; Yang, J.; Yang, X.; Liang, K. Patchdct: Patch refinement for high quality instance segmentation. In Proceedings of the Eleventh International Conference on Learning Representations, Kigali, Rwanda, 1–5 May 2023. [Google Scholar] [CrossRef]
- Shang, Q.; Zhou, Z. Rapid report of seismic damage and consequence analysis in the 2025 M 6.8 Dingri earthquake. Earthq. Res. Adv. 2025, 100394. [Google Scholar] [CrossRef]
- Xu, X.; Wang, S.; Cheng, J.; Wu, X. Shaking the Tibetan Plateau: Insights from the Mw 7.1 Dingri earthquake and its implications for active fault mapping and disaster mitigation. npj Nat. Hazards 2025, 2, 16. [Google Scholar] [CrossRef]
- Can, Z.; Hongmei, G.; Dongming, W.; Yuping, Y.; Zhen, Z.; Ying, Z.; Zonghang, H. Rapid disaster assessment of a 6.8-magnitude earthquake in Dingri, Tibet. Earthq. Res. Adv. 2025, 100377. [Google Scholar] [CrossRef]
- Vabalas, A.; Gowen, E.; Poliakoff, E.; Casson, A.J. Machine learning algorithm validation with a limited sample size. PLoS ONE 2019, 14, e0224365. [Google Scholar] [CrossRef] [PubMed]
- Zhou, Z.-H. Machine Learning; Springer Nature: Berlin/Heidelberg, Germany, 2021. [Google Scholar]
- Woo, S.H.; Park, J.; Lee, J.Y.; Kweon, I.S. CBAM: Convolutional Block Attention Module. In Proceedings of the 15th European Conference on Computer Vision (ECCV), Munich, Germany, 8–14 September 2018; pp. 3–19. [Google Scholar] [CrossRef]
- Chollet, F. Xception: Deep learning with depthwise separable convolutions. In Proceedings of the IEEE Conference on Computer Vision and Pattern Recognition, Honolulu, HI, USA, 21–26 July 2017; pp. 1251–1258. [Google Scholar] [CrossRef]
- Yu, F.; Koltun, V. Multi-Scale Context Aggregation by Dilated Convolutions. In Proceedings of the ICLR, San Juan, Puerto Rico, 2–4 May 2016. [Google Scholar] [CrossRef]
- Lin, T.-Y.; Goyal, P.; Girshick, R.; He, K.; Dollár, P. Focal loss for dense object detection. In Proceedings of the IEEE International Conference on Computer Vision, Honolulu, HI, USA, 21–26 July 2017; pp. 2980–2988. [Google Scholar] [CrossRef]
- Tian, Z.; Shen, C.H.; Chen, H.; He, T. FCOS: A Simple and Strong Anchor-Free Object Detector. IEEE Trans. Pattern Anal. Mach. Intell. 2022, 44, 1922–1933. [Google Scholar] [CrossRef]
- Fawcett, T. An introduction to ROC analysis. Pattern Recognit. Lett. 2006, 27, 861–874. [Google Scholar] [CrossRef]
- Varghese, R.; Sambath, M. YOLOv8: A Novel Object Detection Algorithm with Enhanced Performance and Robustness. In Proceedings of the 2024 International Conference on Advances in Data Engineering and Intelligent Computing Systems (ADICS), Chennai, India, 18–19 April 2024; pp. 1–6. [Google Scholar] [CrossRef]
- Kirillov, A.; Wu, Y.X.; He, K.M.; Girshick, R. PointRend: Image Segmentation as Rendering. In Proceedings of the IEEE/CVF Conference on Computer Vision and Pattern Recognition (CVPR), Seattle, WA, USA, 13–19 June 2020; pp. 9796–9805. [Google Scholar] [CrossRef]
- Bolya, D.; Zhou, C.; Xiao, F.Y.; Lee, Y.J. YOLACT Real-time Instance Segmentation. In Proceedings of the IEEE/CVF International Conference on Computer Vision (ICCV), Seoul, Republic of Korea, 27 October–2 November 2019; pp. 9156–9165. [Google Scholar] [CrossRef]
- Wang, X.; Zhang, R.; Kong, T.; Li, L.; Shen, C. SOLOv2: Dynamic and Fast Instance Segmentation. Adv. Neural Inf. Process. Syst. 2020, 33, 17721–17732. [Google Scholar] [CrossRef]


Disclaimer/Publisher’s Note: The statements, opinions and data contained in all publications are solely those of the individual author(s) and contributor(s) and not of MDPI and/or the editor(s). MDPI and/or the editor(s) disclaim responsibility for any injury to people or property resulting from any ideas, methods, instructions or products referred to in the content. |
© 2025 by the authors. Licensee MDPI, Basel, Switzerland. This article is an open access article distributed under the terms and conditions of the Creative Commons Attribution (CC BY) license (https://creativecommons.org/licenses/by/4.0/).