Abstract
Forest fires, intensified by climate change, threaten tropical ecosystems by accelerating biodiversity loss, releasing carbon emissions, and altering hydrological cycles. Continuous detection of fire-induced forest loss is therefore critical. However, commonly used optical-based methods often face limitations, particularly due to cloud cover and coarse spatial resolution. This study explores the use of C-band Sentinel-1 Synthetic Aperture Radar (SAR) time series, combined with Bayesian Online Changepoint Detection (BOCD), for detecting and continuously monitoring fire-induced vegetation loss in forested areas. Three BOCD variants are evaluated: two single-polarization approaches individually using VV and VH reflectivities, and a dual-polarization approach (-BOCD) integrating both channels. The analysis focuses on a fire-affected area in Baixo Uraim (Paragominas, Brazil), supported by field-validated reference data. BOCD performance is compared against widely used optical products, including MODIS and VIIRS active fire and burned area data, as well as Sentinel-2-based difference Normalized Burn Ratio (dNBR) assessments. Results indicate that -BOCD achieves spatial accuracy comparable to dNBR (88.2% agreement), while enabling detections within a delay of three Sentinel-1 acquisitions. These findings highlight the potential of SAR-based BOCD for rapid, cloud-independent monitoring. While SAR enables continuous detection regardless of atmospheric conditions, optical imagery remains essential for characterizing the type and severity of change.
1. Introduction
The monitoring of forest loss in the Amazon rainforest is vital to mitigate its extensive impacts on ecosystems, climate stability, and socio-economic conditions. Despite its crucial role in global carbon storage, the Amazon carbon sink is declining due to climate change [1]. Deforestation contributes to this decline through two main mechanisms: the loss of biomass and the release of large amounts of CO2 during combustion. When forests are cleared or burned, significant quantities of carbon stored in vegetation are emitted into the atmosphere, exacerbating global warming. Deforestation also strongly alters regional water cycles. By reducing evapotranspiration, it disrupts precipitation patterns and leads to prolonged droughts [2], which intensify dry conditions and further stress the ecosystem. Biodiversity loss is another severe consequence of deforestation. The removal of forest habitats directly threatens countless species. Moreover, soil degradation reduces permeability and increases runoff, which in turn heightens erosion risk and transfers sediments to rivers, adversely affecting aquatic habitats [3,4]. Recent studies show that deforestation and selective logging increase local temperatures and reduce rainfall [5,6]. These climate shifts promote prolonged dry spells that favor further deforestation activities [7,8]. In parallel, drier conditions and increased fragmentation increase vegetation flammability, making forests more susceptible to wildfires [9,10].
In South America, especially in the Amazon rainforest, wildfire severity and frequency have risen sharply in recent decades [11]. This trend is driven by more frequent droughts [12] and commodity-driven deforestation [13]. Wildfires not only threaten human populations and wildlife but also release substantial CO2 emissions [14]. They degrade soil and vegetation, further reducing the forest’s capacity to recover. The extent of forest recovery depends on ecosystem type, fire severity, and frequency, with humid tropical forests showing long-term biomass reductions due to increased tree mortality [15]. Recent experimental evidence from southeastern Amazon forests highlights that droughts combined with repeated land-use fires can drive nonlinear forest degradation, reducing canopy cover, promoting invasive grasses, and increasing vulnerability, potentially leading to alternate vegetation states with uncertain persistence [16].
Optical multi-spectral data have been widely studied for mapping wildfire-burned areas and assessing burn severity [17]. Specifically, the Near Infrared (NIR, µm) and Short-Wave Infrared (SWIR, µm) bands have emerged as the most frequently used due to wildfire-induced changes, which cause a reduction in chlorophyll, leading to a decrease in NIR reflectance, and a reduction in moisture, resulting in an increase in SWIR reflectance [18]. These findings motivated the design of several spectral indices, among which the most well-known are the Normalized Burn Ratio (NBR) and its bi-temporal form, the difference NBR (dNBR), which compares pre- and post-fire data [19]. In wildfire monitoring, the data provided by the Moderate Resolution Imaging Spectroradiometer (MODIS) [20] and the Visible Infrared Imaging Radiometer Suite (VIIRS) [21] are commonly used for initial fire mapping, while Landsat and Sentinel-2 data are utilized for post-fire boundary delineation and burn severity assessment. MODIS and VIIRS, which are characterized by low to moderate spatial resolution, detect thermal anomalies. These anomalies are then analyzed to identify pixels with high radiative heat, which are flagged as active fires. Landsat and Sentinel-2, which have higher spatial resolution on the order of tens of meters, are then used to compute dNBR and assess burn severity [22,23]. However, optical observations are affected by cloud cover [24], especially in tropical regions, and may also be influenced by smoke from active fires. Additionally, reflectance-based indices often struggle to provide accurate results, particularly for intermediate burn severity levels where multiple factors intersect. These challenges limit the ability of optical-based approaches to monitor fires in a continuous and accurate manner.
Synthetic Aperture Radar (SAR), which is unaffected by atmospheric conditions like clouds and can operate independently of daylight, provides a valuable alternative to optical-based sensors for rapid forest fire monitoring. The capabilities of multi-frequency (i.e., X-, L-, C-band) SAR imagery in multiple polarizations have been widely investigated for burnt area mapping and fire severity estimation [18,25,26]. Specifically, C-band Sentinel-1, developed by the European Space Agency (ESA) as part of the Copernicus program, holds significant potential for rapid forest loss monitoring due to free data access provided to users, ensuring broad accessibility. The mission’s long-term continuity is guaranteed, and its dual-satellite configuration enables a revisit time of six days. Several Near Real-Time (NRT) forest loss monitoring systems, currently operational in various tropical regions, use Sentinel-1 data to detect deforestation. These systems, such as RADD [27], TropiSCO [28,29], DETER-R [30], and LUCA [31] rely on changes in normalized backscatter to identify forest loss. However, differentiating between deforestation practices remains challenging, as changes in the backscatter signal can indicate vegetation loss without revealing the specific type of deforestation practice.
In the specific context of fire scar mapping using Sentinel-1 data, several methods have been proposed. A burned area detection approach applied to Mediterranean forests is developed in [32] to analyze temporal changes in radar backscatter. The method relies on detecting abrupt decreases in VH and VV backscatter following fire events, using a differencing technique between pre- and post-fire acquisitions. To minimize noise and false detections, a series of thresholding and filtering steps are applied, including normalization, terrain correction, and speckle filtering. Another burned area detection algorithm that integrates temporal backscatter change analysis with thermal hotspot data from MODIS and VIIRS is developed in [33]. The method applies the Reed–Xiaoli anomaly detector to identify significant changes in VH and VV backscatter ratios and uses land cover stratification to adapt to local scattering conditions. A Random Forest classifier is further employed to map burned areas in the absence of hotspot information. Additionally, an automatic deep learning-based framework is developed in [34] for NRT forest fire mapping using Sentinel-1 data. Specifically, the approach utilizes dense pre-fire Sentinel-1 time series in VV and VH polarizations to characterize the natural temporal variability of backscatter across different land cover types. Upon the acquisition of each new image during a wildfire event, a log-ratio change detection is first applied against a selected pre-fire reference image. A time series-based anomaly detection technique then identifies significant deviations from the norm, generating an initial coarse burnt area map. This map is used to automatically select training samples for a convolutional neural network, which is fine-tuned online to produce high-resolution burn confidence maps. These maps are subsequently binarized using thresholding and progressively merged to construct a fire progression map.
Despite the large adoption and the many benefits provided by Sentinel-1, in case of forest fires, the effects on C-band backscatter depend on several factors, including fire intensity [35], vegetation type and structure (e.g., canopy height and density), and moisture content [32]. Generally, the occurrence of fire reduces the forest canopy, thereby decreasing volume scattering and exposing the ground, whose contribution becomes a major component of the overall backscatter response. However, despite this straightforward physical effect, forest fires induce complex phenomena in the observed reflectivity. Canopy reduction typically results in a drop in reflectivity under dry conditions, particularly in cross-polarization [26]. Canopy reduction also exposes open terrain and tree trunks, favoring surface and double-bounce scattering between the ground and dead standing trees [36]. Although post-fire areas typically display structural changes (e.g., defoliation, burned trunks), C-band’s capacity to distinguish between burned and unburned regions is often constrained by overlapping radar backscatter from varying fire severities. Severe burns, associated with complete canopy removal, lead to significant reductions in reflectivity. However, partial burns, characterized by residual ground biomass, may exhibit mixed scattering behaviors. Furthermore, C-band SAR is less sensitive to surface fires compared to lower-frequency radar bands such as L-band [36]. Surface fires, which primarily affect the understory or ground vegetation, may not cause sufficient changes in radar backscatter to be detectable with C-band SAR data. This limitation can reduce fire detection accuracy in areas affected by low-intensity fires or those that do not produce significant structural changes in vegetation. Rainfall modifies the dielectric constant, leading to increased scattering in single-bounce, double-bounce, and volume scattering mechanisms [37].
This study leverages extensive ground reference data collected during a field campaign following a large forest fire event that occurred between September and November 2024 in the province of Paragominas (Pará), Brazil. This dataset provides a rare opportunity to validate satellite-based fire detection results with direct field observations from a fire-affected region, offering a reliable reference for algorithm performance assessment. The primary objective of this work is to assess the capability of Sentinel-1 C-band SAR data for the rapid detection of forest loss caused by fire events. The specific aim is to determine whether changes in SAR backscatter, across both co- and cross-polarized channels, can reliably indicate fire-induced forest loss over short time scales. Given the complex interactions between fire severity, vegetation structure, and radar signal behavior, the capacity of C-band SAR to capture varying fire intensities needs to be explored. To achieve this objective, a Bayesian inference-based algorithm (BOCD) previously developed for NRT forest loss monitoring [38] is applied. This method models probabilistic variations in SAR backscatter to detect forest disturbances. Furthermore, the multivariate version of the algorithm (-BOCD) [39], which processes both co- and cross-polarized Sentinel-1 channels jointly, is employed to investigate its effectiveness and potential improvements in capturing fire-driven changes in forest structure compared to single-polarization BOCD methods. Additionally, Sentinel-1-based results are compared with MODIS and VIIRS burned area products, as well as active fire alerts. dNBR is also calculated using Sentinel-2 optical imagery, and the results are compared both spatially and temporally with those from the BOCD methods. This comparison aims to assess the complementarity of SAR and optical observations for fire detection and post-fire impact evaluation.
The paper is structured as follows: Section 2 describes the selected study area and provides information on the characteristics and timeline of the Baixo Uraim fire episodes. Furthermore, it discusses both field-validated reference data and Sentinel-1 input data, and provides insights into the BOCD algorithms (single-polarization and dual-polarization) used for rapid fire-induced forest loss detection. Furthermore, Section 3 and Section 4 present and discuss the results obtained from the BOCD methods, compared to those derived from MODIS, VIIRS, and Sentinel-2. Finally, Section 5 offers concluding remarks.
2. Materials and Methods
2.1. Study Area
The study area for this work is the municipality of Paragominas, located in the state of Pará, in the northeastern Brazilian Amazon. In Pará, fire is extensively used at the agricultural–forest interface to clear land for agricultural expansion, making it a major contributor to deforestation and greenhouse gas emissions in the region [40]. Paragominas was established in 1965 during the construction of the BR-010 highway, which connects Belém, the capital of Pará, with Brasília [41]. The city’s development occurred during a period of accelerated deforestation, encouraged by the Brazilian government as a primary condition for establishing land ownership [42]. Initially, Paragominas’ economic expansion was largely driven by timber extraction [43], cattle ranching [44], and small-scale subsistence farming [45]. However, from the 2000s onward, the landscape began shifting with the expansion of grain cultivation, eucalyptus plantations, and significant smallholder settlement projects [46]. As a result of the land occupation process, the total deforested area reached 8600 by 2010 [42]. In 2008, Paragominas was placed on Brazil’s ‘blacklist’ of the 36 municipalities with the highest deforestation rates in the Amazon. This designation triggered intensified government enforcement actions and monitoring by the Brazilian Institute of Environment and Renewable Natural Resources (IBAMA) [42]. Removal from the ’blacklist’ required reducing deforestation to less than 40 per year and implementing the environmental property register (CAR) in at least 80% of the municipality. In response, local stakeholders committed to a territorial development shift under the Green Municipality Program (GMP) [47]. Following significant progress in reducing deforestation, Paragominas was removed from the ’blacklist’ in March 2010 and has since become a model for deforestation control policies. Figure 1 shows examples of land use in Paragominas during September 2024.
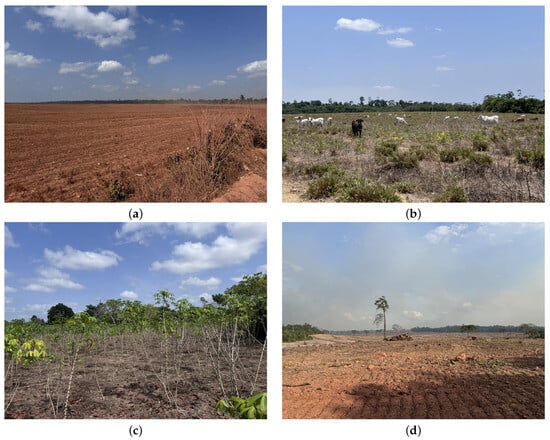
Figure 1.
Images collected during a field campaign showing land use in Paragominas during September 2024: (a) Soybean field, captured on 25 September 2024; (b) Grazing pasture, captured on 25 September 2024; (c) Cassava plantation, captured on 24 September 2024; (d) Land cleared for agriculture, captured on 23 September 2024. © Marta Bottani.
Traditionally, the vegetation in Paragominas is evergreen lowland rainforest [48], with a canopy height ranging from 25 to 40 m and an aboveground biomass of approximately 300 t [41]. The area has a tropical climate, with an average annual temperature of 26 °C [49] and average annual rainfall of 1900 mm . The dry season typically lasts from July to November. The region’s terrain consists of fragmented plateaus, ranging in elevation from 110 to 220 m above sea level, interspersed with large valleys where the elevation drops to 45–80 m [49]. The plateaus, which are usually several kilometers wide, lack surface water channels. In contrast, the valley floors are characterized by a more extensive network of streams [50]. Figure 2 depicts the Paragominas municipality, highlighting land use and land cover (from TerraClass 2022: https://www.terraclass.gov.br/, accessed on 15 May 2025), as well as the protected indigenous area of Alto Rio Guamá.
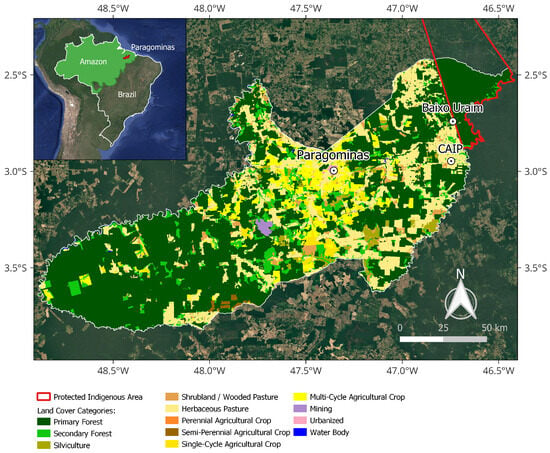
Figure 2.
Map of the Paragominas municipality, showing land cover and land use (©2022 TerraClass). Optical background image from Google Earth (©2025 Google).
2.2. The Fire Event: Timeline and Characteristics
This work is motivated by the availability of ground reference data collected during a field trip, related to a forest fire that occurred between September and November 2024 in Baixo Uraim, within the Paragominas municipality. The fire was initially set by some indigenous farmers as part of a traditional agricultural practice involving controlled burning. Particularly, indigenous communities in the Amazon have long used fire as a land management tool [51]. Such practice is now being challenged as the climate grows increasingly drier. Known as indigenous fire stewardship, this practice involves the intentional and controlled use of fire to manage ecosystems, enhance biodiversity, support agricultural activities [52], and mitigate wildfire risk. In many regions, small farmers have adopted similar practices—following the example of indigenous communities—by using shifting cultivation with slash-and-burn techniques. However, the rapid changes in climate and the increasing dryness of the forest make fire-management practices a potential threat. More frequent fires, linked to intensified agriculture, reduce fallow periods and weaken the forest’s ability to evapotranspire during the dry season. In parallel, logging and forest fragmentation increase flammability and facilitate fire spread [10]. Combined with a lack of rainfall, water stress intensifies, making vegetation highly flammable.
The Baixo Uraim fire is characterized by two main episodes, occurring approximately one month apart. The fire was initially set on 23 September 2024, by indigenous farmers. However, the farmers were unable to return to the fields to monitor the fire due to the death of a community member, which necessitated a 10-day mourning period according to indigenous traditions, during which time they were prohibited from returning to work. The community believed the fire would self-extinguish, but it spread beyond the cleared areas into the forest. Unattended due to the community’s absence and exacerbated by the drought conditions of the dry season, the fire eventually became uncontrollable, marking the first significant burning episode, which lasted approximately one week. The first burn was an understory fire that primarily consumed dead material and litter on the ground within primary and secondary forests in the area (Figure 3a). While the green vegetation remained unburned during this initial episode, it dried out in the days following the fire, eventually falling to the ground and creating a new layer of highly flammable material. The fire was ultimately contained by locals, who employed firebreaks and backfires to control its spread. Overall, the first burning episode of the Baixo Uraim fire affected an area of approximately 37 . Images of the fire are shown in Figure 3a–c.
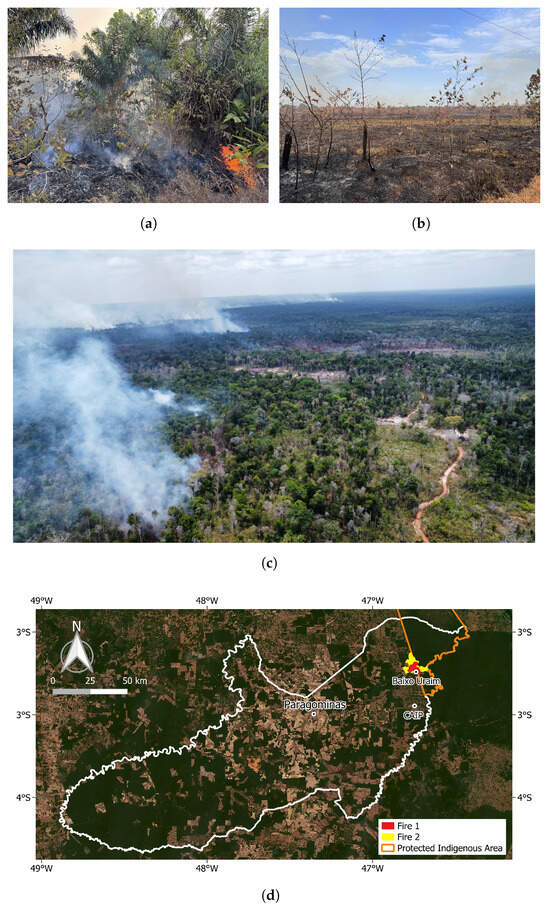
Figure 3.
Images of the first burning episode in Baixo Uraim and the fire location within the Paragominas province: (a) Ground-level fire in a forest, captured on 23 September 2024; (b) Ground-level fire on agriculture, captured on 23 September 2024; (c) Aerial view of the Baixo Uraim fire, captured on 23 September 2024; (d) Location of the Baixo Uraim fires. ©Marta Bottani (a,b), ©Krishna Naudin (c), Background ©2024 PlanetScope (d).
Approximately one month after the first burning episode, around 27 October 2024, the second burning occurred and lasted for two weeks, until about 10 November 2024. The second fire was triggered by strong winds that reignited the embers from the first fire, which had remained in hollow trunks and roots. The fire spread to consume the new layer of dead material left by the initial burn, along with dry branches and trunks. It was only contained along roadsides and in pastures, where control efforts were more feasible, and with substantial support from local farmers. The fire was ultimately extinguished by the heavy rains of the wet season, which began in mid-December. The second burn was significantly more destructive than the first, affecting approximately 102 of land.
2.3. Field-Validated Reference Data
Following the on-field retrieval of GPS coordinates, the full extent of the Baixo Uraim fires was delineated through manual inspection of high-resolution (3.7 m) PlanetScope monthly mosaics. Figure 3d shows the fire locations, while Figure 4 shows the corresponding PlanetScope optical mosaics captured before and after the fire events. Specifically, the October mosaic highlights the burned area from the first fire episode, while the November mosaic reveals the effects of the second burn. Mosaics from the period preceding the fires are included to outline agricultural parcels cleared during that time, as they will be discussed later in the results. The June mosaic was omitted due to significant cloud coverage.
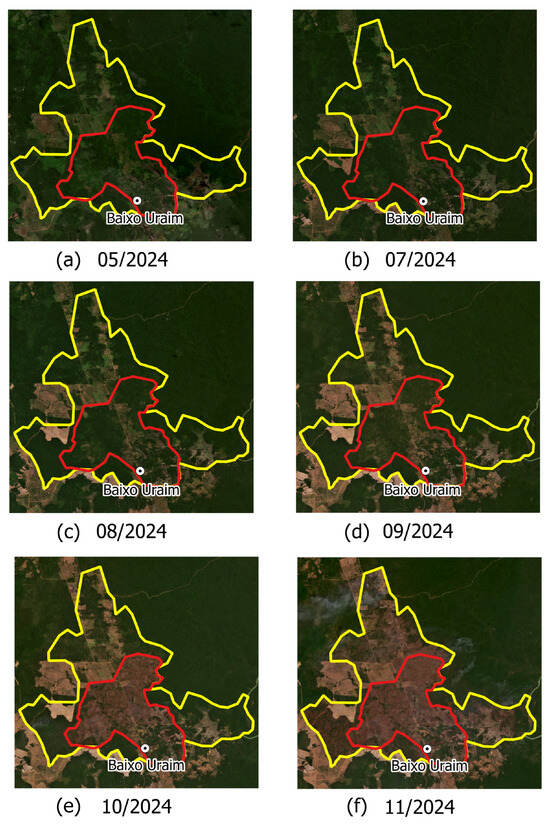
Figure 4.
Manually delineated burned areas derived from PlanetScope optical mosaics. Panels (a–d) show agricultural parcels cleared prior to the fires. Panel (e) highlights the burned area from the first fire, while panel (f) depicts the effects of the second fire. Red indicates the first fire, and yellow indicates the second. Background imagery ©2024 PlanetScope.
2.4. Sentinel-1 Input Data
This study employs Sentinel-1 Radiometrically Terrain-Corrected (RTC) products processed by Catalyst and retrieved from the Microsoft Planetary Computer catalog (https://planetarycomputer.microsoft.com/catalog, accessed on 7 April 2025). The processing chain comprises radiometric calibration, terrain correction, and orthorectification. No additional speckle filtering is applied, resulting in imagery with a spatial resolution of approximately 20 m in azimuth and 22 m in ground range. Both polarimetric channels are utilized: cross-polarized (VH) and co-polarized (VV). The data used in this study correspond to a one-year period (1 January to 31 December 2024) and have a 12-day revisit interval, as they were acquired exclusively from Sentinel-1A following the loss of Sentinel-1B in December 2021. The limited revisit time during the Baixo Uraim fires restricts the number of available acquisitions capturing the burning events. Figure 5 presents a timeline of available Sentinel-1 acquisitions during the Baixo Uraim fires, alongside the approximate timing of the burning events and the dates of Sentinel-2 optical acquisitions. Specifically, the white circles denote the dates of the only cloud-free Sentinel-2 acquisitions during this period, while the black circles indicate cloudy images. The last Sentinel-1 image before the fire was acquired on 13 September 2024. The next acquisition, on 25 September, coincided with the first fire event. Subsequent acquisitions, on 7 October and 19 October, captured the period between the end of the first fire and the onset of the second. Following 19 October, there was a gap in Sentinel-1 acquisitions, coinciding with the occurrence of the second burn. The final images, acquired on 12 November, 24 November, and 6 December, were taken shortly after the conclusion of the second fire event. In total, this dataset comprises six images documenting the fire period before the onset of heavy rains in mid-December.

Figure 5.
Timeline of Sentinel-1 acquisitions during the Baixo Uraim fires, showing approximate burning timing and the dates of clear and cloudy Sentinel-2 acquisitions.
The expected Sentinel-1 C-band backscatter () behavior following the Baixo Uraim fires is illustrated in Figure 6. Before the start of the first fire (), Sentinel-1 backscatter, primarily driven by volume scattering within the canopy, is expected to remain relatively stable. After the initial burn (), a general decrease in backscatter is anticipated due to canopy thinning, which reduces volume scattering, along with a decrease in the soil’s dielectric constant. However, double-bounce effects may still occur in co-polarized backscatter due to signal interactions between dry soil and vertical trunks. Following the second fire (), a further reduction in the soil’s dielectric constant is expected, leading to a continued decrease in backscatter, now mainly driven by surface scattering. Finally, with the onset of heavy rainfall (), an increase in the ground’s dielectric constant is anticipated, causing a rise in backscatter that may obscure the burning effects. While this behavior is expected in the area affected by both fire events (red in Figure 4), the area impacted exclusively by the second burn (yellow in Figure 4) should only experience phases , , and .
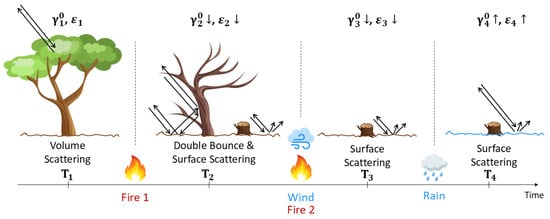
Figure 6.
Schematic representation of the expected C-band backscatter behavior following the Baixo Uraim fires. denotes the backscatter, and denotes the soil dielectric constant.
The temporal and statistical evolution (whisker-box plots) of co-polarized (VV) and cross-polarized (VH) Sentinel-1 backscatter over the Baixo Uraim fire-affected region is shown in Figure 7, along with total precipitation and soil temperature data obtained from ERA-5 daily products, provided by the European Centre for Medium-Range Weather Forecasts (ECMWF). The backscatter plots show the average behavior across 250 randomly sampled polygons within forested areas, each approximately 50 × 50 pixels in size, located within the fire-affected region. These plots are intended for illustrative purposes only; the actual change detection algorithm operates at the single-pixel level, without any spatial averaging.
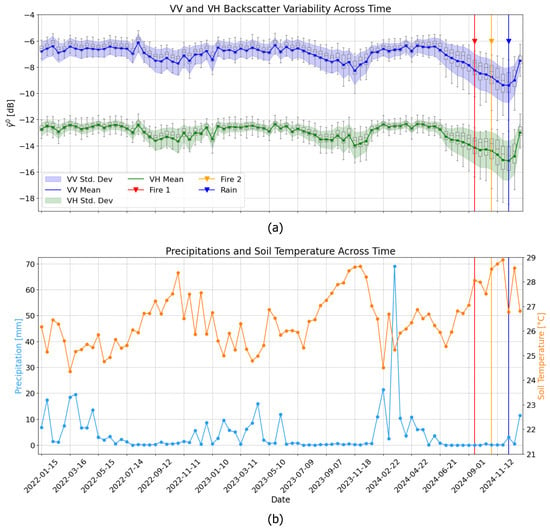
Figure 7.
(a) Temporal and statistical (whisker-box) evolution of Sentinel-1 co-polarized (VV) and cross-polarized (VH) backscatter, derived from 250 randomly sampled polygons, each approximately 50 × 50 pixels in size. (b) Corresponding daily precipitation and surface temperature data obtained from ERA-5 daily products.
Overall, the backscatter behavior aligns with previously discussed expectations. Specifically, both VV and VH backscatter levels decrease following the first fire. Notably, the co-polarized backscatter appears more sensitive to variations in the ground’s dielectric constant, and the resulting reduction in reflectivity is not compensated by an increased double-bounce scattering contribution, since the VV polarization channel is relatively insensitive to this scattering mechanism. During the first fire, the absence of precipitation and a progressive increase in soil temperature further support the observed decrease in backscatter values. An additional reduction in backscatter is observed after the second fire, followed by a sharp increase with the onset of the rainy season. Specifically, following the second fire, soil temperature increases further in the absence of rainfall, before beginning to decrease as the rainy season begins, bringing abundant precipitation.
2.5. SAR-Based Algorithm for Detecting Fire-Induced Forest Loss
To detect fire-induced forest loss in Baixo Uraim, this work employs the Bayesian Online Changepoint Detection (BOCD) algorithm [38], initially designed for NRT deforestation monitoring. In its original configuration, BOCD processes single-polarization, single-pixel Sentinel-1 backscatter time series in an online manner, continuously updating the probability of a change (i.e., forest loss) as new data becomes available. Practically, the method aims to partition a time series into sequential segments, with changepoints marking the beginning of each new segment. This segmentation is performed online by estimating the posterior probability of the run length (i.e., ), which represents the number of observations since the last detected changepoint and is associated with the hidden state of a Markov model:
The joint distribution of the run length and the observed time series up to time t, , required for the computation of (1), can be expressed as follows [53]:
The calculation of the joint distribution relies on the evaluation of the terms in (2). Specifically, the recursive term illustrates the message-passing principle of the algorithm, highlighting that the current joint distribution depends on the joint distribution at the previous time step. Additionally, the posterior predictive term depends on the likelihood of the Sentinel-1 input data and the prior distribution of the model parameters. Finally, the transition probability accounts for spatial context, incorporating prior knowledge on deforestation in neighboring pixels. Further technical details regarding the BOCD algorithm and its implementation can be found in [38].
By tracking (1) over time, BOCD adapts iteratively to incoming data. With each new observation, it updates its internal parameters to reflect the current statistical behavior of the time series [38]. A change is detected when deviations from the modeled statistics persist over several consecutive observations, leading to a significant drop in the most probable run length. The detection of forest loss triggers the start of a new segment, as illustrated in Figure 8, which depicts the algorithm’s working principle. This requirement for temporal consistency makes BOCD robust to isolated outliers, such as those introduced by speckle, and thus avoids the need for speckle filtering.
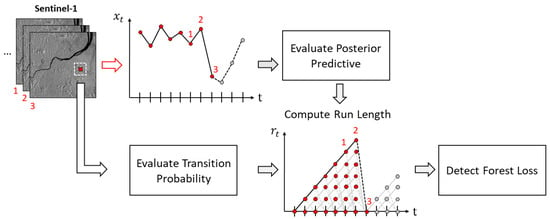
Figure 8.
Schematic representation of the BOCD algorithm.
Building on the complementary information provided by co-polarized and cross-polarized Sentinel-1 channels, the BOCD framework can be extended to process multivariate Sentinel-1 time series, hence dual-polarimetric acquisitions. This extension, referred to as -BOCD, is conceptualized in [39]. -BOCD has demonstrated improved performance compared to single-polarization BOCDs, particularly for detecting commodity-induced forest loss in the Cerrado biome, a region characterized by diverse land cover types and strong seasonality. It was particularly effective in areas where artisanal clearing leaves substantial ground residue after deforestation. In such cases, polarization diversity helps compensate for the lack of a clear volume scattering decrease in cross-polarization. Because fire-induced forest loss can resemble gradual vegetation removal seen in artisanal clearings, -BOCD is tested on the fire-affected region of Baixo Uraim. For comparison, single-polarization BOCDs (-BOCD and -BOCD) are also applied to evaluate their relative effectiveness.
2.6. Validation Procedures and Accuracy Metrics
The detection of fire-induced forest loss is defined as the loss of vegetative cover in primary and secondary forests, according to the TerraClass land-use map, caused by fires. It is performed using the previously presented frameworks within the extents delineated in Figure 4. To validate the performance of the BOCD-based burned area detections, both qualitative and quantitative approaches are employed by comparing the outputs with established optical remote sensing products. First, a visual assessment is conducted by comparing the spatial patterns of burned area detections derived from the BOCD methods against multiple optical datasets, including MODIS and VIIRS burned area and active fire products, as well as dNBR assessments obtained from Sentinel-2 imagery. This step provides an initial evaluation of the consistency in burned area detection across products, a comparison of the spatial resolution offered by each dataset, and a temporal evaluation where timing information is available.
To quantify spatial accuracy, a confusion matrix is computed by comparing the BOCD-based burned area detections against the dNBR Sentinel-2 assessment, which serves as a reference. This evaluation is conducted exclusively within primary and secondary forest areas classified according to TerraClass. The confusion matrix expresses agreement in terms of percentage of pixels and categorizes detections as follows:
- True Positives (TP): Pixels identified as burned by both BOCD and dNBR.
- False Positives (FP): Pixels detected as burned by BOCD but not by dNBR.
- False Negatives (FN): Pixels marked as burned by dNBR but missed by BOCD.
- True Negatives (TN): Pixels classified as unburned by both sensors.
To evaluate temporal accuracy, the timing of BOCD-based detections is compared against local knowledge on fire progression derived from field observations, as described in Section 2.2. This temporal information is further cross-checked with the dates of clear Sentinel-2 acquisitions used to compute the dNBR assessments, thus assessing the proposed method’s ability to detect burn events continuously. Figure 9 presents the complete methodological workflow used in this study to derive BOCD-based fire scar assessments, refined with Sentinel-2 dNBR.
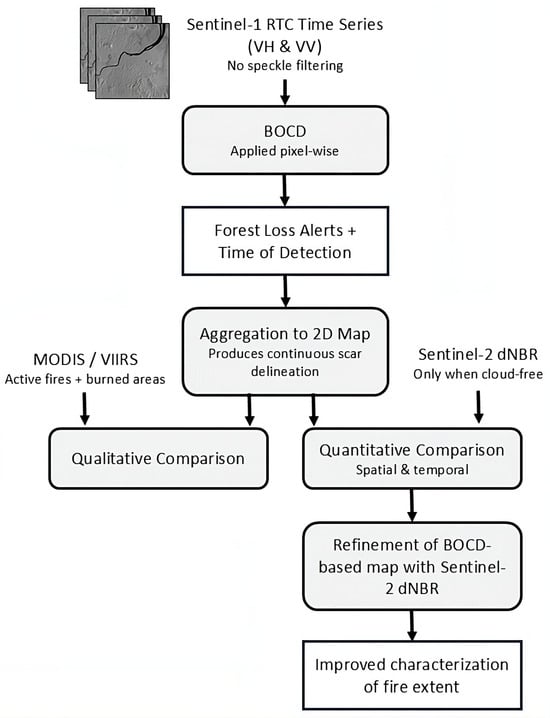
Figure 9.
Methodological workflow for BOCD-based detection of fire-induced forest loss, refined using Sentinel-2 dNBR for enhanced event characterization.
3. Results
3.1. BOCD Results
An example of changepoint detection using -BOCD for a single pixel dual-polarization time series extracted from the fire-affected region is presented in Figure 10.
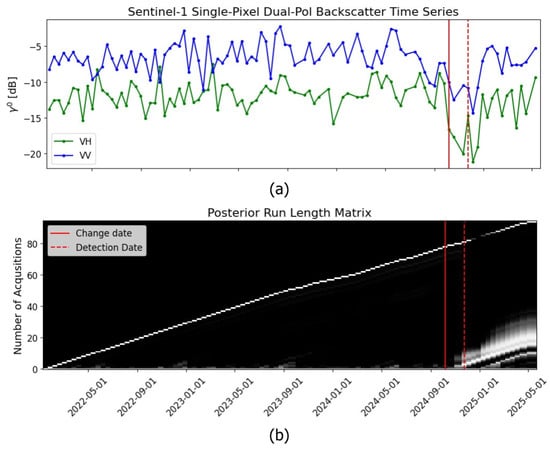
Figure 10.
Example of changepoint detection using -BOCD. (a) Dual-polarization time series of backscatter intensity. (b) Run length posterior probability matrix for each acquisition date. Change date is shown in solid red, and detection date in dashed red.
The overall fire detection results obtained using single-polarization BOCD (-BOCD and -BOCD) and -BOCD over the fire-affected area in Baixo Uraim are shown in Figure 11. The pixels identified as fire-affected are color-coded to represent the timing of detection. The results show that -BOCD achieves more detections compared to single-polarization BOCDs by leveraging the complementary characteristics of Sentinel-1 polarimetric channels. Additionally, disturbances caused by the first fire appear to be well captured by all BOCD methods, whereas those related to the second fire are only marginally detected. The fire detections from -BOCD, categorized by land cover type, are shown in Figure 12. The results indicate that the majority of the vegetation impacted by the fires consists of primary forest, followed by secondary forest. Herbaceous areas and shrubland pastures are not considered in this analysis but are included for completeness.
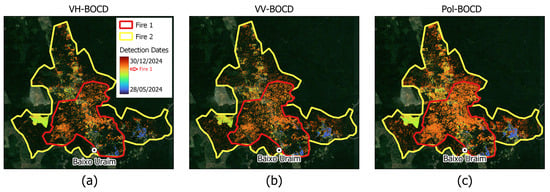
Figure 11.
Fire detection dates using (a) VH-BOCD, (b) VV-BOCD and (c) pol-BOCD over the fire-affected area in Baixo Uraim. Blue/purple and bright yellow indicate pre-fire clearing (i.e., agricultural parcels, pastures); orange marks the first fire event, and red shades represent the second. Background ©2024 PlanetScope.

Figure 12.
Fire detection dates from pol-BOCD, categorized by land cover type (©2022 TerraClass): (a) primary forest, (b) secondary forest, (c) shrubland pasture, and (d) herbaceous pasture. Blue/purple and bright yellow indicate pre-fire clearing (i.e., agricultural parcels, pastures); orange marks the first fire event, and red shades represent the second. Background ©2024 PlanetScope.
3.2. Fire Detection Using Optical Products
As outlined in the introduction, fire mapping has traditionally relied on optical multi-spectral data. This section presents the results of fire detection over the Baixo Uraim region using widely adopted operational burned area and active fire products from MODIS and VIIRS. Additionally, an assessment of the Baixo Uraim fire scars and fire severity is conducted using Sentinel-2 imagery to take advantage of its finer spatial resolution. The spatial precision and temporal accuracy of these products in detecting the Baixo Uraim fires are discussed and will be compared with the BOCD results in Section 4.
3.2.1. MODIS and VIIRS Burned Area and Active Fire Products
The burned area products provided by MODIS (MCD64A1) and VIIRS (VNP64A1) [54] are widely used for fire mapping. These products, designed for post-fire burned area assessment, are generated monthly at a spatial resolution of 500 m. In contrast, rapid fire identification is provided by active fire products, which detect thermal anomalies daily, with a coarse 1 km resolution for MODIS [20] and a 750 m to 350 m resolution for VIIRS [21]. The burned area and active fire products from MODIS and VIIRS for the Baixo Uraim fire-affected region are presented in Figure 13a,b. The results show that the active fire products effectively capture the temporal aspects of the Baixo Uraim fires, with VIIRS performing particularly well due to its higher spatial resolution compared to MODIS, resulting in a greater density of detections. However, the burned area products appear to capture the burn scars only partially, with the first fire being more accurately identified than the second by both MODIS and VIIRS. Nonetheless, the temporal patterns of the mapping are generally consistent with ground reference information. For the sake of completeness, it is noted that burned area products become available with a minimum delay of one month from the fire occurrence.
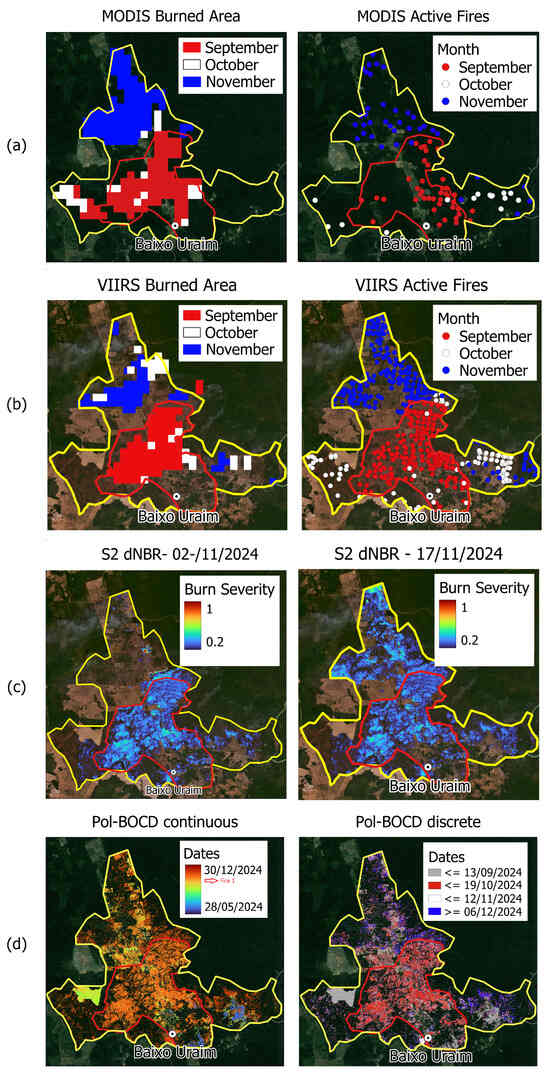
Figure 13.
Comparison of fire detection results between -BOCD and optical products. (a) MODIS burned area and active fire products. (b) VIIRS burned area and active fire products. (c) Sentinel-2 dNBR based on the pre-fire acquisition on 3 September 2024, and post-fire acquisitions on 2 November and 17 November 2024. (d) -BOCD results depicted on both continuous and discrete time scales. Background ©2024 PlanetScope.
It is important to note that a product similar to the MODIS and VIIRS active fire alerts is provided by the Sentinel-3 World Fire Atlas. This NRT global fire monitoring product, developed by ESA, is based on thermal observations from the Sea and Land Surface Temperature Radiometer (SLSTR) onboard the Sentinel-3A and Sentinel-3B satellites. It detects active fires using thermal anomalies, primarily during nighttime when detection conditions are optimal, and provides information such as the location (latitude, longitude), time of detection, and fire radiative power [55]. The product features a spatial resolution of 1 km and daily global coverage. Within this study, a detailed comparison with the Sentinel-3 World Fire Atlas is omitted due to its particularly low performance in detecting the Baixo Uraim fires.
3.2.2. Sentinel-2 dNBR Analysis for Fire Severity
Fire scar extent and fire severity can be assessed by computing the dNBR using two cloud-free optical acquisitions: one before and one after the fire event [19]. For comparison with the Sentinel-1-based BOCD results, Sentinel-2 imagery is selected for dNBR computation. Sentinel-2, a two-satellite constellation, provides a 5-day revisit cycle and enables the generation of a dNBR product at a 20 m resolution, owing to the spatial resolution of its NIR and SWIR bands. Over a four-month period covering the Baixo Uraim fires, from 3 September 2024, to 1 January 2025, Sentinel-2 acquired 22 images. However, only three of these are sufficiently cloud-free to compute the dNBR. Specifically, the cloud-free pre-fire acquisition was captured on 3 September 2024, while the first cloud-free post-fire acquisition was obtained on 2 November 2024 (Figure 5). It is important to note that during the 2 November 2024, acquisition, the second fire was still ongoing, meaning the dNBR computation captures the fire effects only partially. The second partially cloud-free Sentinel-2 acquisition was obtained on 17 November 2024, allowing for the final assessment of the burned area and fire severity. Figure 13c, displays the dNBR results, highlighting the fire-affected areas and the corresponding severity levels for the two dNBR computations: post-fire 1 and post-fire 2.
The dNBR results highlight pixels affected by burning, with positive values near zero indicating low-severity fires and values approaching one signifying high-severity burns. As expected, the fire scars from the events are clearly delineated, except for the lower-left corner of the second fire, where an artifact in the Sentinel-2 imagery is present. Furthermore, the first dNBR computation on 2 November exclusively captures the effects of the first burn, which is then complemented by the second dNBR computation on 17 November 2024, to account for the effects of the second fire. Fire severity during the burns is predominantly low to moderate. Notably, the delineation of the burned area from the first fire in Baixo Uraim using Sentinel-2 imagery was only possible five weeks after the event, due to the limited availability of cloud-free acquisitions. In contrast, the burned area assessment for the second fire was achievable two weeks after the event.
3.3. Spatial & Temporal Performance
To quantify temporal performance, Figure 14 shows the density of -BOCD detection events from the time of the first burn, compared to dNBR assessments based on the availability of cloud-free Sentinel-2 images. This illustrates the temporal continuity of -BOCD detections relative to optical-based monitoring. For spatial performance, Table 1 presents the confusion matrix comparing -BOCD detections to Sentinel-2 dNBR data, which is used as the reference for the first burning episode. Specifically, the dNBR reference dataset contains 1,027,240 burned pixels and 781,962 unburned pixels. The results indicate that 75.4% of the areas identified as burned by dNBR are also flagged by -BOCD. Only 2.1% of the -BOCD detections do not correspond to burned areas in the dNBR product. Meanwhile, 9.7% of burned areas in the dNBR reference are not detected by -BOCD, and 12.8% of the remaining regions are consistently identified as unburned by both sources. These metrics reflect a high level of agreement (88.2%) between the two datasets in identifying fire-affected areas.
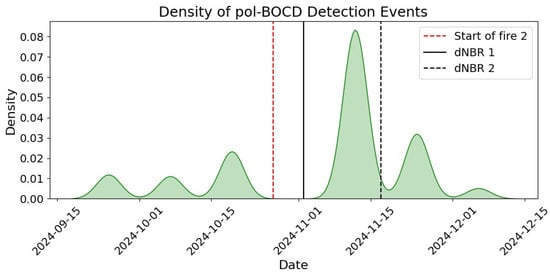
Figure 14.
Density of -BOCD detection events starting from the first burn date (23 September 2024), compared to dNBR assessments derived from clear Sentinel-2 imagery. A dashed red line marks the approximate start of fire 2, while solid and dashed black lines show dNBR results from cloud-free Sentinel-2 data.

Table 1.
Confusion matrix comparing -BOCD burn detections against the Sentinel-2 dNBR reference map for the first burning episode. Values represent the percentage (%) of pixels. The matrix shows agreement between sensors: true positives (both detect burn), false positives (-BOCD only), false negatives (dNBR only), and true negatives (neither detect burn).
Figure 15 illustrates the complementarity of the proposed SAR-based method and optical-based monitoring. Figure 15a shows that early -BOCD detections preceding the fire events align with agricultural parcels cleared during the same period, confirming the correct temporal ordering of disturbance events. Figure 15b presents the final burned area map derived from -BOCD detections refined using Sentinel-2 dNBR. The agricultural parcels highlighted in red in Figure 15a, incorrectly flagged as burned by -BOCD, are excluded in the combined result, demonstrating the effectiveness of the fusion in reducing false positives.
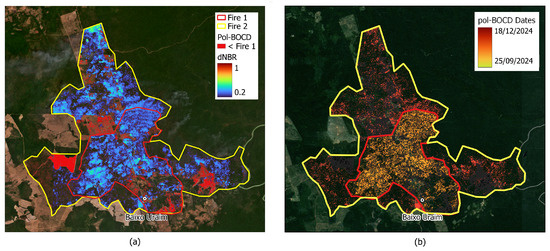
Figure 15.
Complementarity of -BOCD and Sentine-2 dNBR. (a) -BOCD pre-fire detections (confirmed by Sentinel-2 dNBR, 17 November 2024) show cleared agricultural areas prior to the fires, with no detection of fire-impacted pixels. (b) Continuous burned area map obtained by combining -BOCD and Sentinel-2 dNBR. Background ©2024 PlanetScope.
4. Discussion
This section discusses the results presented in Section 3. Specifically, the outcomes of the different BOCD methods (single-polarization and -BOCD) are compared, and the SAR-based fire detections are evaluated against optical products, focusing on both spatial and temporal precision.
4.1. Performance of Single-Pol and -BOCD Algorithms
The fire detection results obtained by applying the different BOCD methods to the fire-affected area in Baixo Uraim, as presented in Figure 11, highlight the advantages of -BOCD over single-polarization methods. The -BOCD method demonstrates more comprehensive detection capabilities, identifying a greater number of fire-affected pixels. This improved performance is likely due to its ability to exploit the complementary information provided by both Sentinel-1 polarimetric channels: VH, which is more sensitive to variations in canopy volume, and VV, which is more sensitive to variations in soil dielectric constant. Among the single-polarization methods, -BOCD and -BOCD exhibit comparable performance, with -BOCD detecting slightly more fire-affected pixels but occasionally showing a delay in flagging certain areas compared to -BOCD. The nominal detection delay across all BOCD methods does not exceed three acquisitions. While the first fire is well-detected by all methods, the second fire is only partially identified. This is likely due to the limited availability of acquisitions between the fire event and the onset of the rainy season, which are essential for detecting pre-rainfall backscatter reductions. The backscatter analysis in Figure 6 reveals no evidence of VV backscatter increases, suggesting that double-bounce sensitivity did not play a role. Consequently, the change detection relied on backscatter decreases for both VH and VV polarimetric channels. Although HH polarization data is not available, its inclusion is anticipated to reveal double-bounce effects, offering additional insights into the detected changes.
The fire detection results per land cover type, shown in Figure 12, provide further context, showing that pixels highlighted in blue/purple and vivid yellow within the primary and secondary forests are detected by the BOCD algorithms during land clearing, which precedes the fire events. This outcome reflects the change detection nature of BOCD, which identifies any significant alterations in the landscape without differentiating between land clearing and fires. In such cases, the detected change corresponds to the clearing event that occurred first. Similar results regarding the potential misclassifications of changes unrelated to fires when using C-band SAR data are consistent with the findings in [33]. These outcomes suggest a strong potential for integrating BOCD methods with active fire alerts and optical-based assessments to enhance their capability in distinguishing fire-induced forest loss.
Overall, BOCD methods demonstrate significant promise for continuous monitoring of fire-induced forest loss, offering robust spatial and temporal performance in detecting fire-affected areas in Baixo Uraim. This is particularly noteworthy given the limited dataset of six Sentinel-1 images with a 12-day revisit interval. Restoring the nominal 6-day revisit cycle of the Sentinel-1 constellation is expected to further improve the performance of BOCD methods both spatially and temporally.
4.2. Comparing SAR-Based and Optical Detection Methods
The results depicted in Figure 13a,b, illustrate the rapid capability of MODIS and VIIRS sensors to detect active fires, making them valuable for triggering timely mitigation activities. However, these active fire products lack the spatial resolution necessary to fully assess the extent of the burned area. Conversely, while the burned area products offer better spatial resolution, their effectiveness is constrained by limited temporal resolution, as optical sensors are highly susceptible to cloud cover. The burn scar in Baixo Uraim is only partially detected, likely due to the modest fire severity—particularly for the second fire—and the coarse spatial resolution of the MODIS and VIIRS products. Overall, VIIRS demonstrates superior detection capabilities compared to MODIS. Notably, the temporal accuracy of VIIRS detections aligns well with ground reference data, with its active fire results effectively capturing the timing of both fire events.
Insights into the comparison between BOCD methods and the MODIS/VIIRS active fire and burned area products can be drawn by examining their relative strengths. BOCD methods are tailored for detecting fire-induced forest loss in NRT, addressing the cloud cover sensitivity of optical sensors that can cause delays in burned area detection, as seen with MODIS and VIIRS. However, Sentinel-1-based BOCD methods do not match the daily temporal resolution of MODIS and VIIRS active fire alerts. Instead, BOCD represents an intermediate solution between active fire alerts and burned area products. It delivers faster, continuously improving, and spatially precise burned area assessments by leveraging Sentinel-1 imagery, which offers significantly finer spatial resolution compared to MODIS and VIIRS. This suggests potential for integrating BOCD with daily active fire alerts.
The SAR-based BOCD fire detections can be compared with fire assessments derived from dNBR computations using Sentinel-2 optical imagery. Figure 13c illustrates the burned area assessment for the Baixo Uraim fires, showing a clear delineation of the first fire event, although with a five-week delay caused by persistent cloud cover that hindered Sentinel-2 acquisitions (Figure 5). Despite this delay, the burned area associated with the first fire is consistent with ground reference data, both in terms of extent and expected fire severity. In contrast, the delineation of the second burn scar was achieved relatively quickly, with only a two-week delay, due to the availability of a moderately cloudy Sentinel-2 image shortly after the second fire ended. Despite this “fortunate” outcome, the low availability of cloud-free Sentinel-2 images during the fire period, as shown in Figure 5, highlights the challenges posed by the high frequency of cloud cover during the transition from the dry to wet season. Although rain had not yet begun, the increasing cloud cover significantly reduced the availability of clear optical images. Consequently, burned area assessments relying solely on optical imagery can be delayed by several months or even become impossible. This is because fires are often extinguished by the first rains, and their maximum extent is hidden by the cloud cover typical of the early rainy season. When cloud-free images are available only during the following dry season—at least five months later—vegetation has typically regrown, stimulated by the fertilizing effect of ash, which obscures burn scars and leads to underestimation. In contrast, SAR imagery, which is not impacted by cloud cover, is generally more effective for continuous fire-induced forest loss detection as shown in Figure 14. This finding is also consistent with previous research [32,33,34].
Figure 13 shows the overall comparison between the top-performing SAR-based BOCD method (-BOCD) and all optical products considered in this study. From the comparison, it is evident that both -BOCD and Sentinel-2 dNBR provide superior spatial precision in delineating burned scars compared to MODIS and VIIRS burned area products. However, the VIIRS active fires alerts effectively capture the temporal aspects of the Baixo Uraim fires. A spatial comparison between -BOCD and Sentinel-2 dNBR shows a strong agreement in burned area delineation, further confirmed by the spatial performance metrics reported in Table 1. Nonetheless, -BOCD detects changes regardless of their nature, including those that occurred before the fires. Figure 15a, shows that the -BOCD detections prior to the fires correspond to agricultural parcels cleared during that period, thus confirming the temporality of subsequent fire-related detections.
From a temporal perspective, -BOCD provides a continuous burned area map, with each pixel associated with a detection date typically identified within a three-acquisition delay. In contrast, Sentinel-2 dNBR offers a burn severity map that requires the availability of two cloud-free images (one pre-fire and one post-fire) for computation. Due to the random nature of cloud cover and its high frequency in tropical regions, the detection delay associated with dNBR computation is unpredictable. While some fires, such as fire 2 in Baixo Uraim, may be detected early, others, like fire 1, may take several weeks or months to be identified. In some cases, fires may remain undetected if persistent rainfall obscures the burn effects for an extended period, ultimately leading to their complete disappearance. These findings highlight the advantages of SAR-based BOCD methods for the continuous detection of fire-induced forest loss, as they are unaffected by cloud cover. Furthermore, optical imagery, while potentially limited by delayed availability due to cloud cover, provides high precision and can play a crucial role in validating and refining SAR-based detections when it becomes accessible (Figure 15b), serving as a valuable complementary resource, as also noted in [32].
4.3. Limitations of pol-BOCD
The performance of -BOCD is subject to certain limitations, primarily stemming from characteristics of the radar backscatter signal and environmental conditions that affect SAR data acquisition. Omissions may occur when the backscatter does not exhibit a sufficient change following a disturbance. This can happen, for instance, when the fire does not significantly alter the vegetation structure or soil moisture in a way that is detectable in the C-band signal. Additionally, intermediate fire stages—such as low-intensity or patchy burns—may not produce strong backscatter variations, leading to undetected events. Another contributing factor is heavy rainfall immediately after a fire event, which can increase surface moisture and saturate the backscatter, thereby masking fire-related changes. In contrast, the algorithm is inherently robust to seasonal variation. Its foundation on a hidden Markov model enables it to adapt to regular seasonal fluctuations, while ensuring that only temporally consistent changes—persisting across multiple consecutive observations—result in a detection.
Temporal resolution is another potential limitation. Although this study used data from Sentinel-1A with a 12-day revisit, the restoration of a 6-day revisit interval with the operation of both Sentinel-1A and 1C is expected to enhance detection capabilities. Finally, a fundamental constraint of SAR-based approaches is the limited ability to distinguish the type of disturbance. Unlike optical imagery, SAR data generally cannot differentiate between causes such as clear-cutting and fire, as both can produce similar backscatter signatures.
5. Conclusions
This study evaluated the potential of SAR-based BOCD methods (single- and dual-polarization) for NRT detection of fire-related vegetation loss in forested areas, with a comparison to the spatial and temporal performance of optical imagery-based approaches. Although the analysis focused on vegetation loss following fire events, prior land-use changes—such as logging and forest fragmentation—likely increased landscape flammability, facilitating fire spread. These interacting factors underscore the complexity of attributing causality in fire-related forest loss across the Amazon. Using C-band Sentinel-1 SAR data, BOCD methods proved to be a robust solution for the continuous monitoring of fire-induced forest loss, as validated by field data collected in Baixo Uraim (Paragominas), Brazil. Notably, -BOCD, which leverages both co- and cross-polarized Sentinel-1 channels, produced results that were spatially consistent with Sentinel-2 burned area assessments.
The findings confirmed that while optical imagery provides precise burned scar delineation, its utility is limited by cloud cover, particularly during seasonal transitions when optical data availability decreases. This limitation can result in delayed detections, as observed during the first fire in Baixo Uraim, or even missed detections during extended periods of rainfall. In contrast, SAR imagery, being unaffected by cloud cover, generally enables continuous monitoring, even under challenging conditions. The Baixo Uraim fires were documented using a dataset comprising only six Sentinel-1A images, acquired with a 12-day revisit cycle due to the loss of Sentinel-1B in late 2021. Despite these limitations, fire-induced forest loss was detected within a three-acquisition delay, demonstrating promising spatial precision. The restoration of the 6-day revisit cycle of Sentinel-1, following the launch of Sentinel-1C, is expected to enhance -BOCD detection performance.
Ultimately, the results suggested that SAR-based -BOCD could complement optical fire detection products, providing a more reliable tool for NRT monitoring of fire-induced forest loss. A key recommendation for future research is to integrate SAR and optical data within a multi-sensor framework, which would enhance temporal continuity and improve the characterization of fire events, enabling more reliable and timely operational monitoring.
Author Contributions
Conceptualization and methodology, M.B. and L.F.-F.; software, M.B.; validation, M.B., R.P.-C.; resources, L.P.; writing—original draft preparation, M.B.; writing—review and editing, M.B., L.F.-F., R.P.-C. and L.P. All authors have read and agreed to the published version of the manuscript.
Funding
M.B. acknowledges support from the EUR TESS grant (N° ANR-18-EURE-0018) under the Programme des Investissements d’Avenir, as well as additional support from ISAE-Supaero and GdR IASIS mobility grants. L.P. benefits from a research productivity grant from the National Council for Scientific and Technological Development (CNPq).
Data Availability Statement
PlanetScope imagery was obtained from Planet Labs PBC under the NICFI Satellite Data Program. The TerraClass land cover map was obtained from the National Institute for Space Research (INPE) and the Brazilian Agricultural Research Corporation (Embrapa) and is available at https://www.terraclass.gov.br. Sentinel-1 and Sentinel-2 input data were obtained from the Microsoft Planetary Computer and are available at https://planetarycomputer.microsoft.com/catalog, accessed on 7 April 2025. MODIS and VIIRS active fire and burned area products were retrieved from NASA following the user guide https://modis-land.gsfc.nasa.gov/pdf/MODIS_C6_C6.1_Fire_User_Guide_1.0.pdf, accessed on 7 April 2025. ERA5 daily products were obtained from the Copernicus Climate Data Store (CDS) and are available at https://cds.climate.copernicus.eu/. Field photographs and burned area shapefiles were collected/outlined by the authors and are available upon reasonable request.
Acknowledgments
The authors thank the Universidade Federal do Pará (UFPA) for facilitating M.B.’s participation in a research mobility program in Belém, Brazil.
Conflicts of Interest
The authors declare no conflicts of interest.
References
- Gatti, L.; Cunha, C.; Marani, L.; Cassol, H.; Messias, C.; Arai, E.; Denning, A.; Soler, L.; Almeida, C.; Setzer, A.; et al. Increased Amazon carbon emissions mainly from decline in law enforcement. Nature 2023, 621, 318–323. [Google Scholar] [CrossRef] [PubMed]
- Boulton, C.A.; Lenton, T.M.; Boers, N. Pronounced loss of Amazon rainforest resilience since the early 2000s. Nat. Clim. Change 2022, 12, 271–278. [Google Scholar] [CrossRef]
- Certini, G. Effects of fire on properties of forest soils: A review. Oecologia 2005, 143, 1–10. [Google Scholar] [CrossRef]
- Zuazo, V.D.; Rodriguez, C.R. Soil-Erosion and Runoff Prevention by Plant Covers: A Review. Agron. Sustain. Dev. 2008, 28, 65–86. [Google Scholar] [CrossRef]
- Bottino, M.; Nobre, P.; Giarolla, E.; Silva, M.; Capistrano, V.; Malagutti, M.; Tamaoki, J.; Oliveira, B.; Nobre, C. Amazon savannization and climate change are projected to increase dry season length and temperature extremes over Brazil. Sci. Rep. 2024, 14, 5131. [Google Scholar] [CrossRef]
- Asner, G.P.; Loarie, S.; Heyder, U. Combined effects of climate and land-use change on the future of humid tropical forests. Conserv. Lett. 2010, 3, 395–403. [Google Scholar] [CrossRef]
- Leite-Filho, A.; Pontes, V.; Costa, M. Effects of Deforestation on the Onset of the Rainy Season and the Duration of Dry Spells in Southern Amazonia. J. Geophys. Res. Atmos. 2019, 124, 5268–5281. [Google Scholar] [CrossRef]
- Smith, C.; Baker, J.; Spracklen, D. Tropical deforestation causes large reductions in observed precipitation. Nature 2023, 615, 270–275. [Google Scholar] [CrossRef]
- Jin, Y.; Randerson, J.T.; Goetz, S.J.; Beck, P.S.A.; Loranty, M.M.; Goulden, M.L. The influence of burn severity on postfire vegetation recovery and albedo change during early succession in North American boreal forests. J. Geophys. Res. Biogeosciences 2012, 117, G01036. [Google Scholar] [CrossRef]
- Nepstad, D.; Klink, C.; Uhl, C.; Guimarães Vieira, I.; Lefebvre, P.; Pedlowski, M.; Matricardi, E.; Negreiros, G.; Brown, F.; Amaral, E.; et al. Land-use in Amazonia and the cerrado of Brazil. Ciência Cult. 1997, 49, 73–86. [Google Scholar]
- Chen, Y.; Velicogna, I.; Famiglietti, J.S.; Randerson, J.T. Satellite observations of terrestrial water storage provide early warning information about drought and fire season severity in the Amazon. J. Geophys. Res. Biogeosciences 2013, 118, 495–504. [Google Scholar] [CrossRef]
- Aragão, L.E.; Anderson, L.O.; Fonseca, M.G.; Rosan, T.M.; Vedovato, L.B.; Wagner, F.H.; Silva, C.V.J.; Junior, C.H.L.S.; Arai, E.; Aguiar, A.P.D.; et al. 21st Century drought-related fires counteract the decline of Amazon deforestation carbon emissions. Nat. Commun. 2018, 9, 536. [Google Scholar] [CrossRef]
- Tavares, P.A.; Ferreira, J.; Silva, C.V.J.; Berenguer, E.; Barlow, J. Exploring the Role of Deforestation and Cropland Expansion in Driving a Fire-Transition in the Brazilian Amazon. Land 2022, 11, 2274. [Google Scholar] [CrossRef]
- Liu, Y.; Goodrick, S.; Heilman, W. Wildland fire emissions, carbon, and climate: Wildfire–climate interactions. For. Ecol. Manag. 2014, 317, 80–96. [Google Scholar] [CrossRef]
- Faria, B.D.; Marano, G.; Piponiot, C.; Silva, C.; Dantas, V.; Rattis, L.; Rech, A.; Collalti, A. Model-Based Estimation of Amazonian Forests Recovery Time after Drought and Fire Events. Forests 2020, 12, 8. [Google Scholar] [CrossRef]
- Balch, J.; Brando, P.; Nepstad, D.; Coe, M.; Silvério, D.; Massad, T.; Davidson, E.; Lefebvre, P.; Oliveira-Santos, C.; Silva, W.; et al. The Susceptibility of Southeastern Amazon Forests to Fire: Insights from a Large-Scale Burn Experiment. BioScience 2015, 65, 893–905. [Google Scholar] [CrossRef]
- Hu, X.; Zhang, P.; Ban, Y. Large-scale burn severity mapping in multispectral imagery using deep semantic segmentation models. ISPRS J. Photogramm. Remote Sens. 2023, 196, 228–240. [Google Scholar] [CrossRef]
- Chuvieco, E.; Mouillot, F.; Werf, G.; San, J.; Tanase, M.; Koutsias, N.; García, M.; Yebra, M.; Padilla, M.; Gitas, I.; et al. Historical background and current developments for mapping burned area from satellite Earth observation. Remote Sens. Environ. 2019, 225, 45–64. [Google Scholar] [CrossRef]
- Roy, D.; Boschetti, L.; Trigg, S. Remote sensing of fire severity: Assessing the performance of the normalized burn ratio. IEEE Geosci. Remote Sens. Lett. 2006, 3, 112–116. [Google Scholar] [CrossRef]
- Giglio, L.; Loboda, T.; Roy, D.; Quayle, B.; Justice, C. An active-fire based burned area mapping algorithm for the MODIS sensor. Remote Sens. Environ. 2009, 113, 408–420. [Google Scholar] [CrossRef]
- Schroeder, W.; Oliva, P.; Giglio, L.; Csiszar, I. The New VIIRS 375 m active fire detection data product: Algorithm description and initial assessment. Remote Sens. Environ. 2014, 143, 85–96. [Google Scholar] [CrossRef]
- Quintano, C.; Fernandez-Manso, A.; Fernández-Manso, O. Combination of Landsat and Sentinel-2 MSI data for initial assessing of burn severity. Int. J. Appl. Earth Obs. Geoinf. 2018, 64, 221–225. [Google Scholar] [CrossRef]
- Crowley, M.; Cardille, J.; White, J.; Wulder, M. Multi-sensor, multi-scale, Bayesian data synthesis for mapping within-year wildfire progression. Remote Sens. Lett. 2018, 10, 302. [Google Scholar] [CrossRef]
- Verbesselt, J.; Zeileis, A.; Herold, M. Near real-time disturbance detection using satellite image time series. Remote Sens. Environ. 2012, 123, 98–108. [Google Scholar] [CrossRef]
- Engelbrecht, J.; Theron, A.; Vhengani, L.; Kemp, J. A Simple Normalized Difference Approach to Burnt Area Mapping Using Multi-Polarisation C-Band SAR. Remote Sens. 2017, 9, 764. [Google Scholar] [CrossRef]
- Tanase, M.; Santoro, M.; Riva, J.; Perez-Cabello, F.; Toan, T.L. Sensitivity of X-, C-, and L-Band SAR Backscatter to Burn Severity in Mediterranean Pine Forests. IEEE Trans. Geosci. Remote Sens. 2010, 48, 3663–3675. [Google Scholar] [CrossRef]
- Reiche, J.; Mullissa, A.; Slagter, B.; Gou, Y.; Tsendbazar, N.E.; Odongo-Braun, C.; Vollrath, A.; Weisse, M.J.; Stolle, F.; Pickens, A.; et al. Forest disturbance alerts for the Congo Basin using Sentinel-1. Environ. Res. Lett. 2021, 16, 024005. [Google Scholar] [CrossRef]
- Bouvet, A.; Mermoz, S.; Ballère, M.; Koleck, T.; Le Toan, T. Use of the SAR Shadowing Effect for Deforestation Detection with Sentinel-1 Time Series. Remote Sens. 2018, 10, 1250. [Google Scholar] [CrossRef]
- Mermoz, S.; Bouvet, A.; Koleck, T.; Ballère, M.; Le Toan, T. Continuous Detection of Forest Loss in Vietnam, Laos, and Cambodia Using Sentinel-1 Data. Remote Sens. 2021, 13, 4877. [Google Scholar] [CrossRef]
- Doblas, J.; Reis, M.S.; Belluzzo, A.P.; Quadros, C.B.; Moraes, D.R.V.; Almeida, C.A.; Maurano, L.E.P.; Carvalho, A.F.A.; Sant’Anna, S.J.S.; Shimabukuro, Y.E. DETER-R: An Operational Near-Real Time Tropical Forest Disturbance Warning System Based on Sentinel-1 Time Series Analysis. Remote Sens. 2022, 14, 3658. [Google Scholar] [CrossRef]
- Mullissa, A.; Saatchi, S.; Silva, R.; Erickson, T.; Provost, N.; Osborn, F.; Ashary, A.; Moon, V.; Melling, D. LUCA: A Sentinel-1 SAR-Based Global Forest Land Use Change Alert. Remote Sens. 2024, 16, 2151. [Google Scholar] [CrossRef]
- Imperatore, P.; Azar, R.; Calò, F.; Stroppiana, D.; Brivio, P.; Lanari, R.; Pepe, A. Effect of the Vegetation Fire on Backscattering: An Investigation Based on Sentinel-1 Observations. IEEE J. Sel. Top. Appl. Earth Obs. Remote Sens. 2017, 10, 4478–4492. [Google Scholar] [CrossRef]
- Belenguer-Plomer, M.; Tanase, M.; Fernandez-Carrillo, A.; Chuvieco, E. Burned area detection and mapping using Sentinel-1 backscatter coefficient and thermal anomalies. Remote Sens. Environ. 2019, 233, 111345. [Google Scholar] [CrossRef]
- Ban, Y.; Zhang, P.; Nascetti, A.; Bevington, A.; Wulder, M. Near Real-Time Wildfire Progression Monitoring with Sentinel-1 SAR Time Series and Deep Learning. Sci. Rep. 2020, 10. [Google Scholar] [CrossRef]
- Jimeno-Llorente, L.; Marcos, E.; Fernandez-Guisuraga, J.M. The Effects of Fire Severity on Vegetation Structural Complexity Assessed Using SAR Data Are Modulated by Plant Community Types in Mediterranean Fire-Prone Ecosystems. Fire 2023, 6, 450. [Google Scholar] [CrossRef]
- Tanase, M.A.; Santoro, M.; Aponte, C.; de la Riva, J. Polarimetric Properties of Burned Forest Areas at C- and L-Band. IEEE J. Sel. Top. Appl. Earth Obs. Remote Sens. 2013, 7, 267–276. [Google Scholar] [CrossRef]
- Belenguer-Plomer, M.; Chuvieco, E.; Tanase, M. Temporal Decorrelation of C-Band Backscatter Coefficient in Mediterranean Burned Areas. Remote Sens. 2019, 11, 2661. [Google Scholar] [CrossRef]
- Bottani, M.; Ferro-Famil, L.; Doblas, J.; Mermoz, S.; Bouvet, A.; Koleck, T. Advanced Bayesian Method for Timely Small-Scale Forest Loss Detection in the Brazilian Amazon and Cerrado with Sentinel-1 Time-Series. Int. Arch. Photogramm. Remote Sens. Spat. Inf. Sci. 2024, XLVIII-3-2024, 43–49. [Google Scholar] [CrossRef]
- Bottani, M.; Ferro-Famil, L. Bayesian Approach for Deforestation Detection from Sentinel-1 Polarimetric SAR Time Series. In Proceedings of the GRETSI 2025, Strasbourg, France, 25–29 August 2025. [Google Scholar]
- Cancio, A.; Guerrero-Moreno, M.; da Silva, E.C.; Oliveira, F.A.; Dias-Silva, K.; Koura Jr, J.F.; Vieira, T.A.; Calvao, L.; Juen, L.; Oliveira-Junior, J.M.B. The impacts of fire use in the Brazilian Amazon: A bibliometric analysis. Int. J. Wildland Fire 2025, 34, WF24182. [Google Scholar] [CrossRef]
- Veríssimo, A.; Barreto, P.; Mattos, M.; Tarifa, R.; Uhl, C. Logging impacts and prospects for sustainable forest management in an old Amazonian frontier: The case of Paragominas. For. Ecol. Manag. 1992, 55, 169–199. [Google Scholar] [CrossRef]
- Nunes, S.; Barlow, J.; Gardner, T.; Siqueira, J.; Sales, M.; Jr, C.S. A 22 year assessment of deforestation and restoration in riparian forests in the eastern Brazilian Amazon. Environ. Conserv. 2014, 1, 193–203. [Google Scholar] [CrossRef]
- Tritsch, I.; Sist, P.; Narvaes, I.; Mazzei, L.; Blanc, L.; Bourgoin, C.; Cornu, G.; Gond, V. Multiple Patterns of Forest Disturbance and Logging Shape Forest Landscapes in Paragominas, Brazil. Forests 2016, 7, 315. [Google Scholar] [CrossRef]
- Mattos, M.; Uhl, C. Economic and ecological perspectives on ranching in the Eastern Amazon. World Dev. 1994, 22, 145–158. [Google Scholar] [CrossRef]
- Toniolo, A.; Uhl, C. Economic and ecological perspectives on agriculture in the Eastern Amazon. World Dev. 1995, 23, 959–973. [Google Scholar] [CrossRef]
- Piketty, M.; Poccard-Chapuis, R.; Drigo, I.; Coudel, E.; Plassin, S.; Laurent, F.; Thalês, M. Multi-level Governance of Land Use Changes in the Brazilian Amazon: Lessons from Paragominas, State of Pará. Forests 2015, 6, 1516–1536. [Google Scholar] [CrossRef]
- Viana, C.; Coudel, E.; Barlow, J.; Ferreira, J.; Gardner, T.; Parry, L. How Does Hybrid Governance Emerge? Role of the Elite in Building a Green Municipality in the Eastern Brazilian Amazon. Environ. Policy Gov. 2016, 26, 337–350. [Google Scholar] [CrossRef]
- Uhl, C.; Buschbacher, R.J.; Serrão, E.A.S. Abandoned pastures in eastern Amazonia. I. Patterns of plant succession. J. Ecol. 1988, 76, 663–681. [Google Scholar] [CrossRef]
- Osis, R.; Laurent, F.; René, P.C. Spatial determinants and future land use scenarios of Paragominas municipality, an old agricultural frontier in Amazonia. J. Land Use Sci. 2019, 14, 258–279. [Google Scholar] [CrossRef]
- Laurent, F.; René, P.C.; Plassin, S.; Martinez, G. Soil texture derived from topography in North-eastern Amazonia. J. Maps 2016, 13, 109–115. [Google Scholar] [CrossRef]
- Mistry, J.; Bilbao, B.; Berardi, A. Community owned solutions for fire management in tropical ecosystems: Case studies from Indigenous communities of South America. Philos. Trans. R. Soc. Biol. Sci. 2016, 371, 20150174. [Google Scholar] [CrossRef] [PubMed]
- Maclean, K.; Hankins, D.L.; Christianson, A.C.; Oliveras, I.; Bilbao, B.A.; Costello, O.; Langer, E.; Robinson, C.J. Revitalising Indigenous cultural fire practice: Benefits and partnerships. Trends Ecol. Evol. 2023, 38, 899–902. [Google Scholar] [CrossRef]
- Adams, R.P.; MacKay, D.J. Bayesian Online Changepoint Detection. arXiv 2007, arXiv:0710.3742. [Google Scholar] [CrossRef]
- Giglio, L.; Boschetti, L.; Roy, D.; Humber, M.; Justice, C. The Collection 6 MODIS burned area mapping algorithm and product. Remote Sens. Environ. 2018, 217, 72–85. [Google Scholar] [CrossRef] [PubMed]
- Arino, O.; Casadio, S.; Serpe, D. Global night-time fire season timing and fire count trends using the ATSR instrument series. Remote Sens. Environ. 2012, 116, 226–238. [Google Scholar] [CrossRef]
Disclaimer/Publisher’s Note: The statements, opinions and data contained in all publications are solely those of the individual author(s) and contributor(s) and not of MDPI and/or the editor(s). MDPI and/or the editor(s) disclaim responsibility for any injury to people or property resulting from any ideas, methods, instructions or products referred to in the content. |
© 2025 by the authors. Licensee MDPI, Basel, Switzerland. This article is an open access article distributed under the terms and conditions of the Creative Commons Attribution (CC BY) license (https://creativecommons.org/licenses/by/4.0/).