
Time-Series InSAR Monitoring of Permafrost-Related Surface Deformation at Tiksi Airport: Impacts of Climate Warming and Coastal Erosion on the Northernmost Siberian Mainland

 , , , and
Abstract
1. Introduction
2. Materials and Methods
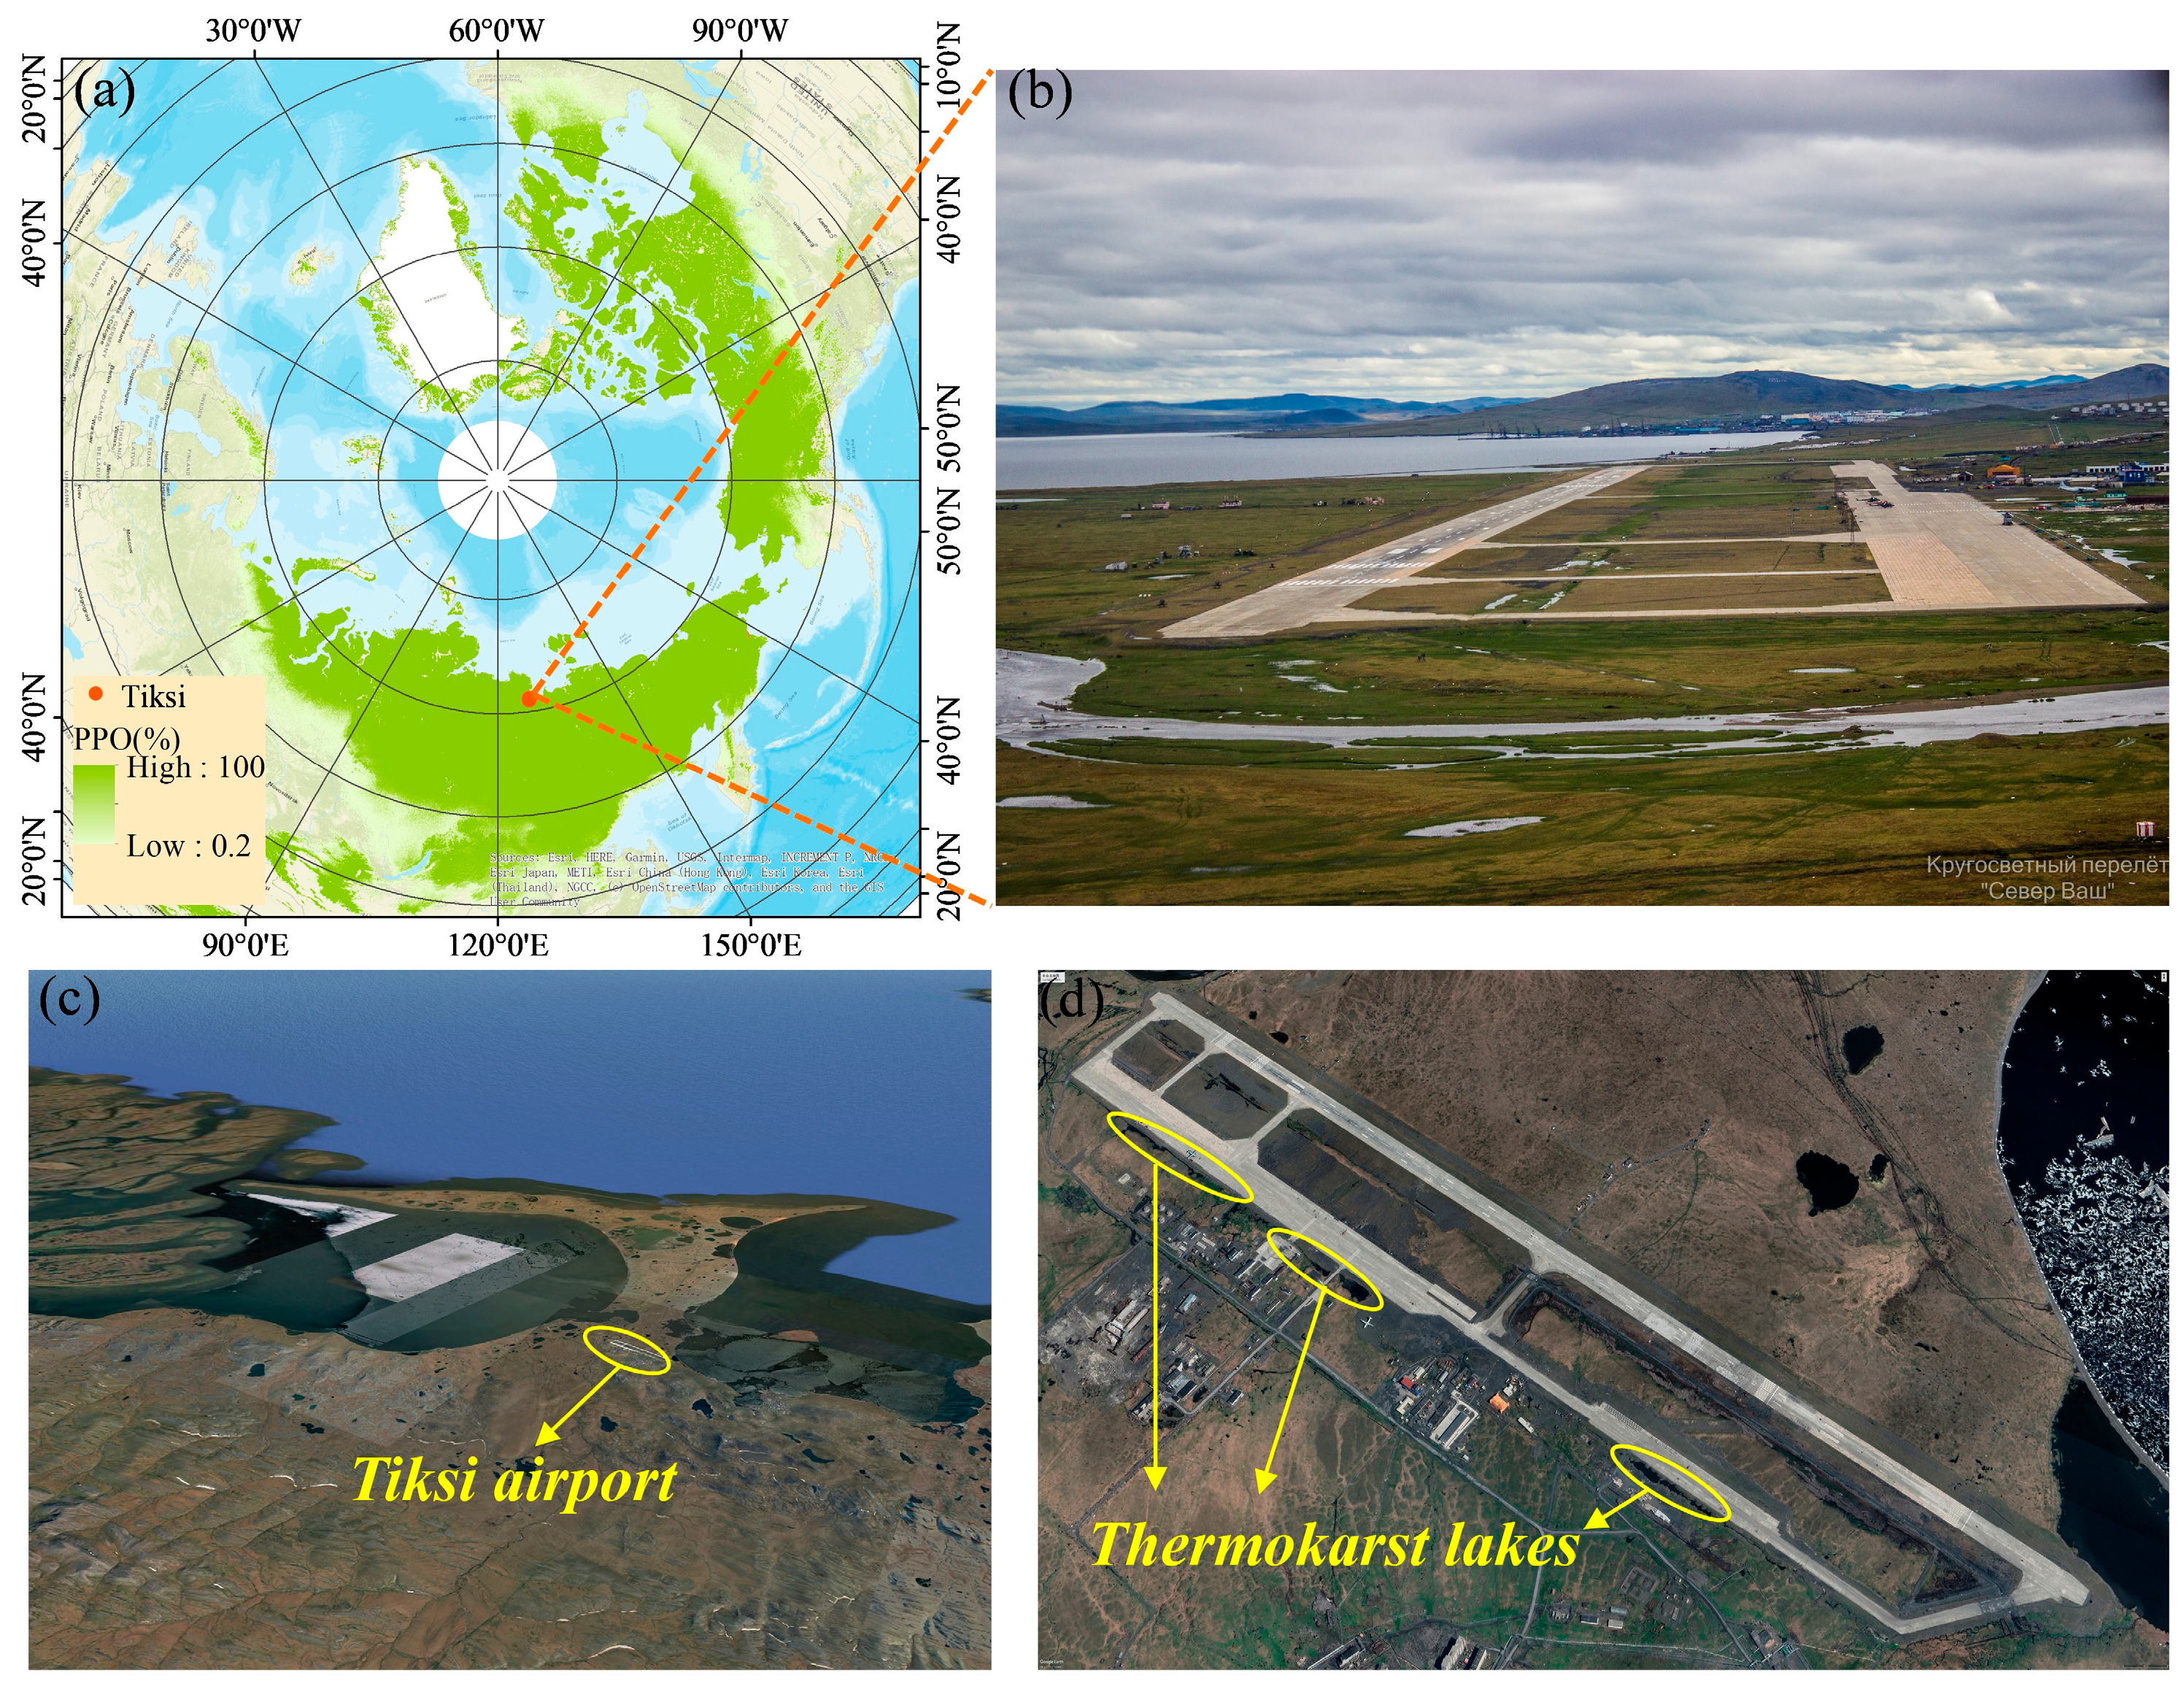
2.1. Research Area
2.2. Data
2.2.1. SAR Data
2.2.2. DEM Data
2.2.3. Landsat Data
2.2.4. ALT Data
2.2.5. Meteorological Data
2.3. Methods
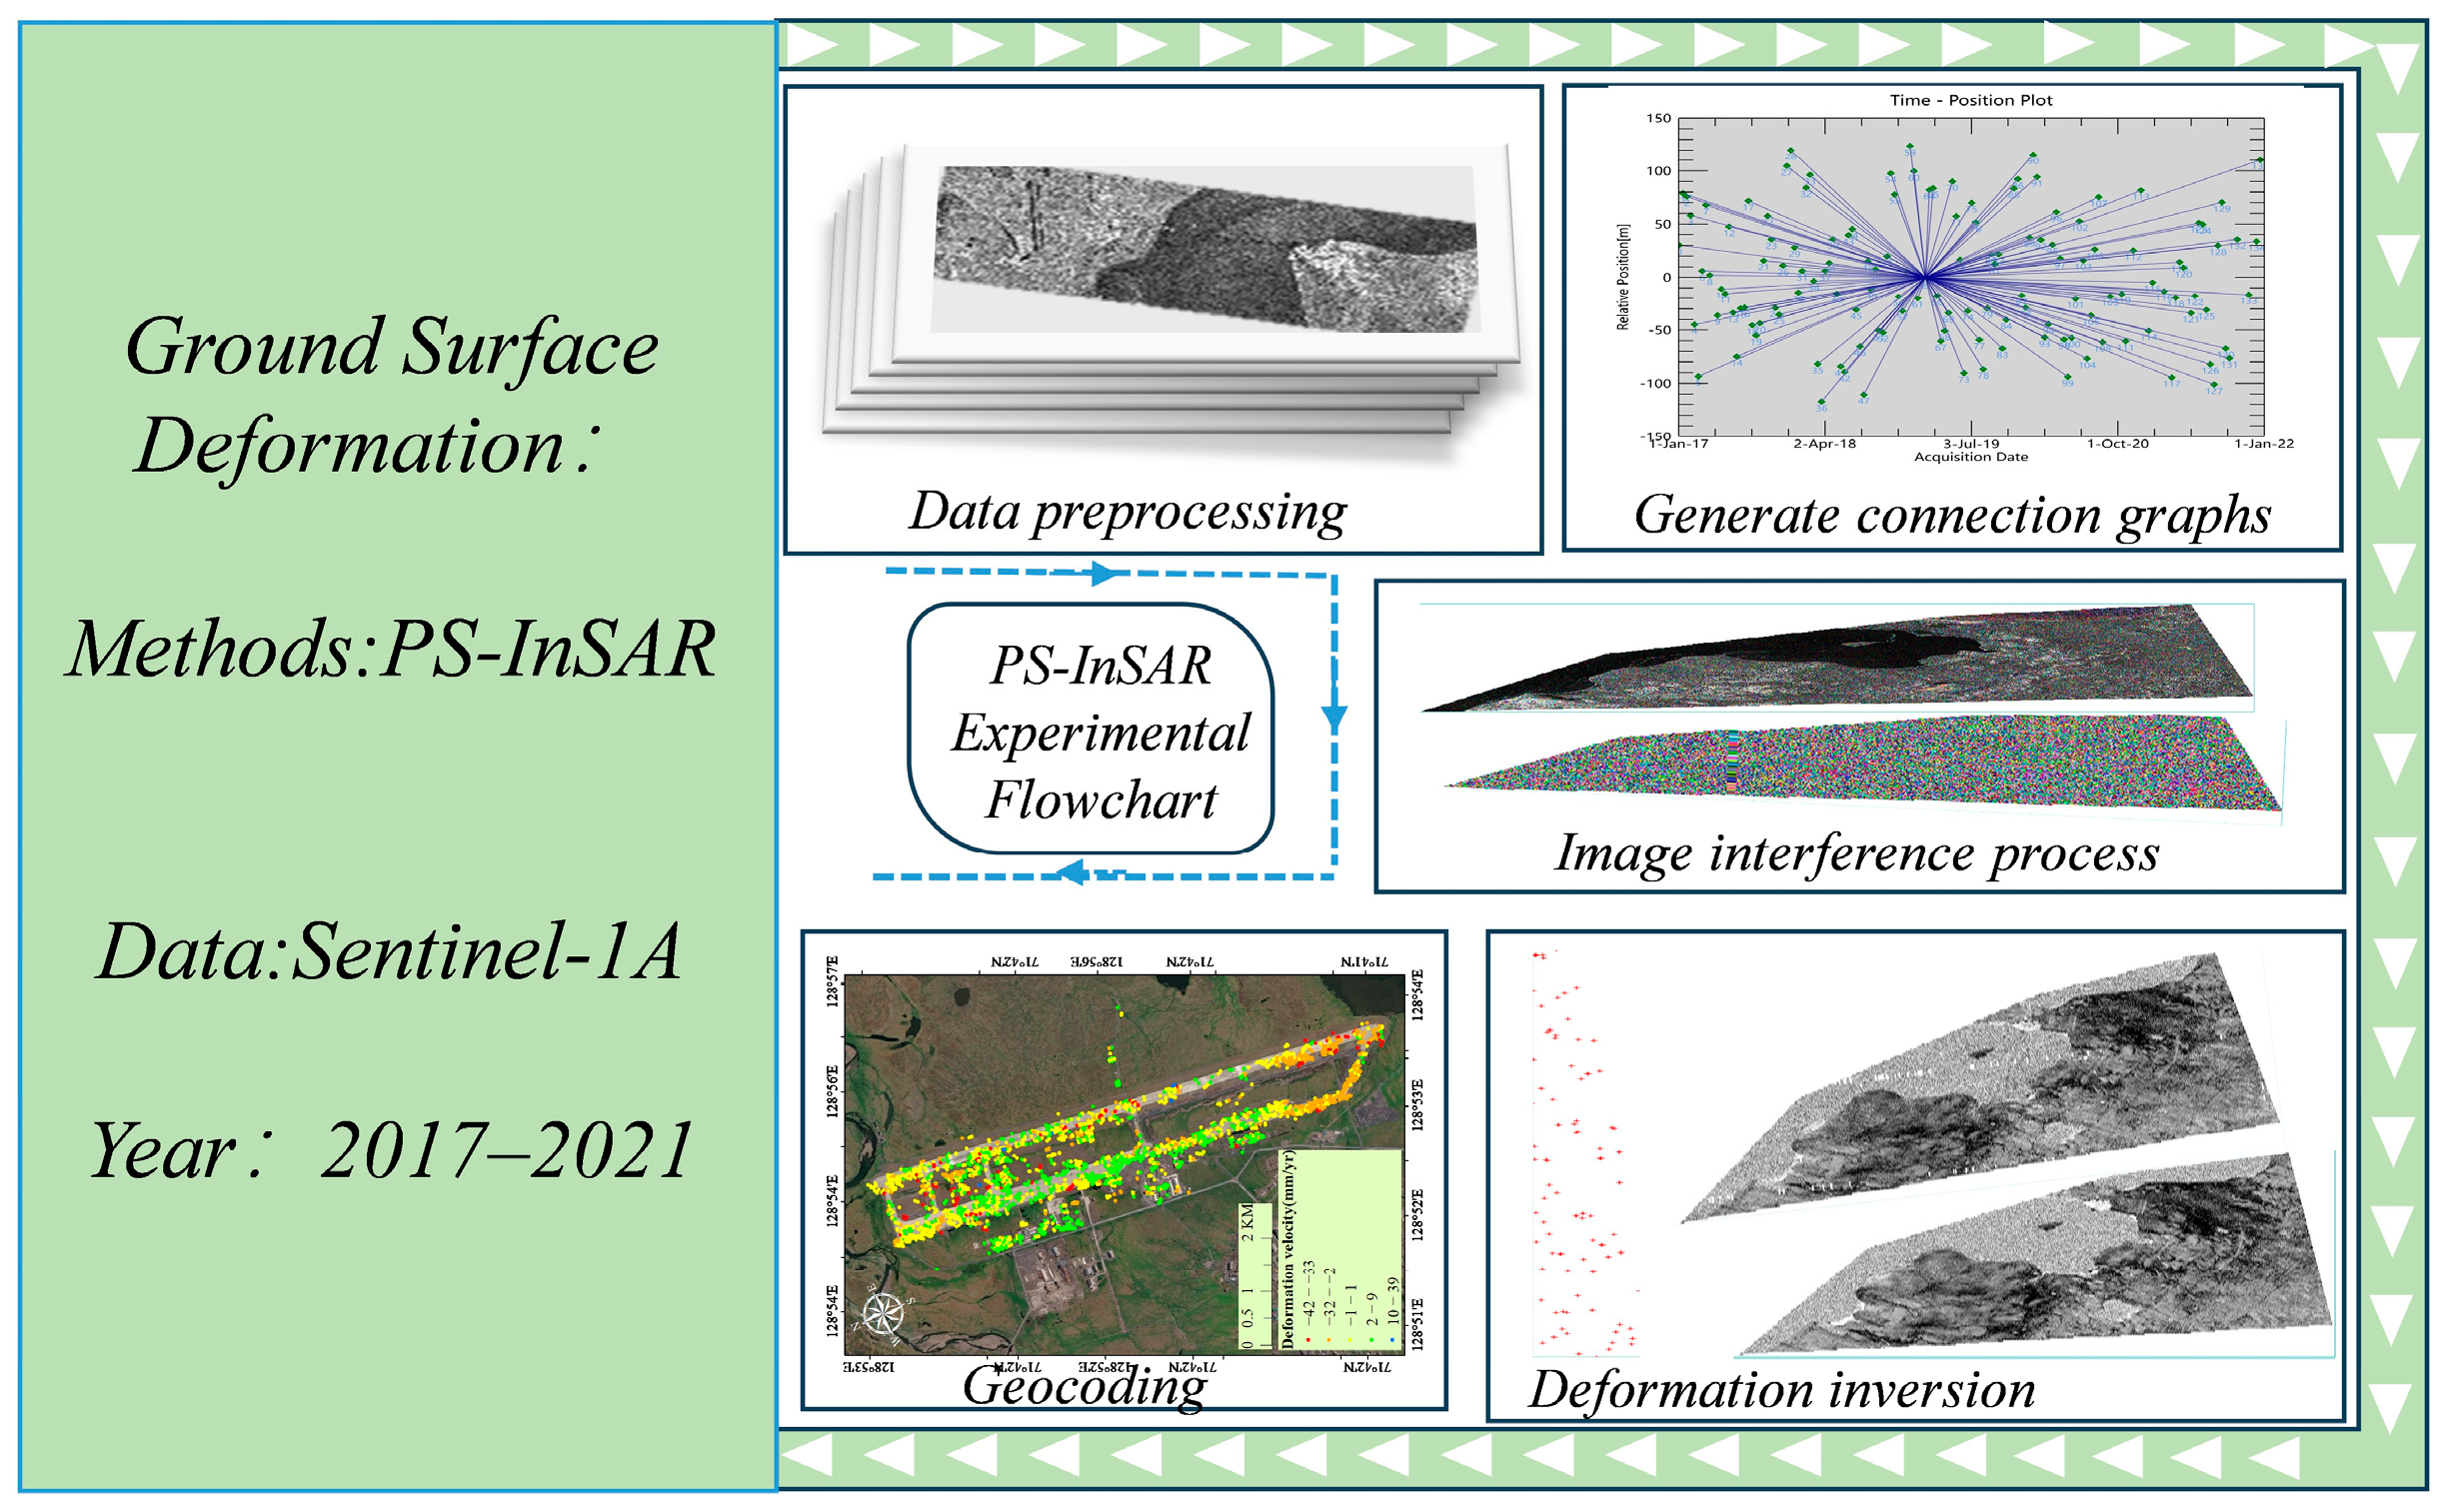
2.3.1. PS-InSAR
- 1.
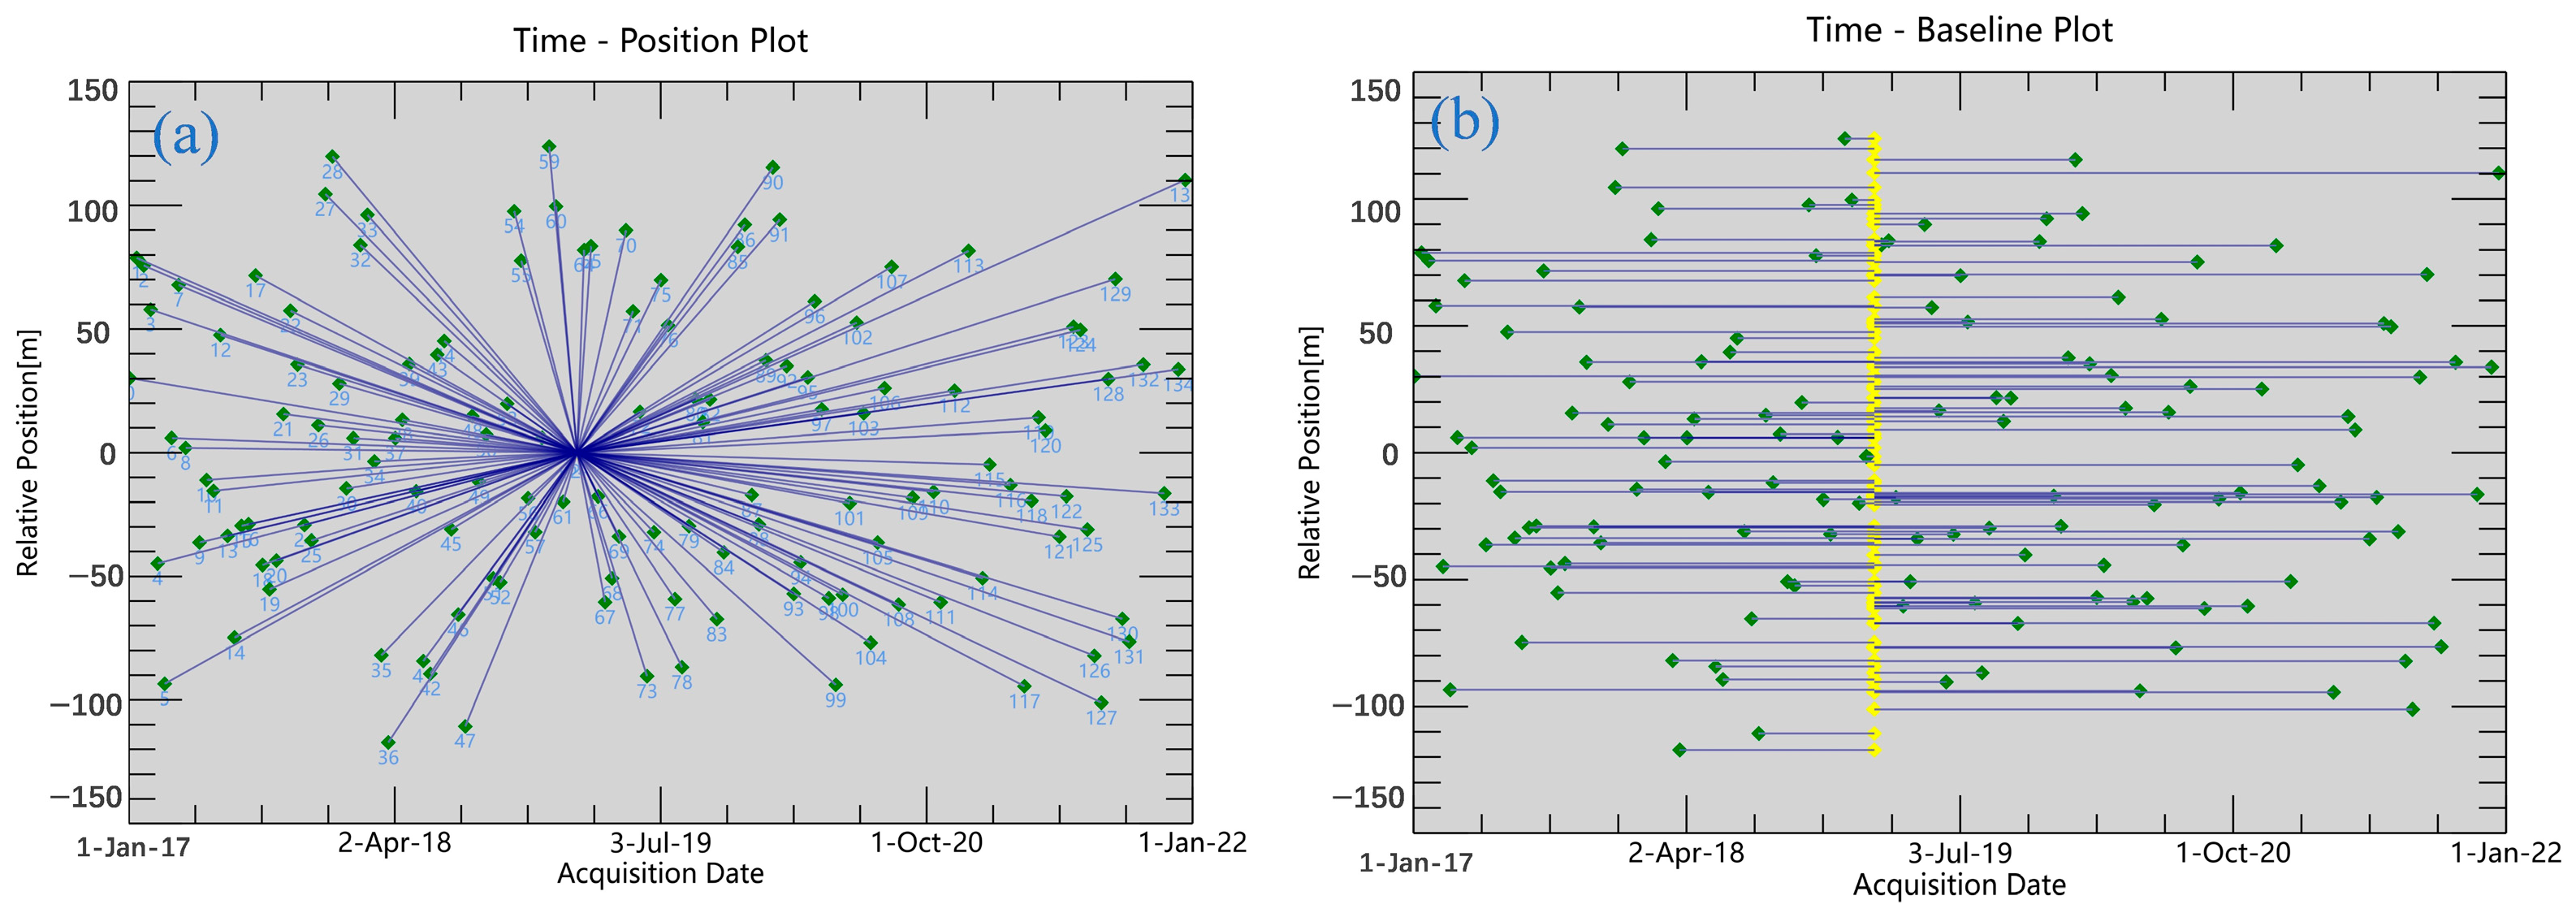
- Generate connection graphs: The process of generating a connection graph in PS-InSAR involves selecting suitable image pairs for interferometric processing. To minimize the impact of temporal and spatial baselines on coherence, PS-InSAR selects image pairs that are temporally close and spatially proximate (Figure 3). The connection graph typically uses thresholds for temporal and spatial baselines to restrict the selection of image pairs, ensuring that the generated interferograms have high coherence.
- 2.
- Interference process: The interferogram generation process involves calculating the phase difference between SAR images acquired at different times to create interferograms. The specific steps are as follows: first, precisely align the SAR images acquired at different times (Registration); then, calculate the phase difference of the aligned SAR images to generate interferograms (Interferogram Generation); next, remove the phase variations caused by Earth’s curvature (Flat-Earth Removal); finally, use an external Digital Elevation Model (DEM) to remove the phase variations caused by topography (Topographic Phase Removal).
- 3.
- First step of inversion: The purpose of the first inversion is to extract the phase time series for each pixel and identify coherent points (PS points). The specific steps are as follows: first, perform time series analysis for each pixel to calculate the phase values at various time points; then, through coherence analysis and phase stability detection, select stable coherent points, with results generally considered reliable if the coherence is greater than 0.5.
- 4.
- Second step of inversion: The purpose of this step is to extract surface deformation information from the phase time series of PS points. The specific steps are as follows: first, perform phase unwrapping to obtain continuous phase change values; then, remove the atmospheric effects on the phase; finally, extract surface deformation information from the phase time series with the atmospheric effects removed (Deformation Inversion).
- 5.
- Geocoding: Geocoding is the process of converting interferograms and inversion results from the radar coordinate system to the geographic coordinate system. The specific steps are as follows: first, use external DEM and satellite orbit information for coordinate transformation to convert radar coordinates to geographic coordinates; then, perform geometric correction on the converted images to ensure they align with the actual geographic locations; finally, overlay the corrected deformation map with geographic reference images to facilitate further analysis and interpretation. Because the deformation process of permafrost is a freezing and thawing process, we transform the deformation in the LOS direction to the vertical direction [28]:
2.3.2. Evaluation of Theoretical Precision
2.3.3. LST Inversion
3. Results
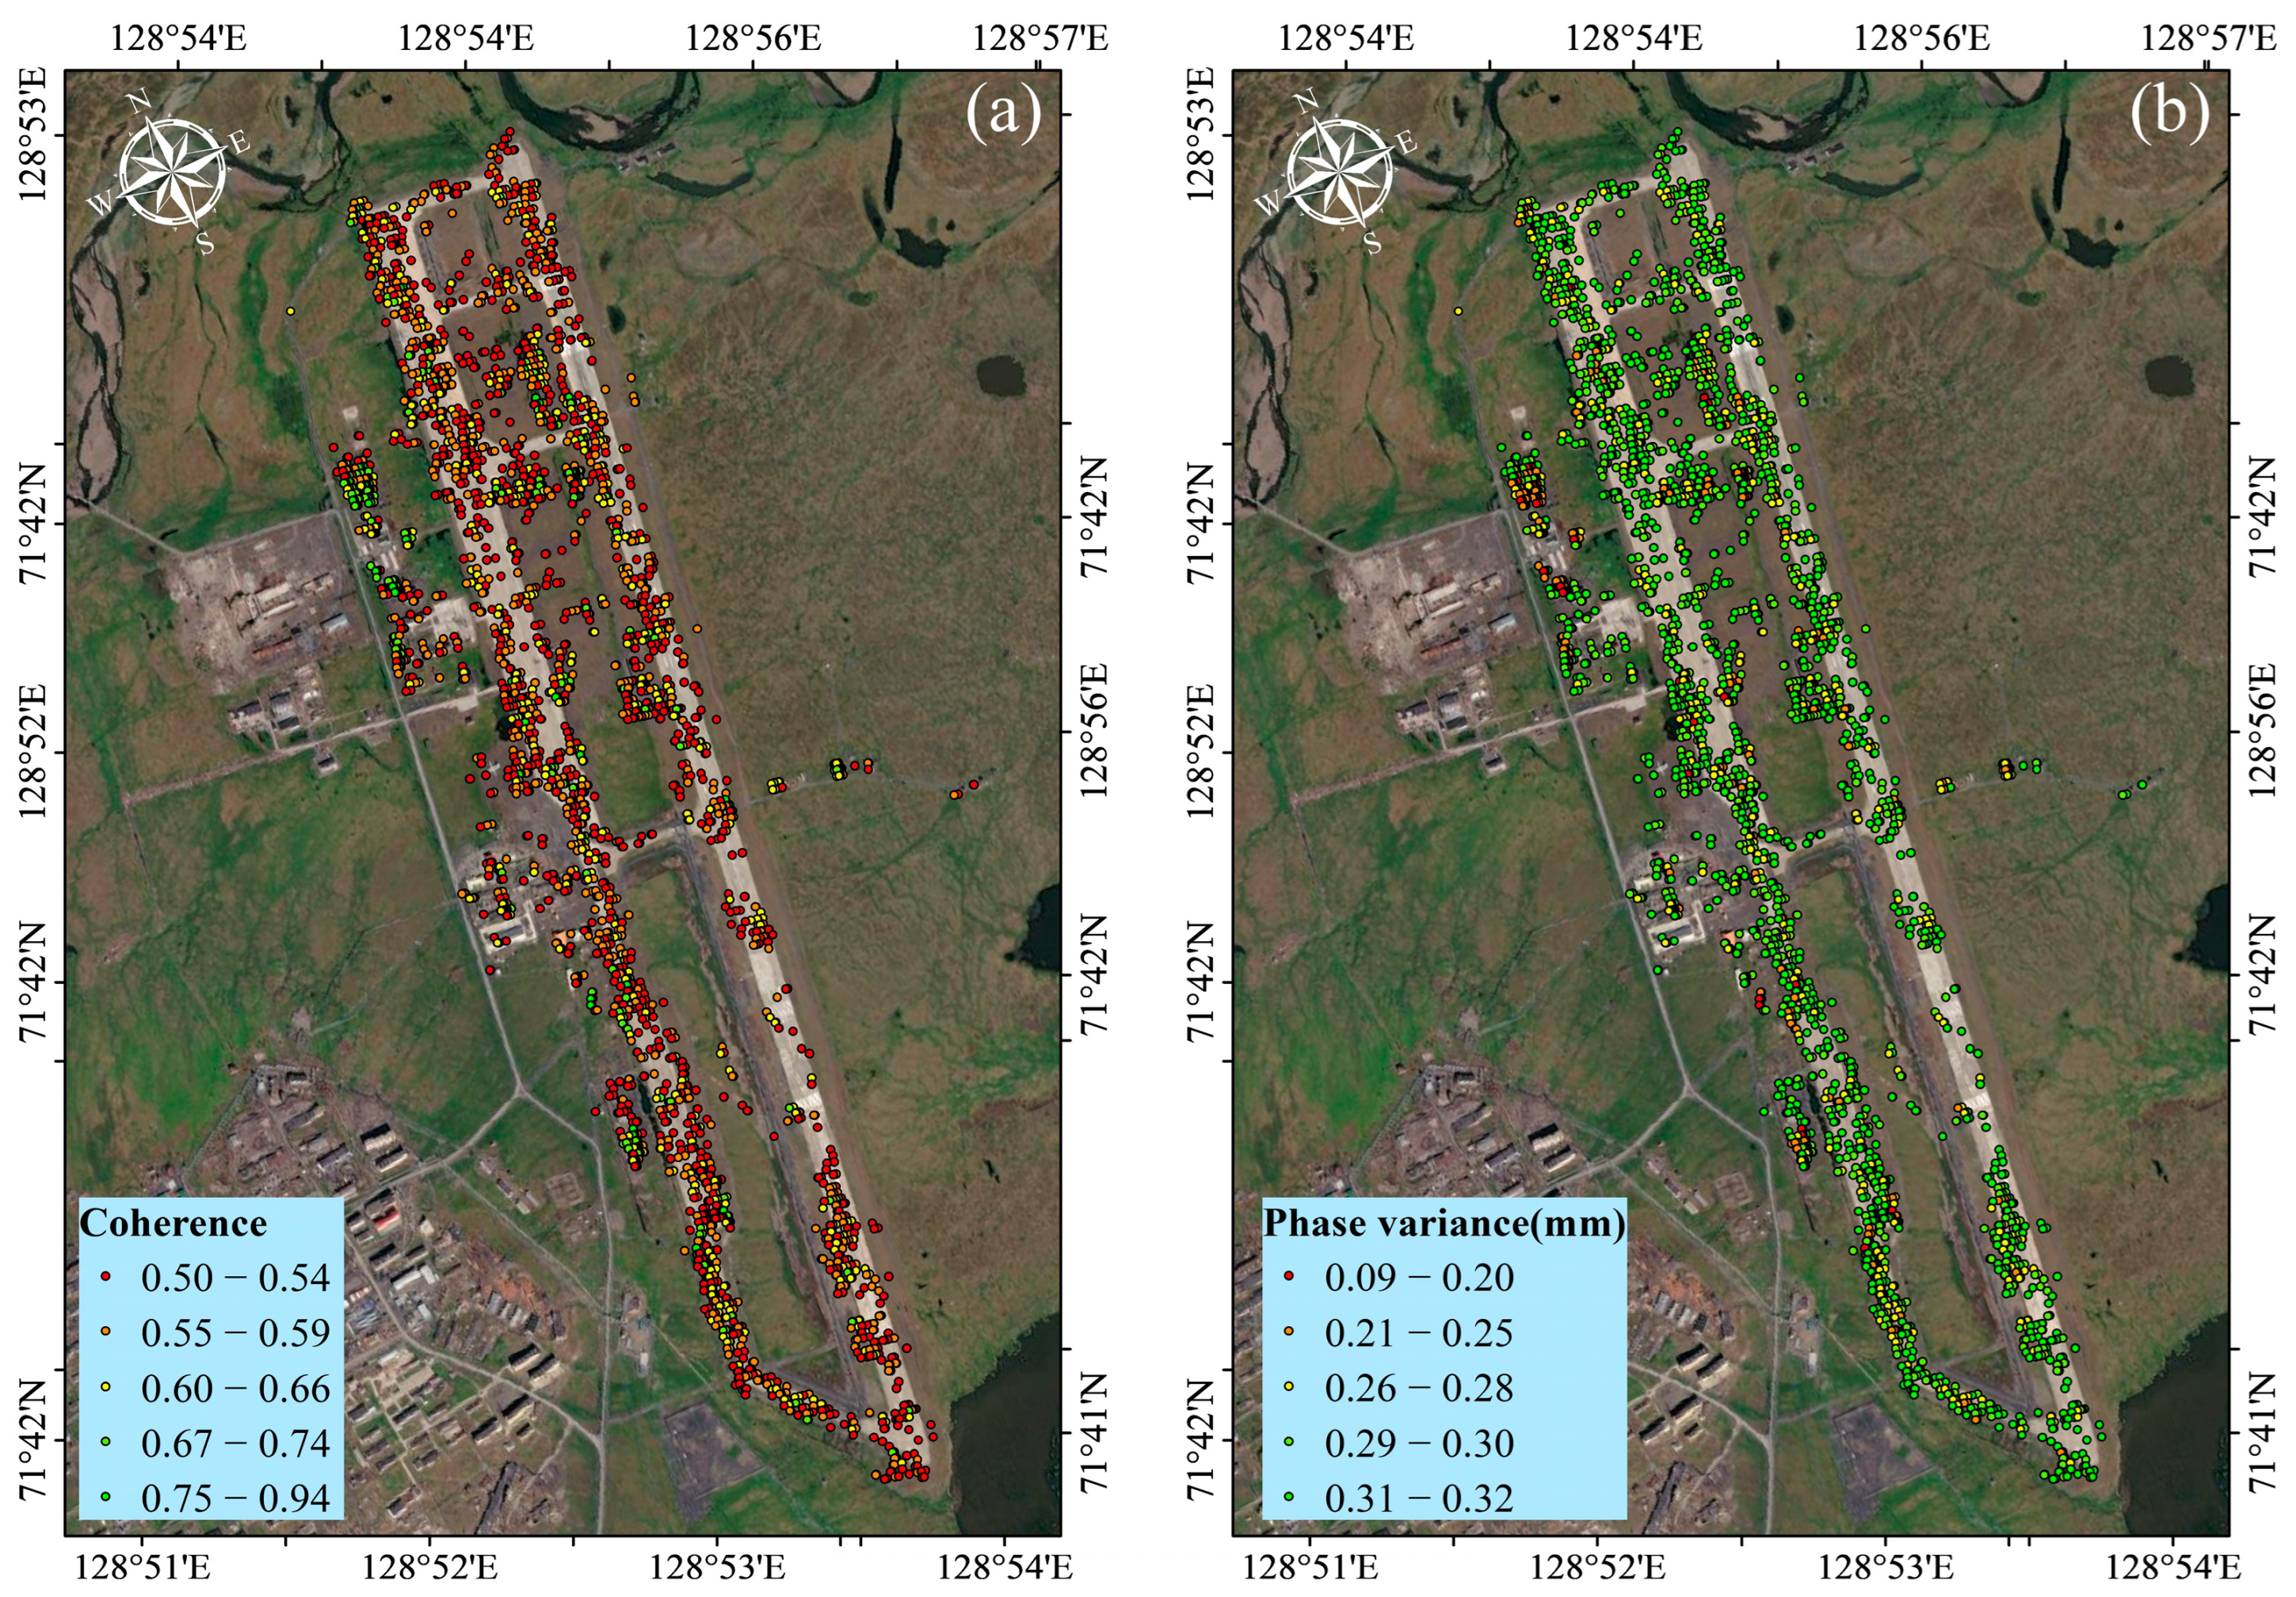
3.1. PS-InSAR Accuracy Verification
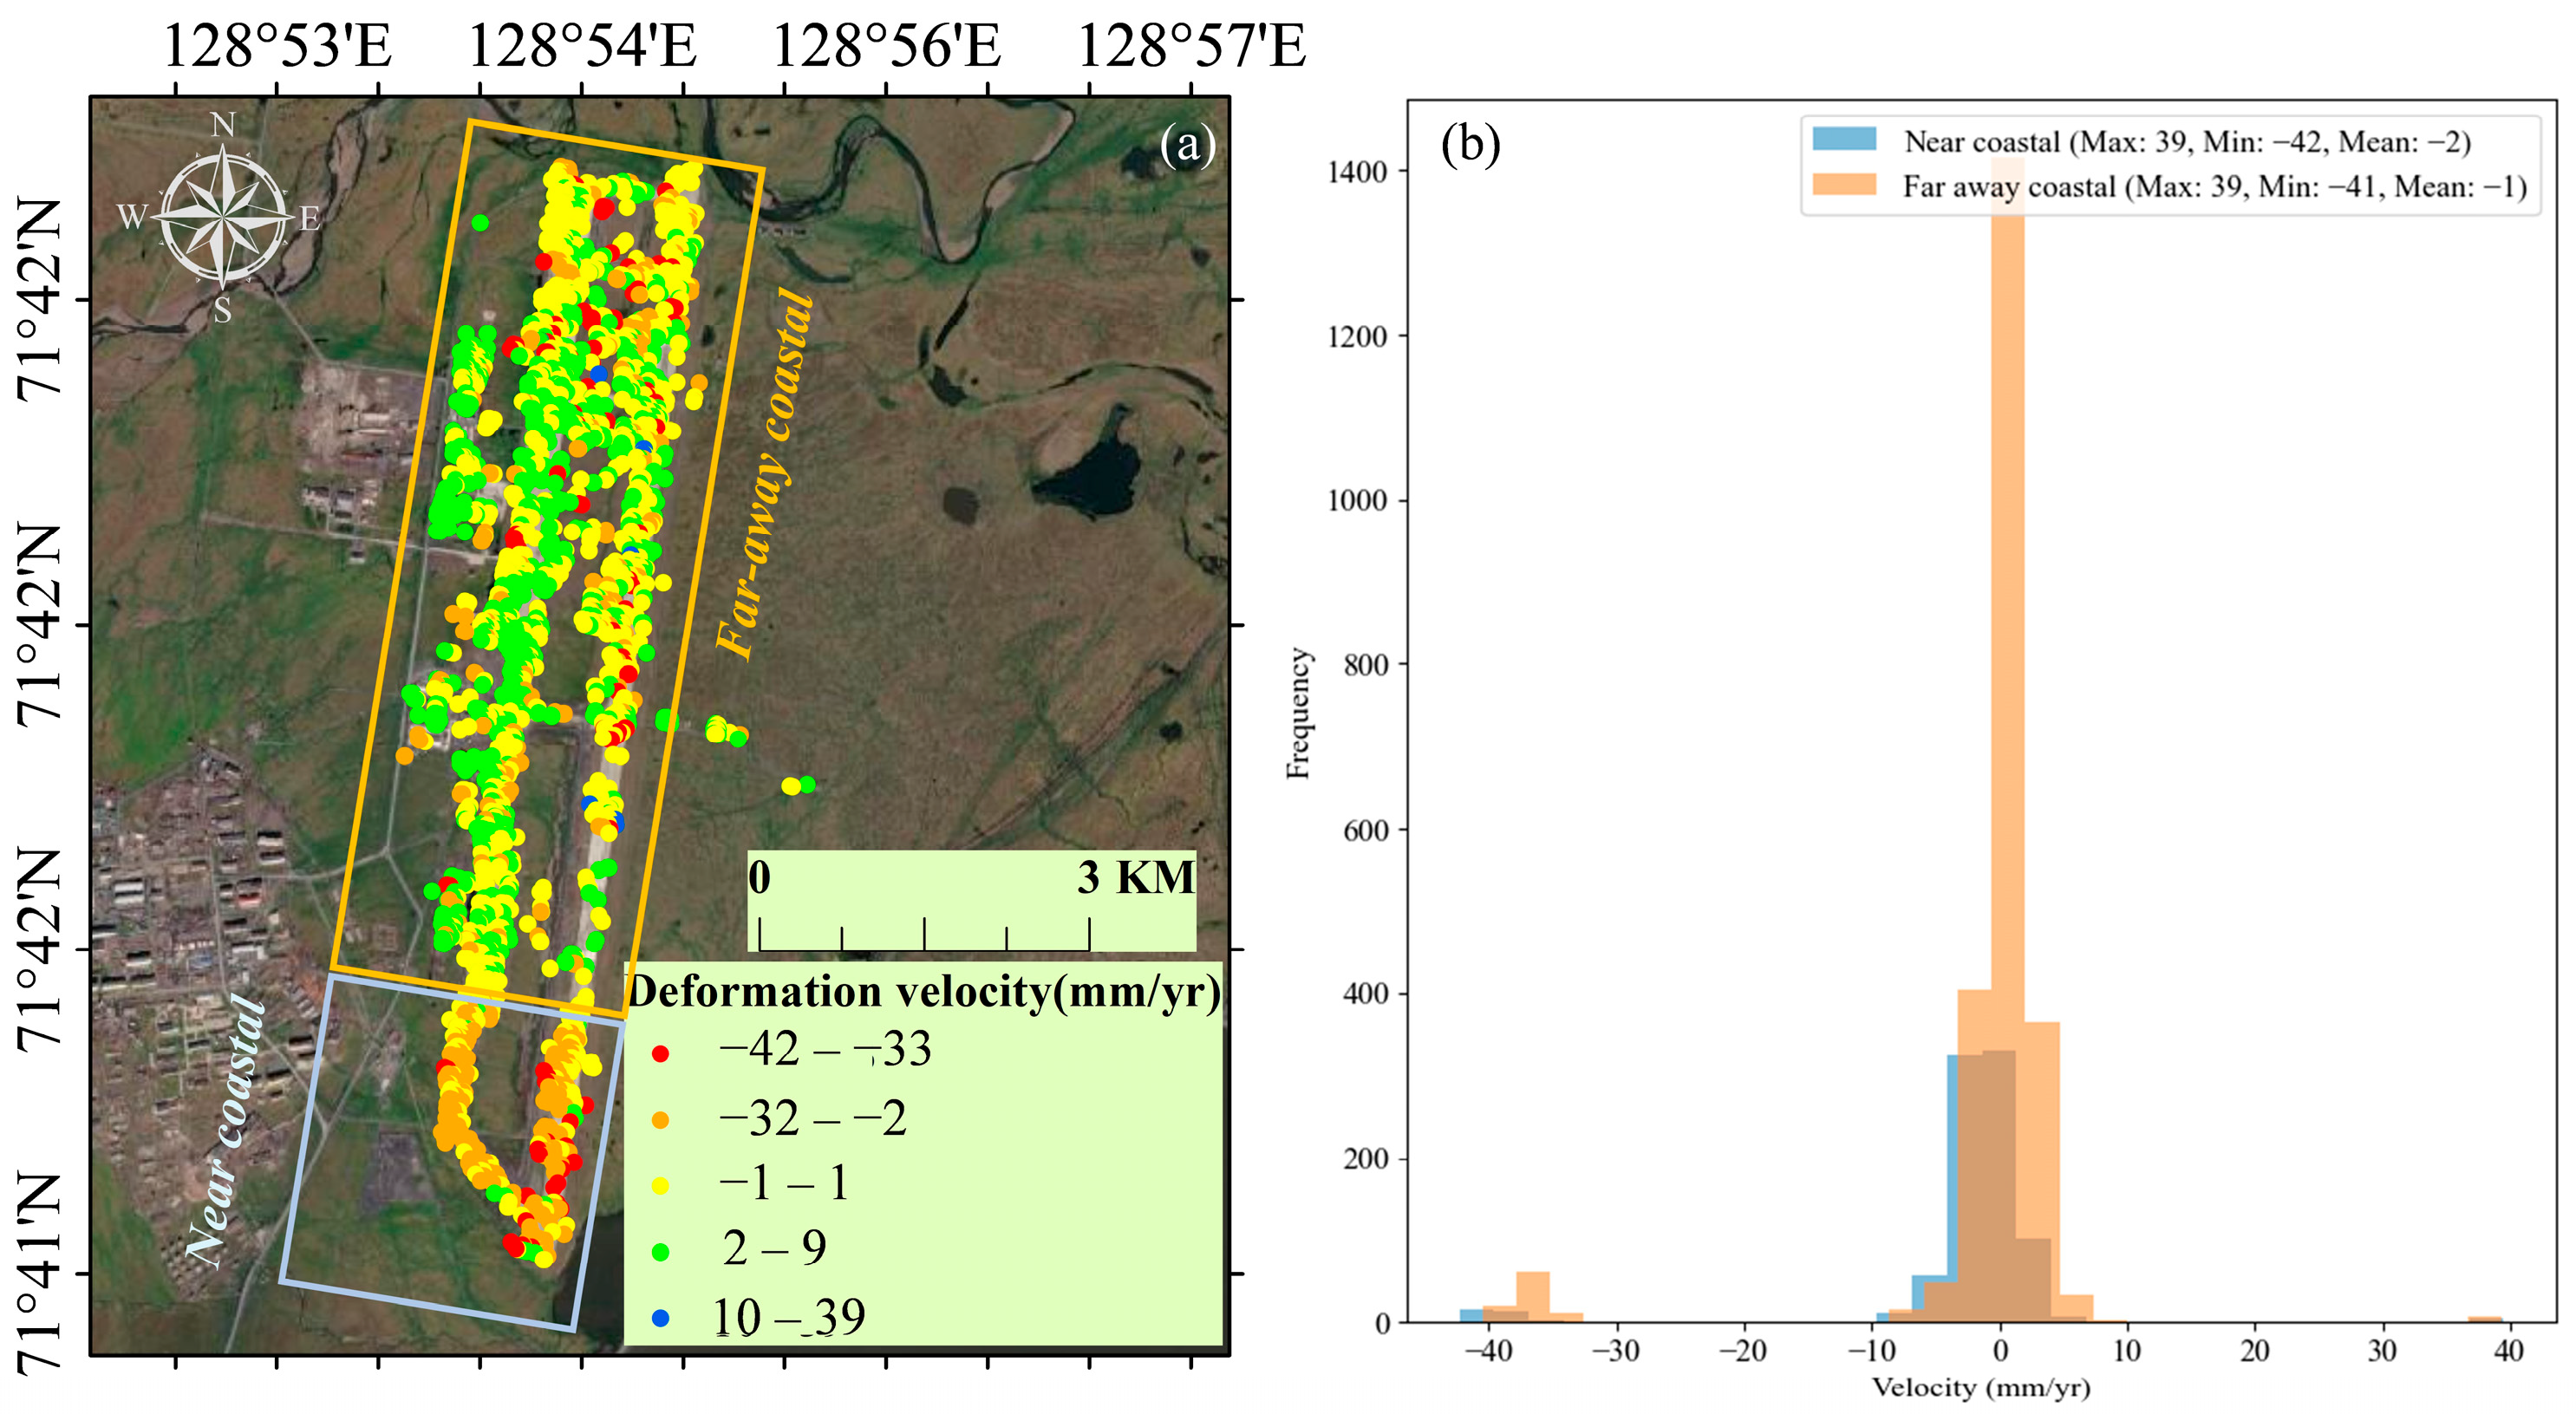
3.2. Spatial Variation of Ground Surface Deformation
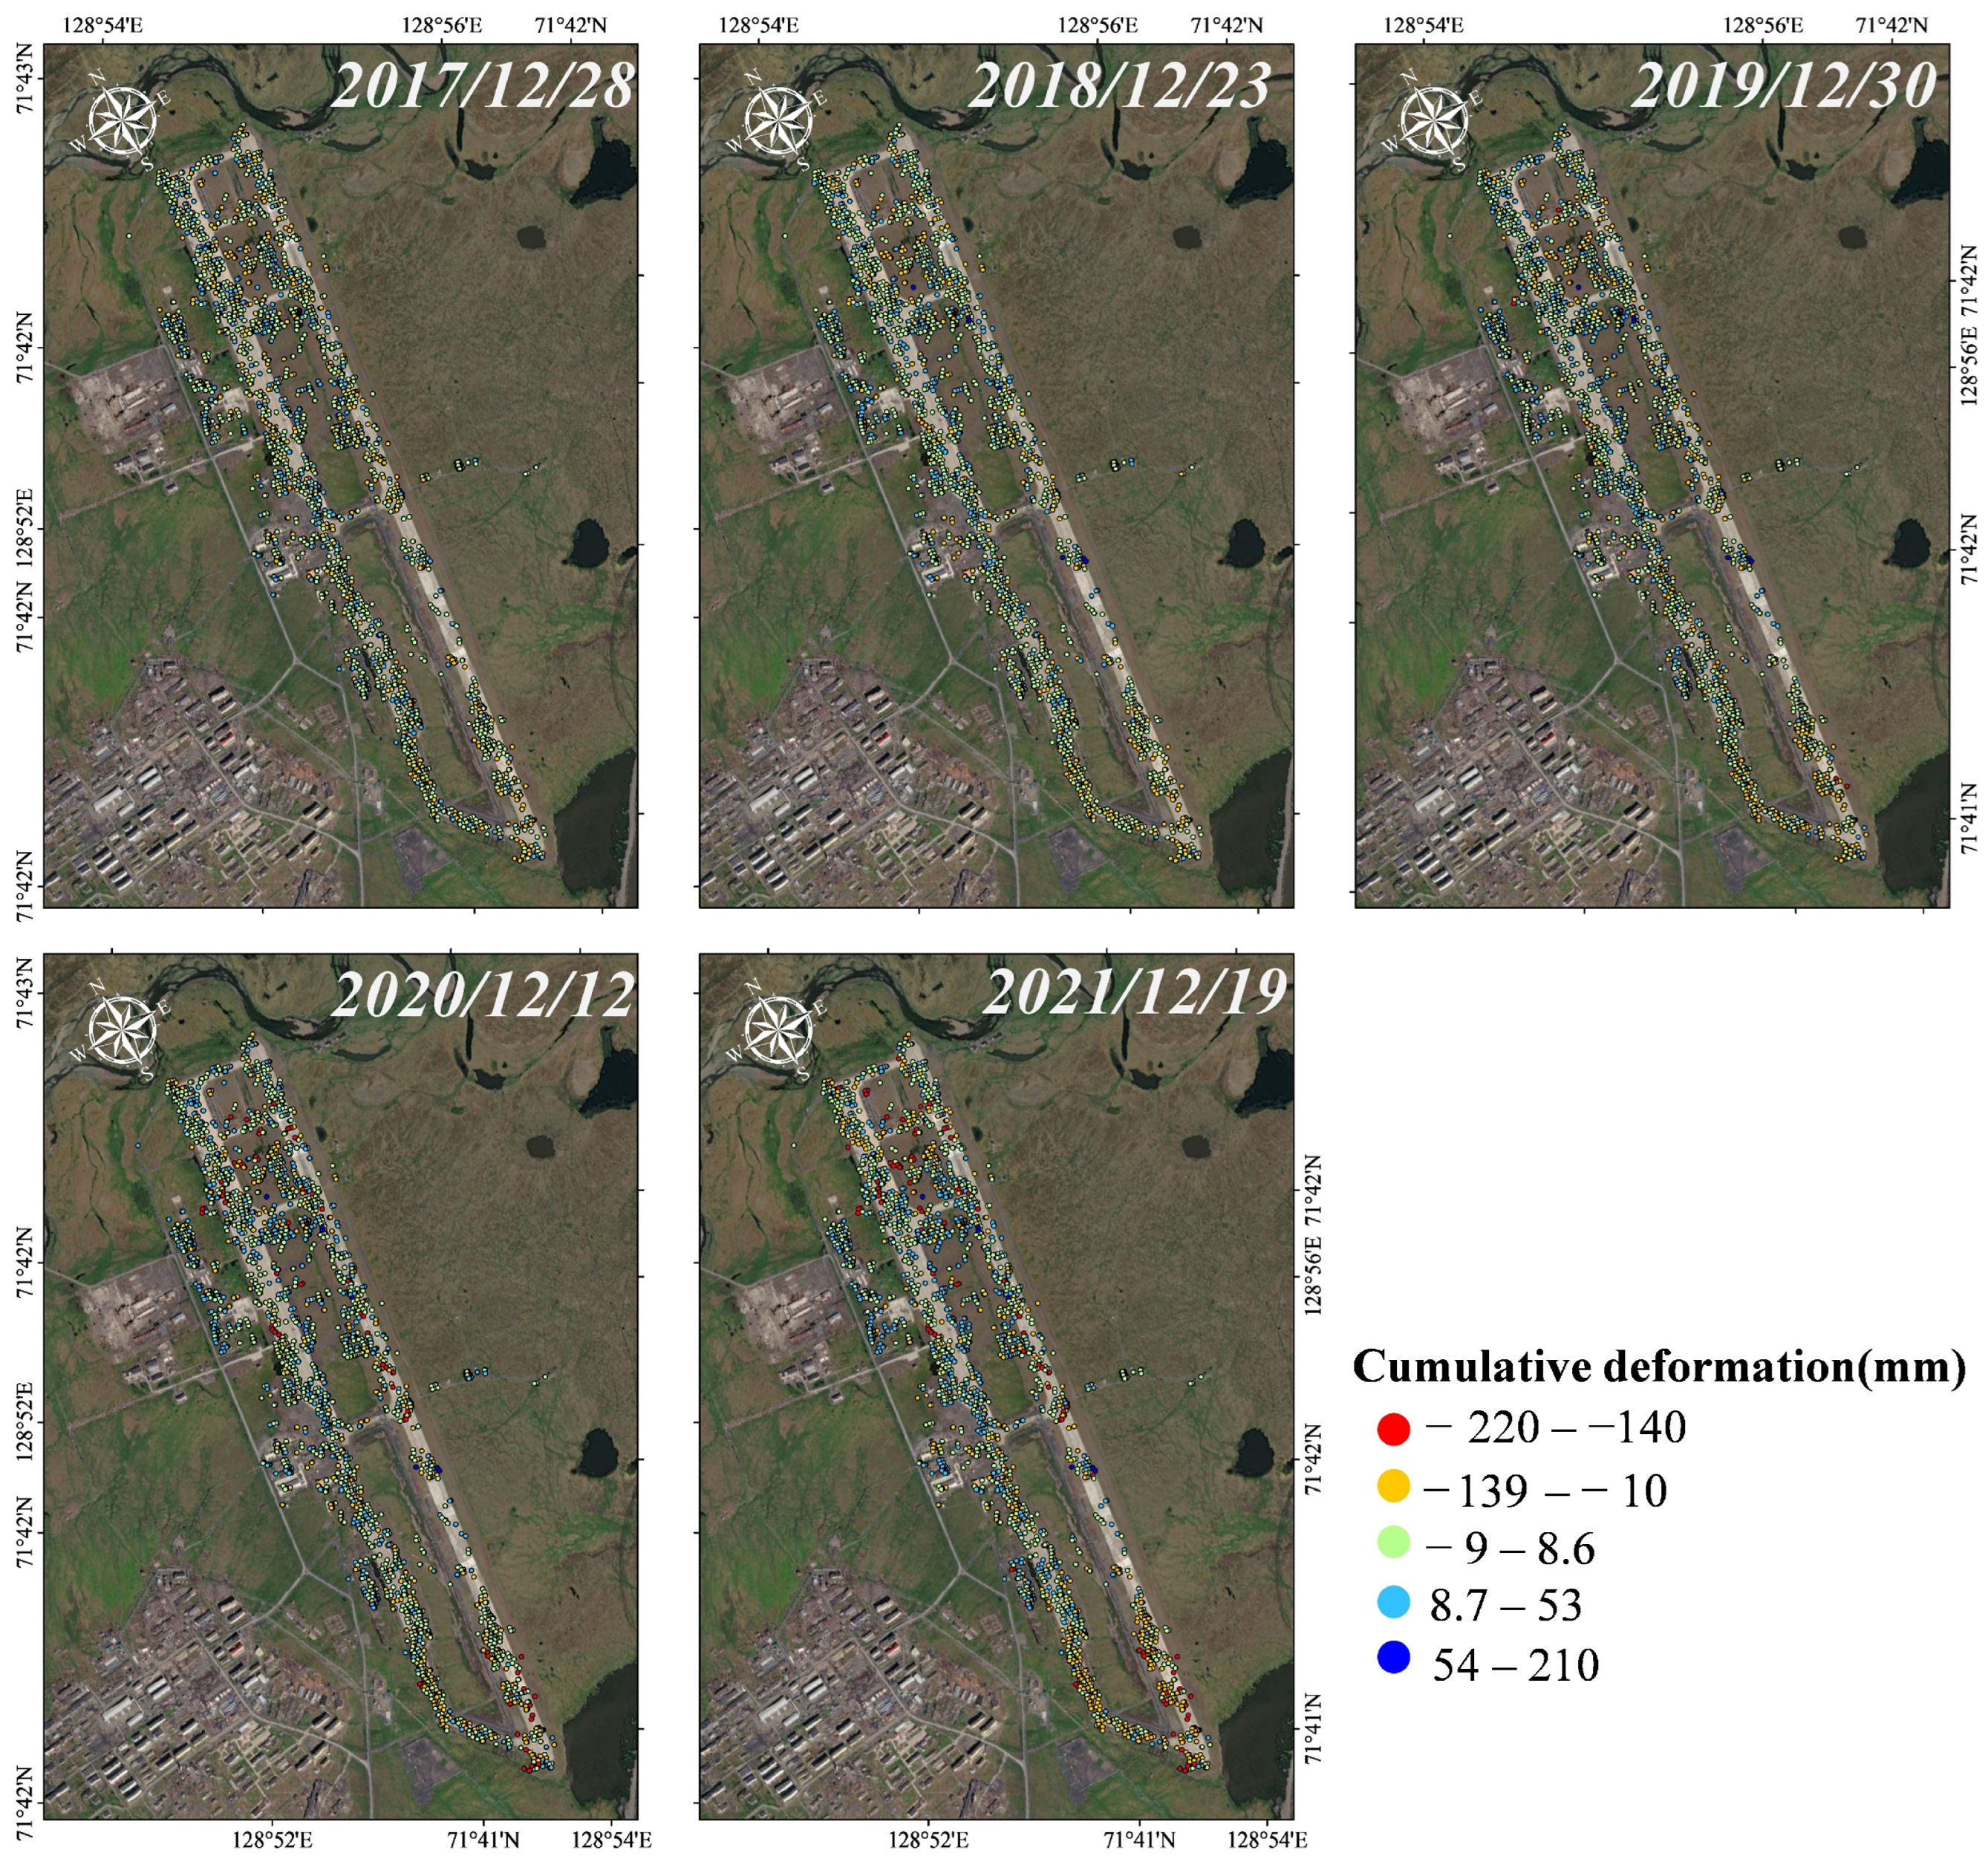
3.3. Temporal Variation of Ground Surface Deformation
4. Discussion
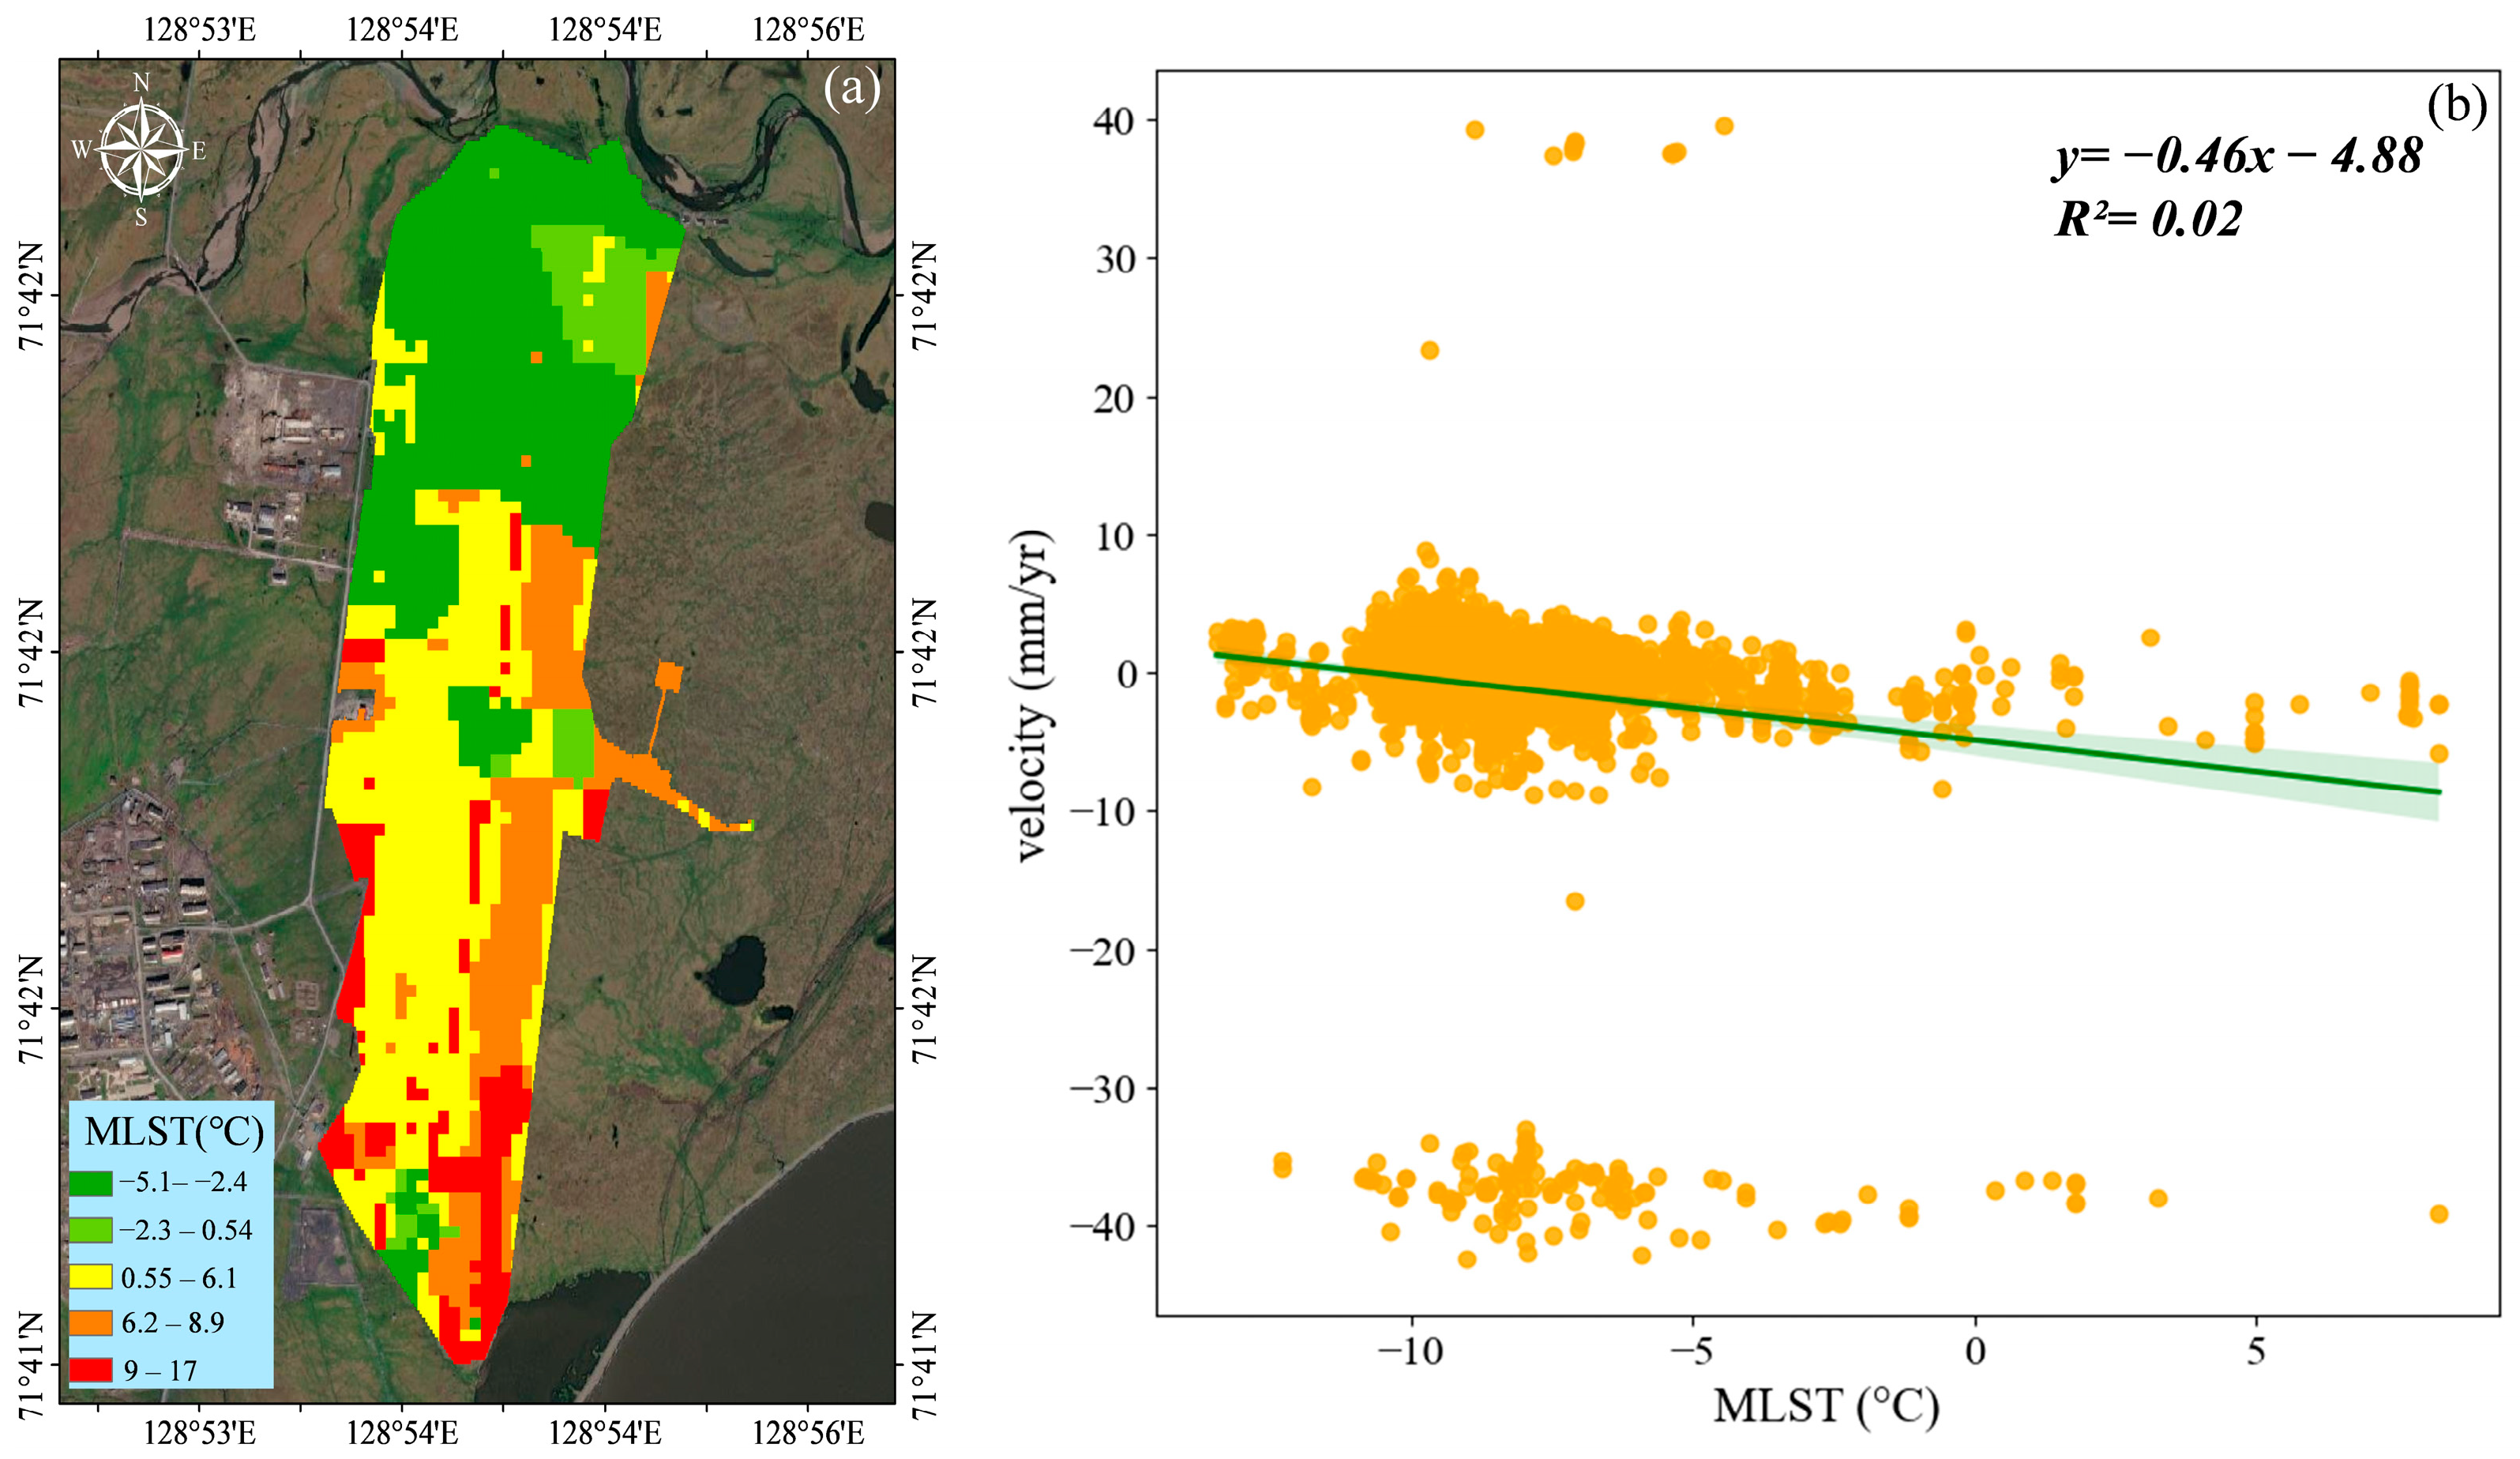
4.1. The Relationship Between Ground Surface Deformation and Climatic Factors
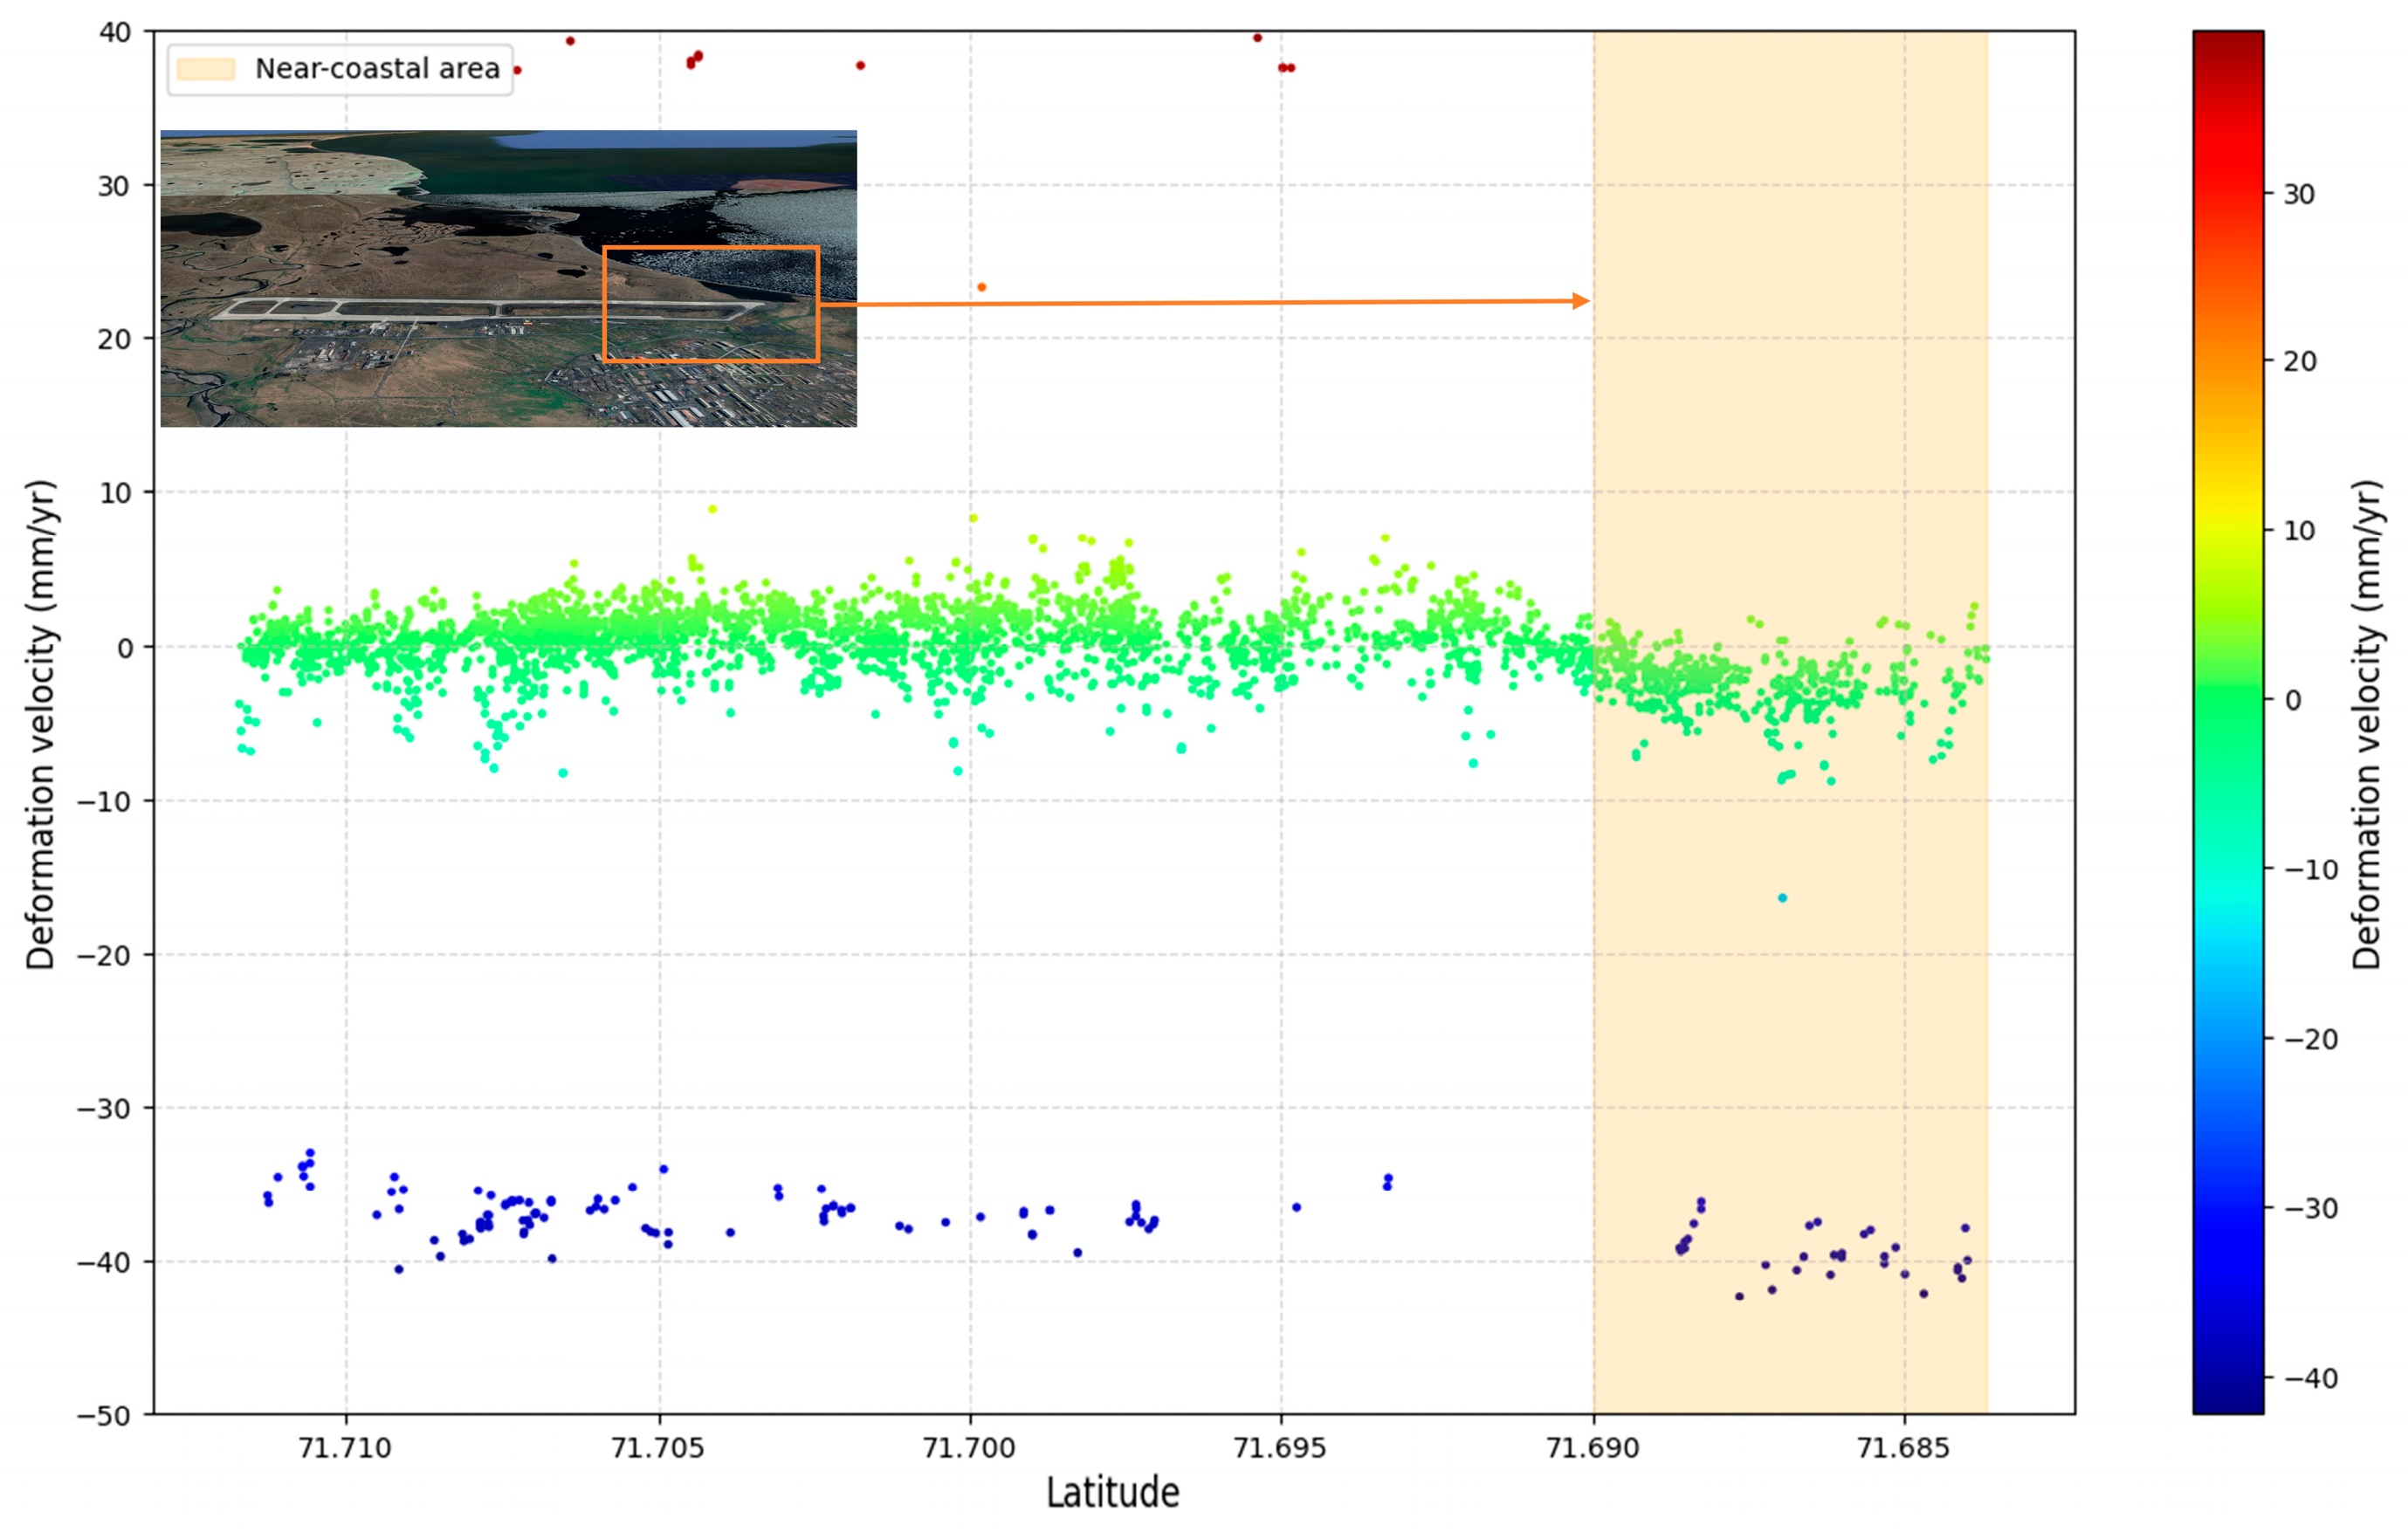
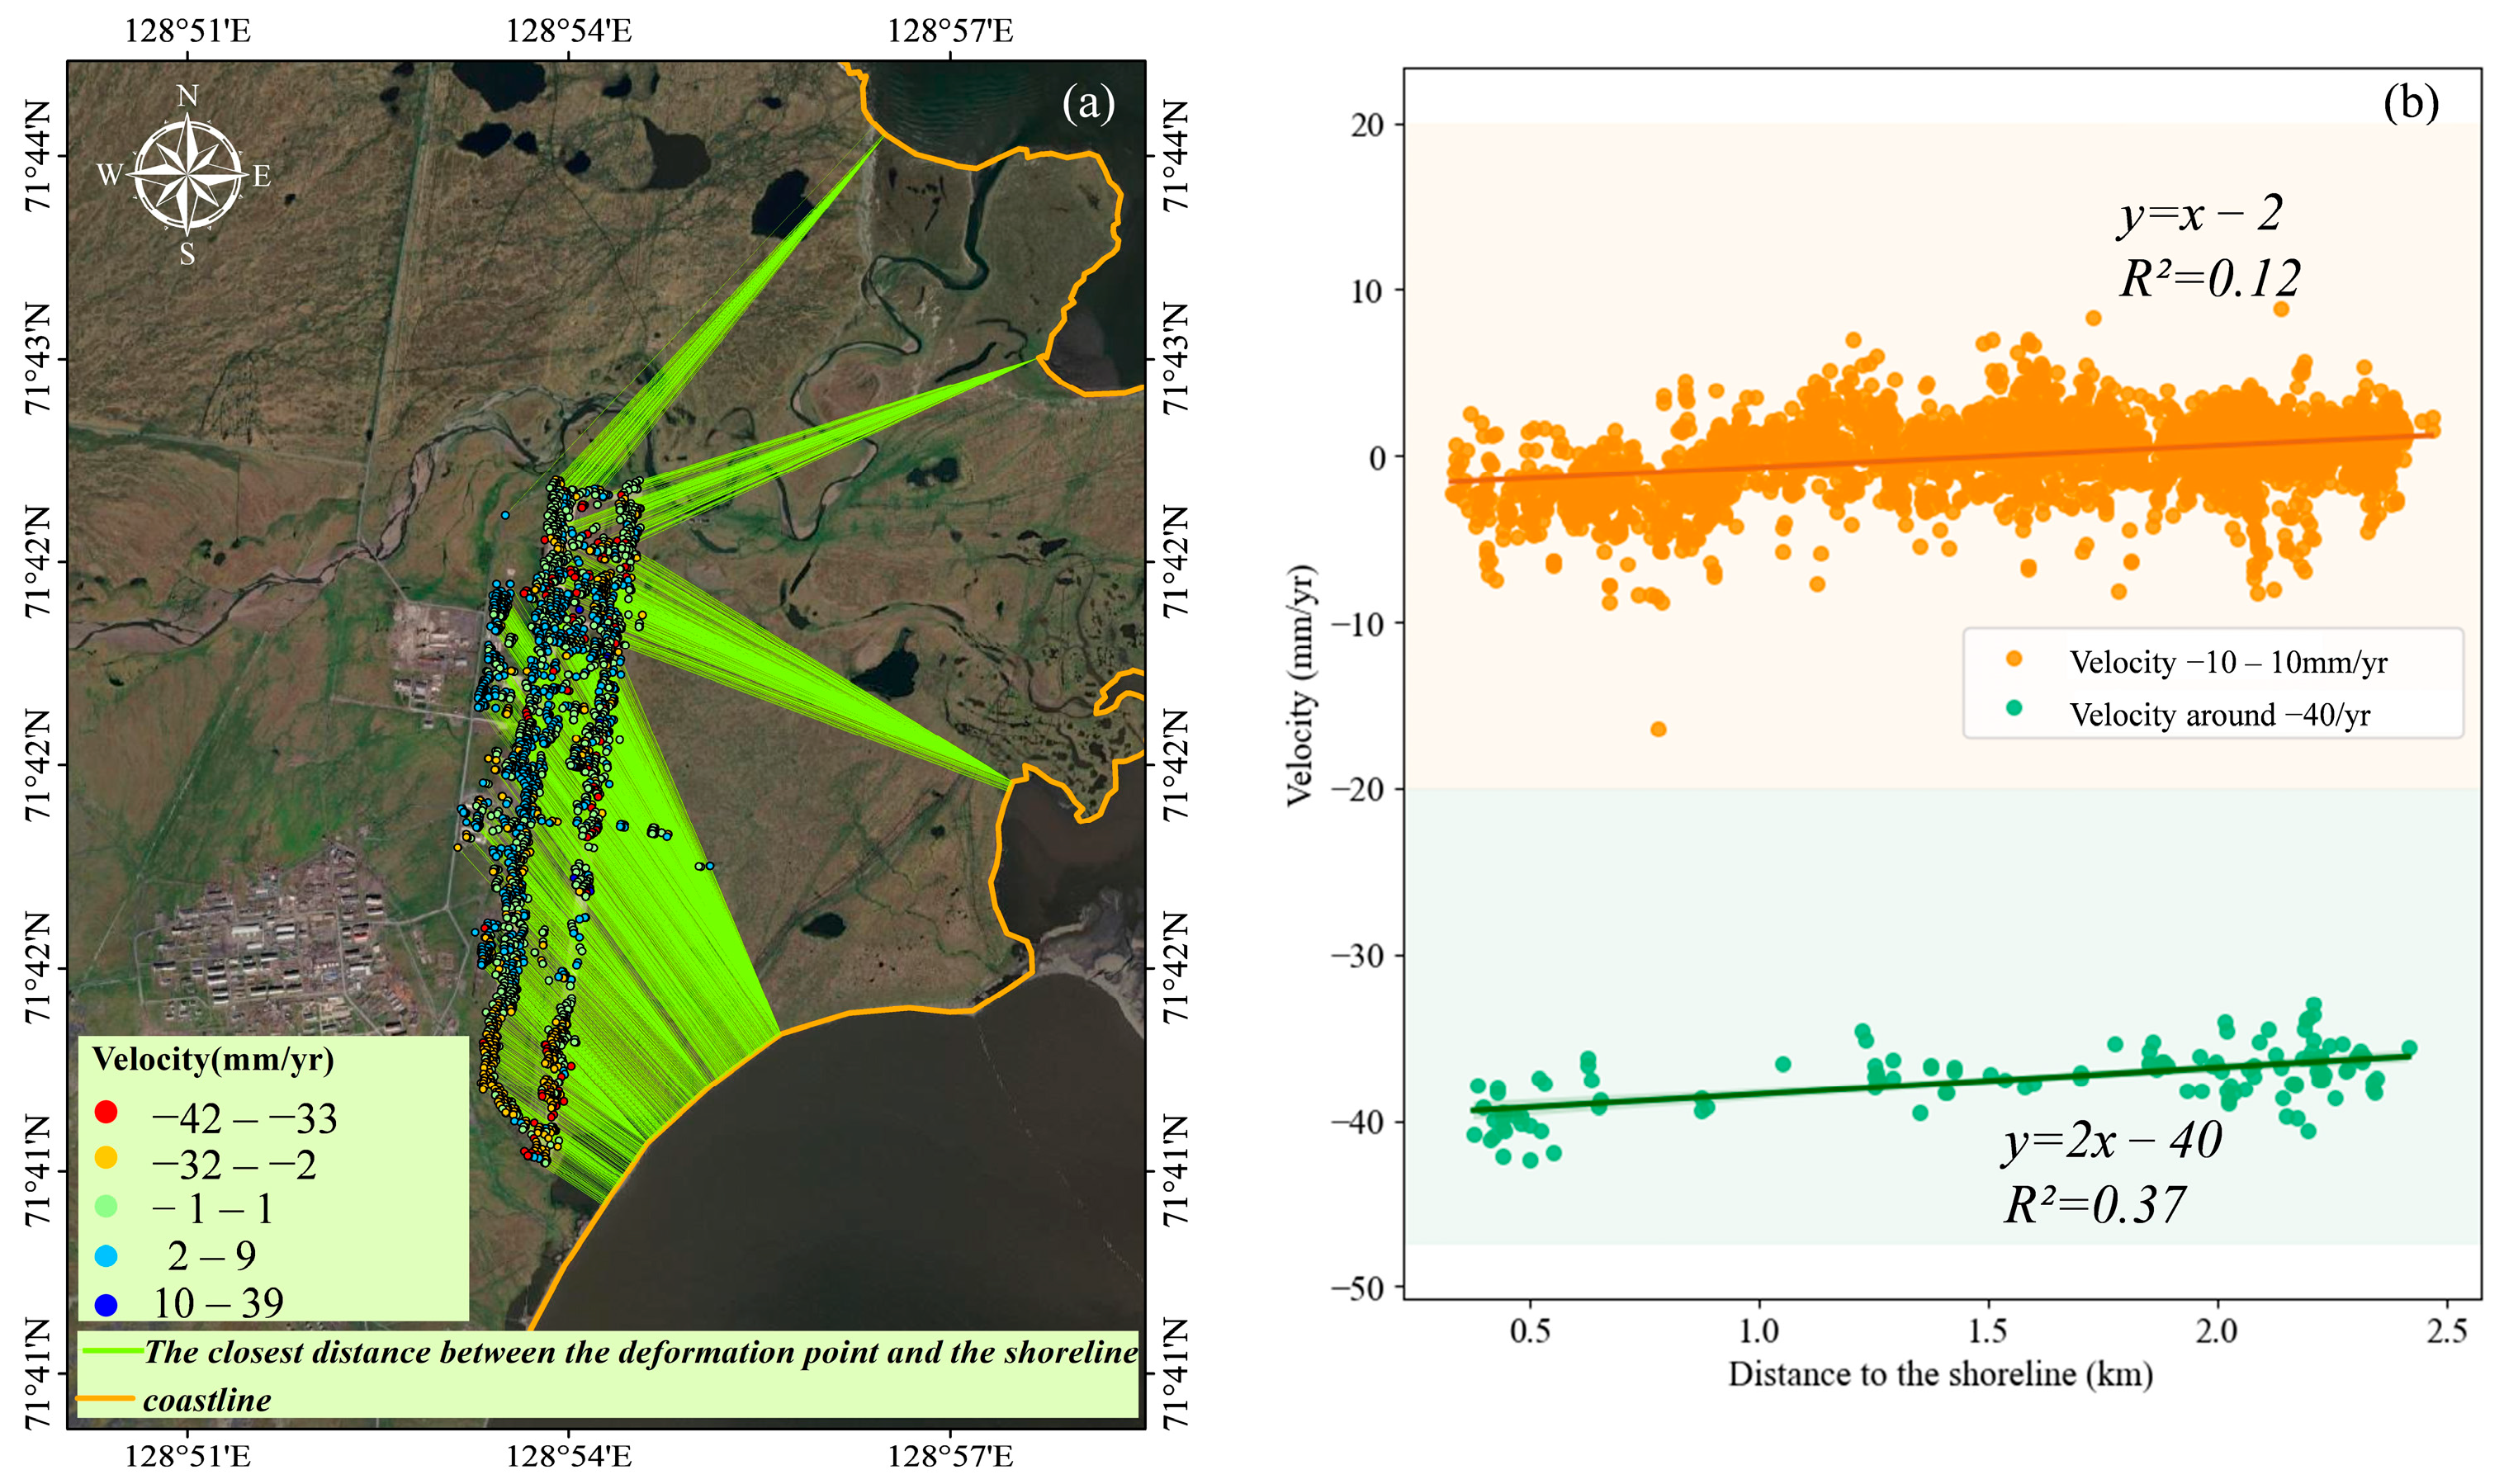
4.2. Impact of the Oceans on Surface Deformation
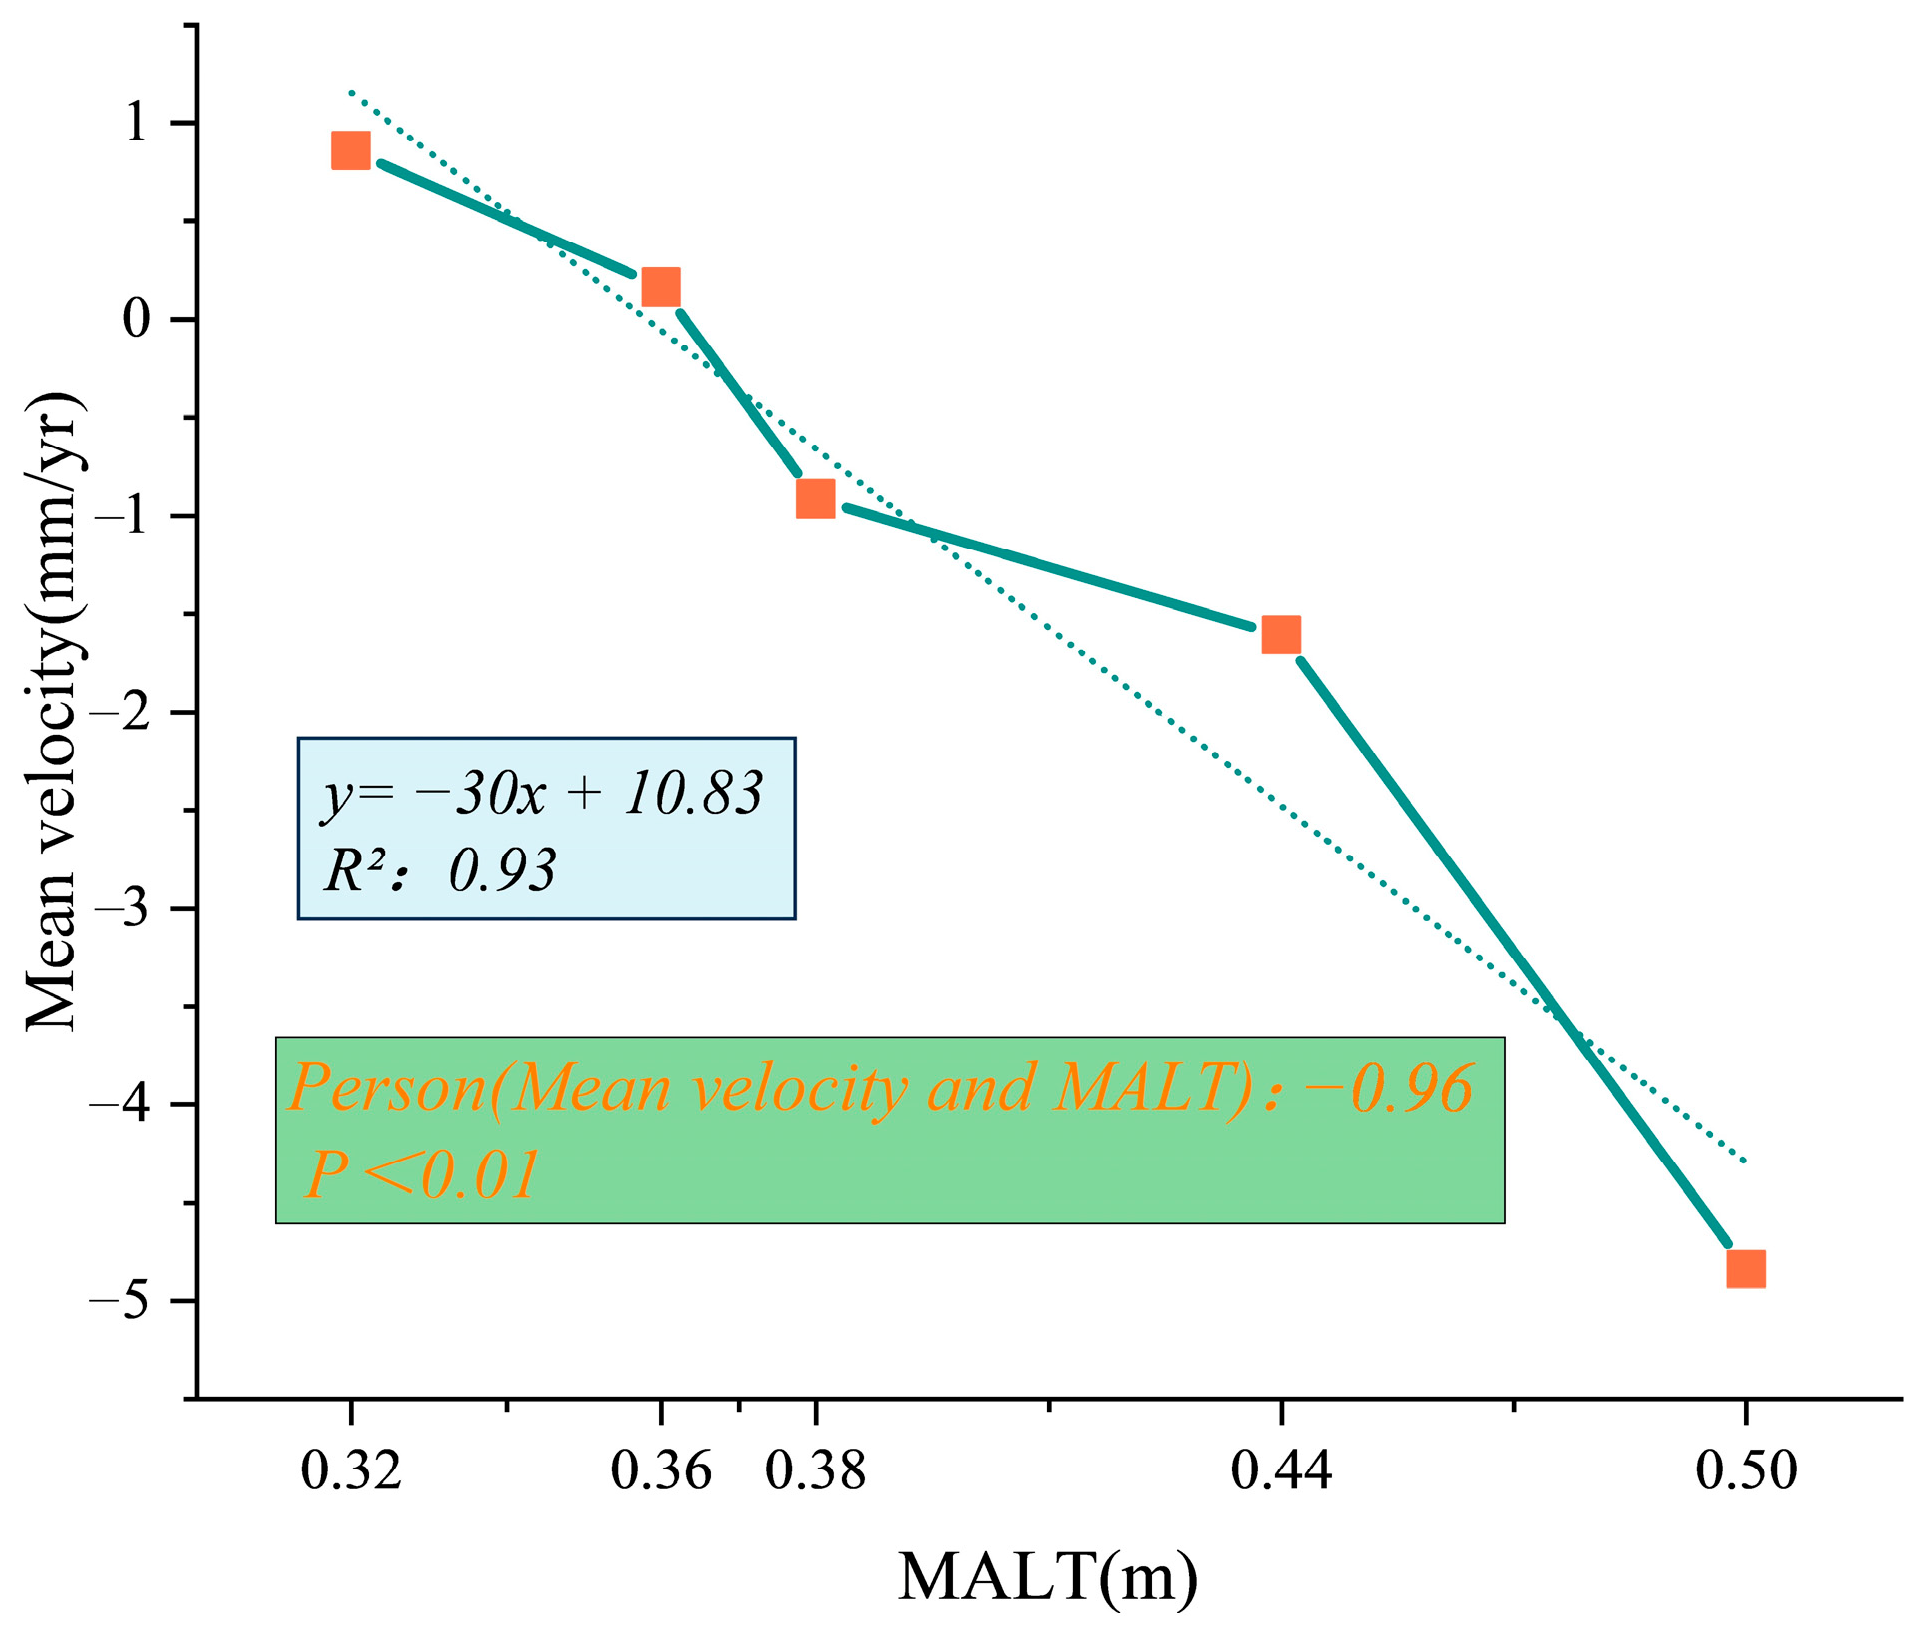
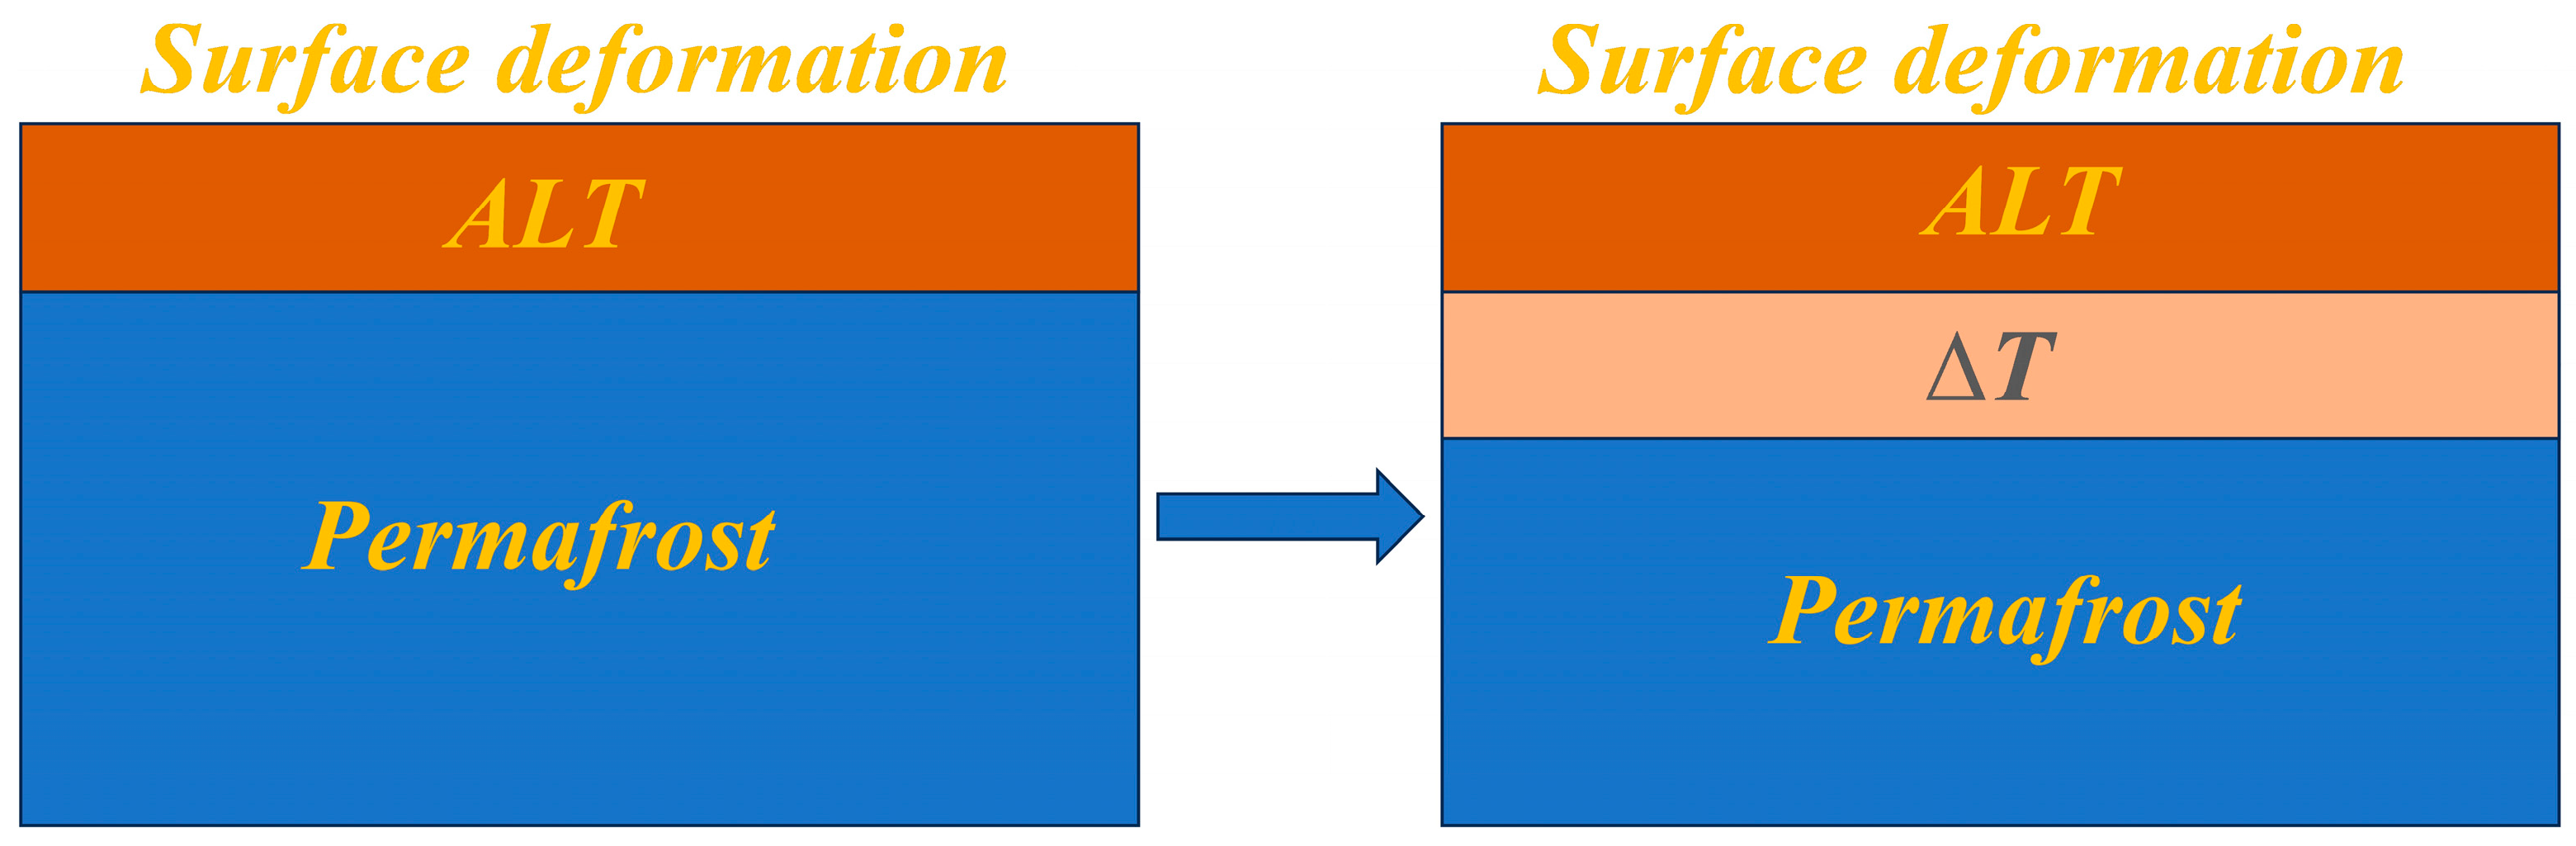
4.3. Relationship Between ALT and Surface Deformation
4.4. Significance and Limitations
5. Conclusions
Author Contributions
Funding
Data Availability Statement
Acknowledgments
Conflicts of Interest
References
- Shepherd, T.G. Effects of a warming Arctic. Science 2016, 353, 989–990. [Google Scholar] [CrossRef] [PubMed]
- Hjort, J.; Karjalainen, O.; Aalto, J.; Westermann, S.; Romanovsky, V.E.; Nelson, F.E.; Etzelmüller, B.; Luoto, M. Degrading permafrost puts Arctic infrastructure at risk by mid-century. Nat. Commun. 2018, 9, 1–9. [Google Scholar] [CrossRef]
- Wrona, F.J.; Johansson, M.; Culp, J.M.; Jenkins, A.; Mård, J.; Myers-Smith, I.H.; Prowse, T.D.; Vincent, W.F.; Wookey, P.A. Transitions in Arctic ecosystems: Ecological implications of a changing hydrological regime. J. Geophys. Res. Biogeosci. 2016, 121, 650–674. [Google Scholar] [CrossRef]
- Heijmans, M.M.P.D.; Magnússon, R.Í.; Lara, M.J.; Frost, G.V.; Myers-Smith, I.H.; van Huissteden, J.; Jorgenson, M.T.; Fedorov, A.N.; Epstein, H.E.; Lawrence, D.M.; et al. Tundra vegetation change and impacts on permafrost. Nat. Rev. Earth Environ. 2022, 3, 68–84. [Google Scholar] [CrossRef]
- Hjort, J.; Streletskiy, D.; Doré, G.; Wu, Q.; Bjella, K.; Luoto, M. Impacts of permafrost degradation on infrastructure. Nat. Rev. Earth Environ. 2022, 3, 24–38. [Google Scholar] [CrossRef]
- Shiklomanov, N.I.; Streletskiy, D.A.; Swales, T.B.; Kokorev, V.A. Climate Change and Stability of Urban Infrastructure in Russian Permafrost Regions: Prognostic Assessment based on GCM Climate Projections. Geogr. Rev. 2017, 107, 125–142. [Google Scholar] [CrossRef]
- Irrgang, A.M.; Bendixen, M.; Farquharson, L.M.; Baranskaya, A.V.; Erikson, L.H.; Gibbs, A.E.; Ogorodov, S.A.; Overduin, P.P.; Lantuit, H.; Grigoriev, M.N.; et al. Drivers, dynamics and impacts of changing Arctic coasts. Nat. Rev. Earth Environ. 2022, 3, 39–54. [Google Scholar] [CrossRef]
- Nielsen, D.M.; Pieper, P.; Barkhordarian, A.; Overduin, P.; Ilyina, T.; Brovkin, V.; Baehr, J.; Dobrynin, M. Increase in Arctic coastal erosion and its sensitivity to warming in the twenty-first century. Nat. Clim. Change 2022, 12, 263–270. [Google Scholar] [CrossRef]
- Lantuit, H.; Atkinson, D.; Overduin, P.P.; Grigoriev, M.; Rachold, V.; Grosse, G.; Hubberten, H.-W. Coastal erosion dynamics on the permafrost-dominated Bykovsky Peninsula, north Siberia, 1951–2006. Polar Res. 2011, 30, 7341. [Google Scholar] [CrossRef]
- Povoroznyuk, O.; Schweitzer, P. Ignoring environmental change? On fishing quotas and collapsing coastlines in Bykovskiy, Northern Sakha (Yakutiya). AMBIO 2023, 52, 1211–1220. [Google Scholar] [CrossRef]
- Creel, R.; Guimond, J.; Jones, B.M.; Nielsen, D.M.; Bristol, E.; Tweedie, C.E.; Overduin, P.P. Permafrost thaw subsidence, sea-level rise, and erosion are transforming Alaska’s Arctic coastal zone. Proc. Natl. Acad. Sci. USA 2024, 121, e2409411121. [Google Scholar] [CrossRef] [PubMed]
- Berardino, P.; Fornaro, G.; Lanari, R.; Sansosti, E. A New Algorithm for Surface Deformation Monitoring Based on Small Baseline Differential SAR Interferograms. IEEE Trans. Geosci. Remote Sens. 2002, 40, 2375–2383. [Google Scholar] [CrossRef]
- Zhang, Z.; Lin, H.; Wang, M.; Liu, X.; Chen, Q.; Wang, C.; Zhang, H. A Review of Satellite Synthetic Aperture Radar Interferometry Applications in Permafrost Regions: Current Status, Challenges, and Trends. IEEE Geosci. Remote Sens. Mag. 2022, 10, 93–114. [Google Scholar] [CrossRef]
- Ferretti, A.; Prati, C.; Rocca, F. Multibaseline InSAR DEM reconstruction: The wavelet approach. IEEE Trans. Geosci. Remote Sens. 1999, 37, 705–715. [Google Scholar] [CrossRef]
- De Zan, F.; Zonno, M.; Lopez-Dekker, P. Phase Inconsistencies and Multiple Scattering in SAR Interferometry. IEEE Trans. Geosci. Remote Sens. 2015, 53, 6608–6616. [Google Scholar] [CrossRef]
- Konstantinov, P.; Basharin, N.; Fedorov, A.; Iijima, Y.; Andreeva, V.; Semenov, V.; Vasiliev, N. Impact of Climate Change on the Ground Thermal Regime in the Lower Lena Region, Arctic Central Siberia. Land 2023, 12, 19. [Google Scholar] [CrossRef]
- Juutinen, S.; Aurela, M.; Tuovinen, J.-P.; Ivakhov, V.; Linkosalmi, M.; Räsänen, A.; Virtanen, T.; Mikola, J.; Nyman, J.; Vähä, E.; et al. Variation in CO2 and CH4 fluxes among land cover types in heterogeneous Arctic tundra in northeastern Siberia. Biogeosciences 2022, 19, 3151–3167. [Google Scholar] [CrossRef]
- Tarbeeva, A.; Tikhonravova, Y.; Lebedeva, L.; Kut, A.; Shamov, V. Causes and Processes of Thermo-Erosional Gully Initiation Near Tiksi Settlement, Arctic Eastern Siberia. Permafr. Periglac. Process. 2024, 35, 357–372. [Google Scholar] [CrossRef]
- Obu, J.; Westermann, S.; Bartsch, A.; Berdnikov, N.; Christiansen, H.H.; Dashtseren, A.; Delaloye, R.; Elberling, B.; Etzelmüller, B.; Kholodov, A.; et al. Northern Hemisphere permafrost map based on TTOP modelling for 2000–2016 at 1 km2 scale. Earth-Sci. Rev. 2019, 193, 299–316. [Google Scholar] [CrossRef]
- Porter, C.; Howat, I.; Noh, M.-J.; Husby, E.; Khuvis, S.; Danish, E.; Tomko, K.; Gardiner, J.; Negrete, A.; Yadav, B.; et al. ArcticDEM-Strips, Version 4.1. 2022, Harvard Dataverse. Available online: https://dataverse.harvard.edu/dataset.xhtml?persistentId=doi:10.7910/DVN/C98DVS (accessed on 13 May 2025).
- Roy, D.P.; Wulder, M.A.; Loveland, T.R.; Woodcock, C.E.; Allen, R.G.; Anderson, M.C.; Helder, D.; Irons, J.R.; Johnson, D.M.; Kennedy, R.; et al. Landsat-8: Science and product vision for terrestrial global change research. Remote Sens. Environ. 2014, 145, 154–172. [Google Scholar] [CrossRef]
- Luo, D.; Wu, Q.; Jin, H.; Marchenko, S.S.; Lü, L.; Gao, S. Recent changes in the active layer thickness across the northern hemisphere. Environ. Earth Sci. 2016, 75, 1–15. [Google Scholar] [CrossRef]
- Zebker, H.A.; Goldstein, R.M. Topographic Mapping from Interferometric Synthetic Aperture Radar Observations. J. Geophys. Res. Solid Earth 1986, 91, 4993–4999. [Google Scholar] [CrossRef]
- Short, N.; LeBlanc, A.-M.; Sladen, W.; Oldenborger, G.; Mathon-Dufour, V.; Brisco, B. RADARSAT-2 D-InSAR for ground displacement in permafrost terrain, validation from Iqaluit Airport, Baffin Island, Canada. Remote Sens. Environ. 2014, 141, 40–51. [Google Scholar] [CrossRef]
- Wang, L.; Marzahn, P.; Bernier, M.; Ludwig, R. Sentinel-1 In SAR measurements of deformation over discontinuous permafrost terrain, Northern Quebec, Canada. Remote Sens. Environ. 2020, 248, 111965. [Google Scholar] [CrossRef]
- Zebker, H.; Villasenor, J. Decorrelation in Interferometric Radar Echoes. IEEE Trans. Geosci. Remote Sens. 1992, 30, 950–959. [Google Scholar] [CrossRef]
- Chen, C.W.; Zebker, H.A. Two-dimensional phase unwrapping with use of statistical models for cost functions in nonlinear optimization. J. Opt. Soc. Am. A 2001, 18, 338–351. [Google Scholar] [CrossRef]
- Yu, Q.; Wang, Q.; Yan, X.; Yang, T.; Song, S.; Yao, M.; Zhou, K.; Huang, X. Ground Deformation of the Chongming East Shoal Reclamation Area in Shanghai Based on SBAS-InSAR and Laboratory Tests. Remote Sens. 2020, 12, 1016. [Google Scholar] [CrossRef]
- Li, R.; Li, Z.; Han, J.; Lu, P.; Qiao, G.; Meng, X.; Hao, T.; Zhou, F. Monitoring surface deformation of permafrost in Wudaoliang Region, Qinghai–Tibet Plateau with ENVISAT ASAR data. Int. J. Appl. Earth Obs. Geoinf. 2021, 104, 102527. [Google Scholar] [CrossRef]
- Zhao, F.; Gong, W.; Ren, T.; Chen, J.; Tang, H.; Li, T. Permafrost Stability Mapping on the Tibetan Plateau by Integrating Time-Series InSAR and the Random Forest Method. Remote Sens. 2023, 15, 2294. [Google Scholar] [CrossRef]
- Xu, Z.; Jiang, L.; Niu, F.; Guo, R.; Huang, R.; Zhou, Z.; Jiao, Z. Monitoring Regional-Scale Surface Deformation of the Continuous Permafrost in the Qinghai–Tibet Plateau with Time-Series InSAR Analysis. Remote Sens. 2022, 14, 2987. [Google Scholar] [CrossRef]
- Wang, W.; Jin, X.; Jin, H.; Li, X.; Wang, X.; He, R.; Li, Y.; Li, X.; Wang, L.; Wang, W.; et al. Evaluation of ground surface deformation in discontinuous permafrost regions along the China-Russia Crude Oil Pipelines in Northeast China using InSAR and ground surveys. Eng. Geol. 2023, 323, 107227. [Google Scholar] [CrossRef]
- Ermida, S.L.; Soares, P.; Mantas, V.; Göttsche, F.-M.; Trigo, I.F. Google Earth Engine Open-Source Code for Land Surface Temperature Estimation from the Landsat Series. Remote Sens. 2020, 12, 1471. [Google Scholar] [CrossRef]
- Sutton, R.T.; Dong, B.; Gregory, J.M. Land/sea warming ratio in response to climate change: IPCC AR4 model results and comparison with observations. Geophys. Res. Lett. 2007, 34, L02701. [Google Scholar] [CrossRef]
- Lambert, F.H.; Chiang, J.C.H. Control of land-ocean temperature contrast by ocean heat uptake. Geophys. Res. Lett. 2007, 34, L13704. [Google Scholar] [CrossRef]
- Xiao, Z.; Hou, Z.; Zhu, L.; Dong, X. Experimental investigation of the influence of salt on the phase transition temperature in saline soil. Cold Reg. Sci. Technol. 2021, 183, 103229. [Google Scholar] [CrossRef]
- Barma, M.C.; Peng, Z.; Moghtaderi, B.; Doroodchi, E. Freeze desalination of drops of saline solutions. Desalination 2021, 517, 115265. [Google Scholar] [CrossRef]
- Jia, Y.; Kim, J.-W.; Shum, C.K.; Lu, Z.; Ding, X.; Zhang, L.; Erkan, K.; Kuo, C.-Y.; Shang, K.; Tseng, K.-H.; et al. Characterization of Active Layer Thickening Rate over the Northern Qinghai-Tibetan Plateau Permafrost Region Using ALOS Interferometric Synthetic Aperture Radar Data, 2007–2009. Remote Sens. 2017, 9, 84. [Google Scholar] [CrossRef]
- Zhao, L.; Zou, D.; Hu, G.; Du, E.; Pang, Q.; Xiao, Y.; Li, R.; Sheng, Y.; Wu, X.; Sun, Z.; et al. Changing climate and the permafrost environment on the Qinghai–Tibet (Xizang) plateau. Permafr. Periglac. Process. 2020, 31, 396–405. [Google Scholar] [CrossRef]
- Li, X.; Zhang, Z.; Zheleznyak, M.; Jin, H.; Zhang, S.; Wei, H.; Zhai, J.; Melnikov, A.; Gagarin, L. Time-series InSAR monitoring of surface deformation in Yakutsk, a city located on continuous permafrost. Earth Surf. Process Landf. 2024, 49, 918–932. [Google Scholar] [CrossRef]


| Data Information | Description |
|---|---|
| Start of the monitoring period | 2 January 2017 |
| End of the monitoring period | 19 December 2021 |
| Super master image | 4 May 2019 |
| Path/frame | 149/353 |
| Flight direction | Descending |
| Total number of images | 120 |
Disclaimer/Publisher’s Note: The statements, opinions and data contained in all publications are solely those of the individual author(s) and contributor(s) and not of MDPI and/or the editor(s). MDPI and/or the editor(s) disclaim responsibility for any injury to people or property resulting from any ideas, methods, instructions or products referred to in the content. |
© 2025 by the authors. Licensee MDPI, Basel, Switzerland. This article is an open access article distributed under the terms and conditions of the Creative Commons Attribution (CC BY) license (https://creativecommons.org/licenses/by/4.0/).
Share and Cite
Yan, Q.; Zhang, Z.; Li, X.; Yan, A.; Qiu, L.; Zhang, A.; Melnikov, A.; Gagarin, L. Time-Series InSAR Monitoring of Permafrost-Related Surface Deformation at Tiksi Airport: Impacts of Climate Warming and Coastal Erosion on the Northernmost Siberian Mainland. Remote Sens. 2025, 17, 1757. https://doi.org/10.3390/rs17101757
Yan Q, Zhang Z, Li X, Yan A, Qiu L, Zhang A, Melnikov A, Gagarin L. Time-Series InSAR Monitoring of Permafrost-Related Surface Deformation at Tiksi Airport: Impacts of Climate Warming and Coastal Erosion on the Northernmost Siberian Mainland. Remote Sensing. 2025; 17(10):1757. https://doi.org/10.3390/rs17101757
Chicago/Turabian StyleYan, Qingkai, Ze Zhang, Xianglong Li, Aoxiang Yan, Lisha Qiu, Andrei Zhang, Andrey Melnikov, and Leonid Gagarin. 2025. "Time-Series InSAR Monitoring of Permafrost-Related Surface Deformation at Tiksi Airport: Impacts of Climate Warming and Coastal Erosion on the Northernmost Siberian Mainland" Remote Sensing 17, no. 10: 1757. https://doi.org/10.3390/rs17101757
APA StyleYan, Q., Zhang, Z., Li, X., Yan, A., Qiu, L., Zhang, A., Melnikov, A., & Gagarin, L. (2025). Time-Series InSAR Monitoring of Permafrost-Related Surface Deformation at Tiksi Airport: Impacts of Climate Warming and Coastal Erosion on the Northernmost Siberian Mainland. Remote Sensing, 17(10), 1757. https://doi.org/10.3390/rs17101757