

The Divergent Changes in Surface Water Area after the South-to-North Water Diversion Project in China
 ,
,  , ,
, ,  and
and
Abstract
1. Introduction
2. Data and Methods
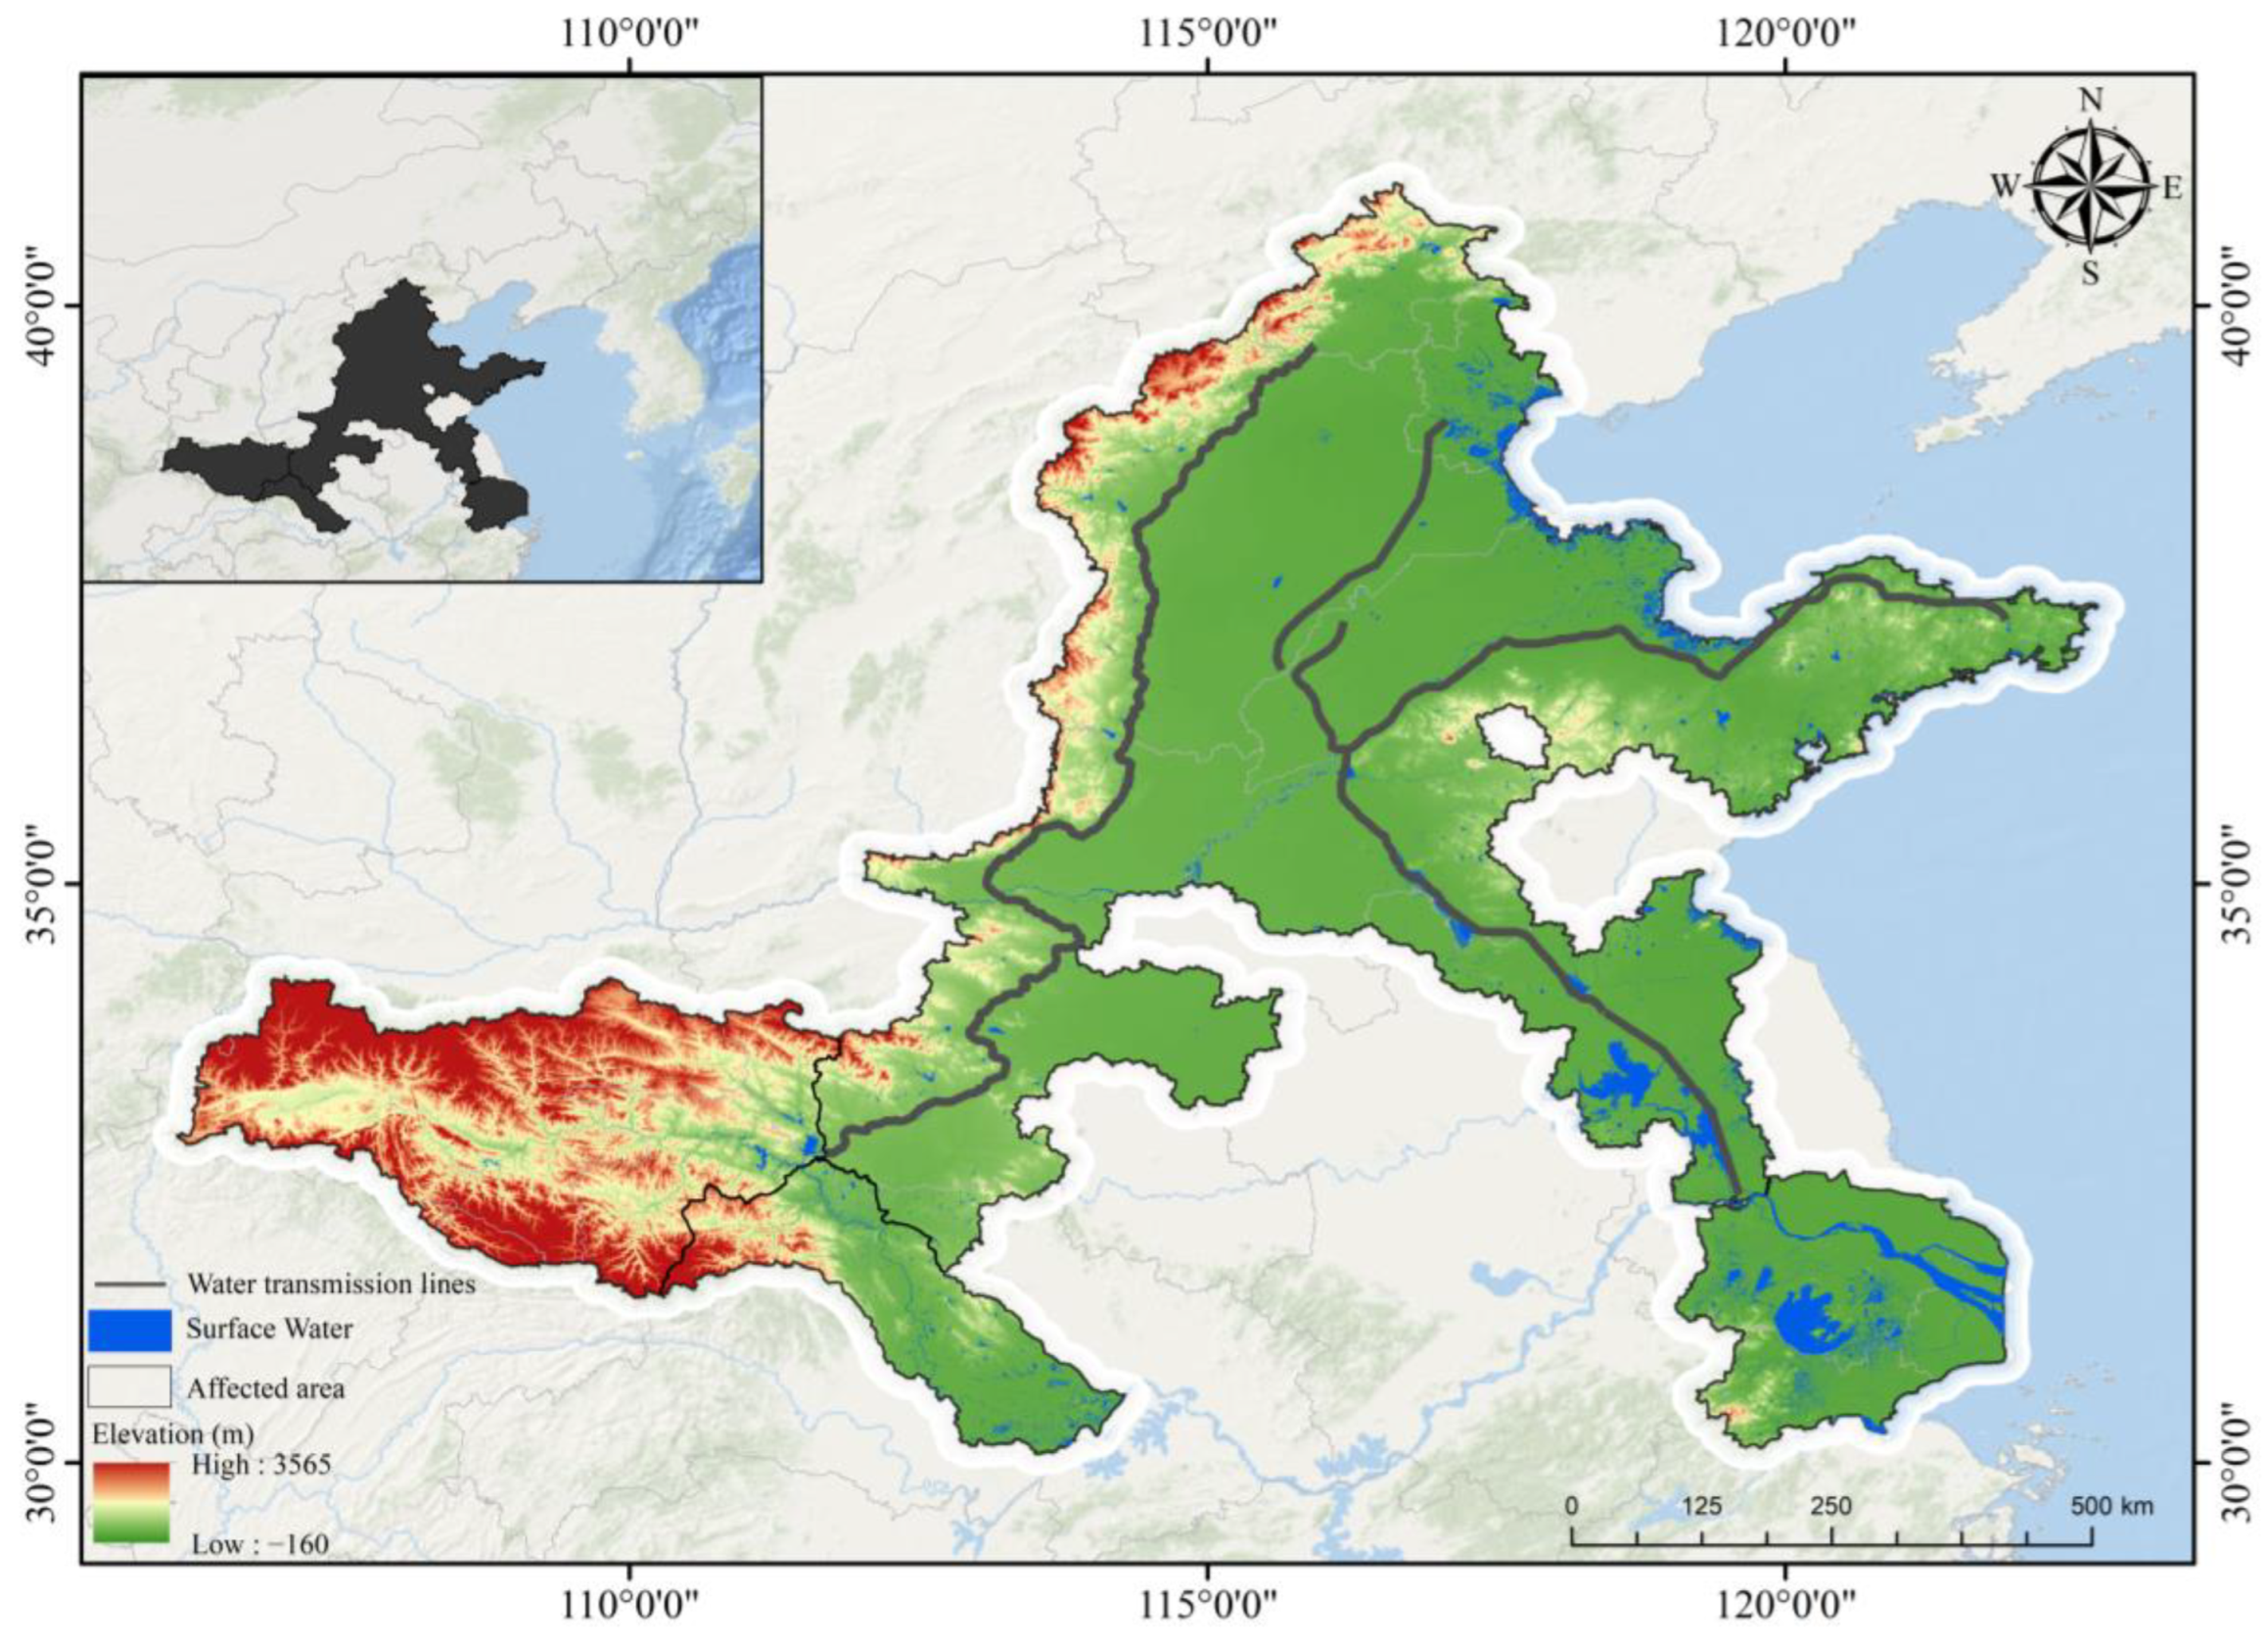
2.1. Study Area
2.2. Research Data
- (1)
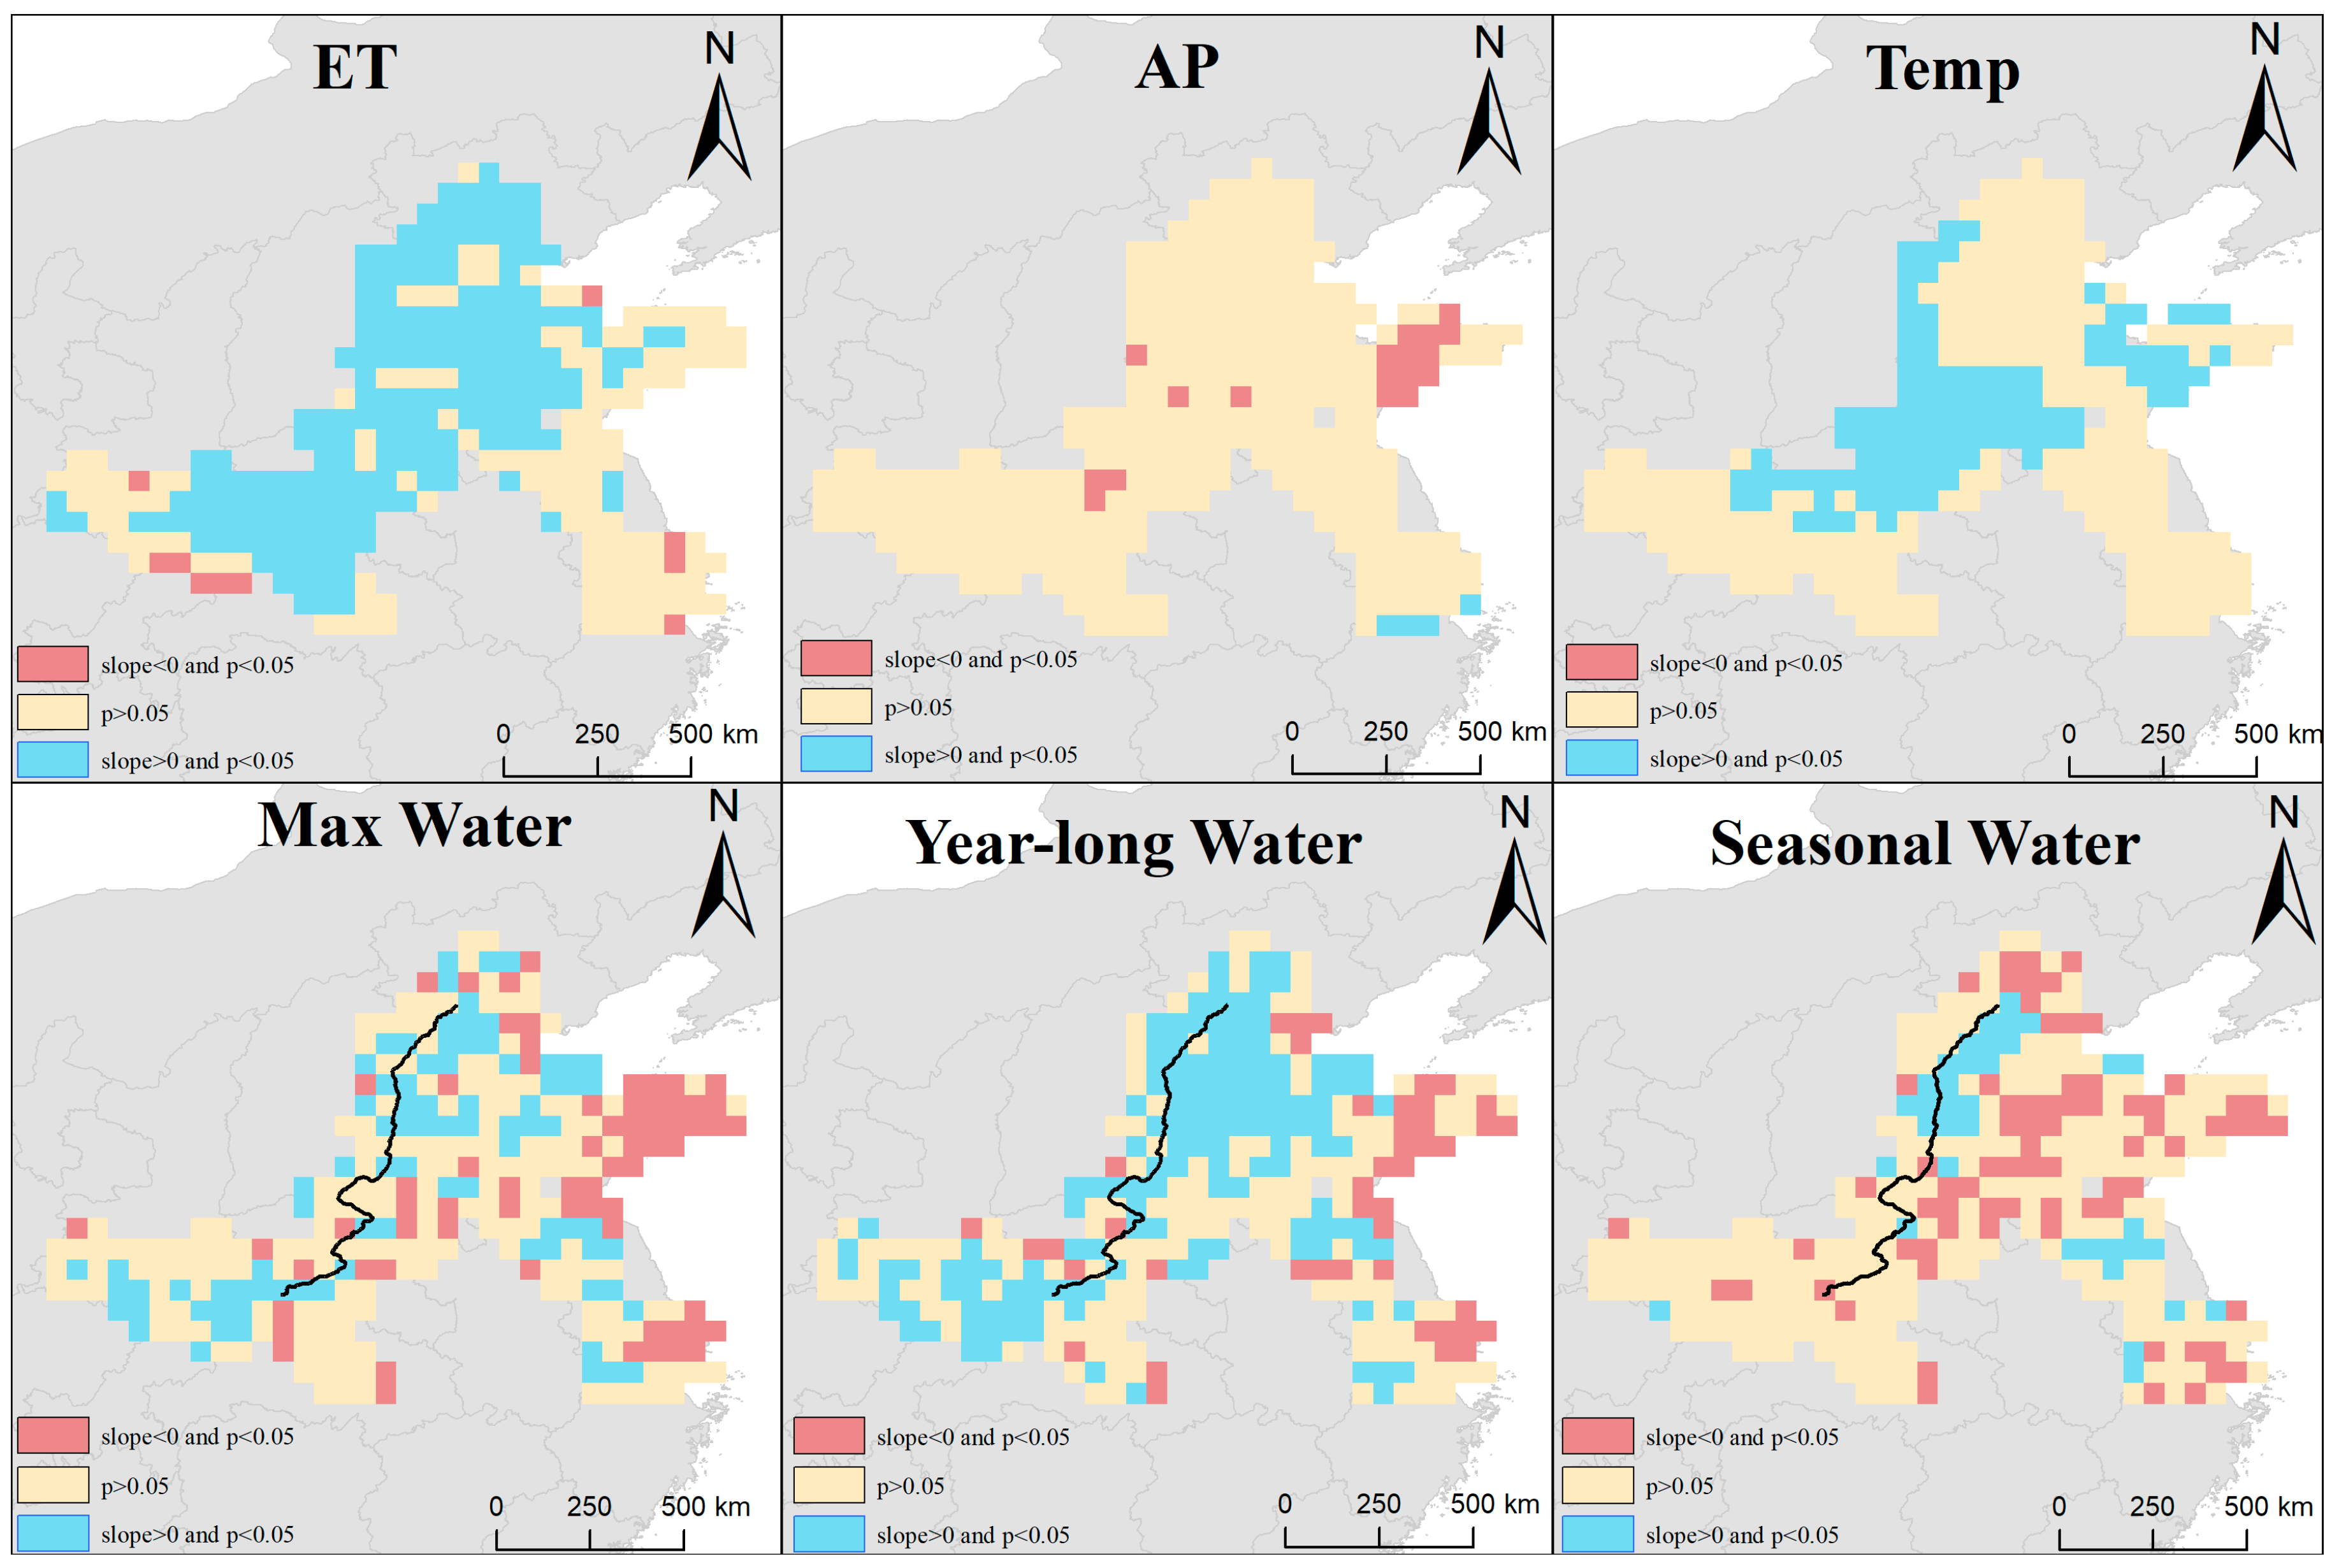
- Meteorological data mainly include annual precipitation (AP) and 2 m height air temperature (Temp) derived from ERA5-Land reanalysis data [54]. These data have a spatial resolution of 0.1° × 0.1° and were analysed and extracted using the GEE platform. ERA5 data have been proven to accurately represent the interannual and seasonal characteristics of precipitation in China, making these data suitable for practical studies [55,56].
- (2)
- Evapotranspiration data primarily consist of MODIS evapotranspiration (ET) data, which have a spatial resolution of 500 m × 500 m [57].
- (3)
- Topographic and geomorphological data are mainly derived from ALOS Earth observation DEM data [58], and these data have a spatial resolution of 30 m × 30 m.
- (4)
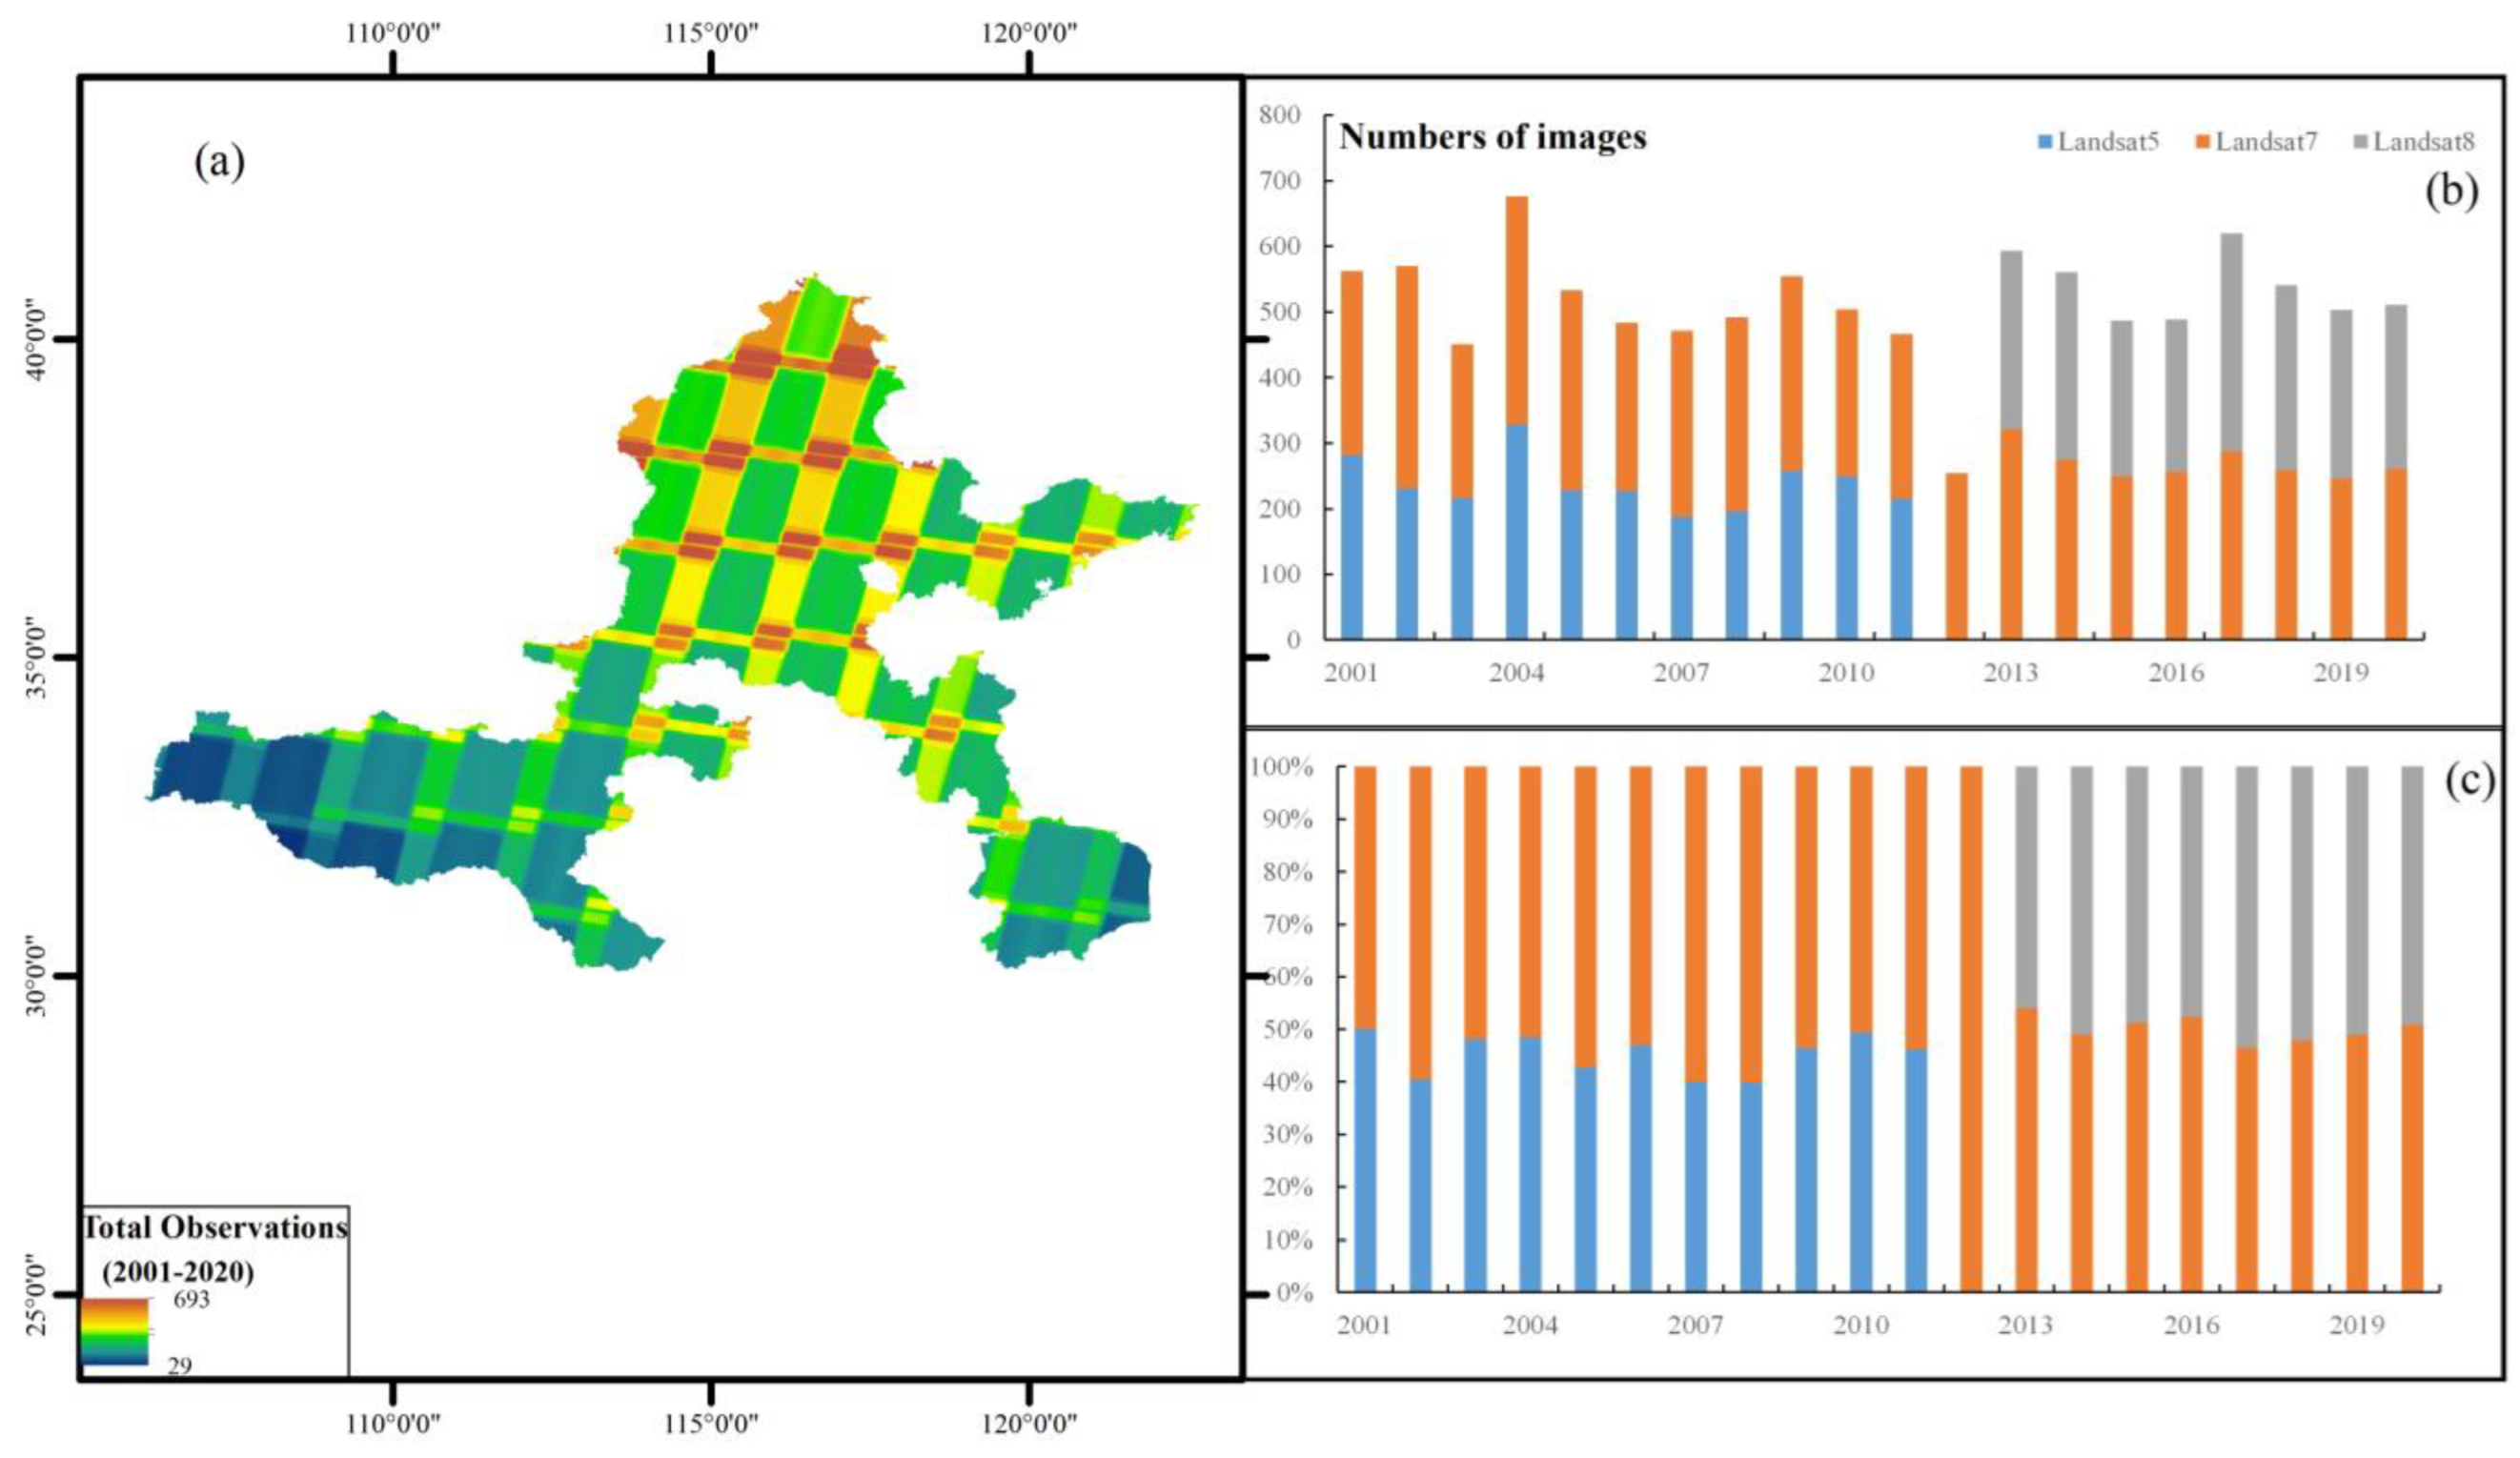
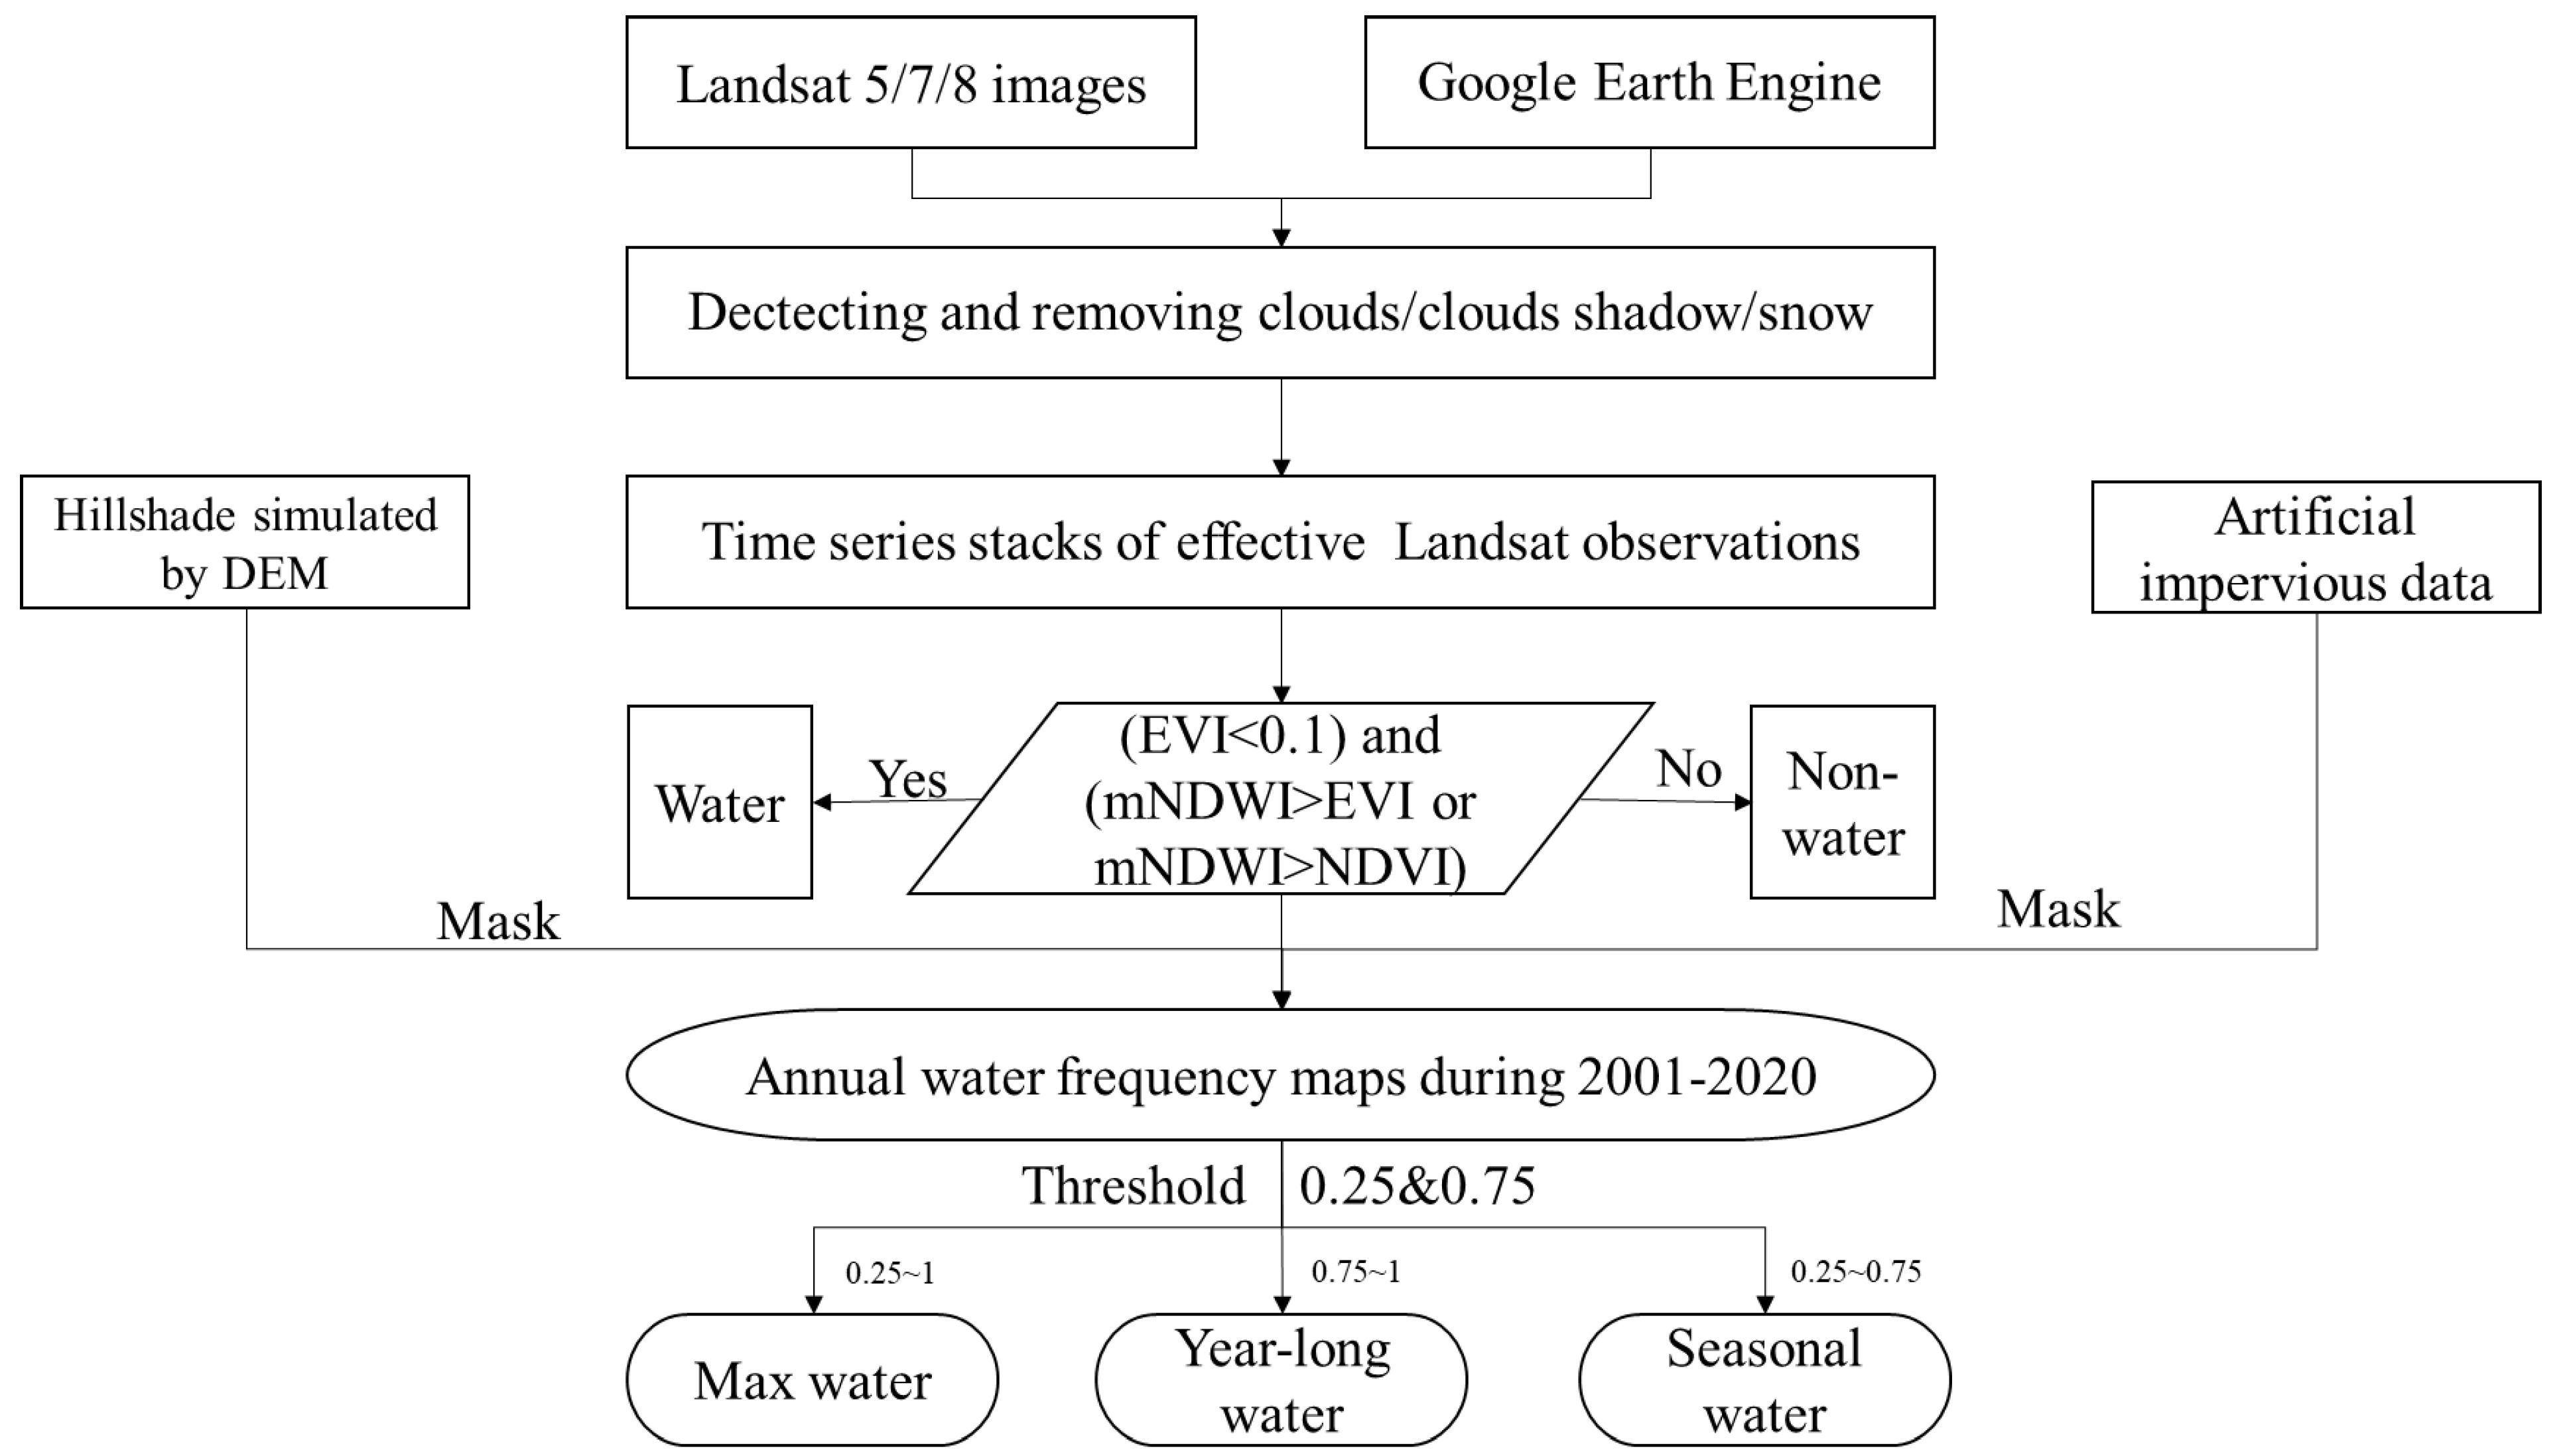
- Remote sensing images were obtained from the Landsat series of Earth observation satellites. All series of Landsat satellite images (5/7/8) of the South-to-North Water Diversion region from 2001 to 2020 were acquired using the GEE platform. The Landsat-5/7/8 images are courtesy of the U.S. Geological Survey. To ensure higher-quality images, this study employed the de-clouding algorithm CFMask to remove clouds, cloud shadows, and snow, resulting in a collection of high-quality images. A total of 10,321 Landsat satellite images were used to extract water bodies within the research area (Figure 2).
- (5)
- The compendium of statistical data primarily encompasses information pertaining to the volumetric transference of water facilitated by the SNWDP across various provinces and municipalities. Additionally, it incorporates data on the consumption of water in each respective province and city, and these data are further sorted into the following categories: agricultural water consumption (Agcwu), industrial water consumption (Idswu), and the consumption of non-service public water use (Cnspwu). The aforementioned data were meticulously extracted from the bulletins of provincial and municipal water resources.
- (6)
- Land cover data. The China land cover data (CLCD) used in this study were developed by Huang and Yang [59]. This dataset, with its 30 m resolution, boasts an overall accuracy of 80%, thereby outperforming other notable datasets such as MCD12Q1, ESACCI_LC, FROM_GLC, and GlobeLand30. For the purpose of this study, land cover data from the years 2013 and 2020 were harnessed to scrutinize the significant metamorphoses of aquatic body types within the geographical confines of the SNWDP.
- (7)
- Fundamental geographic element data, including Chinese provincial and municipal administrative boundaries, were sourced from the 1:1 million Chinese Basic Geographic Information Database of the National Basic Geographic Information Center.
2.3. Research Method
2.3.1. Water Body Extraction Method and Improvements
2.3.2. Spatial and Temporal Change Analysis
2.3.3. Quantify the Impacts of the SNWDP on the Water-Receiving Areas
3. Results
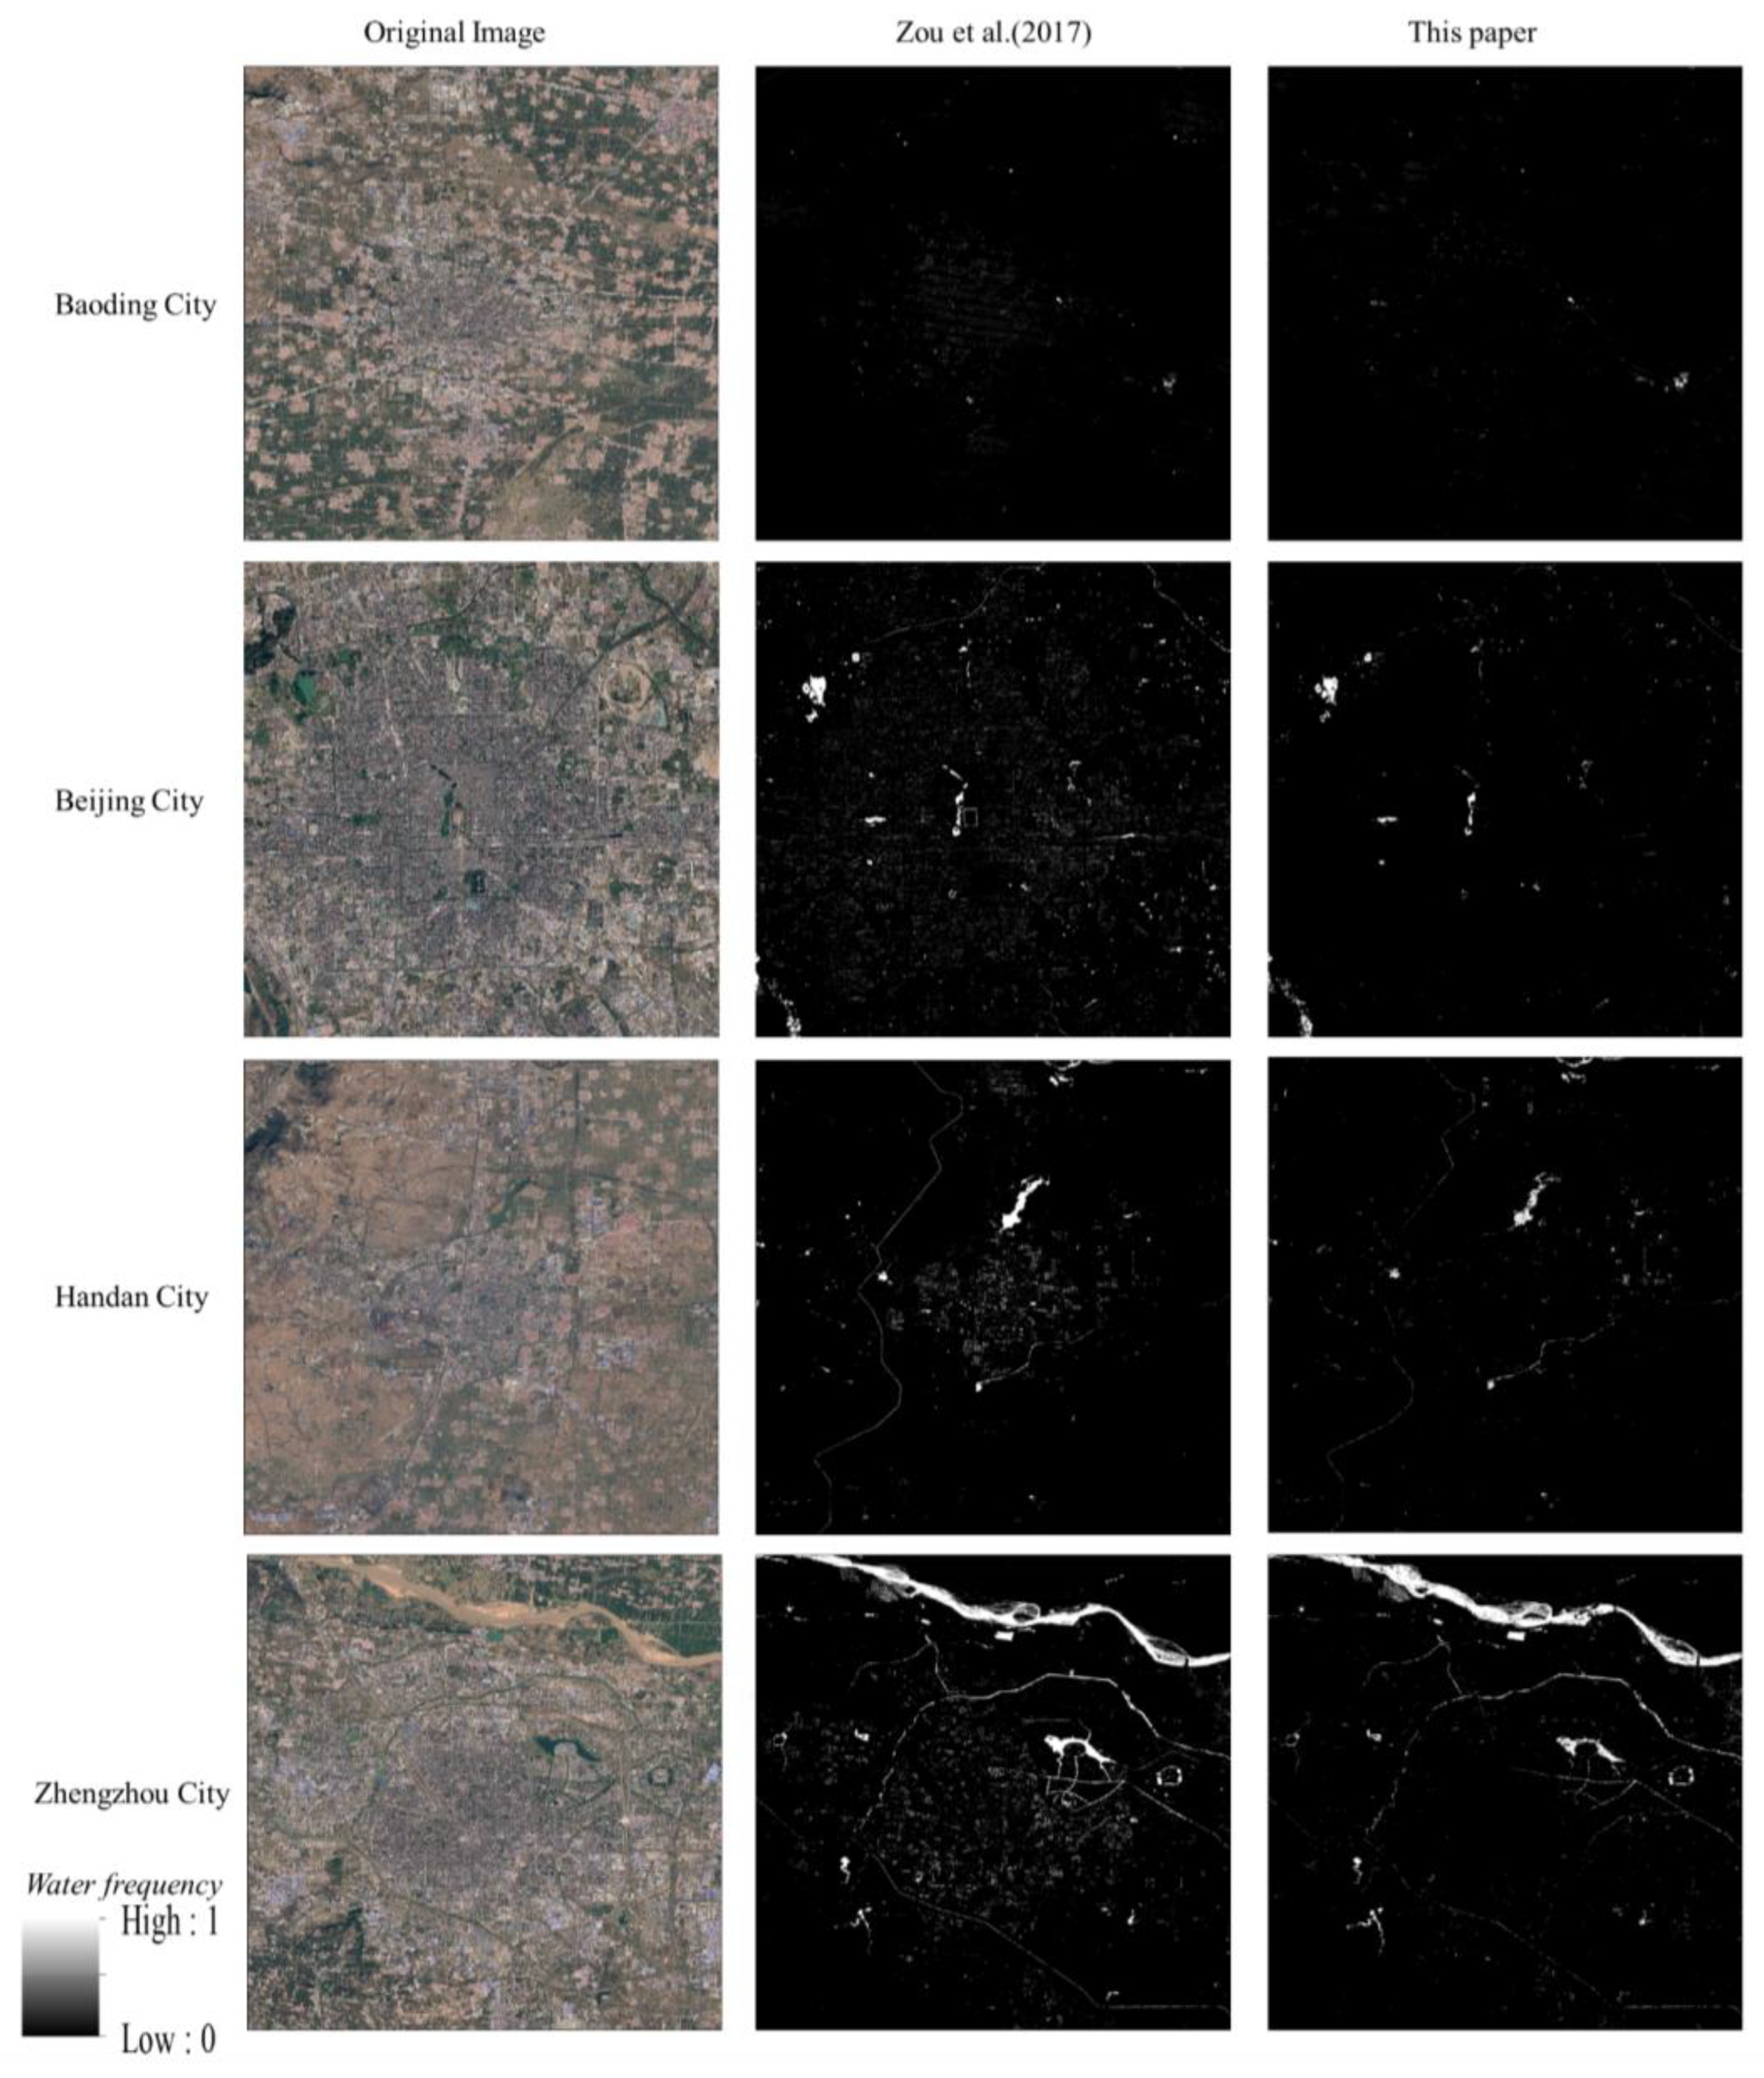
3.1. Assessment of the Accuracy of Water Body Extraction
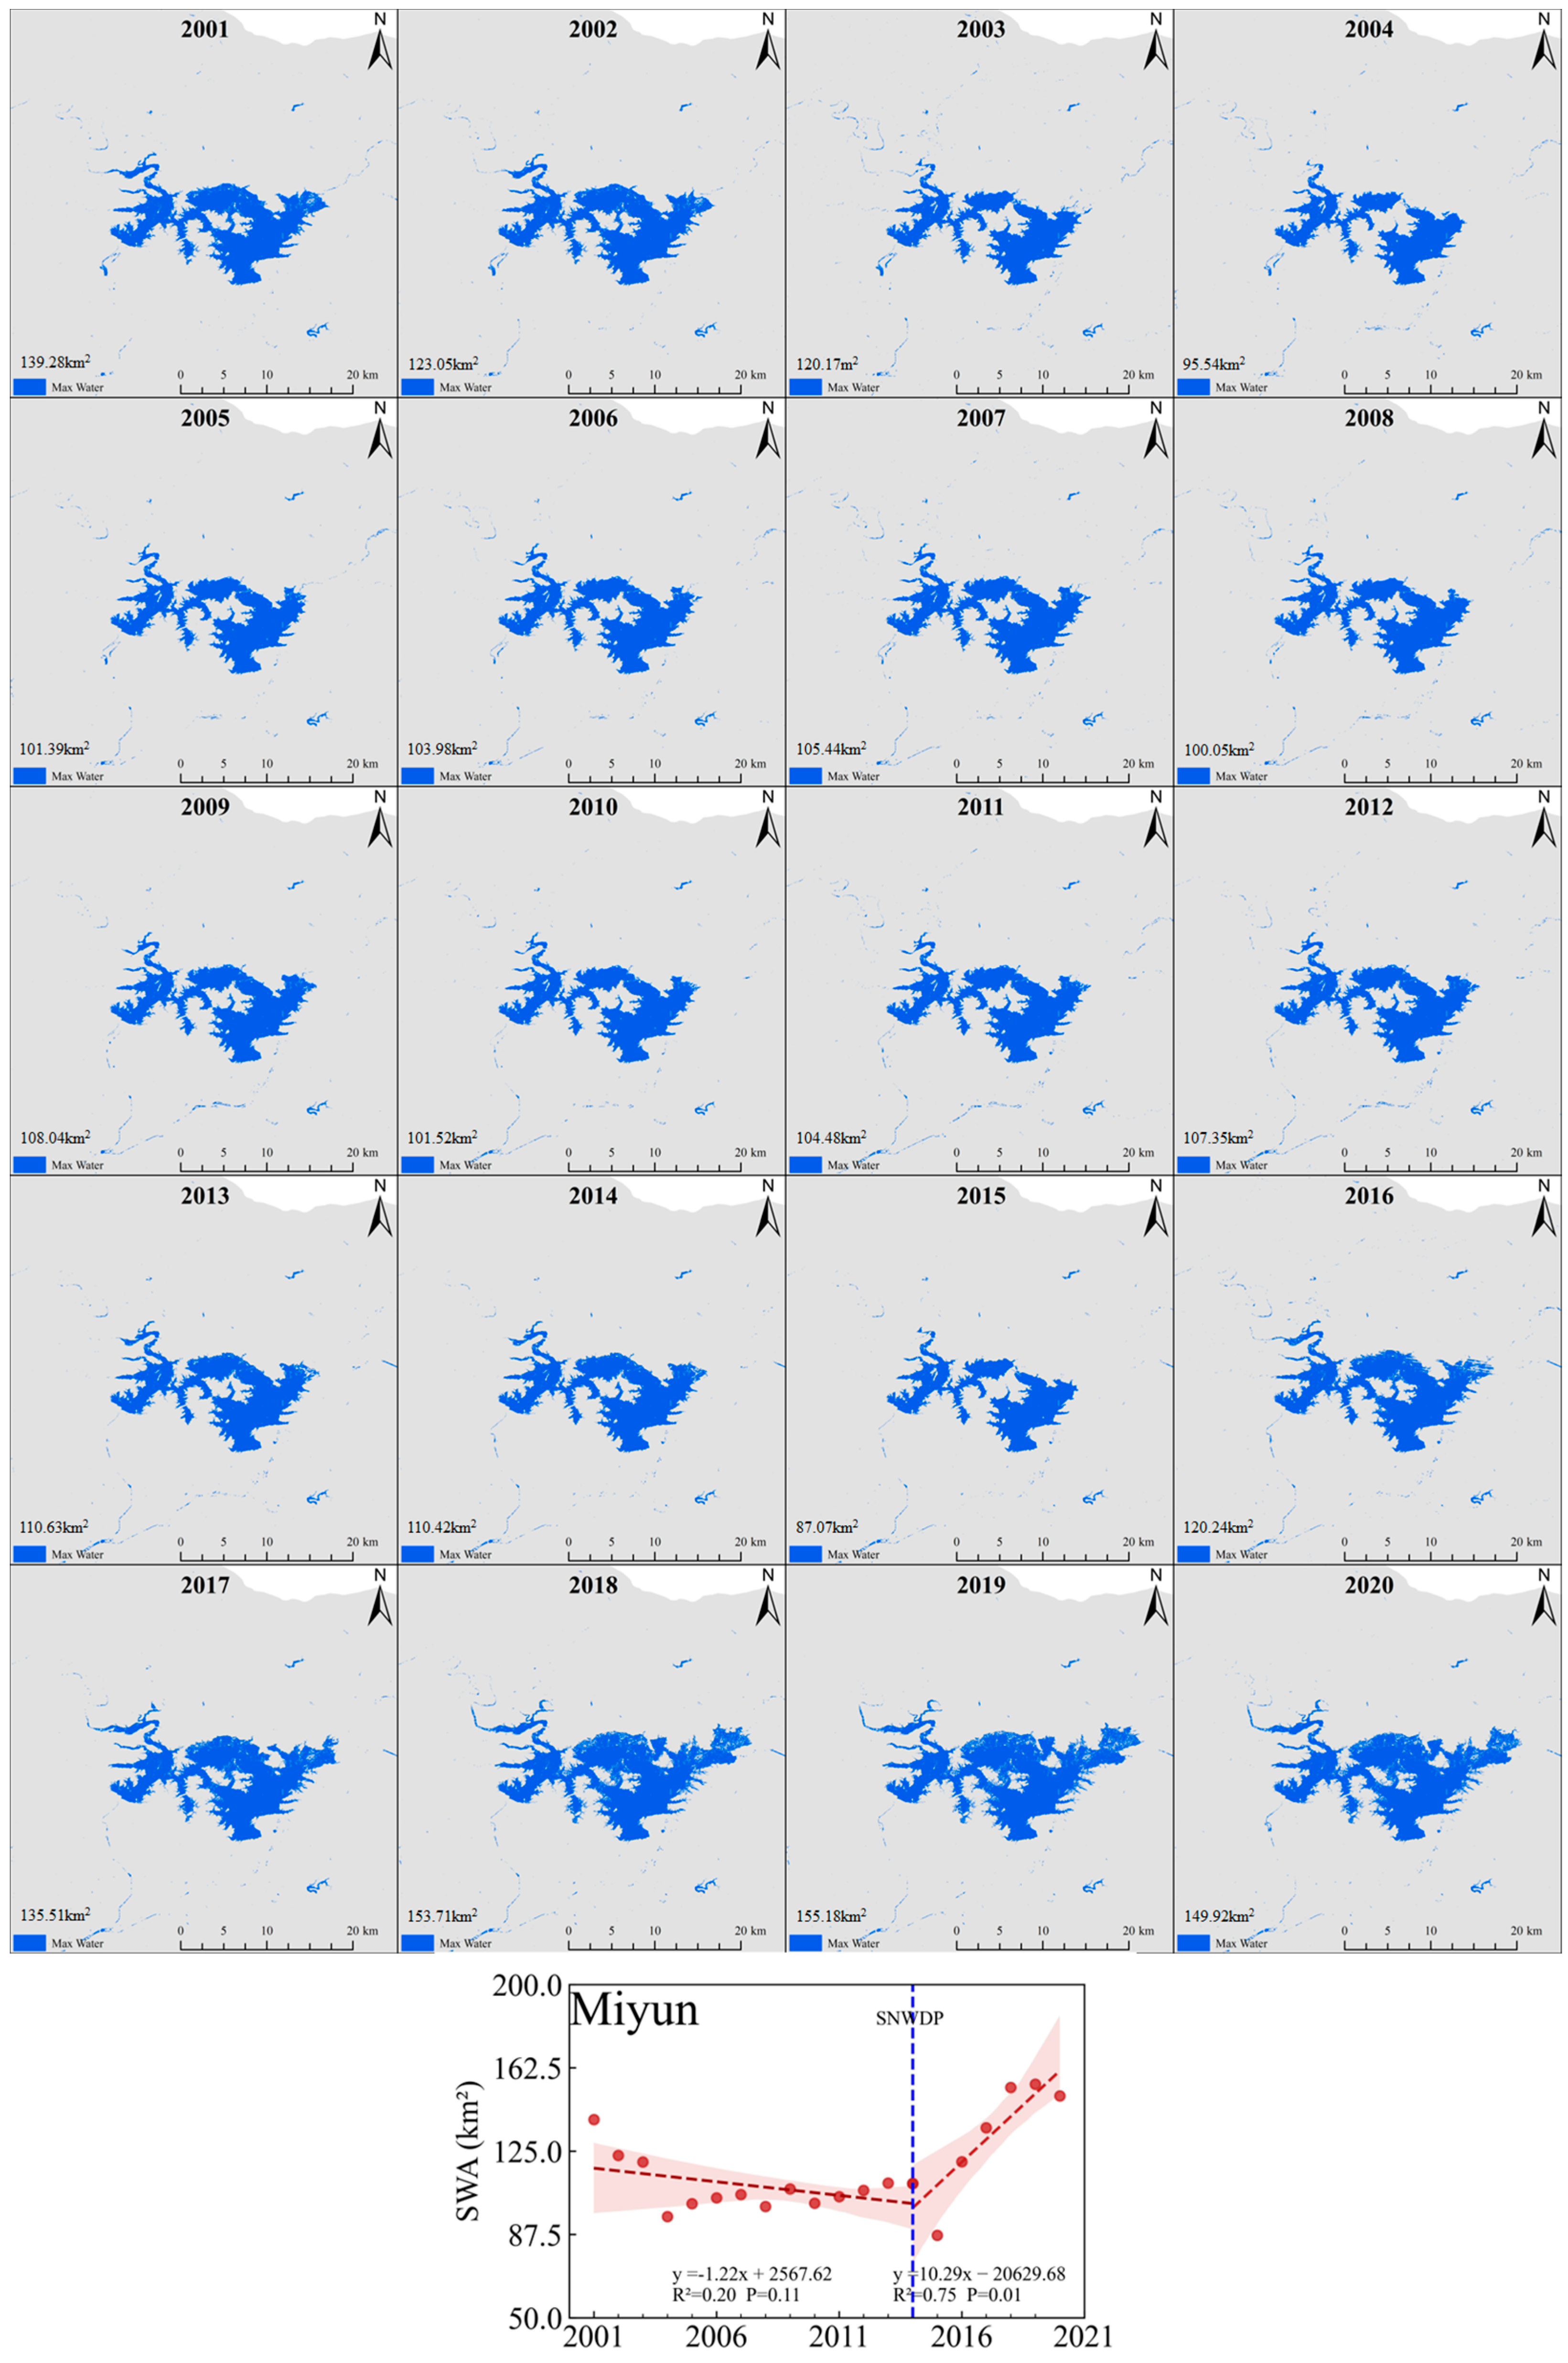
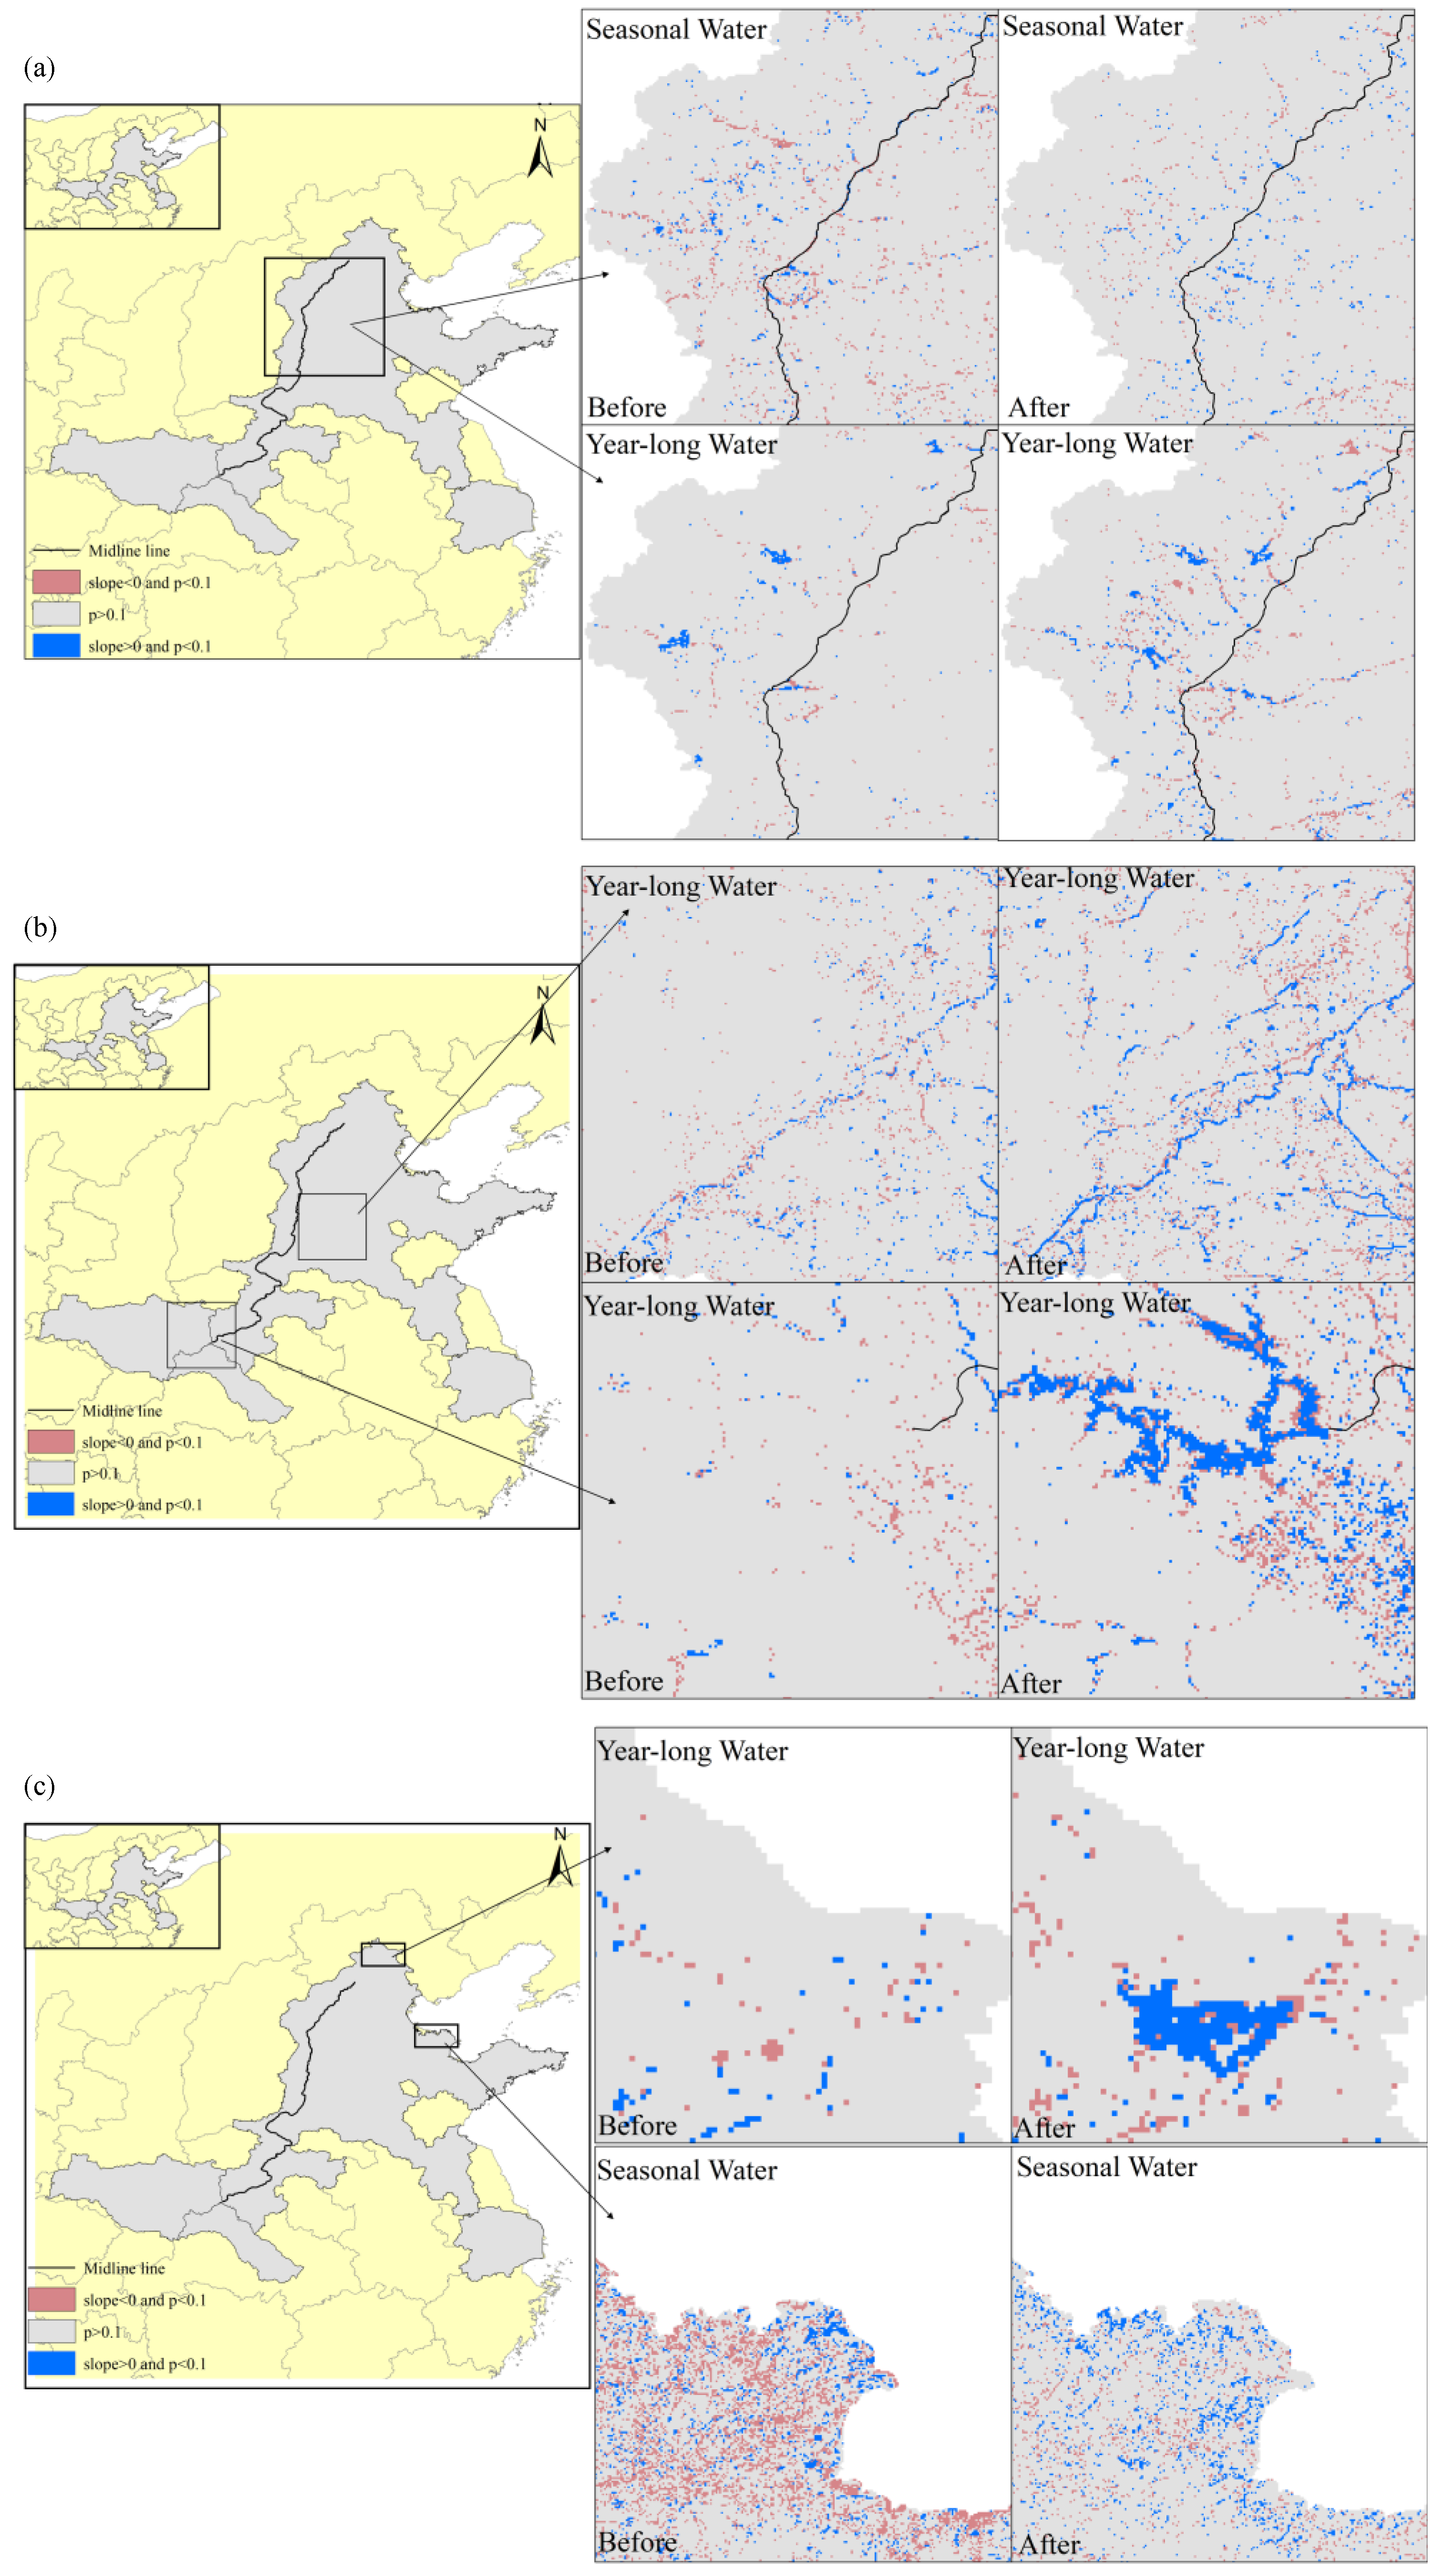
3.2. Changes in a Specific Water Body in a Typical Area
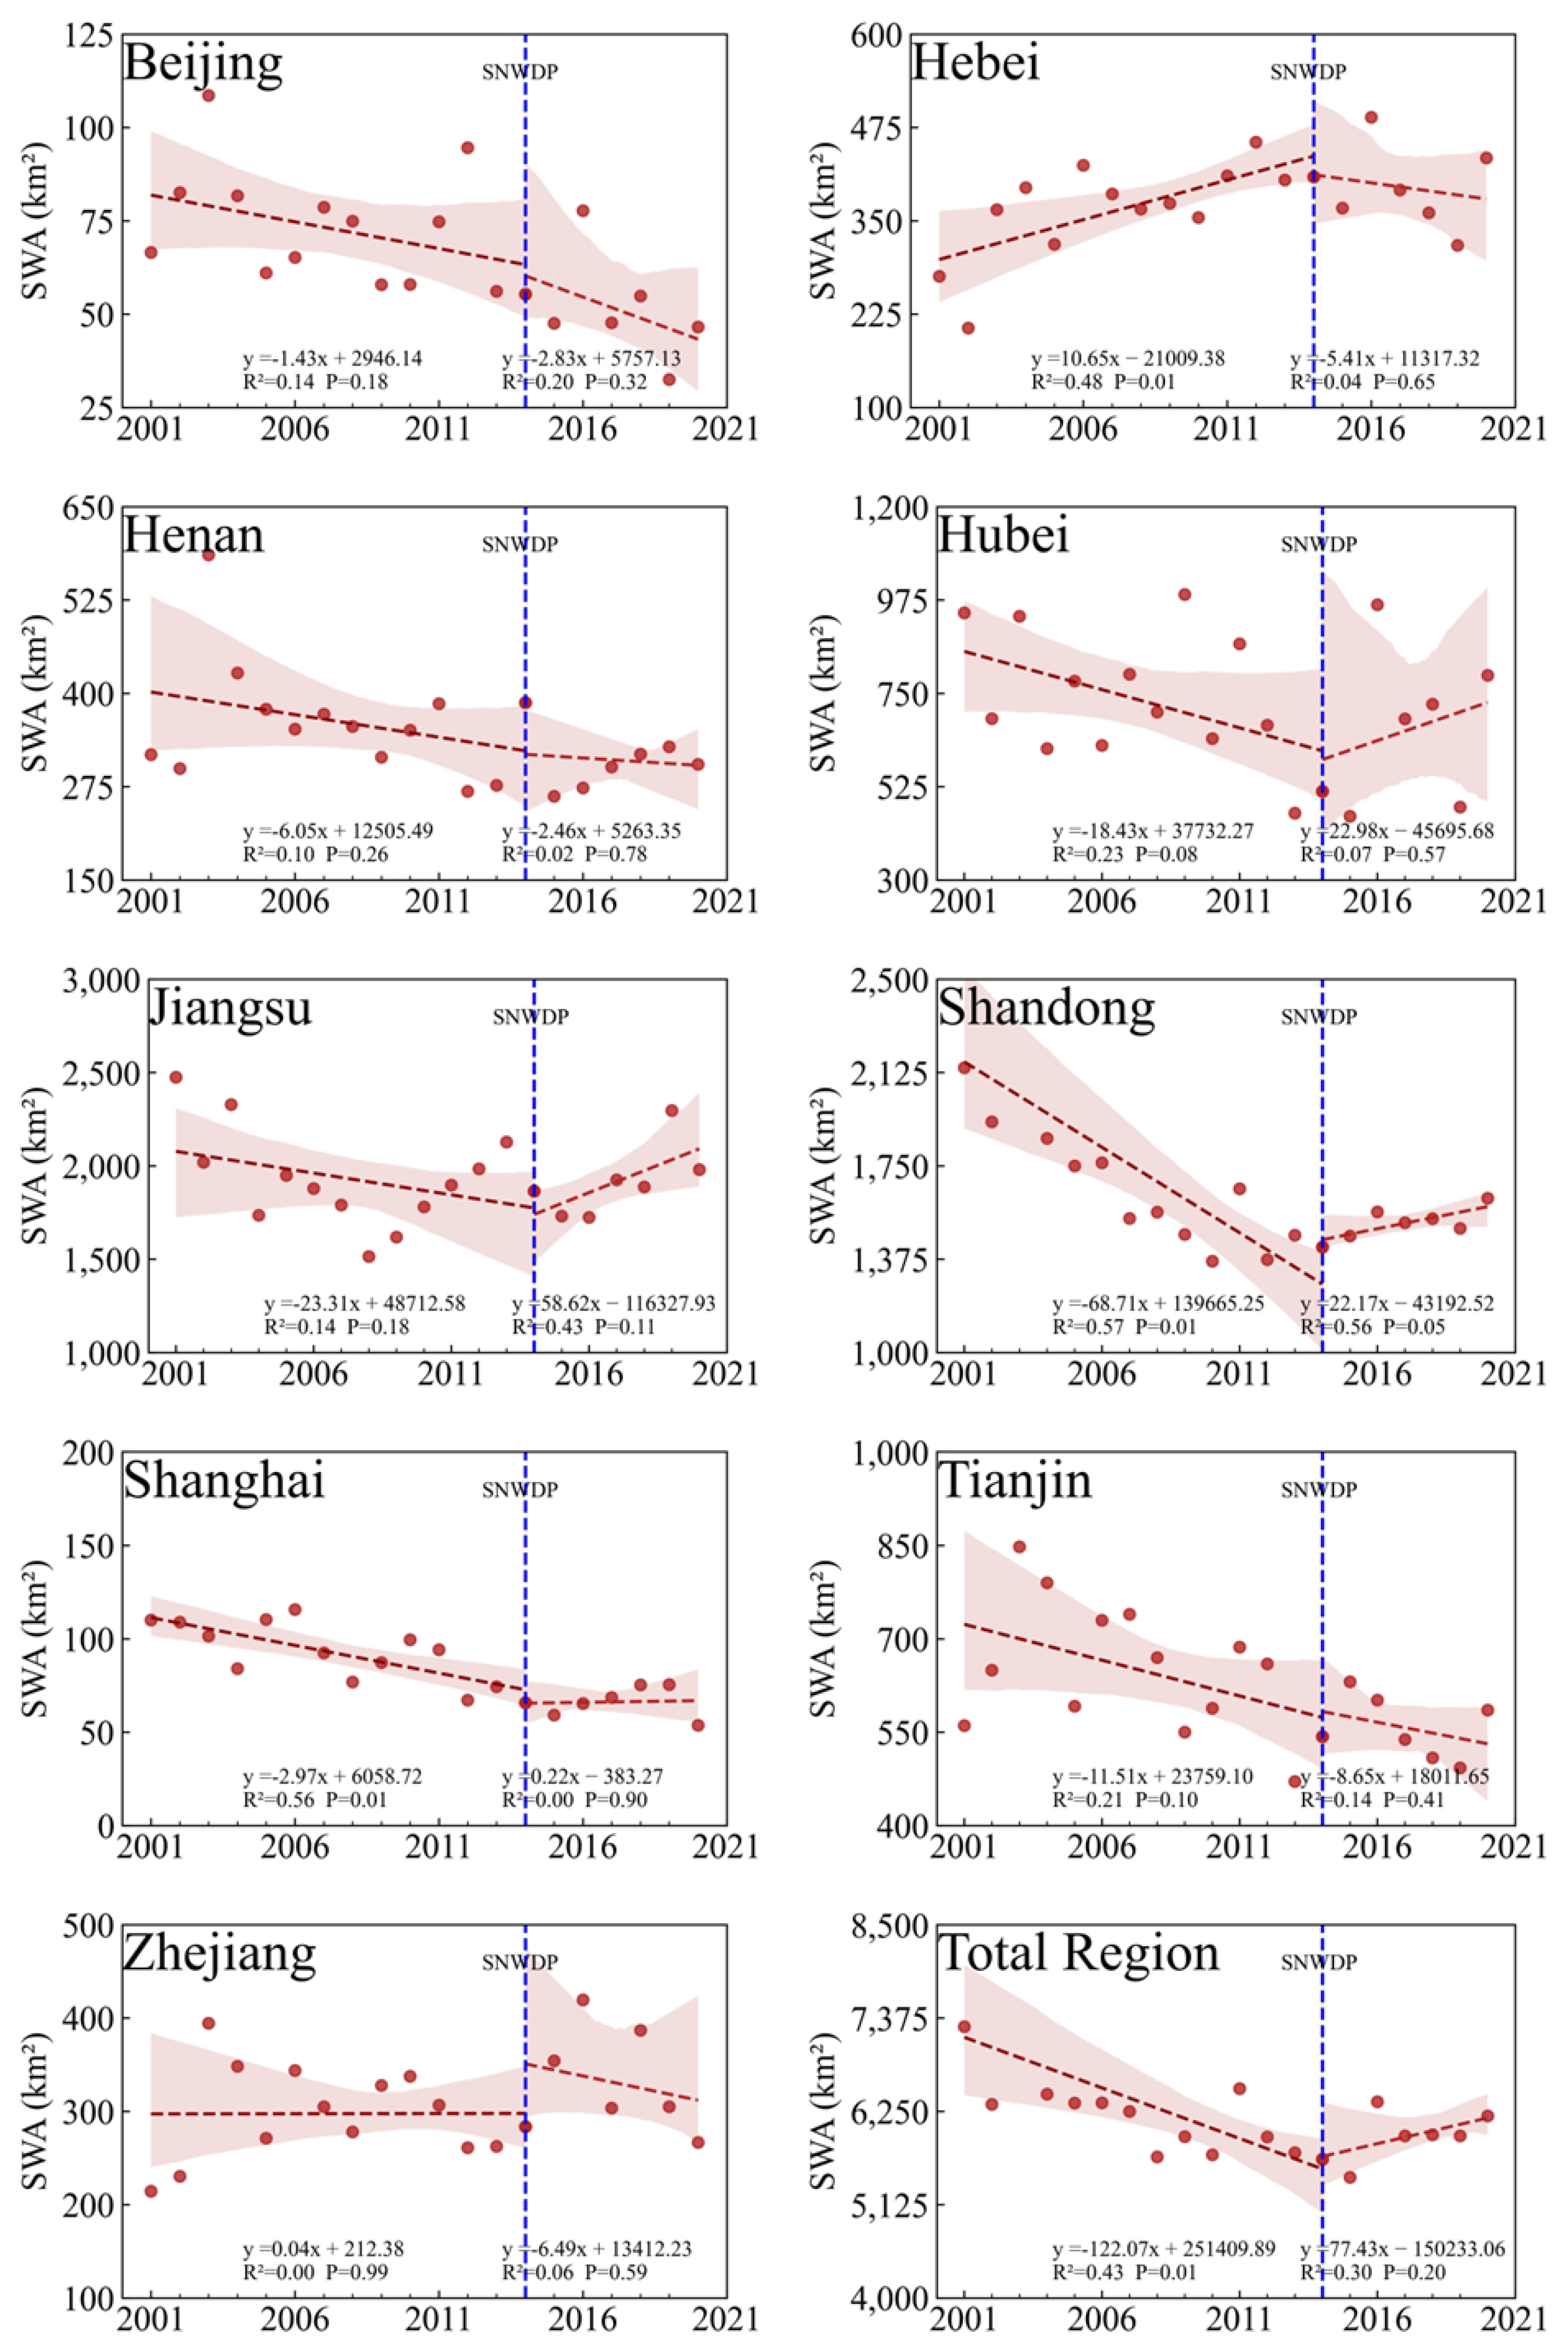
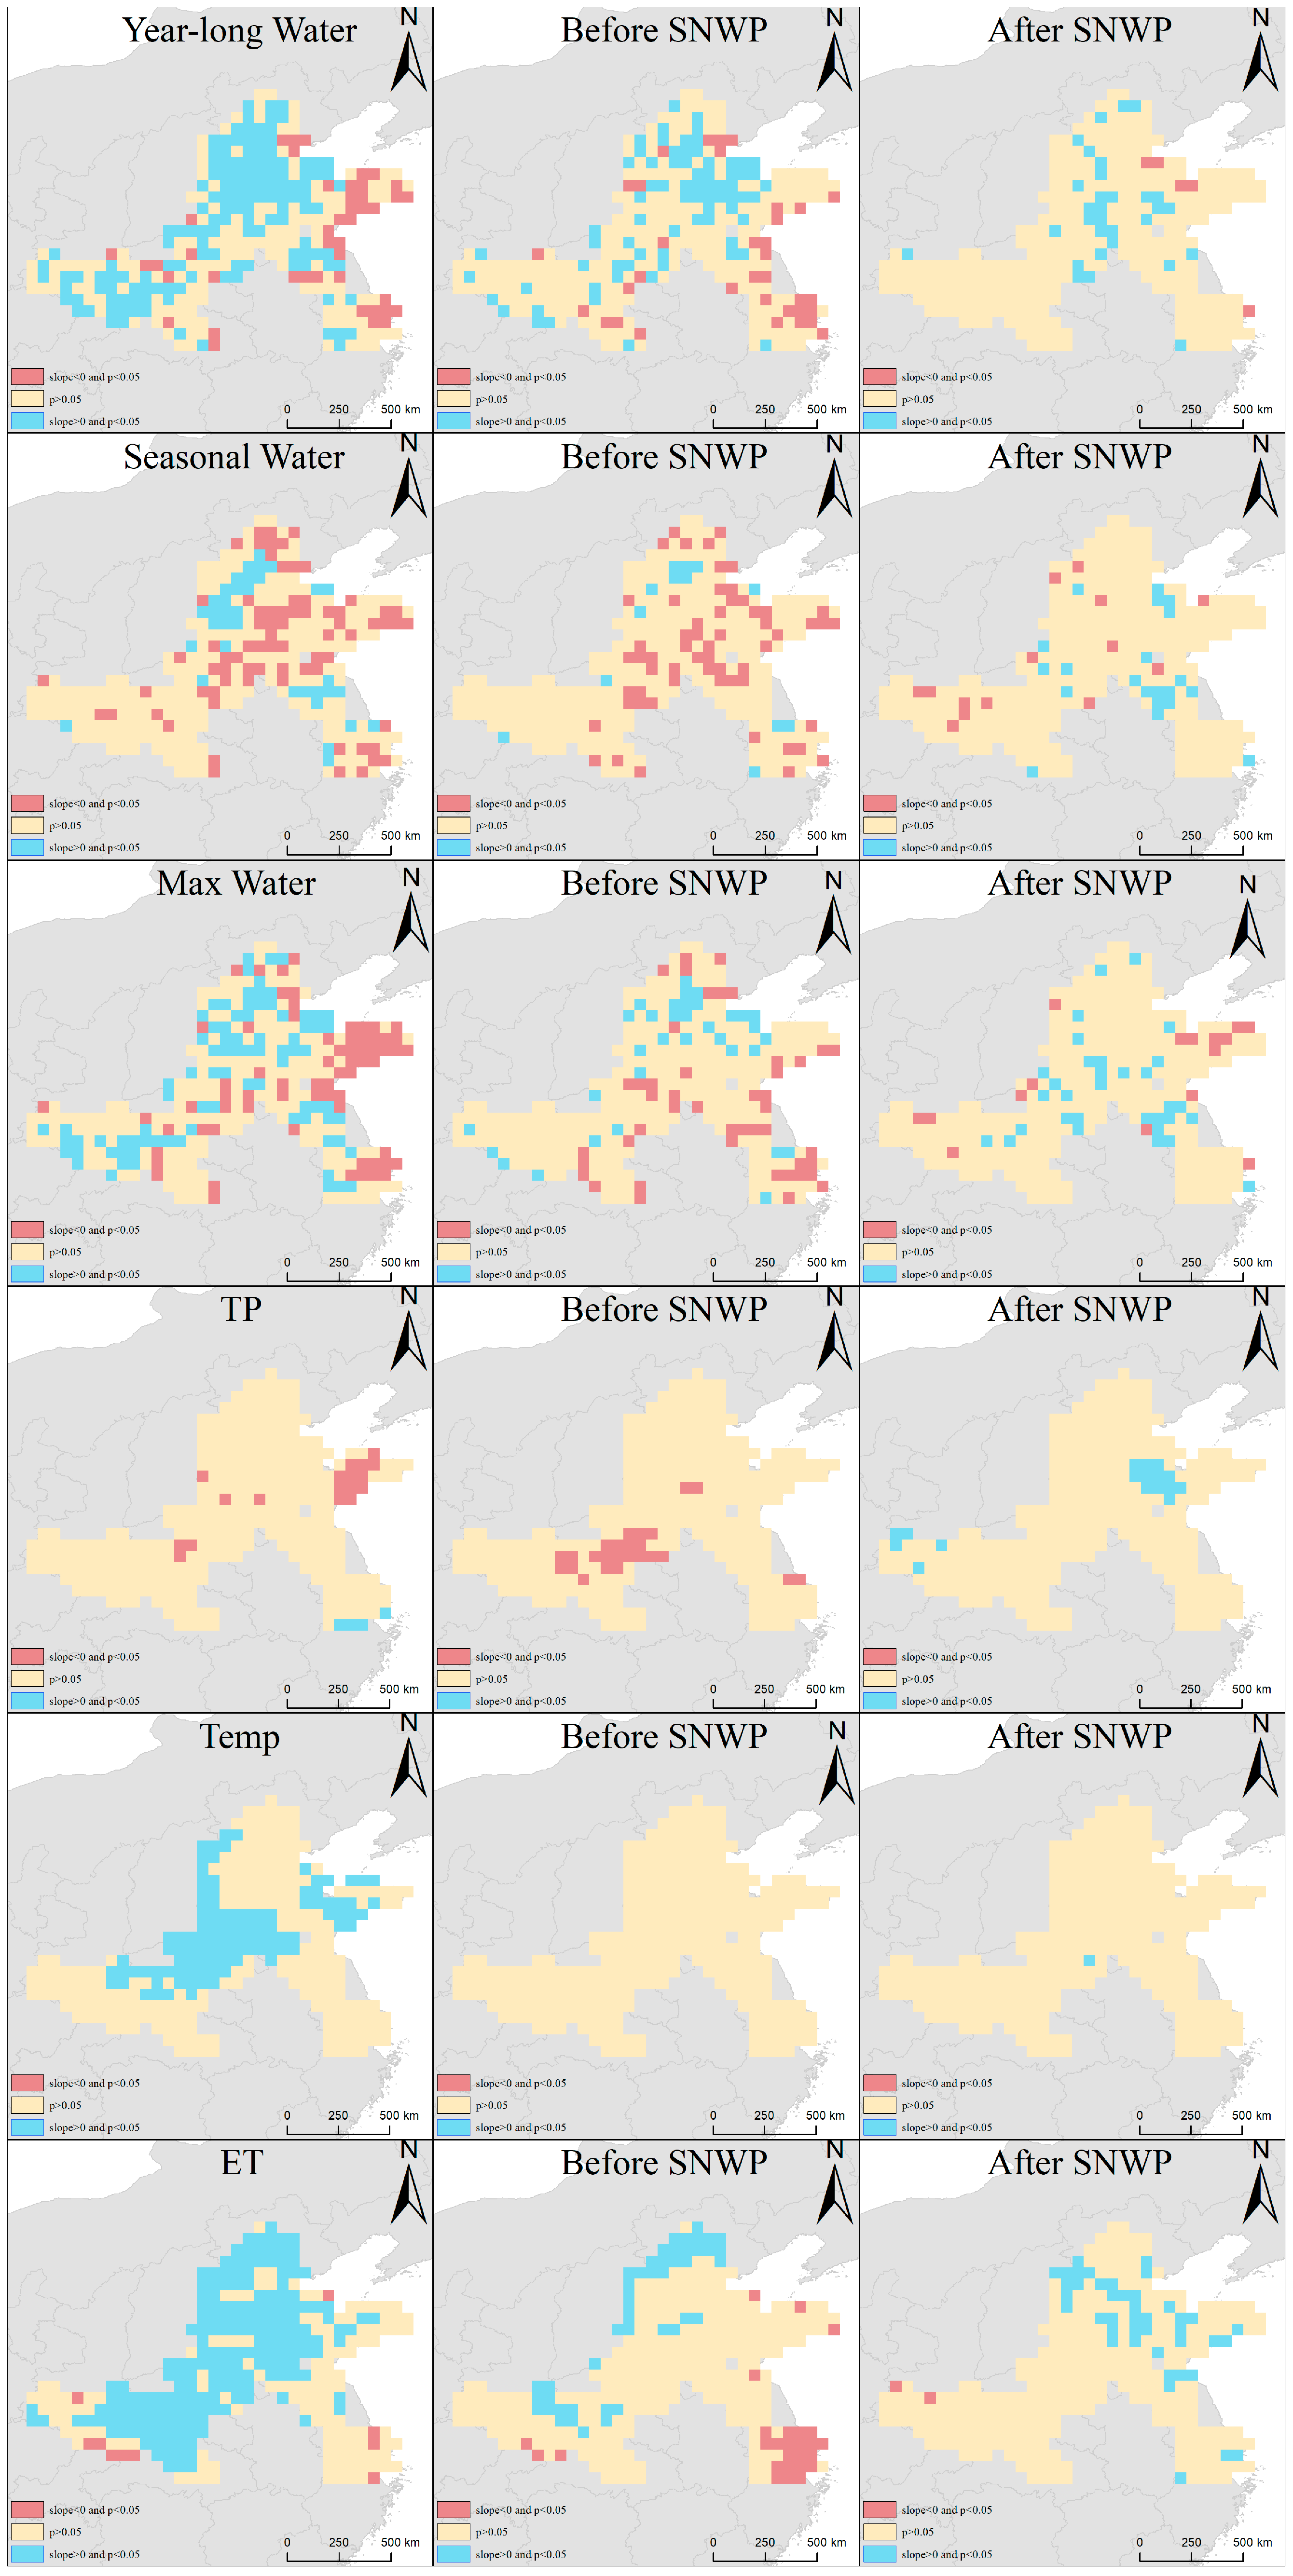
3.3. Temporal Trends
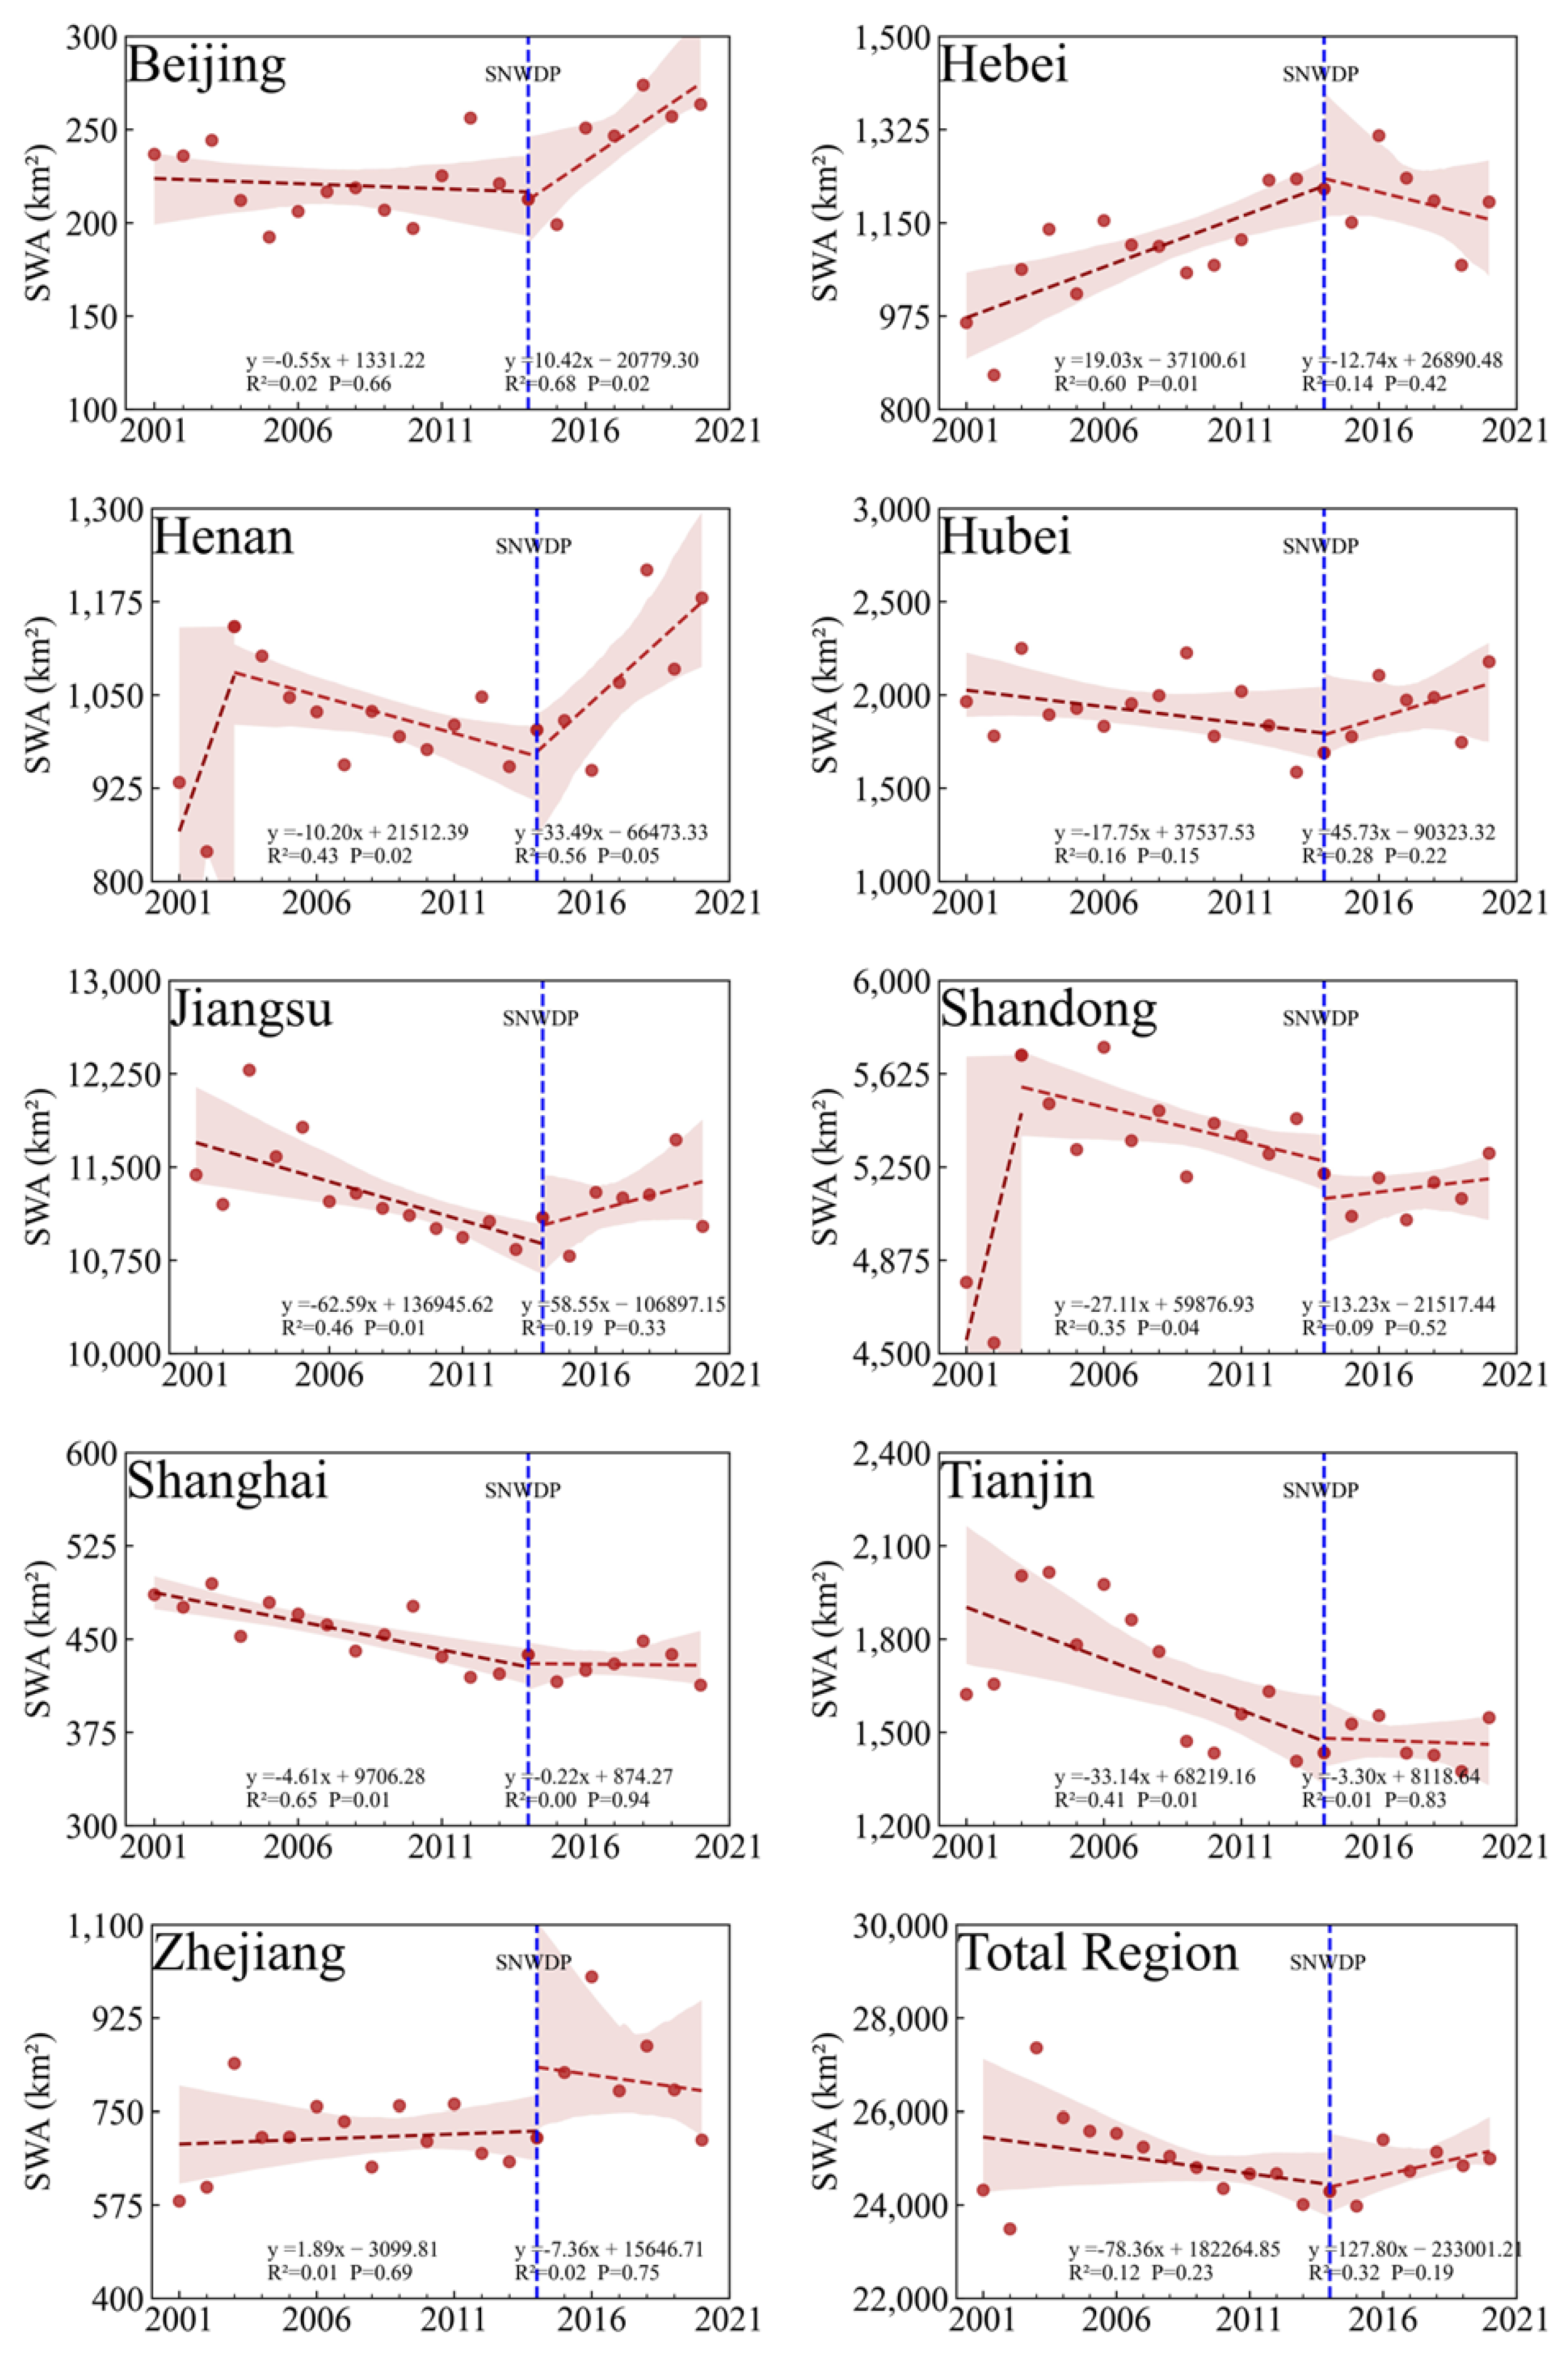
3.3.1. Trends in Max Water Body
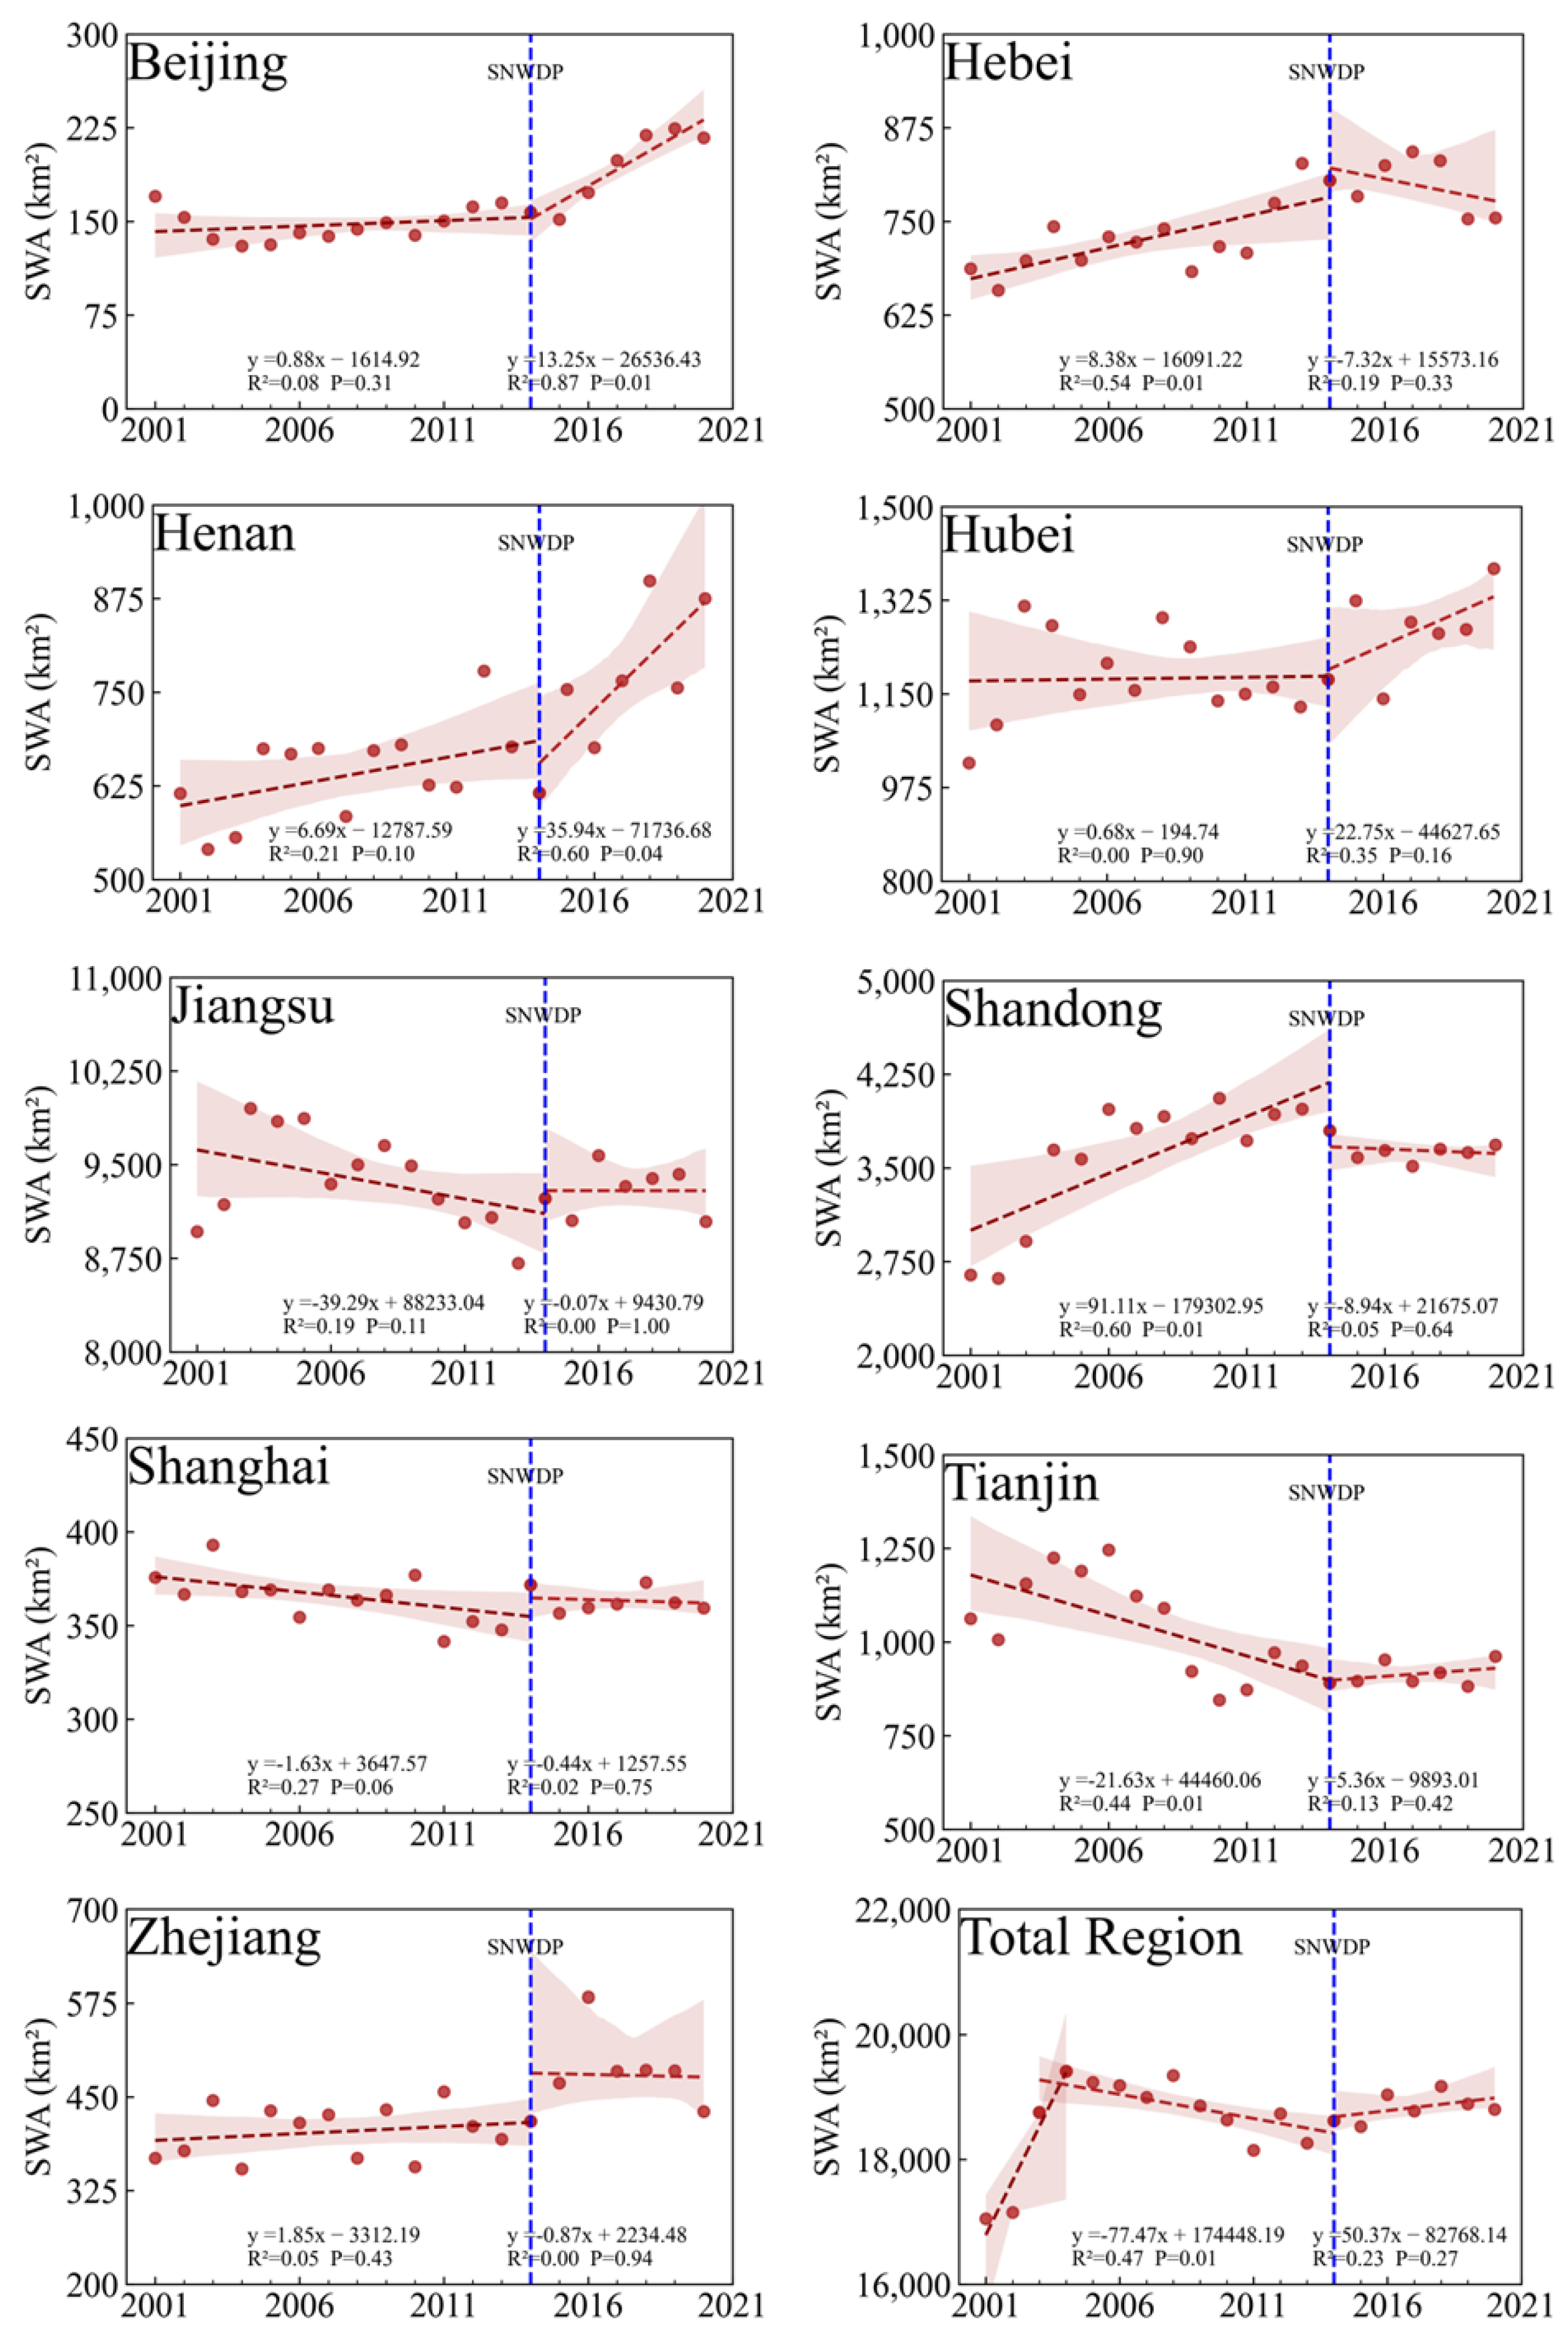
3.3.2. Trends in Year-Long Water Body
3.3.3. Trends in Seasonal Water Body
3.4. Detailed Spatial and Temporal Trends
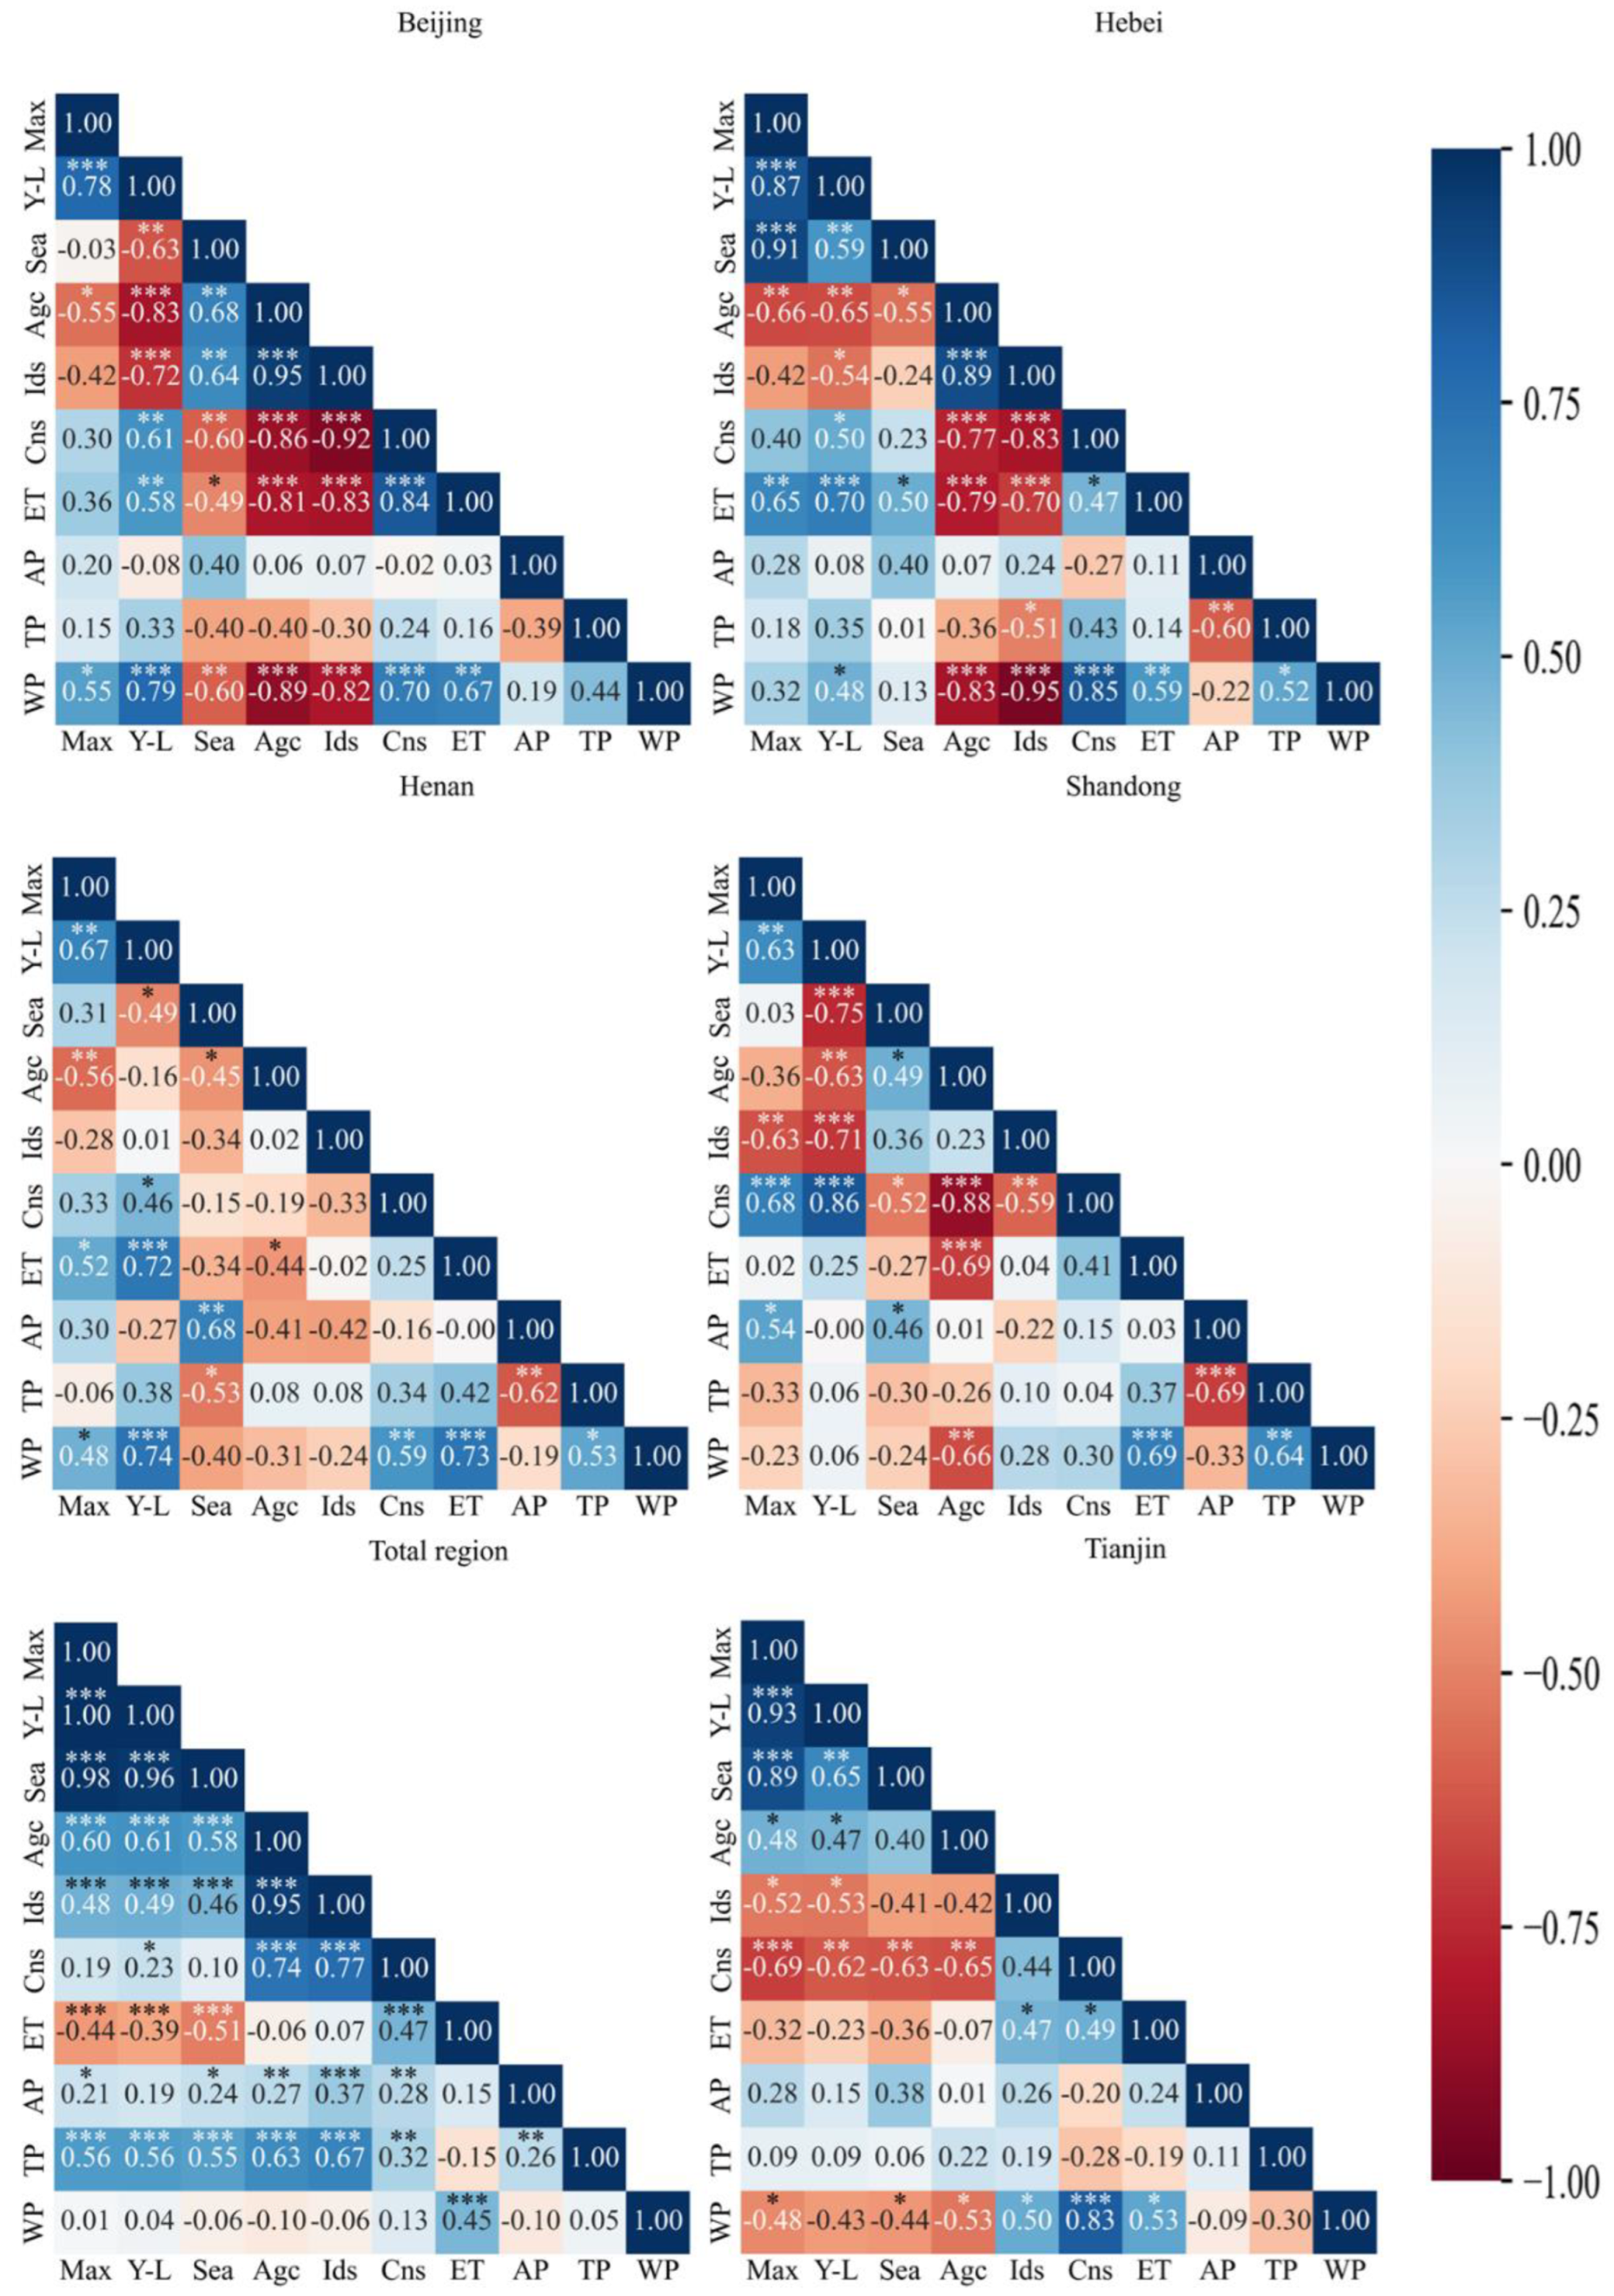
3.5. Drivers of Change in Water Bodies
4. Discussion
4.1. Reasons for Spatially Varied Changes
4.2. Impact of Recharge Intensity on Surface Water Bodies
4.3. Limitations and Perspectives
- (1)
- Water body identification. Despite efforts to improve the water body extraction algorithm and minimize errors during water identification through remote sensing, there may still be inaccuracies that could lead to misclassified or omitted water bodies. These limitations could have potentially affected the accuracy of water body identification in this study.
- (2)
- Complexity of surface water transformation. The transformation of surface water bodies is a complex phenomenon influenced by multiple factors. This study focused primarily on the connection between the SNWDP, meteorological factors, and water use factors that affect surface water area changes. However, to gain a more comprehensive understanding, future studies should explore the influence of other factors such as urbanization, water extraction, and the presence of artificial constructions that may also impact the mechanisms governing water body changes.
- (3)
- Local topography and morphology. The sensitivity of surface water area alterations is also influenced by local topography and the morphology of rivers, lakes, and reservoirs. These factors were not fully accounted for in this study. To better elucidate the overall impact of the SNWDP on surface water bodies, future studies should consider these local variations. Incorporating topographic and morphological data will provide a more accurate assessment of the project’s influence on surface water dynamics.
- (4)
- The regions affected by the South-to-North Water Diversion Project (SNWDP) include a large number of rivers, lakes, and reservoirs. The relationship between the surface water area and the total water volume of these water bodies may not be a simple correlation. Therefore, when assessing changes in surface water area, this study could not accurately assess the changes in total water volume and water resources in these areas. This factor should be considered in future research.
5. Conclusions
- (1)
- The impact of the SNWDP on the change in surface water area is heterogeneous, producing varying effects on different water bodies in different regions. Overall, the SNWDP has facilitated an increase in the year-long water body and max water body in the middle route area, while it has had almost no significant effect in the eastern route area. From a fine-scale perspective, the areas with a significant increase in surface water area are mainly concentrated near the middle route water transfer project and in Dongying City, Shandong Province. Both the Miyun Reservoir and the Danjiangkou Reservoir also show a significant increasing trend.
- (2)
- The SNWDP played a significant role in the expansion of year-long water bodies, max water bodies, and seasonal water bodies within the total receiving areas. However, the impact of the SNWDP on surface water area varies in different regions, highlighting the importance of adjusting water usage structures accordingly to protect surface water. Barren is an important source transferring to water areas, and a pattern of seasonal water bodies transitioning into year-long water bodies has been observed in Beijing City and Henan Province, indicating that the implementation of the SNWDP has also contributed to the hydro ecological restoration of the receiving areas.
Author Contributions
Funding
Data Availability Statement
Acknowledgments
Conflicts of Interest
References
- Shen, Z.; Zhang, Q.; Singh, V.P.; Pokhrel, Y.; Li, J.; Xu, C.-Y.; Wu, W. Drying in the Low-Latitude Atlantic Ocean Contributed to Terrestrial Water Storage Depletion across Eurasia. Nat. Commun. 2022, 13, 1849. [Google Scholar] [CrossRef] [PubMed]
- Wang, X.; Xiao, X.; Zou, Z.; Dong, J.; Qin, Y.; Doughty, R.B.; Menarguez, M.A.; Chen, B.; Wang, J.; Ye, H.; et al. Gainers and Losers of Surface and Terrestrial Water Resources in China during 1989–2016. Nat. Commun. 2020, 11, 3471. [Google Scholar] [CrossRef]
- Ma, T.; Sun, S.; Fu, G.; Hall, J.W.; Ni, Y.; He, L.; Yi, J.; Zhao, N.; Du, Y.; Pei, T.; et al. Pollution Exacerbates China’s Water Scarcity and Its Regional Inequality. Nat. Commun. 2020, 11, 650. [Google Scholar] [CrossRef] [PubMed]
- Piao, S.; Ciais, P.; Huang, Y.; Shen, Z.; Peng, S.; Li, J.; Zhou, L.; Liu, H.; Ma, Y.; Ding, Y.; et al. The Impacts of Climate Change on Water Resources and Agriculture in China. Nature 2010, 467, 43–51. [Google Scholar] [CrossRef] [PubMed]
- Wang, J.; Li, Y.; Huang, J.; Yan, T.; Sun, T. Growing Water Scarcity, Food Security and Government Responses in China. Glob. Food Secur. 2017, 14, 9–17. [Google Scholar] [CrossRef]
- Li, P.; Qian, H. Water Resources Research to Support a Sustainable China. Int. J. Water Resour. Dev. 2018, 34, 327–336. [Google Scholar] [CrossRef]
- Zhao, S.; Liu, W.; Zhu, M.; Ma, Y.; Li, Z. A Priority-Based Multi-Objective Framework for Water Resources Diversion and Allocation in the Middle Route of the South-to-North Water Diversion Project. Socio-Econ. Plan. Sci. 2021, 78, 101085. [Google Scholar] [CrossRef]
- He, Y.; Wang, Y.; Chen, X. Spatial Patterns and Regional Differences of Inequality in Water Resources Exploitation in China. J. Clean. Prod. 2019, 227, 835–848. [Google Scholar] [CrossRef]
- Zhao, F.; Wang, X.; Wu, Y.; Singh, S.K. Prefectures Vulnerable to Water Scarcity Are Not Evenly Distributed across China. Commun. Earth Environ. 2023, 4, 145. [Google Scholar] [CrossRef]
- Varis, O.; Vakkilainen, P. China’s 8 Challenges to Water Resources Management in the First Quarter of the 21st Century. Geomorphology 2001, 41, 93–104. [Google Scholar] [CrossRef]
- Liu, M.; Wei, J.; Wang, G.; Wang, F. Water Resources Stress Assessment and Risk Early Warning—A Case of Hebei Province China. Ecol. Indic. 2017, 73, 358–368. [Google Scholar] [CrossRef]
- Zuo, L.; Zhang, Z.; Carlson, K.M.; MacDonald, G.K.; Brauman, K.A.; Liu, Y.; Zhang, W.; Zhang, H.; Wu, W.; Zhao, X.; et al. Progress towards Sustainable Intensification in China Challenged by Land-Use Change. Nat. Sustain. 2018, 1, 304–313. [Google Scholar] [CrossRef]
- Qin, J.; Ding, Y.-J.; Zhao, Q.-D.; Wang, S.-P.; Chang, Y.-P. Assessments on Surface Water Resources and Their Vulnerability and Adaptability in China. Adv. Clim. Chang. Res. 2020, 11, 381–391. [Google Scholar] [CrossRef]
- He, C.; He, X.; Fu, L. China’s South-to-North Water Transfer Project: Is It Needed? China’s South-to-North Water Transfer Project. Geogr. Compass 2010, 4, 1312–1323. [Google Scholar] [CrossRef]
- Kattel, G.R.; Shang, W.; Wang, Z.; Langford, J. China’s South-to-North Water Diversion Project Empowers Sustainable Water Resources System in the North. Sustainability 2019, 11, 3735. [Google Scholar] [CrossRef]
- Peng, Z.; Yin, J.; Zhang, L.; Zhao, J.; Liang, Y.; Wang, H. Assessment of the Socio-Economic Impactof a Water Diversion Project Fora Water-Receiving Area. Pol. J. Environ. Stud. 2020, 29, 1771–1784. [Google Scholar] [CrossRef]
- Long, Y.; Li, Y.; Lei, X.; Hou, Y.; Guo, S.; Sun, J. A Study on Comprehensive Evaluation Methods for Coordinated Development of Water Diversion Projects Based on Advanced SWOT Analysis and Coupling Coordination Model. Sustainability 2021, 13, 13600. [Google Scholar] [CrossRef]
- Gao, W.; Zeng, Y.; Liu, Y.; Wu, B. Human Activity Intensity Assessment by Remote Sensing in the Water Source Area of the Middle Route of the South-to-North Water Diversion Project in China. Sustainability 2019, 11, 5670. [Google Scholar] [CrossRef]
- Zhang, J.; Zhang, Y.; Sun, G.; Song, C.; Dannenberg, M.P.; Li, J.; Liu, N.; Zhang, K.; Zhang, Q.; Hao, L. Vegetation Greening Weakened the Capacity of Water Supply to China’s South-to-North Water Diversion Project. Hydrol. Earth Syst. Sci. 2021, 25, 5623–5640. [Google Scholar] [CrossRef]
- Yang, Z.; Huang, X.; Fang, G.; Ye, J.; Lu, C. Benefit Evaluation of East Route Project of South to North Water Transfer Based on Trapezoid Cloud Model. Agric. Water Manag. 2021, 254, 106960. [Google Scholar] [CrossRef]
- Tan, L.; Luo, W.; Yang, B.; Huang, M.; Shuai, S.; Cheng, C.; Zhou, X.; Li, M.; Hu, C. Evaluation of Landscape Ecological Risk in Key Ecological Functional Zone of South–to–North Water Diversion Project, China. Ecol. Indic. 2023, 147, 109934. [Google Scholar] [CrossRef]
- Rogers, S.; Barnett, J.; Webber, M.; Finlayson, B.; Wang, M. Governmentality and the Conduct of Water: China’s South–North Water Transfer Project. Trans. Inst. Br. Geogr. 2016, 41, 429–441. [Google Scholar] [CrossRef]
- Wang, K.; Wang, Z.; Liu, K.; Cheng, L.; Wang, L.; Ye, A. Impacts of the Eastern Route of the South-to-North Water Diversion Project Emergency Operation on Flooding and Drainage in Water-Receiving Areas: An Empirical Case in China. Nat. Hazards Earth Syst. Sci. 2019, 19, 555–570. [Google Scholar] [CrossRef]
- Long, D.; Yang, W.; Scanlon, B.R.; Zhao, J.; Liu, D.; Burek, P.; Pan, Y.; You, L.; Wada, Y. South-to-North Water Diversion Stabilizing Beijing’s Groundwater Levels. Nat. Commun. 2020, 11, 3665. [Google Scholar] [CrossRef]
- Zhang, C.; Duan, Q.; Yeh, P.J.F.; Pan, Y.; Gong, H.; Moradkhani, H.; Gong, W.; Lei, X.; Liao, W.; Xu, L.; et al. Sub-Regional Groundwater Storage Recovery in North China Plain after the South-to-North Water Diversion Project. J. Hydrol. 2021, 597, 126156. [Google Scholar] [CrossRef]
- Du, Z.; Ge, L.; Ng, A.H.-M.; Lian, X.; Zhu, Q.; Horgan, F.G.; Zhang, Q. Analysis of the Impact of the South-to-North Water Diversion Project on Water Balance and Land Subsidence in Beijing, China between 2007 and 2020. J. Hydrol. 2021, 603, 126990. [Google Scholar] [CrossRef]
- Abbott, B.W.; Bishop, K.; Zarnetske, J.P.; Minaudo, C.; Chapin, F.S.; Krause, S.; Hannah, D.M.; Conner, L.; Ellison, D.; Godsey, S.E.; et al. Human Domination of the Global Water Cycle Absent from Depictions and Perceptions. Nat. Geosci. 2019, 12, 533–540. [Google Scholar] [CrossRef]
- Subin, Z.M.; Riley, W.J.; Mironov, D. An Improved Lake Model for Climate Simulations: Model Structure, Evaluation, and Sensitivity Analyses in CESM1. J. Adv. Model. Earth Syst. 2012, 4, M02001. [Google Scholar] [CrossRef]
- Su, D.; Wen, L.; Huang, A.; Wu, Y.; Gao, X.; Wang, M.; Zhao, Y.; Kirillin, G. Simulation of the Potential Impacts of Lakes on Glacier Behavior over the Tibetan Plateau in Summer. Clim. Dyn. 2023, 60, 3435–3454. [Google Scholar] [CrossRef]
- Woolway, R.I.; Huang, L.; Sharma, S.; Lee, S.; Rodgers, K.B.; Timmermann, A. Lake Ice Will Be Less Safe for Recreation and Transportation under Future Warming. Earth’s Future 2022, 10, e2022EF002907. [Google Scholar] [CrossRef]
- Erler, A.R.; Frey, S.K.; Khader, O.; d’Orgeville, M.; Park, Y.; Hwang, H.; Lapen, D.R.; Richard Peltier, W.; Sudicky, E.A. Simulating Climate Change Impacts on Surface Water Resources within a Lake-Affected Region Using Regional Climate Projections. Water Resour. Res. 2019, 55, 130–155. [Google Scholar] [CrossRef]
- Tiwari, A.D.; Pokhrel, Y.; Kramer, D.; Akhter, T.; Tang, Q.; Liu, J.; Qi, J.; Loc, H.H.; Lakshmi, V. A Synthesis of Hydroclimatic, Ecological, and Socioeconomic Data for Transdisciplinary Research in the Mekong. Sci. Data 2023, 10, 283. [Google Scholar] [CrossRef] [PubMed]
- Vörösmarty, C.J.; Green, P.; Salisbury, J.; Lammers, R.B. Global Water Resources: Vulnerability from Climate Change and Population Growth. Sci. New Ser. 2000, 289, 284–288. [Google Scholar] [CrossRef] [PubMed]
- Ren, G.; Liu, H.; Chu, Z.; Zhang, L.; Li, X.; Li, W.; Chen, Y.; Gao, G.; Zhang, Y. Multi-Time-Scale Climatic Variations over Eastern China and Implications for the South–North Water Diversion Project. J. Hydrometeorol. 2011, 12, 600–617. [Google Scholar] [CrossRef]
- Xu, Y.; Xu, X.; Tang, Q. Human Activity Intensity of Land Surface: Concept, Methods and Application in China. J. Geogr. Sci. 2016, 26, 1349–1361. [Google Scholar] [CrossRef]
- Li, Z.; Liu, Y. Research on the Spatial Distribution Pattern and Influencing Factors of Digital Economy Development in China. IEEE Access 2021, 9, 63094–63106. [Google Scholar] [CrossRef]
- Wang, J.; Han, Q.; Wu, K.; Xu, Z.; Liu, P. Spatial-Temporal Patterns and Evolution Characteristics of the Coordinated Development of Industrial Economy, Natural Resources and Environment in China. Resour. Policy 2022, 75, 102463. [Google Scholar] [CrossRef]
- Zhao, A.; Xiang, K.; Zhang, A.; Zhang, X. Spatial-Temporal Evolution of Meteorological and Groundwater Droughts and Their Relationship in the North China Plain. J. Hydrol. 2022, 610, 127903. [Google Scholar] [CrossRef]
- Li, Y.; Xiong, W.; Zhang, W.; Wang, C.; Wang, P. Life Cycle Assessment of Water Supply Alternatives in Water-Receiving Areas of the South-to-North Water Diversion Project in China. Water Res. 2016, 89, 9–19. [Google Scholar] [CrossRef]
- Gao, W.; Zeng, Y.; Zhao, D.; Wu, B.; Ren, Z. Land Cover Changes and Drivers in the Water Source Area of the Middle Route of the South-to-North Water Diversion Project in China from 2000 to 2015. Chin. Geogr. Sci. 2020, 30, 115–126. [Google Scholar] [CrossRef]
- Zhong, H.; Liao, T.; Fang, G.; Ren, K.; Zhang, S. Exploring Optimal Joint Operating Rules for Large-Scale Inter-Basin Water Transfer Projects with Multiple Water Sources, Diversion Routes, and Water Demand Areas. J. Hydrol. Reg. Stud. 2023, 49, 101504. [Google Scholar] [CrossRef]
- Lv, A.; Han, Y.; Zhu, W.; Zhang, S.; Zhao, W. Risk Assessment of Water Resources Carrying Capacity in China. J. Am. Water Resour. Assoc. 2021, 57, 539–551. [Google Scholar] [CrossRef]
- Han, Y.; Zhang, S.; Lv, A.; Zeng, H. Risk Assessment of the Water Resources Carrying Capacity: A Case Study in North China. J. Am. Water Resour. Assoc. 2022, 58, 1240–1254. [Google Scholar] [CrossRef]
- Liu, J.; Li, M.; Wu, M.; Luan, X.; Wang, W.; Yu, Z. Influences of the South–to-North Water Diversion Project and Virtual Water Flows on Regional Water Resources Considering both Water Quantity and Quality. J. Clean. Prod. 2020, 244, 118920. [Google Scholar] [CrossRef]
- Liu, Y.; Xin, Z.; Sun, S.; Zhang, C.; Fu, G. Assessing Environmental, Economic, and Social Impacts of Inter-Basin Water Transfer in China. J. Hydrol. 2023, 625, 130008. [Google Scholar] [CrossRef]
- Li, Y.; Dang, B.; Zhang, Y.; Du, Z. Water Body Classification from High-Resolution Optical Remote Sensing Imagery: Achievements and Perspectives. ISPRS J. Photogramm. Remote Sens. 2022, 187, 306–327. [Google Scholar] [CrossRef]
- Chen, J.; Chen, S.; Fu, R.; Li, D.; Jiang, H.; Wang, C.; Peng, Y.; Jia, K.; Hicks, B.J. Remote Sensing Big Data for Water Environment Monitoring: Current Status, Challenges, and Future Prospects. Earth’s Future 2022, 10, e2021EF002289. [Google Scholar] [CrossRef]
- Zhou, Y.; Dong, J.; Cui, Y.; Zhou, S.; Li, Z.; Wang, X.; Deng, X.; Zou, Z.; Xiao, X. Rapid Surface Water Expansion Due to Increasing Artificial Reservoirs and Aquaculture Ponds in North China Plain. J. Hydrol. 2022, 608, 127637. [Google Scholar] [CrossRef]
- Zhou, Y.; Dong, J.; Cui, Y.; Zhao, M.; Wang, X.; Tang, Q.; Zhang, Y.; Zhou, S.; Metternicht, G.; Zou, Z.; et al. Ecological Restoration Exacerbates the Agriculture-Induced Water Crisis in North China Region. Agric. For. Meteorol. 2023, 331, 109341. [Google Scholar] [CrossRef]
- Yang, X.; Qin, Q.; Grussenmeyer, P.; Koehl, M. Urban Surface Water Body Detection with Suppressed Built-up Noise Based on Water Indices from Sentinel-2 MSI Imagery. Remote Sens. Environ. 2018, 219, 259–270. [Google Scholar] [CrossRef]
- Li, Z.; Zhang, X.; Xiao, P. Spectral Index-Driven FCN Model Training for Water Extraction from Multispectral Imagery. ISPRS J. Photogramm. Remote Sens. 2022, 192, 344–360. [Google Scholar] [CrossRef]
- Zou, Z.; Xiao, X.; Dong, J.; Qin, Y.; Doughty, R.B.; Menarguez, M.A.; Zhang, G.; Wang, J. Divergent Trends of Open-Surface Water Body Area in the Contiguous United States from 1984 to 2016. Proc. Natl. Acad. Sci. USA 2018, 115, 3810–3815. [Google Scholar] [CrossRef]
- Wang, X.; Xiao, X.; Qin, Y.; Dong, J.; Wu, J.; Li, B. Improved Maps of Surface Water Bodies, Large Dams, Reservoirs, and Lakes in China. Earth Syst. Sci. Data 2022, 14, 3757–3771. [Google Scholar] [CrossRef]
- Muñoz-Sabater, J.; Dutra, E.; Agustí-Panareda, A.; Albergel, C.; Arduini, G.; Balsamo, G.; Boussetta, S.; Choulga, M.; Harrigan, S.; Hersbach, H.; et al. ERA5-Land: A State-of-the-Art Global Reanalysis Dataset for Land Applications. Earth Syst. Sci. Data 2021, 13, 4349–4383. [Google Scholar] [CrossRef]
- Jiao, D.; Xu, N.; Yang, F.; Xu, K. Evaluation of Spatial-Temporal Variation Performance of ERA5 Precipitation Data in China. Sci. Rep. 2021, 11, 17956. [Google Scholar] [CrossRef] [PubMed]
- Xu, J.; Ma, Z.; Yan, S.; Peng, J. Do ERA5 and ERA5-Land Precipitation Estimates Outperform Satellite-Based Precipitation Products? A Comprehensive Comparison between State-of-the-Art Model-Based and Satellite-Based Precipitation Products over Mainland China. J. Hydrol. 2022, 605, 127353. [Google Scholar] [CrossRef]
- Running, S.; Mu, Q.; Zhao, M. MOD16A2 MODIS/Terra Net Evapotranspiration 8-Day L4 Global 500m SIN Grid V006 [Data Set]. 2017. Available online: https://lpdaac.usgs.gov/products/mod16a2v006/ (accessed on 6 October 2023).
- Takaku, J.; Tadono, T.; Tsutsui, K.; Ichikawa, M. Validation of “AW3D” Global DSM Generated from ALOS PRISM. In Proceedings of the ISPRS Annals of the Photogrammetry, Remote Sensing and Spatial Information Sciences, Prague, Czech Republic, 12–19 July 2016; Volume III-4, pp. 25–31. [Google Scholar] [CrossRef]
- Yang, J.; Huang, X. The 30 m Annual Land Cover Dataset and Its Dynamics in China from 1990 to 2019. Earth Syst. Sci. Data 2021, 13, 3907–3925. [Google Scholar] [CrossRef]
- Zou, Z.; Dong, J.; Menarguez, M.A.; Xiao, X.; Qin, Y.; Doughty, R.B.; Hooker, K.V.; David Hambright, K. Continued Decrease of Open Surface Water Body Area in Oklahoma during 1984–2015. Sci. Total Environ. 2017, 595, 451–460. [Google Scholar] [CrossRef]
- Gong, P.; Li, X.; Wang, J.; Bai, Y.; Chen, B.; Hu, T.; Liu, X.; Xu, B.; Yang, J.; Zhang, W.; et al. Annual Maps of Global Artificial Impervious Area (GAIA) between 1985 and 2018. Remote Sens. Environ. 2020, 236, 111510. [Google Scholar] [CrossRef]
- Xia, H.; Zhao, J.; Qin, Y.; Yang, J.; Cui, Y.; Song, H.; Ma, L.; Jin, N.; Meng, Q. Changes in Water Surface Area during 1989–2017 in the Huai River Basin Using Landsat Data and Google Earth Engine. Remote Sens. 2019, 11, 1824. [Google Scholar] [CrossRef]
- Mann, H.B. Nonparametric Tests Against Trend. Econometrica 1945, 13, 245. [Google Scholar] [CrossRef]
- Sen, P.K. Estimates of the Regression Coefficient Based on Kendall’s Tau. J. Am. Stat. Assoc. 1968, 63, 1379–1389. [Google Scholar] [CrossRef]
- Zhang, C.; Duan, Q.; Yeh, P.J.-F.; Pan, Y.; Gong, H.; Gong, W.; Di, Z.; Lei, X.; Liao, W.; Huang, Z.; et al. The Effectiveness of the South-to-North Water Diversion Middle Route Project on Water Delivery and Groundwater Recovery in North China Plain. Water Resour. Res. 2020, 56, e2019WR026759. [Google Scholar] [CrossRef]
- Liu, J.; Jiang, L.; Zhang, X.; Druce, D.; Kittel, C.M.M.; Tøttrup, C.; Bauer-Gottwein, P. Impacts of Water Resources Management on Land Water Storage in the North China Plain: Insights from Multi-Mission Earth Observations. J. Hydrol. 2021, 603, 126933. [Google Scholar] [CrossRef]
- Liu, H.; Wu, J.; Liao, M. Ecosystem Service Trade-Offs Upstream and Downstream of a Dam: A Case Study of the Danjiangkou Dam, China. Arab. J. Geosci. 2019, 12, 17. [Google Scholar] [CrossRef]
- Zhan, S.; Song, C.; Wang, J.; Sheng, Y.; Quan, J. A Global Assessment of Terrestrial Evapotranspiration Increase Due to Surface Water Area Change. Earth’s Future 2019, 7, 266–282. [Google Scholar] [CrossRef]
- Condon, L.E.; Atchley, A.L.; Maxwell, R.M. Evapotranspiration Depletes Groundwater under Warming over the Contiguous United States. Nat. Commun. 2020, 11, 873. [Google Scholar] [CrossRef] [PubMed]
- Zhang, Y.; Qi, Y.; Shen, Y.; Wang, H.; Pan, X. Mapping the Agricultural Land Use of the North China Plain in 2002 and 2012. J. Geogr. Sci. 2019, 29, 909–921. [Google Scholar] [CrossRef]
- Wu, X.; Qi, Y.; Shen, Y.; Yang, W.; Zhang, Y.; Kondoh, A. Change of Winter Wheat Planting Area and Its Impacts on Groundwater Depletion in the North China Plain. J. Geogr. Sci. 2019, 29, 891–908. [Google Scholar] [CrossRef]
- Zhong, H.; Sun, L.; Fischer, G.; Tian, Z.; Liang, Z. Optimizing Regional Cropping Systems with a Dynamic Adaptation Strategy for Water Sustainable Agriculture in the Hebei Plain. Agric. Syst. 2019, 173, 94–106. [Google Scholar] [CrossRef]
- Wen, F.; Fang, X.; Khanal, R.; An, M. The Effect of Sectoral Differentiated Water Tariff Adjustment on the Water Saving from Water Footprint Perspective: A Case Study of Henan Province in China. J. Clean. Prod. 2023, 393, 136152. [Google Scholar] [CrossRef]
- Li, Z.; Zhou, Y.; Li, K.; Xiao, H.; Cai, Y. The Spatial Effects of City-Level Water-Energy Nexus: A Case Study of Hebei Province, China. J. Clean. Prod. 2021, 310, 127497. [Google Scholar] [CrossRef]
- Kattel, G.; Reeves, J.; Western, A.; Zhang, W.; Jing, W.; McGowan, S.; Cuo, L.; Scales, P.; Dowling, K.; He, Q.; et al. Healthy Waterways and Ecologically Sustainable Cities in Beijing-Tianjin-Hebei Urban Agglomeration (Northern China): Challenges and Future Directions. WIREs Water 2021, 8, e1500. [Google Scholar] [CrossRef]
- Deng, L.; Han, Z.; Pu, W.; Bao, R.; Wang, Z.; Wu, Q.; Qiao, J. Impacts of Human Activities and Climate Change on Water Storage Changes in Shandong Province, China. Environ. Sci. Pollut. Res. 2022, 29, 35365–35381. [Google Scholar] [CrossRef]
- Xu, Y.; Gun, Z.; Zhao, J.; Chen, J.; Liu, Q.; Cheng, X.; Sutanudjaja, E.H.; Wang, J.; Liu, H.; Zhan, W. Continuing Severe Water Shortage in the Water-Receiving Area of the South-To-North Water Diversion Eastern Route Project from 2002 to 2020. Water Resour. Res. 2023, 59, e2022WR034365. [Google Scholar] [CrossRef]
- Huang, C.; Zhang, C.; Liu, Q.; Wang, Z.; Li, H.; Liu, G. Land Reclamation and Risk Assessment in the Coastal Zone of China from 2000 to 2010. Reg. Stud. Mar. Sci. 2020, 39, 101422. [Google Scholar] [CrossRef]
- Wang, Z.; Zhang, J.; Yang, X.; Huang, C.; Su, F.; Liu, X.; Liu, Y.; Zhang, Y. Global Mapping of the Landside Clustering of Aquaculture Ponds from Dense Time-Series 10 m Sentinel-2 Images on Google Earth Engine. Int. J. Appl. Earth Obs. Geoinf. 2022, 115, 103100. [Google Scholar] [CrossRef]
- Su, G.; Xiong, C.; Zhang, G.; Wang, Y.; Shen, Q.; Chen, X.; An, H.; Qin, L. Coupled Processes of Groundwater Dynamics and Land Subsidence in the Context of Active Human Intervention, a Case in Tianjin, China. Sci. Total Environ. 2023, 903, 166803. [Google Scholar] [CrossRef]


| Classification (2020) | Water | Non-Water | Total | User Accuracy (%) |
|---|---|---|---|---|
| Water | 915 | 58 | 973 | 94.04 |
| Non-water | 23 | 1116 | 1139 | 97.98 |
| Total | 938 | 1174 | OA = 96.16 | |
| Producer accuracy (%) | 97.54 | 95.06 | Kappa = 0.95 |
| Year-Long | p Value | Max | p Value | Seasonal | p Value | |
|---|---|---|---|---|---|---|
| Agcwu | 1.07 *** | 0.01 | 1.11 *** | 0.01 | 1.21 *** | 0.01 |
| Idswu | −1.19 *** | 0.01 | −1.14 *** | 0.01 | −1.07 *** | 0.01 |
| Cnspwu | −0.02 | 0.94 | −0.17 | 0.46 | −0.52 ** | 0.02 |
| ET | −1.92 *** | 0.01 | −1.97 *** | 0.01 | −2.03 *** | 0.01 |
| AP | 1.14 *** | 0.01 | 1.32 *** | 0.01 | 1.63 *** | 0.01 |
| Temp | 2.21 *** | 0.01 | 2.04 *** | 0.01 | 1.67 ** | 0.02 |
| SNWDP | 0.22 *** | 0.01 | 0.21 *** | 0.01 | 0.20 *** | 0.01 |
| Cons | 3.57 | 0.43 | 3.79 | 0.40 | 2.42 | 0.40 |
| R2 | 0.65 | 0.67 | 0.71 | |||
| Factors | Year-Long | p Value | Max | p Value | Seasonal | p Value |
|---|---|---|---|---|---|---|
| Agcwu | 1.05 *** | 0.01 | 1.09 *** | 0.01 | 1.19 *** | 0.01 |
| Idswu | −1.14 *** | 0.01 | −1.10 *** | 0.01 | −1.03 *** | 0.01 |
| Cnspwu | −0.86 | 0.94 | −0.23 | 0.28 | −0.58 *** | 0.01 |
| ET | −2.05 *** | 0.01 | −2.11 *** | 0.01 | −2.18 *** | 0.01 |
| AP | 1.29 *** | 0.01 | 1.47 *** | 0.01 | 1.77 *** | 0.01 |
| Temp | 1.84 *** | 0.01 | 1.68 ** | 0.02 | 1.31 * | 0.06 |
| RWI | 0.22 *** | 0.01 | 0.08 *** | 0.01 | 0.07 *** | 0.01 |
| Cons | 4.43 | 0.28 | 4.65 | 0.25 | 3.31 | 0.40 |
| R2 | 0.69 | 0.71 | 0.75 | |||
| Factors | Year-Long | p Value | Max | p Value | Seasonal | p Value |
|---|---|---|---|---|---|---|
| Agcwu | 1.12 *** | 0.01 | 1.15 *** | 0.01 | 1.25 *** | 0.01 |
| Idswu | −1.31 *** | 0.01 | −1.26 *** | 0.01 | −1.18 *** | 0.01 |
| Cnspwu | −0.13 | 0.94 | −0.28 | 0.24 | −0.62 | 0.94 |
| ET | −1.13 ** | 0.05 | −1.19 ** | 0.03 | −1.31 ** | 0.02 |
| AP | 1.16 *** | 0.01 | 1.34 *** | 0.01 | 1.67 *** | 0.01 |
| Temp | 2.59 *** | 0.01 | 2.41 *** | 0.01 | 2.00 *** | 0.01 |
| RSWI | 0.04 *** | 0.01 | 0.04 *** | 0.01 | 0.04 *** | 0.01 |
| Cons | −1.65 | 0.53 | −1.34 | 0.74 | −2.73 | 0.53 |
| R2 | 0.65 | 0.68 | 0.72 | |||
| 2020 | Cropland | Forest | Shrub | Grassland | Water | Barren | Impervious | |
|---|---|---|---|---|---|---|---|---|
| 2013 | ||||||||
| Cropland | 211,081.60 | 1417.05 | 0.68 | 704.77 | 891.41 | 3.21 | 6527.16 | |
| Forest | 1169.80 | 35,843.50 | 128.58 | 15.19 | 0.43 | 0 | 35.32 | |
| Shrub | 1.38 | 68.81 | 332.84 | 93.38 | 0 | 0.014 | 0.014 | |
| Grassland | 1339.15 | 843.26 | 65.77 | 8363.36 | 13.19 | 6.43 | 94.60 | |
| Water | 720.53 | 3.53 | 0 | 1.70 | 5180.25 | 42.49 | 400.87 | |
| Barren | 43.16 | 0.01 | 0 | 2.42 | 303.16 | 246.06 | 338.57 | |
| Impervious | 13.16 | 0.01 | 0 | 0.16 | 311.27 | 2.21 | 62070.60 | |
| Region | RWI | RSWI | ||||
|---|---|---|---|---|---|---|
| Year-Long | Seasonal | Max | Year-Long | Seasonal | Max | |
| Total Region | 0.157 | 0.045 | 0.122 | 0.125 | 0.096 | 0.032 |
| Beijing | 0.795 *** | −0.575 *** | 0.570 ** | 0.463 ** | −0.603 *** | 0.458 ** |
| Hebei | 0.305 | 0.087 | 0.210 | 0.577 *** | 0.160 | 0.392 * |
| Henan | 0.740 *** | −0.325 | 0.539 ** | 0.715 *** | −0.363 | 0.667 *** |
| Shandong | 0.043 | −0.217 | −0.224 | 0.060 | −0.265 | −0.259 |
| Tianjin | −0.402 ** | −0.459 ** | −0.402 * | −0.449 ** | −0.430 *** | −0.488 ** |
Disclaimer/Publisher’s Note: The statements, opinions and data contained in all publications are solely those of the individual author(s) and contributor(s) and not of MDPI and/or the editor(s). MDPI and/or the editor(s) disclaim responsibility for any injury to people or property resulting from any ideas, methods, instructions or products referred to in the content. |
© 2024 by the authors. Licensee MDPI, Basel, Switzerland. This article is an open access article distributed under the terms and conditions of the Creative Commons Attribution (CC BY) license (https://creativecommons.org/licenses/by/4.0/).
Share and Cite
Guo, T.; Li, R.; Xiao, Z.; Cai, P.; Guo, J.; Fu, H.; Zhang, X.; Song, X. The Divergent Changes in Surface Water Area after the South-to-North Water Diversion Project in China. Remote Sens. 2024, 16, 378. https://doi.org/10.3390/rs16020378
Guo T, Li R, Xiao Z, Cai P, Guo J, Fu H, Zhang X, Song X. The Divergent Changes in Surface Water Area after the South-to-North Water Diversion Project in China. Remote Sensing. 2024; 16(2):378. https://doi.org/10.3390/rs16020378
Chicago/Turabian StyleGuo, Tongze, Runkui Li, Zhen Xiao, Panli Cai, Jingxian Guo, Haiyu Fu, Xiaoping Zhang, and Xianfeng Song. 2024. "The Divergent Changes in Surface Water Area after the South-to-North Water Diversion Project in China" Remote Sensing 16, no. 2: 378. https://doi.org/10.3390/rs16020378
APA StyleGuo, T., Li, R., Xiao, Z., Cai, P., Guo, J., Fu, H., Zhang, X., & Song, X. (2024). The Divergent Changes in Surface Water Area after the South-to-North Water Diversion Project in China. Remote Sensing, 16(2), 378. https://doi.org/10.3390/rs16020378