Abstract
Pores and microfractures provide storage spaces and migration pathways for gas accumulation in tight sandstones with low porosity and permeability, acting as one of the controlling factors of gas production. The development of a rational rock physics model is essential for better understanding the elastic responses of tight sandstone with complex pore structures. Accordingly, seismic characterization of pores and microfractures based on the rock physics model provides valuable information in predicting high-quality tight gas sandstone reservoirs. This paper proposes a rock-physics-based approach to compute the pore–microfracture indicator (PMI) from elastic properties for pore structure evaluation in tight sandstones. The PMI is achieved based on the axis rotation of the elastic parameter space using well-log data. The rotation angle is determined by finding the maximum correlation between the linearized combination of the elastic parameters and the introduced factor associated with total porosity and microfracture porosity. The microfracture porosity is then estimated with an inversion scheme based on the double-porosity model. Finally, the optimized rotation angle is employed to compute the PMI with seismic data. The obtained results are of great benefit in predicting the permeable zones, providing valuable information for sweet spot characterization in tight gas sandstone reservoirs.
1. Introduction
The Ordos Basin is one of the most petroliferous in north-central China, with numerous natural gases being produced in the tight sandstones from the petroleum systems of the basin. In general, tight sandstones in the Ordos Basin are characterized by low porosity (<10%) and low permeability (<1 mD). Pores and microfractures developed in tight sandstones lead to the increase of reservoir permeability, providing migration pathways for gas accumulation. Relatively high-porosity and well-developed microfractures are essential to configuring permeable zones in tight gas sandstone reservoirs, functioning as one of the dominant factors for gas enrichment. Simultaneously, the development of natural microfractures facilitates the formation of pore–fracture networks during hydraulic fracturing, which is a crucial factor in gas productivity [1,2,3]. The primary types of pore space in tight sandstones include dissolved inter-granular and intra-granular pores, microcracks, microfractures, and structural fractures. Core analysis and well-logging interpretation provide valuable information for characterizing various pores and fractures. Nevertheless, pore and fracture identification with seismic methods is of great significance in predicting sweet spots in tight gas sandstone reservoirs over a large area.
Tight sandstones with high-angle fractures are usually described as the effective medium with horizontal transverse isotropy or orthorhombic anisotropy, relying on the features of the host medium. In view of this, these near-vertical fractures are predicted via various azimuthal seismic inversion methods [4,5,6,7]. However, different from predicting vertical fractures utilizing azimuthal seismic signatures, delineating microfractures with seismic methods is challenging due to their implicit elastic properties. In this case, the rock-physics-based approaches provide an effective solution in characterizing microfractures, wherein the elastic behaviors associated with pore structures are described with appropriate rock physics models.
Based on core and thin section observations, complex pore structures in tight sandstone were simplified as the combination of round pores and low-aspect-ratio microfractures [8,9]. The corresponding scattering velocity–porosity relationships were then reasonably interpreted by varied crack concentrations. Further, the sophisticated double-porosity model [10,11] and the multiple-porosity model [12] were proposed to explain tight sandstone’s poroelastic behaviors accurately. Experimental investigations confirmed the applicability of the double-porosity model for tight sandstones [13,14]. By extending the model to delineate heterogeneous pore structures, pore structure evaluation and shear-wave velocity prediction were performed in tight sandstones [15].
In practice, various templates constructed based on appropriate rock physics models provide effective tools for estimating reservoir parameters utilizing elastic properties in various hydrocarbon resources [16,17,18,19]. For instance, the rock physics templates (RPTs) were employed for fluid identification [20] and brittleness evaluation [21] in tight sandstone reservoirs. At the same time, several successful applications have been reported for estimating pore microstructure in tight sandstones using RPTs [22,23]. However, one of the inherent limitations of applying RPTs for estimating reservoir parameters is that the corresponding implementation is target-oriented, where the interpretation on a particular template may work only for a specific target layer. In comparison, direct seismic inversion of pore parameters may be attractive [24,25], but the robustness of the complex iteration process in seismic inversion should be properly assessed.
This paper is aimed to propose a rock-physics-based indicator for estimating pores and microfractures in tight gas sandstone reservoirs from seismic data. First, the workflow associated with the double-porosity model is given, followed by predicting microfracture porosity using well-log data. Next, a new pore–microfracture indicator is introduced by optimizing the correlation between elastic properties and the pore factor defined by total and microfracture porosity. After analyzing the applicability of the proposed indicator using well-log data, the suggested method is applied to seismic data to identify permeable zones in tight gas sandstone reservoirs.
2. Methods
2.1. Rock Physics Model of Tight Gas Sandstones
As presented in Figure 1, thin sections of cores from the Ordos Basin indicate that tight sandstones exhibit complex pore structures, including dissolved inter-granular and intra-granular pores and structural fractures. The rock physics model correlates pore parameters and elastic properties and is essential for assessing pores and microfractures using seismic-inverted attributes.
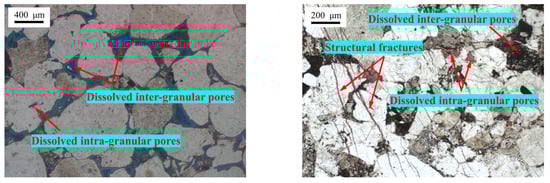
Figure 1.
Thin sections of tight sandstone cores in the study area of the Ordos Basin.
In the schematic illustration of the tight sandstone (Figure 2a), the total porosity (ϕ) of tight sandstone is divided into the spaces occupied by round pores (ϕp) and microfractures (ϕf). Hence, our rock physics modeling workflow (Figure 2b) takes into account the corresponding double-porosity model based on effective medium theories.
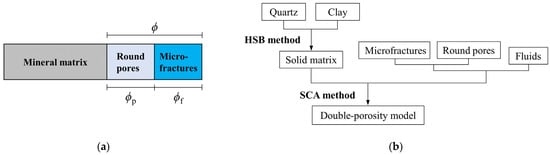
Figure 2.
(a) Schematic illustration and (b) flowchart of rock physics modeling for tight sandstones.
First, the Hashin–Shtrikman bounds (HSB) method [26] is used to capture the elastic properties of the mineral matrix, which is assumed to be chiefly composed of quartz and clay. The HSB predicts the equivalent elastic modulus of a medium in the following form:
in which
where and represent the upper and lower limits of the equivalent bulk modulus of the solid matrix, and are the upper and lower limits of the equivalent shear modulus, and denote the maximum and minimum values of the bulk modulus of each component in the solid matrix, and are the maximum and minimum values of the corresponding shear modulus, and represent the bulk and shear modulus of the r-th component composing the solid matrix, and the parentheses indicate the weighted average of the components by their corresponding volume fractions.
Then, the double-porosity is modeled with the self-consistent approximation (SCA) method [27] to quantify the influences of pores and microfractures. The SCA-based theory for multi-phase media could be presented as follows:
where j represents the j-th phase and denotes the corresponding volume fraction, and are the bulk and shear modulus of the j-th component, and are geometric factors of the inclusion added to the background medium, and finally, and denote the estimated equivalent bulk modulus and shear modulus.
It is assumed that the fluids are homogeneously distributed in the double-pore spaces, with the bulk modulus of the fluid mixture modeled as:
where and denote the bulk modulus of water and gas, and and represent water and gas saturation.
The density of the fluid mixture is computed as follows:
where and are the densities of water and gas.
2.2. Estimation of Microfracture Porosity Based on the Double-Porosity Model via Well-Log Data
We employ the double-porosity model to estimate microfracture porosity using well-log data, as illustrated by the workflow in Figure 3. The double-porosity model plays an effective modeling tool role in the model-based inversion scheme.

Figure 3.
Workflow for predicting microfracture porosity based on the double-porosity model using well-log data.
Specifically, microfracture porosity (ϕf) is regarded as the fitting parameter to be retrieved, with the volumetric fractions of minerals, porosity, and fluids properties as inputs of the double-porosity model at each logging interval. The value of ϕf is estimated by finding the best match between the P-wave velocity calculated by the model (VP-calculated) and that measured (VP-measured) in the borehole for a particular value of ϕf. The straightforward grid-searching scheme is employed to realize the estimation of ϕf within a preset range of ϕf values in solving the objective function. The outputs include the predicted ϕf and the corresponding VP(ϕf). A by-product is the simultaneously estimated VS(ϕf), which gives an appropriate reference for validating the applicability of the rock physics model in practice. Repeating the above computation at each logging interval can produce the curves of the fitted VP(ϕf) and predicted ϕf and VS(ϕf).
2.3. Pore–Microfracture Indicator (PMI) Defined Using Elastic Properties
Based on the concept of the Poisson impedance (PI) [28] and the previously developed method for estimating the optimized PI [29,30], a novel pore–microfracture indicator (PMI) is proposed to appropriately describe features of pore spaces in tight sandstones by utilizing seismic attributes:
where IP represents P-wave impedance, VP/VS is velocity ratio, and θ denotes the rotation angle transferring IP and VP/VS to PMI.
In practice, the optimized θmax value is determined by seeking the maximum correlation between PMI(θ) and the factor ϕ × ϕf using well-log data. Herein, the factor ϕ × ϕf is utilized to describe characteristics of pore spaces since both total porosity (ϕ) and microfracture porosity (ϕf) are vital for improving the permeability of tight sandstones. In this case, the obtained PMI(θmax) exhibits the maximum correlation with ϕ × ϕf and is employed to assess permeable zones in tight sandstones. In the following sections, the effectiveness of PMI(θmax) for evaluating the factor ϕ × ϕf is proved.
3. Results
3.1. Study Area and Datasets
Our study area is located on the eastern margin of the Ordos Basin. Seismic data are collected by implementing a three-dimensional (3D) seismic prospecting method in the understudied region. As shown by the two-way travel time (TWT) of seismic reflections from the target tight sandstone (see Figure 4), the tectonic structure in the study area is relatively simple. Seismic lines and the locations of three gas-producing wells have been demonstrated in Figure 4.
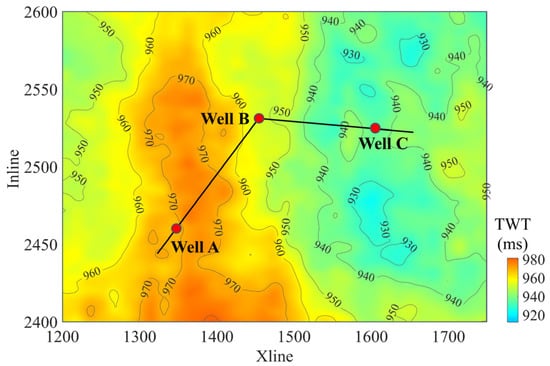
Figure 4.
The two-way travel time for the target tight sandstones. Red dots indicate the locations of wells A, B, and C.
Figure 5 displays the cross-well seismic section where the interpreted horizons and the target interval of the tight gas sandstone formation are illustrated. The sampling interval of the seismic data is 1 ms. The 3D cubes of elastic wave velocities and bulk density are obtained via the pre-stack seismic inversion, which will be used to quantitatively interpret pores and microfractures based on the method proposed in Section 2.3. The well-log curves measured in the three wells are employed to capture microfracture porosity with the model-based method in Figure 3.
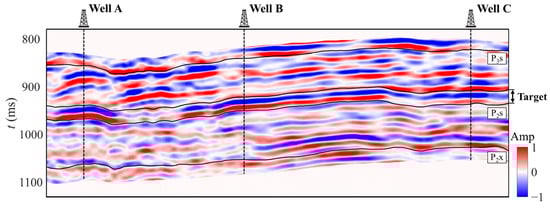
Figure 5.
The seismic section across wells A, B, and C.
3.2. Prediction of the Microfracture Porosity in Tight Sandstones Using Well-Log Data
To estimate the factor ϕ × ϕf proposed in Section 2.3, we should evaluate ϕ and ϕf appropriately. The total porosity (ϕ) can be obtained from the standard logging curve. Microfracture porosity (ϕf) is computed with the method presented in Section 2.2 using well-log data, with the predicted results shown in Figure 6. The properties of the minerals and fluids used in the method are provided in Table 1. The values of ϕf are predicted by fitting the VP obtained with the double-porosity model (blue curves) and the VP measured in the borehole (black curves). As illustrated by the relative errors in VP estimation for all three wells, the calculated VP rationally fits with the measured VP, demonstrating the applicability of the proposed model and the corresponding method for ϕf estimation in the tight gas sandstone of the understudied area.

Figure 6.
Model-based prediction results for (a) well A, (b) well B, and (c) well C. The curves include ϕf, VP, VS, relative errors in VP and vs. estimations, Sg, and volumetric fractions of compositions.

Table 1.
Properties of constituents used for the rock physics modeling [31].
Meanwhile, the relative errors in vs. estimation show that the predicted vs. values (red curves) are in good agreement with the measured vs. values (black curves). Quantitative analysis indicates that the averaged correlation coefficients of the predicted and measured vs. curves are 0.93, 0.95, and 0.93 in wells A, B, and C. The averaged relative errors are 4.6%, 4.4%, and 4.6% in these 3 wells. The vs. prediction results somehow justify the proposed method.
3.3. Calculation of the PMI for Pore and Microfracture Evaluation in Tight Gas Sandstones
The factor ϕ × ϕf is now computed using the measured total porosity (ϕ) and the estimated microfracture porosity (ϕf), with the results presented in Figure 7. Based on the method described in Section 2.3, the PMI is then computed for various rotation angles (θ), where the optimization of θ (i.e., θmax) is evaluated by finding the maximum correlation between PMI(θ) and ϕ × ϕf. As demonstrated in Figure 8, the computed correlation coefficients for various values of θ values indicate that its optimized value (θmax) is approximately equal to 101° for the three wells (see Figure 8). The corresponding curves of the PMI for θmax = 101° are displayed in Figure 7.
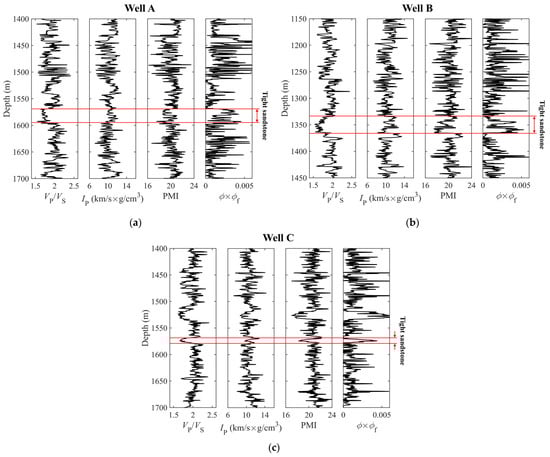
Figure 7.
The plots of VP/VS, IP, PMI at θmax = 101°, and ϕ × ϕf for (a) well A, (b) well B, and (c) well C.

Figure 8.
Correlation coefficients for varying rotation angle θ. The optimized rotation angle θmax is approximately equal to 101° for all understudied wells.
Based on the presented results in Figure 6 and Figure 7, the cross-plots of VP/VS and IP color-coded by ϕ and ϕf are illustrated in Figure 9a,b, respectively. The obtained results indicate that ϕ can be distinguished by IP such that the growth of ϕ is associated with the decreasing IP for all VP/VS cases (see Figure 9a). On the other hand, as demonstrated in Figure 9b, data points with various values of ϕf exhibit particular clusters. Specifically, the increase in ϕf corresponds to the lessening of both VP/VS and IP.

Figure 9.
Cross-plots of VP/VS ratio and IP color-coded by (a) ϕ and (b) ϕf.
The data points have identical distributions in Figure 9b and Figure 10. As illustrated by the color-coded legends, however, the data points with different values of ϕ × ϕf (see Figure 10) exhibit more focusing and separable characteristics than those with varying ϕf (see Figure 9b). Therefore, the obtained results reveal that the discrimination of ϕ × ϕf based on elastic properties VP/VS and IP could be more reliable than the discrimination of an individual factor ϕf based on the same elastic properties. At the same time, the factor ϕ × ϕf exhibits a more rational evaluation of high-quality tight sandstones because total porosity and microfracture porosity present inclusive influences on the gas storage capacity and the rock’s permeability.

Figure 10.
Cross-plot of VP/VS and IP color-coded by ϕ × ϕf.
Figure 11 illustrates the cross-plot of VP/VS and PMI color-coded by ϕ × ϕf. The values of PMI are estimated as illustrated in Figure 7. It shows that the PMI exhibits a good correlation with ϕ × ϕf, where the increase in ϕ × ϕf is associated with the lessening of the PMI. The results suggest that the PMI acts as a rational indicator to evaluate the development of pores and microfractures in tight sandstones.
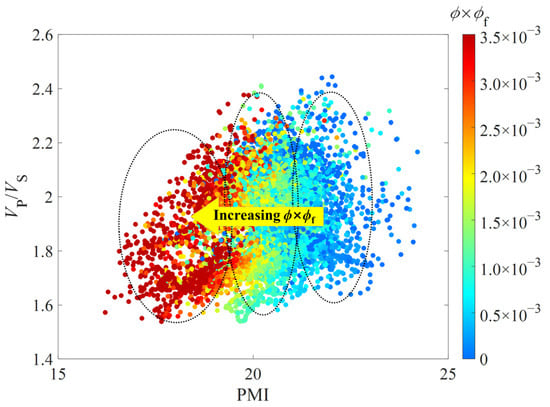
Figure 11.
Cross-plot of VP/VS and PMI at θmax = 101° color-coded by ϕ × ϕf.
Furthermore, Figure 12 compares the responses of various parameters to the factor ϕ × ϕf. The results demonstrate that ϕ × ϕf presents no correlation with VP/VS (see Figure 12a). In contrast, ϕ × ϕf exhibits a visible negative correlation with IP (see Figure 12b), while the correlation between ϕ × ϕf and the PMI is more noticeable (see Figure 12c). The obtained results further confirm the applicability of the PMI as an indicator to assess the pore space in tight sandstones.
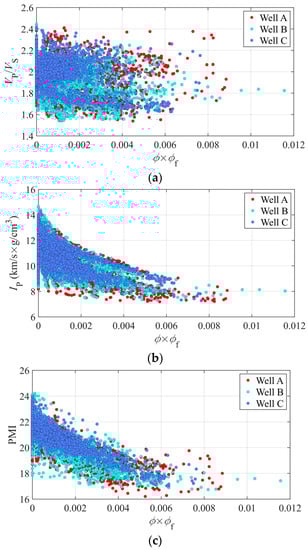
Figure 12.
Cross-plot of ϕ × ϕf and (a) VP/VS, (b) IP, and (c) PMI at θmax = 101° for wells A, B, and C.
3.4. Estimation of the PMI Using Seismic Data
The plotted results in Figure 11 and Figure 12c suggest that the proposed PMI exhibits a distinct correlation with ϕ × ϕf; therefore, it can be utilized to discriminate permeable zones with highly developed pores and microfractures in tight gas sandstone reservoirs. Subsequently, based on Equation (8) and the estimated θmax, we converted seismic-inverted VP/VS and IP (Figure 13 and Figure 14) to the PMI (Figure 15).
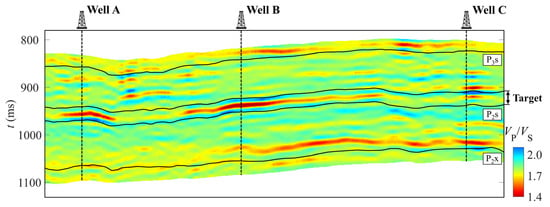
Figure 13.
Seismic section of VP/VS across wells A, B, and C.

Figure 14.
Seismic section of IP across wells A, B, and C.
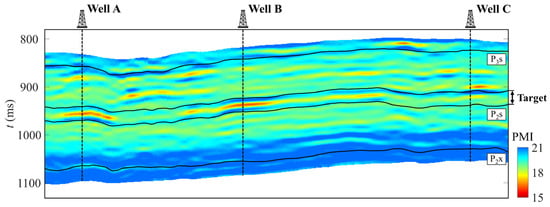
Figure 15.
Seismic section of PMI across wells A, B, and C.
In general, low values of VP/VS in Figure 13 indicate high gas potential in tight sandstone. Estimated using well-log data, averaged gas saturations of tight sandstone reservoirs in the target formation are approximately equal to 0.56, 0.60, and 0.45 in wells A, B, and C. This result is consistent with the relative magnitude of the VP/VS value for the target layer in Figure 13. Meanwhile, as Figure 9a suggests, low IP values in Figure 14 present areas with high total porosity (ϕ). The averaged porosities of the tight sandstone reservoirs measured based on the log data in the three boreholes are somehow comparable, which are 0.14, 0.11, and 0.13 in wells A, B, and C, respectively. The tight sandstone with low IP in well B exhibits a thinner layer thickness, corresponding to a slight drop in averaged porosity obtained in the borehole.
As discussed above, the computed PMI in Figure 15 performs as an indicator for detecting permeable zones with high total porosity and microfracture porosity. The difference between PMI (see Figure 15) and IP (see Figure 14) could reflect the presence of microfractures. Further, the averaged permeability values estimated using well-log data are 1.96, 2.59, and 1.05 mD for the tight sandstone reservoirs in wells A, B, and C, with their relative magnitudes agreeing with the PMI anomalies presented in Figure 15.
Finally, the cubes of VP/VS, IP, and PMI are illustrated in Figure 16, Figure 17 and Figure 18, giving useful information for the characterization of the tight gas sandstone reservoirs.
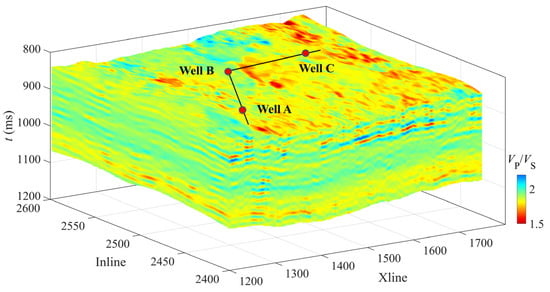
Figure 16.
Seismic-inverted 3D cube of VP/VS in the tight sandstone formations in the study area.
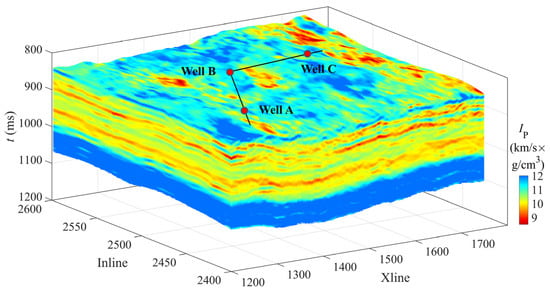
Figure 17.
Seismic-inverted 3D cube of IP in the tight sandstone formations in the study area.
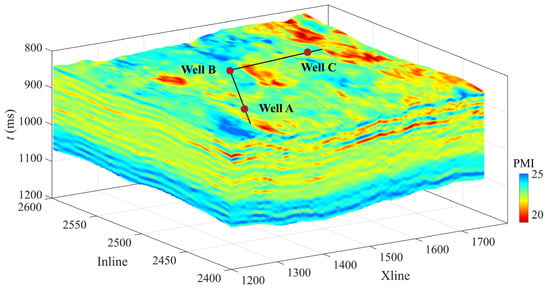
Figure 18.
Computed 3D cube of the PMI in the tight sandstone formations in the study area.
4. Discussions
4.1. Construction of the PMI for Pore and Microfracture Characterization in Tight Sandstones
The distribution pattern of data clusters with variable ϕ × ϕf in the VP/VS–IP space (see Figure 10) inspired us to propose PMI based on Equation (8). Although the data clouds the present separated distribution in Figure 10, direct estimation of the factor ϕ × ϕf is not simple. We determined the optimized rotation angle (i.e., θmax) in Equation (8) by finding the maximum correlation coefficient between the factor ϕ × ϕf and the linearized combination of VP/VS and IP, with the results illustrated in Figure 8. Consequently, data clouds with different values of ϕ × ϕf in the rotated space can be conveniently identified by the PMI at θmax (see Figure 11).
The method presented in the present study can be regarded as an extension of the commonly used Poisson impedance [28]. One merit of our proposed PMI is to give valuable information for pore and microfracture evaluation in tight gas sandstone reservoirs, which has not been thoroughly revealed by most current methods based on elastic properties. At the same time, the proposed method is rock-physics-based, not solely depending on straightforward well-log data analysis like the Poisson impedance. Specifically, the construction of the PMI incorporates the microfracture porosity (ϕf), which is predicted by the double-porosity model using well-log data (see Figure 6). The microfracture porosity is a crucial constituent in the factor ϕ × ϕf and cannot be directly measured in a borehole. Nevertheless, the impact of ϕf or ϕ × ϕf on the rock permeability and the gas productivity of tight sandstone reservoirs deserves further explorations when more well-log and production data are available in the future.
4.2. Applicability of the Double-Porosity Model for Tight Sandstones
Successful application of the PMI for pore and microfracture evaluation relies on the reliable estimation of ϕf. Accordingly, a rational modeling approach is of great significance for tight sandstones. In this paper, the double-porosity model (see Figure 2) is employed based on the geological understanding of tight sandstones in the understudied area (see Figure 1). The double-porosity model offers an effective approach for predicting microfracture porosity based on the scheme proposed in Figure 3. As demonstrated in Figure 6, the modeling of elastic wave velocities validates the effectiveness of the double-porosity model for tight sandstones in the understudied area. Subsequently, the obtained ϕ × ϕf is utilized to introduce the PMI for pore and microfracture characterization in tight sandstones (see Figure 7).
Therefore, the double-porosity model could be employed for the tight sandstones in the study area. However, in future investigations, other sophisticated models could be developed based on a better understanding of pore structures for improved modeling of elastic responses in tight sandstones. The double-porosity model used in this paper assumes a uniform mixture of multi-phase fluids (gas and water) in pore spaces. However, heterogeneous distributions of fluids and the associated dispersion and attenuation should be explored in future studies. Accordingly, one aspect that should be noted is the applicable frequency bands of the modeling method. Herein, after predicting ϕf with the double-porosity model based on the log data (see Figure 6), the PMI is constructed (see Figure 7, Figure 8, and Figure 11) and subsequently applied to the seismic data (see Figure 13, Figure 14, Figure 15, Figure 16, Figure 17 and Figure 18). This process does not consider the potential velocity dispersion, which deserves further exploration via more sophisticated modeling methods. Another limitation is that the double-porosity model and the PMI do not consider high-angle tectonic fractures. However, the vertical fractures are modeled by the anisotropic model and detected with azimuthal seismic inversion, which is another significant research area in facture characterization.
4.3. Potential Applications of the PMI
As mentioned above, the proposed PMI provides helpful information for pore and microfracture evaluation in tight sandstones. One potential application of the PMI estimation results (see Figure 18) is to comprehensively characterize sweet spots in tight gas sandstone reservoirs by incorporating the results of gas prediction using VP/VS (see Figure 16) and porosity estimation based on IP (see Figure 17).
Furthermore, the proposed PMI could be incorporated into the seismic inversion scheme [32,33,34] to directly predict PMI using pre-stack seismic data. In addition, the presented method for constructing PMI in this paper could inspire the development of other effective indicators for pore and fluid identification.
5. Conclusions
This paper proposed a new method to compute PMI as an indicator for pore and microfracture characterization in tight gas sandstone reservoirs. The PMI was constructed based on the rock physics estimation of microfractures using well-log data, and it was subsequently applied to seismic-inverted elastic properties for detecting permeable zones in tight sandstones. The main obtained results include the following:
- The rock-physics-based PMI is an estimation of the factor ϕ × ϕf, representing the comprehensive effect of pores and microfractures. Therefore, the proposed PMI provides essential information in predicting high-quality tight gas sandstone reservoirs.
- The double-porosity model exhibits an effective tool for describing complex pore structures in tight sandstones in the study area. The modeling results of elastic wave velocities using well-log data confirmed the applicability of the double-porosity model. The computed microfracture porosity is a significant factor in defining the factor ϕ × ϕf and subsequently introducing PMI.
- The proposed PMI evaluates pore features and could be further employed to comprehensively characterize tight gas sandstones by incorporating other reservoir properties estimated with seismic methods.
In future studies, the obtained PMI should be calibrated based on available petrophysical data and the production status of gas-producing wells. Meanwhile, other sophisticated modeling methods can be developed for tight sandstones based on an enhanced understanding of pore structures and the advancement of rock physics theories. In addition, the method to obtain PMI could inspire the construction of other fluid and fracture identification indicators.
Author Contributions
Conceptualization, Z.G.; methodology, Z.G.; software, X.Q.; validation, Z.G. and X.Q.; formal analysis, Z.G.; investigation, Z.G., X.Q. and C.L.; resources, C.L.; data curation, Z.G. and X.Q.; writing—original draft preparation, Z.G. and X.Q.; writing—review and editing, Z.G.; visualization, X.Q.; project administration, Z.G.; funding acquisition, Z.G. All authors have read and agreed to the published version of the manuscript.
Funding
This research was funded by the National Natural Science Foundation of China, grant numbers 42074153 and 42274160.
Data Availability Statement
Not applicable.
Conflicts of Interest
The authors declare no conflict of interest.
References
- Zhao, J.L.; Tang, D.Z.; Qin, Y.; Xu, H.; Lv, Y.M.; Tao, S.; Li, S. Evaluation of fracture system for coal macrolithotypes in the Hancheng Block, eastern margin of the Ordos Basin, China. J. Petrol. Sci. Eng. 2017, 159, 799–809. [Google Scholar] [CrossRef]
- Yin, S.; Han, C.; Wu, Z.H.; Li, Q.M. Developmental characteristics, influencing factors and prediction of fractures for a tight gas sandstone in a gentle structural area of the Ordos Basin, China. J. Petrol. Sci. Eng. 2019, 72, 103032. [Google Scholar] [CrossRef]
- Zeng, L.B.; Gong, L.; Guan, C.; Zhang, B.J.; Wang, Q.Q.; Zeng, Q.; Lyu, W.Y. Natural fractures and their contribution to tight gas conglomerate reservoirs: A case study in the northwestern Sichuan Basin, China. J. Petrol. Sci. Eng. 2022, 210, 110028. [Google Scholar] [CrossRef]
- Pan, X.P.; Zhang, G.Z. Amplitude variation with incident angle and azimuth inversion for Young’s impedance, Poisson’s ratio and fracture weaknesses in shale gas reservoirs. Geophys. Prosp. 2019, 67, 1898–1911. [Google Scholar] [CrossRef]
- Pan, X.P.; Zhang, P.F.; Zhang, G.Z.; Guo, Z.W.; Liu, J.X. Seismic characterization of fractured reservoirs with elastic impedance difference versus angle and azimuth: A low-frequency poroelasticity perspective. Geophysics 2021, 86, M123–M139. [Google Scholar] [CrossRef]
- Zhang, G.Z.; Yang, R.; Zhou, Y.; Li, L.; Du, B.Y. Seismic fracture characterization in tight sand reservoirs: A case study of the Xujiahe Formation, Sichuan Basin, China. J. Appl. Geophys. 2022, 203, 104690. [Google Scholar] [CrossRef]
- Guo, Z.Q.; Nie, N.F.; Liu, C. Fracture characterization based on improved seismic amplitude variation with azimuth inversion in tight gas sandstones, Ordos Basin, China. Mar. Pet. Geol. 2022, 146, 105941. [Google Scholar] [CrossRef]
- Smith, T.M.; Sayers, C.M.; Sondergeld, C.H. Rock properties in low-porosity/low-permeability sandstones. Lead Edge 2009, 28, 48–59. [Google Scholar] [CrossRef]
- Ruiz, F.; Cheng, A. A rock physics model for tight gas sand. Lead Edge 2010, 29, 1484–1489. [Google Scholar] [CrossRef]
- Sun, W.; Ba, J.; Carcione, J.M. Theory of wave propagation in partially saturated double-porosity rocks: A triple-layer patchy model. Geophys. J. Int. 2016, 205, 22–37. [Google Scholar] [CrossRef]
- Ba, J.; Xu, W.; Fu, L.; Carcione, J.M.; Zhang, L. Rock anelasticity due to patchy saturation and fabric heterogeneity: A double double-porosity model of wave propagation. J. Geophys. Res. Solid Earth 2017, 122, 1949–1976. [Google Scholar] [CrossRef]
- Zhang, J.J.; Yin, X.Y.; Zhang, G.Z. Rock physics modelling of porous rocks with multiple pore types a multiple-porosity variable critical porosity model. Geophys. Prosp. 2020, 68, 955–967. [Google Scholar] [CrossRef]
- Wang, D.X. A study on the rock physics model of gas reservoir in tight sandstone. Chin. J. Geophys. 2017, 60, 64–83. [Google Scholar] [CrossRef]
- Yin, H.; Zhao, J.; Tand, G.; Zhao, L.; Ma, X.; Wang, S. Pressure and fluid effect on frequency-dependent elastic moduli in fully saturated tight sandstone. J. Geophys. Res. Solid Earth 2017, 122, 8925–8942. [Google Scholar] [CrossRef]
- Guo, Z.Q.; Qin, X.Y.; Zhang, Y.M.; Niu, C.; Wang, D.; Ling, Y. Numerical investigation of the effect of heterogeneous pore structures on elastic properties of tight gas sandstones. Front. Earth Sci. 2021, 9, 641637. [Google Scholar] [CrossRef]
- Lu, M.H.; Cao, H.; Sun, W.T.; Yan, X.F.; Yang, Z.F.; Xu, Y.P.; Wang, Z.L.; Ouyang, M. Quantitative prediction of seismic rock physics of hybrid tight oil reservoirs of the Permain Lucaogou Formation, Junggar Basin, Northwest China. J. Asian Earth Sci. 2019, 178, 216–223. [Google Scholar] [CrossRef]
- Pang, M.Q.; Ba, J.; Fu, L.Y.; Carcione, J.M.; Markus, U.I.; Zhang, L. Estimation of microfracture porosity in deep carbonate reservoirs based on 3D rock-physics templates. Interpretation 2020, 8, SP43–SP52. [Google Scholar] [CrossRef]
- Giao, P.H.; Trang, P.H.; Hien, D.H.; Ngoc, P.Q. Construction and application of an adapted rock physics template (ARPT) for characterizing a deep and strongly cemented gas sand in the Nam Con Son Basin, Vietnam. J. Nat. Gas Sci. Eng. 2021, 94, 104117. [Google Scholar] [CrossRef]
- Guo, Z.Q.; Lv, X.Y.; Liu, C.; Liu, X.W.; Liu, Y.W. Shale gas characterisation for hydrocarbon accumulation and brittleness by integrating a rock-physics-based framework with effective reservoir parameters. J. Nat. Gas Sci. Eng. 2022, 100, 104498. [Google Scholar] [CrossRef]
- Zhou, H.T.; Li, D.Y.; Liu, X.T.; Du, Y.S.; Gong, W. Sweet spot prediction in tight sandstone reservoir based on well-bore rock physical simulation. Pet. Sci. 2019, 16, 1285–1300. [Google Scholar] [CrossRef]
- Tan, W.H.; Ba, J.; Müller, T.; Fang, G.; Zhao, H.B. Rock Physics Model of Tight Oil Siltstone for seismic prediction of brittleness. Geophys. Prosp. 2020, 68, 1554–1574. [Google Scholar] [CrossRef]
- Cheng, W.; Ba, J.; Carcione, J.M.; Pang, M.Q.; Wu, C.F. Estimation of the Pore Microstructure of Tight-Gas Sandstone Reservoirs with Seismic Data. Front. Earth Sci. 2021, 9, 646372. [Google Scholar] [CrossRef]
- Ruan, C.; Ba, J.; Carcione, J.M.; Chen, T.; He, R. Microcrack Porosity Estimation Based on Rock Physics Templates A Case Study in Sichuan Basin, China. Energies 2021, 14, 7225. [Google Scholar] [CrossRef]
- Zhang, T.T.; Sun, Y.F. Two-parameter prestack seismic inversion of porosity and pore-structure parameter of fractured carbonate reservoirs Part 1—Methods. Interpretation 2018, 6, SM1–SM8. [Google Scholar] [CrossRef]
- Zhang, T.T.; Zhang, R.F.; Tia, J.Z.; Lu, L.F.; Qin, F.Q.; Zhao, X.Z.; Sun, Y.F. Two-parameter prestack seismic inversion of porosity and pore-structure parameter of fractured carbonate reservoirs Part 2—Applications. Interpretation 2018, 6, SM9–SM17. [Google Scholar] [CrossRef]
- Hashin, Z.; Shtrikman, S. A variational approach to the theory of the elastic behaviour of multiphase materials. J. Mech. Phys. Solids 1963, 11, 127–140. [Google Scholar] [CrossRef]
- Berryman, J.G. Long-wavelength propagation in composite elastic media II. Ellipsoidal inclusions. J. Acoust. Soc. Am. 1980, 68, 1820–1831. [Google Scholar] [CrossRef]
- Quakenbush, M.; Shang, B.; Tuttle, C. Poisson impedance. Lead Edge 2006, 25, 128–138. [Google Scholar] [CrossRef]
- Tian, L.X.; Zhou, D.H.; Lin, G.K.; Jiang, L.C. Reservoir prediction using Poisson impedance in Qinhuangdao, Bohai Sea. In SEG Technical Program Expanded Abstracts 2010; Society of Exploration Geophysicists: Houston, TX, USA, 2010; pp. 2261–2264. [Google Scholar] [CrossRef]
- Ming, J.; Qin, D.H. An effeictive method of fluid discrimination using Poisson impedance and multi-attribute inversion. In SEG Technical Program Expanded Abstracts 2016; Society of Exploration Geophysicists: Houston, TX, USA, 2016; pp. 2901–2905. [Google Scholar] [CrossRef]
- Mavko, G.; Mukerji, T.; Dvorkin, J. The Rock Physics Handbook: Tools for Seismic Analysis in Porous Media; Cambridge University Press: Cambridge, UK, 2009. [Google Scholar]
- Whitcombe, D.N.; Connolly, P.A.; Reagan, R.L.; Redshaw, T.C. Extended elastic impedance for fluid and lithology prediction. Geophysics 2002, 67, 63. [Google Scholar] [CrossRef]
- Liu, Q.; Yin, X.Y.; Li, C. Fluid discrimination based on rock physics templates. J. Geophys. Eng. 2015, 12, 830–838. [Google Scholar] [CrossRef][Green Version]
- Jiang, R.; Liu, C.L.; Zhang, J.; Zeng, Q.C.; He, P.; Huang, J.Q.; Du, B.Y.; He, W.W.; Hao, T.; Zhang, J.X. Quantitative Reservoir Characterization of Tight Sandstone Using Extended Elastic Impedance. Nat. Resour. Res. 2020, 30, 395–409. [Google Scholar] [CrossRef]


Disclaimer/Publisher’s Note: The statements, opinions and data contained in all publications are solely those of the individual author(s) and contributor(s) and not of MDPI and/or the editor(s). MDPI and/or the editor(s) disclaim responsibility for any injury to people or property resulting from any ideas, methods, instructions or products referred to in the content. |
© 2023 by the authors. Licensee MDPI, Basel, Switzerland. This article is an open access article distributed under the terms and conditions of the Creative Commons Attribution (CC BY) license (https://creativecommons.org/licenses/by/4.0/).