Abstract
Grapes are one of the world’s most widely distributed crops and are cultivated in more than 100 countries in the global scheme. Due to climate change and improper vine growth variable selection, production has significantly decreased across countries. Therefore, the primary purpose of this study was to develop a land suitability analysis method using a fuzzy expert system at a regional scale. The fuzzy membership function was used in the ArcGIS® environment to perform the spatial analysis, and the overlay function was used to generate the final suitability map for Afghanistan considering policy planning. The results indicated that 23% (15,760,144 ha) of the areas were potential and located in the highly suitable region for grape production; however, 11% (7,370,025 ha) of the regions were not suitable for vineyards throughout the country of Afghanistan. In the present study, it was observed that most of the vineyards were in highly suitable areas (90%, 80,466 ha), while 0.01% (5 ha) of the vineyards were in less suitable areas. The present analysis demonstrated that the significant extension of grape vines can be possible in highly suitable areas. The results of this research can support decision-makers, farm managers and land developers to find more prospective acreage for expanding vineyards in Afghanistan.
1. Introduction
Land suitability analysis is an important tool to maintain the long-term viability of agricultural lands. It is also an important management strategy to identify the ideal farming locations for various crops and vineyards. Land suitability evaluation is also a basis for land use planning and helps to establish the most suitable uses of land on a regional scale [1,2,3]. Assessing the potential of land for grapevine extension is very important to increase grape production on a regional scale. It also supports farmers in increasing their income and ensuring their livelihood. In recent land suitability analysis, researchers considered GIS-based multicriteria, satellite remote sensing vegetation indices and UAV (Unmanned aerial vehicle) images to increase the resolutions for higher accuracy in interpretations [4,5,6].
Land suitability analysis using remote sensing data at the regional scale may increase the complexity of data collection and image processing due to the high data volume and diversity that it generates. With regard to incorporating big data analytics with cloud computing, large-scale scientific applications have demonstrated the advantages of high computational and storage constraints that are simple to implement [7]. The Google Earth engine (GEE) makes this task possible for everyone to access and manipulate these data without cost and large computational facilities [8]. In addition, rainfall datasets are also difficult to obtain on a regional scale. Across most of the globe, there is neither a reliable system of weather data nor a homogeneous distribution of those that exist. Consequently, it is essential to study other data sources for rainfall information, such as satellite-based near real-time rainfall information and radar data. In addition, there are products with low latency and extensive records, such as the Climate Hazards Group Infrared Precipitation with Stations (CHIRPS) dataset. This package contains integrated models of terrain-induced precipitation, precipitation estimates from measurement satellites that cover the majority of the globe and have low latency and polarization, and achieve precipitation estimates from in situ stations. The CHIRPS dataset contains a lengthy recording period (1981 to the present) with a fine spatial resolution of 0.05° [9,10]. Not only is precipitation information important for vineyard management, but vegetation and soil properties are also important to locate further potential areas to increase vineyard cultivation coverage under agroecology.
In agroecological zoning, satellite remote sensing-based topographical, vegetation, climate, and soil features can be included for land suitability analysis [11]. The Food and Agriculture Organization (FAO) classified land suitability in four categories: highly suitable (S1), moderately suitable (S2), marginally suitable (S3), and not suitable (N) [12]. The determination and identification of land suitability categories were performed based on the determination of numerous aspects that influence the quality of land. Since many variables have been used in this analysis, it is called a multicriteria decision-making process [13]. To develop a suitability map in different classifications and overlay methods, AHP (analytical hierarchy process) weighted overlay, fuzzy logic, and weighted linear combination (WLC) are commonly used. Furthermore, a combination of two methods, fuzzy and AHP, are also used in the land assessment process [14,15,16].
Among all the suitability overlay methods that are mentioned, the AHP is the simplest for generating the weight. However, there is evidence of prejudice in the conclusions drawn from expert assessments [17,18]. Another method is WLC, which primarily employs the weighted average operation to combine the appropriateness ratings of several evaluation elements into a single composite score. WLC has become one of the most widely utilized land suitability analysis techniques due to its simplicity, adaptability, and effectiveness [19,20]. The Fuzzy-AHP approach is also used for generating suitability maps. In this method, classification was performed by the fuzzy membership function and weight of each criterion obtained by AHP, and finally, the suitability map was developed by the overlaying method [21,22]. Fuzzy suitability analysis is an effective technique with improved precision for land suitability evaluations. To standardize the criterion, the fuzzy set membership can be utilized [13]. Fuzzy logic provides more realistic results since it can classify variables in a continuous manner and consider all the uncertainties of a problem more thoroughly than other methods, such as Boolean classification [15,22]. All the overlay methods have been used for different crop suitability analyses, such as rice, maize, cassava, grapes, and other crops [23,24,25,26,27,28,29]. There is a significant advantage to employing CHIRPS rainfall for land suitability analysis, which can overcome the limitations of stations and radar data. Most studies used are station- and Japan Aerospace Exploration Agency (JAXA) rainfall-based [30,31]. In addition, the GEE is also an effective platform for climate-weather and geophysical datasets. Moreover, fuzzy sets reduce subjectivity and increase effectiveness in land suitability analysis [32]. There is very limited research in the world on land suitability analysis for table grapes at the regional scale where climatic variability is severe and environmental factors have uncertainty. Former suitability assessment mostly focused on the relationship between vintage quality and other environmental variables for wine grapes [22,33,34]. Coulon-Leroy et al. (2014) developed a vine vigor model using a fuzzy set based on data related to soil, rootstock, and inter-row management strategies and spatial suitability assessment was done for vineyard site selection based on biophysical models and fuzzy logic for spatial land assessment in micro-scale [15,34]. Accordingly, in Afghanistan, land suitability analysis was performed based on the AHP method for saffron and grapes on a micro-scale [35,36]. This study focused on all of Afghanistan on a regional scale and to reduce the subjectivity of suitability analysis, the fuzzy method was performed. The fuzzy set addresses such uncertainty of climatic variables and biophysical and soil properties with justification on a continuous scale precisely. Thus, for the extension of vineyards, the government needs a comprehensive land assessment system to determine the potential region for vineyards. Aside from ground assessment, suitability analysis for finding the potential vineyard area is one of the best options. Therefore, the primary objective of this study was to develop a land suitability analysis method for potential vineyard extension based on biophysical, infrastructural and climate variable using a fuzzy-based expert system and satellite remote sensing at the regional scale.
2. Materials and Methods
2.1. Study Area
Afghanistan is a landlocked country that is located between 33.9391° to the north and 67.7100° to the east. Afghanistan’s scenery is dominated by high mountains and arid deserts. The craggy mountain summits are dangerous and snow-covered for most of the year. The country consists of 34 provinces with a total population of 40.2 million (Figure 1) [37]. Most of the population lives in fertile valleys. The summers are very hot and dry, and the winters are very cold, especially at high elevations. The area is divided into three parts: the eastern, central, and western regions. The eastern regions are Badakhshan, Takhar, Kunduz, Baghlan, Panjsher, Nuristan, Parwan, Kapisa, Kunar, Wardak, Kabul, Laghman, Nangarhar, Ghazni, Logar, Paktya, Khost, and Paktika Provinces. The central regions are the Balkh, Jawzjan, Sari Pul, Samangan, Bamyan, Ghor, Daykundi, Uruzgan, Zabul, and Kandahar Provinces, and the western regions are the Faryab, Badghis, Hirat, Farah, Nimroz, and Hilmand Provinces. The country’s climate is favorable for different vegetables and fruits. Among all fresh fruits, grapes are the most economically important horticultural crop, with a total production of 993,382 tons in 2020 in the country [37]. The total vineyard area is 87,593 ha, which makes up 0.13% of Afghanistan’s land [38]. A total of 46.97% of Afghanistan consists of rangeland and 34.45% of non-arable land. This means that the area for agricultural activities is very limited.
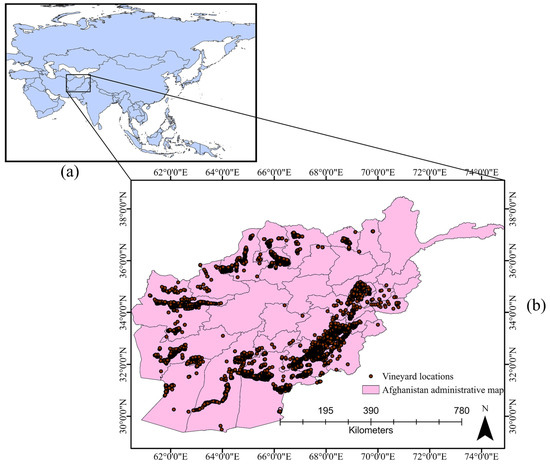
Figure 1.
Geographical extent of study area (a) Afghanistan on the world map (b) Afghanistan administrative map with vineyard location.
2.2. Vineyard Suitability Framework
This research was conducted in three steps. In the first step, infrastructure, soil, vegetation, and climate variables were organized for vineyard suitability analysis, as portrayed in the research flowchart (Figure 2 and Table 1). Variable maps, such as (a) elevation, (b) slope, (c) river, (d) road, (e) soil depth, (f) soil pH, (g) soil texture, (h) soil salinity, (i) NDVI, (j) LULC, and (k) rainfall were developed (Figure 3). In this research, different sources were used to obtain the datasets, such as FAO, readily available sources, and GEE for downloading big datasets of Landsat 8 Operational Land Imager (OLI) and rainfall. All primary suitability variables were resampled to the same resolution (30 m) as Landsat 8 OLI. Second, the fuzzy membership function was applied to each variable based on previous literature (Figure 4 and Table 2) [14,15,28,39,40,41,42,43]. Third, in the ArcGIS® environment, fuzzy gamma was applied to overlay all the variables. The suitability classes were identified (Figure 5) [44]. Finally, validation was performed with ground reference dataset.
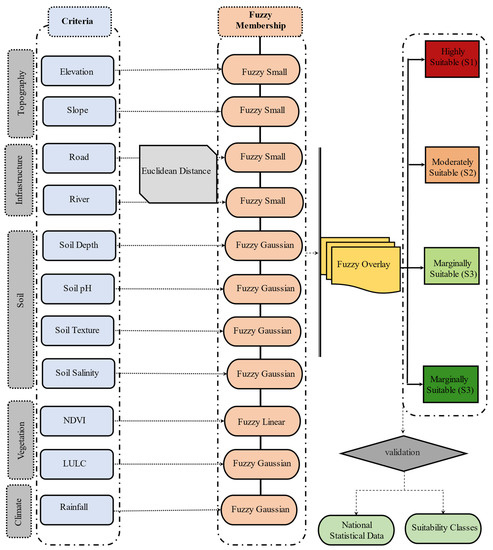
Figure 2.
Research framework for vineyard suitability analysis based on a fuzzy algorithm.

Table 1.
Variable selections and their explanation for specifications that included data types and sources.
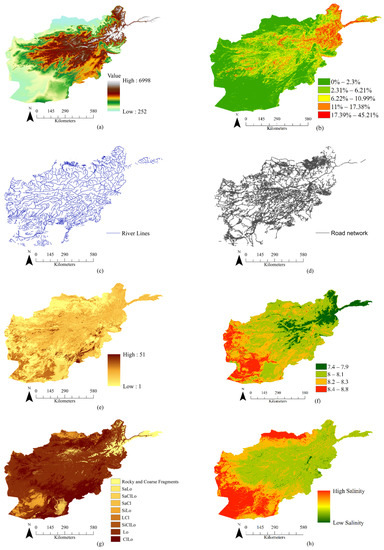
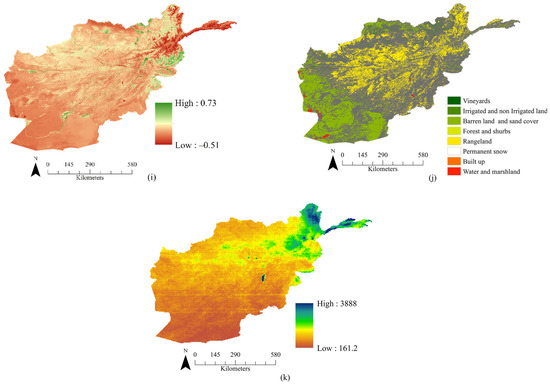
Figure 3.
Multicriteria maps for land suitability analysis: (a) elevation (m), (b) slope (%), (c) river, (d) road, (e) soil depth, (f) soil pH, (g) soil texture, (h) soil salinity, (i) normalized difference vegetation index (NDVI), (j) land use/land cover (LULC), and (k) rainfall (mm/h).
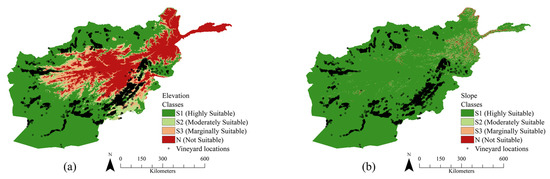
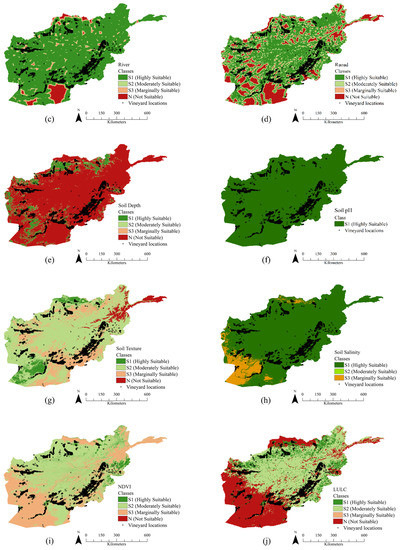
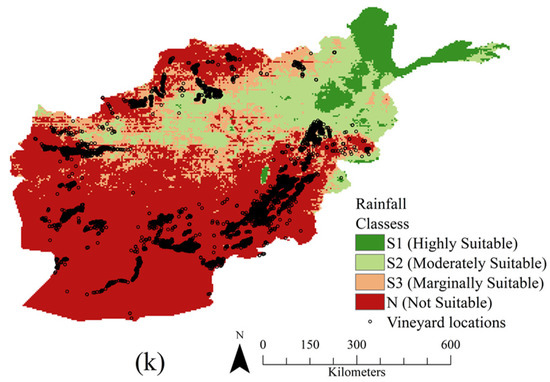
Figure 4.
Reclassification of the criterion used for suitability analysis (a–k).
Table 2.
Fuzzy Suitability membership function for vineyard.
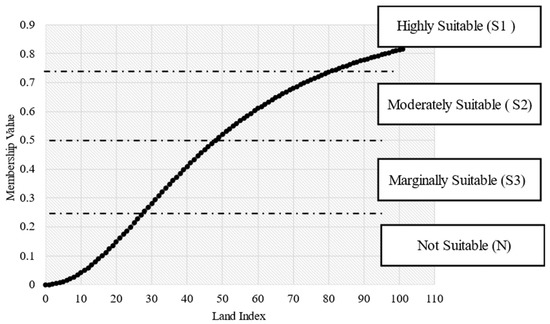
Figure 5.
Selection of suitability classes for vineyard location using a fuzzy membership function and land index.
2.3. Dataset and Variable Conversion (Fuzzification)
In the fuzzification method, the datasets of various ranges and unites were transformed into a common scale (0–1). The fuzzy small, large, linear, and Gaussian were assigned to biophysical, climatic, infrastructure, topographic, and soil-related variables in this study, respectively. The fuzzy small transformation function was used when the small values of the input raster were more likely to be a member of the set (Table 2). The defined midpoint identifies the crossover point (assigned a membership of 0.5), with values greater than the midpoint having a lower chance of membership and values less than the midpoint having a higher chance of membership [Equation (1)]. Fuzzy linear indicates that the linear relationship in datasets and minimum values were assigned to 0, and maximum values were assigned to 1 [Equation (2)]. The fuzzy Gaussian demonstrated the normal distribution of datasets. The midpoint was assigned 1, and the remaining datasets moved in positive and negative directions. The input value membership was decreased when data moved from the midpoint [Equation (3)] [16]. All fuzzy membership functions have a midpoint () and a spread () [16]. Then each variable was classified according to the number and four categories, 1–0.85, 0.85–0.5, 0.5–0.25, and 0.25–0 and, respectively, highly suitable, moderately suitable, marginally suitable, and not suitable areas (Figure 4).
where is the fuzzy membership function, x is the variable, midpoint () and spread () [16].
where is the fuzzy membership function, x is the variable, a is the minimum and b is the maximum [16].
where is the fuzzy membership function, x is the variable midpoint () and spread () [16].
2.3.1. Elevation
In this study, elevation data were obtained from the SRTM DEM and taken from the USGS website (Table 1). This criterion was important because of its direct impact on grapevine phenology. The elevation dataset was converted using a fuzzy small function from low, ranging from 0 to a high of 6998 m [39]. The range of elevation was selected based on the field experience of the expert since the study area’s elevation was very high. Fuzzy small selection of the optimal elevation was selected in a range of 1500 m. The smaller values were considered optimum in an arrangement of 1500 m (Table 2). The elevation range changed from 0 to 1, where 0 denotes the least suitable areas and 1 denotes the most suitable areas. Therefore, 1–0.85 membership functions were highly suitable, 0.85–0.50 moderately suitable, 0.50–0.25 marginally suitable, and 0.25–0 not suitable (Figure 4a).
2.3.2. Slope
Slope relates to the vineyard’s degree of inclination, and a slight to moderate slope can be favorable for grape production. The Gaussian function was assigned to each pixel of the slope (Table 2). In the study area, a 5–15% slope was considered the optimal slope based on previous studies [15,35,39]. In this process, the optimum elevation was assigned at the peak of the function. More or less than the ideal range was not good for growing grapes. Finally, the range of membership functions were classified as 1–0.85 membership functions highly suitable, 0.85–0.50 moderately suitable, 0.50–0.25 marginally suitable, and 0.25–0 not suitable. (Figure 4b).
2.3.3. River
There is a significant impact on vineyard production, especially in a country such as Afghanistan, where water scarcity is widely observed due to its geographical location (Table 1). Based on previous studies and field experience, up to 1 km from rivers was considered the optimum distance. In this regard, fuzzy small membership functions were assigned to each river’s pixel variable (Table 2). The near area value changed to 1, and further locations were assigned a value of 0. Then the range of membership functions were classified as 1–0.85 membership functions highly suitable, 0.85–0.50 moderately suitable, 0.50–0.25 marginally suitable, and 0.25–0 not suitable (Figure 4c) [16].
2.3.4. Road
Roads are an important parameter in facilitating grower’s access to input and output markets (Table 1). Based on previous studies and a field expert’s experience, a distance of up to 1000 m from the road was selected as optimal for vineyard suitability. The fuzzy small membership function was assigned to roads (Table 2). The closer the road was assigned 1, and the farther distance was assigned 0. Then the range of membership functions were classified as 1–0.85 membership functions highly suitable, 0.85–0.50 moderately suitable, 0.50–0.25 marginally suitable, and 0.25–0 not suitable (Figure 4d) [16,35].
2.3.5. Soil Datasets
Several important soil variables were chosen, such as soil pH, soil depth, soil texture, and soil salinity. All these variables were obtained from the FAO soil database (Table 1). Fuzzy Gaussian membership was assigned for all soil components. The soil pH range in the study area was 7.4–8.8. The optimum range was 6.5–8 [45]. Soil texture was categorized for study areas into nine classes based on FAO classification. Based on reference, sandy loam, loam, and coarse sandy loam were selected with higher scores because clay or silt soils have less water-holding capacity in the root zone of grapevines [46]. Poor irrigation and drainage are the primary causes of soil salinity in the study area because it is mostly prone to drought [47]. The saline category is assigned a value of 0, and the less saline category is assigned a value of 1.2 ECe dS/m is not saline soil [48]. The fuzzy Gaussian was used to assign all soil parameters (Table 2). The optimal level is considered the peak of distribution, which is less than or higher than the range considered 0 [15,40,41,49]. Therefore, 1–0.85 membership functions highly suitable, 0.85–0.50 moderately suitable, 0.50–0.25 marginally suitable, and 0.25–0 not suitable were classified (Figure 4e–h).
2.3.6. Normalized Difference Vegetation Index (NDVI)
A Google Earth engine environment was used to calculate composite NDVI scenes from Landsat 8 OLI (TIRE 1, 8-days composite NDVI) from April to October for 5 years (2016–2020) (Table 1). Finally, the average of all NDVIs from 2016 to 2020 was considered for the suitability analysis. Further analysis was carried out with ArcGIS® 10.8. The fuzzy linear membership function was assigned (Table 2). The higher NDVI is given a value of 1, and the lower NDVI is given a value of 0 [42]. The membership functions 1–0.85 highly suitable, 0.85–0.50 moderately suitable, 0.50–0.25 marginally suitable, and 0.25–0 not suitable were classified (Figure 4i).
2.3.7. Land Use Land Cover (LULC)
The LULC datasets were obtained from FAO (Table 1). For instance, LULC consisted of different classes, such as vineyards, irrigated and non-irrigated agricultural land, forest and shrubs, rangeland, barren land and sand cover, permanent snow, build up, water, and marshland. Most of the Afghanistan’s land is covered in sand and rock, with only 12% suitable for agricultural activities. All the LULC categories reclassified to a new range of values. After the normalization, fuzzy Gaussian membership was given to LULC. The maximum vineyard and agricultural land membership is 1 (Table 2). However, the minimum membership function for buildings, roads, and water bodies is 0 [50]. The membership functions of 1–0.85 as highly suitable, 0.85–0.50 moderately suitable, 0.50–0.25 marginally suitable, and 0.25–0 not suitable were classified (Figure 4j).
2.3.8. Rainfall
The rainfall data were collected yearly from the website of CHIRPS. Following that, the years 2016–2020 were used in this calculation (Table 1). Based on previous studies, the optimum rainfall for grapevines is approximately 500 mm, and the reference fuzzy Gaussian was used [45,49] (Table 2). The optimum rainfall was assigned to 1, which was less than or greater than that assigned to 0. The membership functions of 1–0.85 highly suitable, 0.85–0.50 moderately suitable, 0.50–0.25 marginally suitable, and 0.25–0 not suitable were classified (Figure 4k).
2.4. Fuzzy Overlay
The fuzzy overlay was used for multicriteria to indicate the likelihood of a feature belonging to various sets. Fuzzy gamma was used to develop the final suitability map. Fuzzy gamma is made of fuzzy product and fuzzy sum. The fuzzy product was calculated by multiplying each cell’s fuzzy values by all the input criteria, and the fuzzy sum was calculated by adding the fuzzy values of each set to the cell location. The fuzzy gamma developed the links between the numerous input variables rather than merely returning the value of a single membership set, according to fuzzy OR and fuzzy AND [Equation (4)]. The final suitability map was classified based on the land suitability index and membership value (Figure 5).
where combination is the calculated fuzzy membership function, is a parameter chosen in the range (0, 1) and the fuzzy algebraic sum and fuzzy algebraic product are calculated using the Equation (5).
where μi is the fuzzy membership function for the ‘i’th map, and i = 1, 2, 3,…..n maps are to be combined and γ is the user input variable selected in the range 0–1. When γ = 0, the combination equals the fuzzy algebraic product and when γ = 1, the combination equals the fuzzy algebraic sum [33].
The suitable vineyards were classified based on the land index. The current and permanently unsuitable areas were considered in a similar class to not suitable, highly, moderately, and marginal areas. In this fuzzy method, a land index was calculated and converted from a 0–1 fuzzy value to be multiplied by 100. The suitability classes were determined by the value of the land index: S1 highly suitable land is 75–100, moderately suitable land is 75–50, S3 marginally suitable land is 50–25, and N not suitable land is 25–0 [45] (Figure 5).
2.5. Validation of Suitability Map with Ground Reference Data
The total yield of 2020 for each of the province was collected from the statistical book of the Islamic Republic of Afghanistan (Figure 6) [37]. The average yield in each province was calculated from the total yield divided by the total vineyard area. Furthermore, the model validation was performed by evaluating and testing the proxy of ground data. In the context of this study, validation was performed using linear regression and polynomial regression function between the average vineyard area from the land suitability index and the average yield of grapes in each province level.
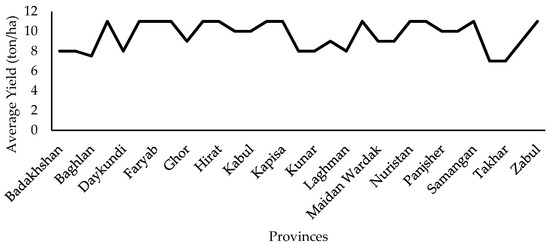
Figure 6.
Average yield of table grapes (ton/ha) in Afghanistan during 2020.
3. Results
3.1. Fuzzy Overlay Analysis
In this research, eleven fuzzy layers were used for vineyard suitability analysis (Figure 7). The fuzzy suitability results indicated that in Afghanistan overall, 23% (15,760,144 ha) of lands were highly, 44% (30,307,470 ha) were moderately, 22% (15,403,607 ha) were marginally, and 11% (7,370,025 ha) were not suitable for grape production in Afghanistan. To confirm the present vineyard locations, the results indicated that 90.3% (80,466 ha) of the vineyards were in the highly, 7.3% (6533 ha) moderately, 2.4% (2124 ha) marginally, and 0.01% (5 ha) unsuitable areas in Afghanistan (Table 3 and Table 4).
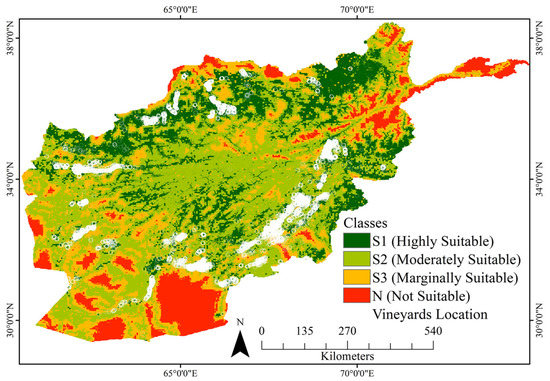
Figure 7.
Suitable areas for table grape production in Afghanistan based on fuzzy multicriteria decision analysis.
Table 3.
Potential areas belonging to the suitable classes based on fuzzy algorithms for Afghanistan.
Table 4.
Vineyard locations at different suitability classes distributed among the provinces of Afghanistan.
Moreover, based on fuzzy suitability analysis (gamma overlay), suitability classes were defined in present practice and potential categories. The results indicated that in most provinces, the potential for extension is very high, such as Badghis’s present practice of 81 ha and a potential of 11,442,659 ha, Balkh’s present practice of 650 ha and a potential of 802,525 ha, Faryab’s present practice of 7863 ha and a potential of 1,065,155 ha, Herat’s present practice of 7499 ha and a potential of 1,503,025 ha, Khandahar’s present practice of 18,784 ha and a potential of 615,253 ha, Samangan’s present practice of 628 ha and a potential of 465,673 ha, Sar-e-pul’s present practice of 8210 ha and a potential of 562,666 ha, and Takhar’s present practice of 107 ha and a potential of 836,973 ha (Table 5).
Table 5.
Vineyard locations and potential for vineyard extension at different suitability classes distributed among the provinces of Afghanistan.
3.2. Fuzzy Suitability Validation
Ground validation of the suitability map was significant for confirming each suitable vineyard and extending the vineyard areas for the future in Afghanistan. However, obtaining many ground datasets in the country’s current condition was very difficult. The results indicated good agreement between the land suitability index and average grape yield at the provincial level. The datasets were used for linear regression (R2 = 0.74) and polynomial regression (R2 = 0.84) (Figure 8). Polynomial regression indicated higher accuracy in prediction than the linear trend.
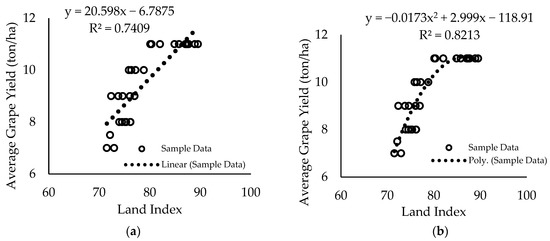
Figure 8.
Validation of the fuzzy-based land suitability score referring to the average grape yield from different provinces in Afghanistan. (a) linear regression and (b) polynomial regression.
4. Discussion
Fuzzy suitability analysis is a technique in land suitability analysis when the variables are more complicated and need a continuous output. In this regard, the fuzzy set model has many advantages, including the ability to convert all data to a range of 0–1, which is a great way to solve different magnitudes at different data layers, and the use of fuzzy membership functions to produce a thorough assessment of the suitability of the land for each crop production on a continuous scale across various land categories [3,29]. Moreover, the implementation of fuzzy inference as a useful addition to the fundamental of GIS and remote sensing techniques were proposed in this paper to extend the areas of vineyard [34]. Fuzzy sets were used in previous studies to determine the suitability analysis of land [16,26,28,33,51,52]. Most of the prior studies used fuzzy models to construct agricultural suitability analysis framework considering multiple variables related to specific micro-regions for cereals, fruits, and wine grape production. Pilevar et al. [52] used topographic variables such as slope and elevation and soil characteristics such as soil texture and soil pH for fuzzy suitability. In addition, other studies have used variables like rainfall, evapotranspiration, NDVI, LULC, soil, soil moisture, groundwater level, slope, and elevation to assess fuzzy suitability assessment [29,53]. In this study, topographic variables (elevation and slop), soil variables (soil depth, soil pH, soil texture, soil salinity), vegetation (NDVI), infrastructure (road and river), and climatic (rainfall) variables were changed to fuzzy membership. After applying different fuzzy membership functions to each variable based on references and the literature, the suitability classes were defined [16,50]. Literatures indicated how well-developed fuzzy inference variables selection have significant advantages over the conventional method of mathematical modeling [29,54]. In the USA, a study was done on vineyard site selection and revealed that fuzzy set methods were the best method for land suitability classification with expert knowledge. Similarly, other studies mentioned expert knowledge is an influential factor [16] for vineyard management and long-term strategy development. However, the advantageous application of fuzzy methodology has been confirmed by Tang et al. (1997). In this research, higher accuracy has reported for the fuzzy method in comparison with Boolean methods for land suitability evaluation of different crops [55].
The findings of this study indicated that highly suitable regions were mostly located in the southern regions of Afghanistan for its agroclimatology. Furthermore, some parts of the western zone and northern zone were also suitable. These regions include Kabul, Logar, Khandahar, Kapisa, Ghazni, Zabul, Uruzgan, Kandahar, Herate, Badghis, Frayah, Jawzjan, Balkh, Kunduz, and Takhar Provinces. However, some parts of the northeast and central highlands, where the elevation is very high, are not suitable for grape production. Increasing elevation raises the likelihood of frost, cooler temperatures, and a decrease in plant growth months [39]. The study also proved that there was potential for vineyard extension in Afghanistan for grape production. However, only 0.13% of the land area is currently under vineyard production practices. Some provinces have the highest potential for vineyard extension, such as Badghis, Faryab, Herat, and Takher. The government could act to increase vineyards since the suitable areas exceed reality because grapes are an industrial crop, and fresh grapes play an important role in growers’ farm income and international trade in Afghanistan. The extension of vineyards can support farmers’ livelihoods, particularly in the southern provinces (Table 5 and Figure 7).
In this study, the suitability model was validated with the average yield of each provincial vineyard. Thus, the model accuracy was approximately 82% on the regional scale. Previous studies also reported the higher accuracy of the fuzzy method in comparison with Boolean methods for land suitability evaluation of different crops. They compared land index to the observed yield of rubber and maize. They discovered that the fuzzy approach had a correlation coefficient of 0.89, 0.87 [51,56] for land suitability for cassava done in Indonesia. They compared land indices with observed yield and obtained a correlation coefficient of 0.55 [16]. Based on the high accuracy findings that came from this research, the fuzzy set technique could be a good model for land assessment in other environments. However, the average yield of each province was not adequate for validation due to the inaccessibility of ground reference data and information. This study can help researchers and decision-makers find more prospective acreage for expanding vineyards at the regional scale. Further research will be performed to expand the model with additional expertise knowledge with respect to economical points of view and logistics, including storage facilities for table grapes to reduce the post-harvest losses at the regional scale.
5. Conclusions
Selecting appropriate land for a vineyard is very important for sustainable grape production. Therefore, the primary objective of this study was to develop a land suitability analysis method using a fuzzy membership function on a regional scale to extend the best areas for table grape production. In this study, different climate, topographic, vegetation, and soil parameters were considered for vineyard suitability analysis. After this step, the final suitability map was developed based on the fuzzy overlay method. In further assessments, the validation of the suitability map was performed for table grape yield at the provincial level. The validation results of the suitability analysis indicated that the land suitability model had 82% accuracy at the regional scale. In the analysis, we found that less than 1% of the highly suitable area was used for vineyards. There is a significant opportunity to increase the production of table grapes in another 22% highly suitable areas. Therefore, the main finding of this study suggests that there is a potential for vineyard expansion in Afghanistan. This study contributes to the expansion of limited studies on vineyard suitability by bringing in multiple variables centering on the fuzzy method at the regional scales to increase table grape production.
Author Contributions
Research investigation, methodology, data curation, analysis, interpretation of results, and writing—original draft, S.T.A.; research conceptualization, editing, and supervision, T.A. All authors have read and agreed to the published version of the manuscript.
Funding
This research received no external funding.
Data Availability Statement
The dataset that was generated and analyzed during this study is available from the corresponding author upon reasonable request, but restrictions apply to the data reproducibility or reuse or commercial application of datasets.
Acknowledgments
The authors are grateful for the LANDSAT/LC08/C01/T1 8DAY NDVI product of the United States Geological Survey and the Google Earth Engine developers, in addition to the CHIRPS precipitation dataset from the climate hazards group, the Afghanistan Geodesy and Cartography Head Office (AGCHO) for the map of Afghanistan’s administrative boundaries, FAO for the land cover shapefile and soil characteristics datasets, and the Central Statistics Organization of the Islamic Republic of Afghanistan for yield datasets. The More Jobs, Better Lives (MJBL) Foundation, which gives a scholarship, is thankful to the initial author.
Conflicts of Interest
The authors declare no conflict of interest.
References
- Akıncı, H.; Özalp, A.Y.; Turgut, B. Agricultural land use suitability analysis using GIS and AHP technique. Comput. Electron. Agric. 2013, 97, 71–82. [Google Scholar] [CrossRef]
- Habibie, M.I.; Noguchi, R.; Shusuke, M.; Ahamed, T. Land suitability analysis for maize production in Indonesia using satellite remote sensing and GIS-based multicriteria decision support system. GeoJournal 2019, 86, 777–807. [Google Scholar] [CrossRef]
- Kılıc, O.M.; Ersayın, K.; Gunal, H.; Khalofah, A.; Alsubeie, M.S. Combination of fuzzy-AHP and GIS techniques in land suitability assessment for wheat (Triticum aestivum) cultivation. Saudi J. Biol. Sci. 2022, 29, 2634–2644. [Google Scholar] [CrossRef] [PubMed]
- Worqlul, A.W.; Dile, Y.T.; Jeong, J.; Adimassu, Z.; Lefore, N.; Gerik, T.; Srinivasan, R.; Clarke, N. Effect of climate change on land suitability for surface irrigation and irrigation potential of the shallow groundwater in Ghana. Comput. Electron. Agric. 2019, 157, 110–125. [Google Scholar] [CrossRef]
- Gilliams, S.; Van Orshoven, J.; Muys, B.; Kros, H.; Heil, G.W.; Van Deursen, W. AFFOREST sDSS: A metamodel based spatial decision support system for afforestation of agricultural land. New For. 2005, 30, 33–53. [Google Scholar] [CrossRef]
- Grassano, N.; Tedone, L.; Verdini, L.; De Mastro, G. Evaluation of rapeseed cultivation suitability in Apulia with GIS-multicriteria analysis. Ital. J. Agron. 2011, 6, e16. [Google Scholar] [CrossRef]
- Wang, L.; Ma, Y.; Yan, J.; Chang, V.; Zomaya, A.Y. PipsCloud: High performance cloud computing for remote sensing big data management and processing. Future Gener. Comput. Syst. 2018, 78, 353–368. [Google Scholar] [CrossRef]
- Xie, Z.; Phinn, S.R.; Game, E.T.; Pannell, D.J.; Hobbs, R.J.; Briggs, P.R.; McDonald-Madden, E. Using Landsat observations (1988–2017) and Google Earth Engine to detect vegetation cover changes in rangelands-A first step towards identifying degraded lands for conservation. Remote Sens. Environ. 2019, 232, 111317. [Google Scholar] [CrossRef]
- Funk, C.; Peterson, P.; Landsfeld, M.; Pedreros, D.; Verdin, J.; Shukla, S.; Husak, G.; Rowland, J.; Harrison, L.; Hoell, A.; et al. The climate hazards infrared precipitation with stations—A new environmental record for monitoring extremes. Sci. Data 2015, 2, 150066. [Google Scholar] [CrossRef]
- Ghozat, A.; Sharafati, A.; Hosseini, S.A. Satellite-based monitoring of meteorological drought over different regions of Iran: Application of the CHIRPS precipitation product. Environ. Sci. Pollut. Res. 2022, 29, 36115–36132. [Google Scholar] [CrossRef]
- Akpoti, K.; Kabobah, A.T.; Zwart, S.J. Review–Agricultural land suitability analysis: State-of the- art and outlooks for integration of climate change analysis. Agric. Syst. 2019, 173, 172–208. [Google Scholar] [CrossRef]
- FAO. A Framework for Land Evaluation, Soils Bulletin No. 32. Rome: UNO-FAO. 1976. Available online: http://www.fao.org/3/X5310E/x5310e00.htm (accessed on 1 December 2020).
- Romano, G.; Dal Sasso, P.; Liuzzi, G.T.; Gentile, F. Multi-criteria decision analysis for land suitability mapping in a rural area of Southern Italy. Land Use Policy 2015, 48, 131–143. [Google Scholar] [CrossRef]
- Zabel, F.; Putzenlechner, B.; Mauser, W. Global agricultural land resources–a high resolution suitability evaluation and its perspectives until 2100 under climate change conditions. PLoS ONE 2014, 9, e107522. [Google Scholar] [CrossRef]
- Badr, G.; Hoogenboom, G.; Moyer, M.; Keller, M.; Rupp, R.; Davenport, J. Spatial suitability assessment for vineyard site selection based on fuzzy logic. Precis. Agric. 2018, 19, 1027–1048. [Google Scholar] [CrossRef]
- Purnamasari, R.A.; Noguchi, R.; Ahamed, T. Land suitability assessments for yield prediction of cassava using geospatial fuzzy expert systems and remote sensing. Comput. Electron. Agric. 2019, 166, 105018. [Google Scholar] [CrossRef]
- Saaty, T.L. The analytic hierarchy process (AHP). J. Oper. Res. Soc. 1980, 41, 1073–1076. [Google Scholar]
- Pramanik, M.K. Site suitability analysis for agricultural land use of Darjeeling district using AHP and GIS techniques. Modeling Earth Syst. Environ. 2016, 2, 56. [Google Scholar] [CrossRef]
- Deng, F.; Li, X.; Wang, H.; Zhang, M.; Li, R.; Li, X. GIS-based assessment of land suitability for alfalfa cultivation: A case study in the dry continental steppes of northern China. Span. J. Agric. Res. 2014, 12, 364–375. [Google Scholar] [CrossRef]
- Radočaj, D.; Jurišić, M.; Gašparović, M.; Plaščak, I. Optimal soybean (Glycine max L.) land suitability using gis-based multicriteria analysis and sentinel-2 multitemporal images. Remote Sens. 2020, 12, 1463. [Google Scholar] [CrossRef]
- Elaalem, M.; Comber, A.; Fisher, P. A comparison of fuzzy AHP and ideal point methods for evaluating land suitability. Trans. GIS 2011, 15, 329–346. [Google Scholar] [CrossRef]
- Perrot, N.; Baudrit, C.; Brousset, J.M.; Abbal, P.; Guillemin, H.; Perret, B.; Goulet, E.; Guérin, L.; Barbeau, G.; Picque, D. A decision support system coupling fuzzy logic and probabilistic graphical approaches for the agri-food industry: Prediction of grape berry maturity. PLoS ONE 2015, 10, e0134373. [Google Scholar] [CrossRef] [PubMed]
- Roy, J.; Saha, S. Assessment of land suitability for the paddy cultivation using analytical hierarchical process (AHP): A study on Hinglo river basin, Eastern India. Modeling Earth Syst. Environ. 2018, 4, 601–618. [Google Scholar] [CrossRef]
- Tashayo, B.; Honarbakhsh, A.; Akbari, M.; Eftekhari, M. Land suitability assessment for maize farming using a GIS-AHP method for a semi-arid region, Iran. J. Saudi Soc. Agric. Sci. 2020, 19, 332–338. [Google Scholar] [CrossRef]
- Purnamasari, R.A.; Noguchi, R.; Ahamed, T. Land suitability assessment for cassava production in Indonesia using GIS, remote sensing, and multi-criteria analysis. In Remote Sensing Application; Springer: Singapore, 2022; pp. 99–132. [Google Scholar]
- Acharya, T.D.; Yang, I.T. Vineyard suitability analysis of Nepal. Int. J. Environ. Sci. 2015, 6, 13. [Google Scholar]
- Tatem, A.J. Global climate matching: Satellite imagery as a tool for mapping vineyard suitability. J. Wine Res. 2005, 16, 19–32. [Google Scholar] [CrossRef]
- Salata, S.; Ozkavaf-Senalp, S.; Velibeyoğlu, K.; Elburz, Z. Land Suitability Analysis for Vineyard Cultivation in the Izmir Metropolitan Area. Land 2022, 11, 416. [Google Scholar] [CrossRef]
- Chrobak, K.; Chrobak, G.; Kazak, J.K. The use of common knowledge in fuzzy logic approach for vineyard site selection. Remote Sens. 2020, 12, 1775. [Google Scholar] [CrossRef]
- Habibie, M.I.; Noguchi, R.; Matsushita, S.; Ahamed, T. Development of micro-level classifiers from land suitability analysis for drought-prone areas in Indonesia. Remote Sens. Appl. Soc. Environ. 2020, 20, 100421. [Google Scholar] [CrossRef]
- Moisa, M.B.; Tiye, F.S.; Dejene, I.N.; Gemeda, D.O. Land suitability analysis for maize production using geospatial technologies in the Didessa watershed, Ethiopia. Artif. Intell. Agric. 2022, 6, 34–46. [Google Scholar] [CrossRef]
- Guo, Y.; Xia, H.; Pan, L.; Zhao, X.; Li, R. Mapping the northern limit of double cropping using a phenology-based algorithm and Google Earth Engine. Remote Sens. 2022, 14, 1004. [Google Scholar] [CrossRef]
- Grelier, M.; Guillaume, S.; Tisseyre, B.; Scholasch, T. Precision viticulture data analysis using fuzzy inference systems. OENO One 2007, 41, 19–31. [Google Scholar] [CrossRef]
- Coulon-Leroy, C.; Charnomordic, B.; Thiollet-Scholtus, M.; Guillaume, S. Fuzzy modeling of a composite agronomical feature using fisPro: The case of vine vigor. In Information Processing and Management of Uncertainty in Knowledge-Based Systems; Laurent, A., Strauss, O., Bouchon-Meunier, B., Yager, R.R., Eds.; Springer: Berlin/Heidelberg, Germany, 2014; pp. 127–137. [Google Scholar]
- Arab, S.T.; Salari, T.; Noguchi, R.; Ahamed, T. Land Suitability Analysis for Grape (Vitis vinifera L.) Production Using Satellite Remote Sensing, GIS, and Analytical Hierarchy Process. In Remote Sensing Application. New Frontiers in Regional Science: Asian Perspectives; Ahamed, T., Ed.; Springer: Singapore, 2022; Volume 59. [Google Scholar] [CrossRef]
- Wali, E.; Datta, A.; Shrestha, R.P.; Shrestha, S. Development of a land suitability model for saffron (Crocus sativus L.) cultivation in Khost Province of Afghanistan using GIS and AHP techniques. Arch. Agron. Soil Sci. 2016, 62, 921–934. [Google Scholar] [CrossRef]
- Afghanistan Central Statistics Organization (ACSO). 2020. Centeral Statistics Organization of Afghanistan’s Statistical Yearbook of 2018–2019. Islamic Republic of Afghanistan National Statistics and Information Authority, Kabul Afghanistan (42). 2021. Available online: https://invest.gov.af/theme3/wp-content/uploads/2021/06/Afghanistan-Statistical-Yearbook-first-Version.pdf (accessed on 12 March 2022).
- FAO. Land Cover ATLAS. The Islamic Republic of Afghanistan. 2016. Available online: https://www.fao.org/publications/card/en/c/cc0ac143-38ed-41f0-b7c6-2342ffa7f0e6/ (accessed on 15 June 2020).
- Stanchi, S.; Godone, D.; Belmonte, S.; Freppaz, M.; Galliani, C.; Zanini, E. Land suitability map for mountain viticulture: A case study in Aosta Valley (NW Italy). J. Maps 2013, 9, 367–372. [Google Scholar] [CrossRef]
- Park, S.; Jeon, S.; Kim, S.; Choi, C. Prediction and comparison of urban growth by land suitability index mapping using GIS and RS in South Korea. Landsc. Urban Plan. 2011, 99, 104–114. [Google Scholar] [CrossRef]
- Goldammer, T.; Grape Grower’s Handbook. A Guide to Viticulture for Wine Production. 2018. Available online: http://www.wine-grape-growing.com/ (accessed on 15 June 2021).
- Tiwari, N.D.; Mishra, D. Geospatial analysis of land degradation by fuzzy membership algorithm in reference to Satna river basin in northern foreland of Peninsular India. Arab. J. Geosci. 2022, 15, 1128. [Google Scholar] [CrossRef]
- Keshavarzi, A.; Sarmadian, F.; Heidari, A.; Omid, M. Land suitability evaluation using fuzzy continuous classification (a case study: Ziaran region). Mod. Appl. Sci. 2010, 4, 72. [Google Scholar] [CrossRef]
- Bellman, R.E.; Zadeh, L.A. Decision-making in a fuzzy environment. Manag. Sci. 1970, 17, 141–164. [Google Scholar] [CrossRef]
- USAID, Commercial Horticulture and Agricultural Marketing Program and Roots of Peace. Best Practices for GRAPE Production and Marketing in Afghanistan. Guide Offers Tips on Cultivation, Harvesting and Marketing Techniques to Improve Sales of Afghan Produce on International Export Markets. 2016. Available online: https://static1.squarespace.com/static/5b69fa24506fbeb93ef780e2/t/5c65bc46e5e5f088ebcad662/1550171215318/Best+Practices+for+GRAPE+Production+and+Marketing+in+Afghanistan+Roots+of+Peace+ROP.pdf (accessed on 15 June 2021).
- FAO. The Lasmic Republic of Afghanistan Soil ATLAS, Volume 1: Maps Derived from Soil Survey of Twenty-Six District of Nine Provinces. 2020. Available online: https://www.fao.org/publications/card/en/c/CA6928EN/ (accessed on 15 June 2020).
- Goes, B.J.M.; Howarth, S.E.; Wardlaw, R.B.; Hancock, I.R.; Parajuli, U.N. Integrated water resources management in an insecure river basin: A case study of Helmand River Basin, Afghanistan. Int. J. Water Resour. Dev. 2016, 32, 3–25. [Google Scholar] [CrossRef]
- De Pascale, S.; Barbieri, G. Effects of soil salinity from long-term irrigation with saline-sodic water on yield and quality of winter vegetable crops. Sci. Hortic. 1995, 64, 145–157. [Google Scholar] [CrossRef]
- Rameshkumar, S.; Vadivelu, S.; Reddy, R.; Naidu, L.; Hegde, R.; Srinivas, S. Land Suitability for Grape Cultivation and Its Economic Evaluation in Rajanukunte Watershed, Karnataka. 2006. Available online: http://isslup.in/wp-content/uploads/2018/09/Land-suitability-for-grape-cultivation-and-its.pdf (accessed on 15 June 2021).
- Mustafiz, R.B.; Noguchi, R.; Ahamed, T. Agricultural Land Suitability Assessment Using Satellite Remote Sensing-Derived Soil-Vegetation Indices. In Remote Sensing Application; Springer: Singapore, 2022; pp. 65–98. [Google Scholar]
- Braimoh, A.K.; Vlek, P.L.; Stein, A. Land evaluation for maize based on fuzzy set and interpolation. Environ. Manag. 2004, 33, 226–238. [Google Scholar] [CrossRef]
- Pilevar, A.R.; Matinfar, H.R.; Sohrabi, A.; Sarmadian, F. Integrated fuzzy, AHP and GIS techniques for land suitability assessment in semi-arid regions for wheat and maize farming. Ecol. Indic. 2020, 110, 105887. [Google Scholar] [CrossRef]
- Ahamed, T.N.; Rao, K.G.; Murthy, J.S.R. GIS-based fuzzy membership model for crop-land suitability analysis. Agric. Syst. 2000, 63, 75–95. [Google Scholar] [CrossRef]
- Hong, T.-P.; Lee, C.-Y. Induction of fuzzy rules and membership functions from training examples. Fuzzy Sets Syst. 1996, 84, 33–47. [Google Scholar] [CrossRef]
- Tang, H.; Van Ranst, E.; Groenemans, R. Application of fuzzy set theory to land suitability assessment. Malays. J. Soil Sci. 1997, 3, 39–58. [Google Scholar]
- Van Ranst, E.; Tang, H.; Groenemam, R.; Sinthurahat, S. Application of fuzzy logic to land suitability for rubber production in peninsular Thailand. Geoderma 1996, 70, 1–19. [Google Scholar] [CrossRef]
Publisher’s Note: MDPI stays neutral with regard to jurisdictional claims in published maps and institutional affiliations. |
© 2022 by the authors. Licensee MDPI, Basel, Switzerland. This article is an open access article distributed under the terms and conditions of the Creative Commons Attribution (CC BY) license (https://creativecommons.org/licenses/by/4.0/).