
Drought Risk Evaluation in Iran by Using Geospatial Technologies


Abstract
1. Introduction
2. Materials and Methods
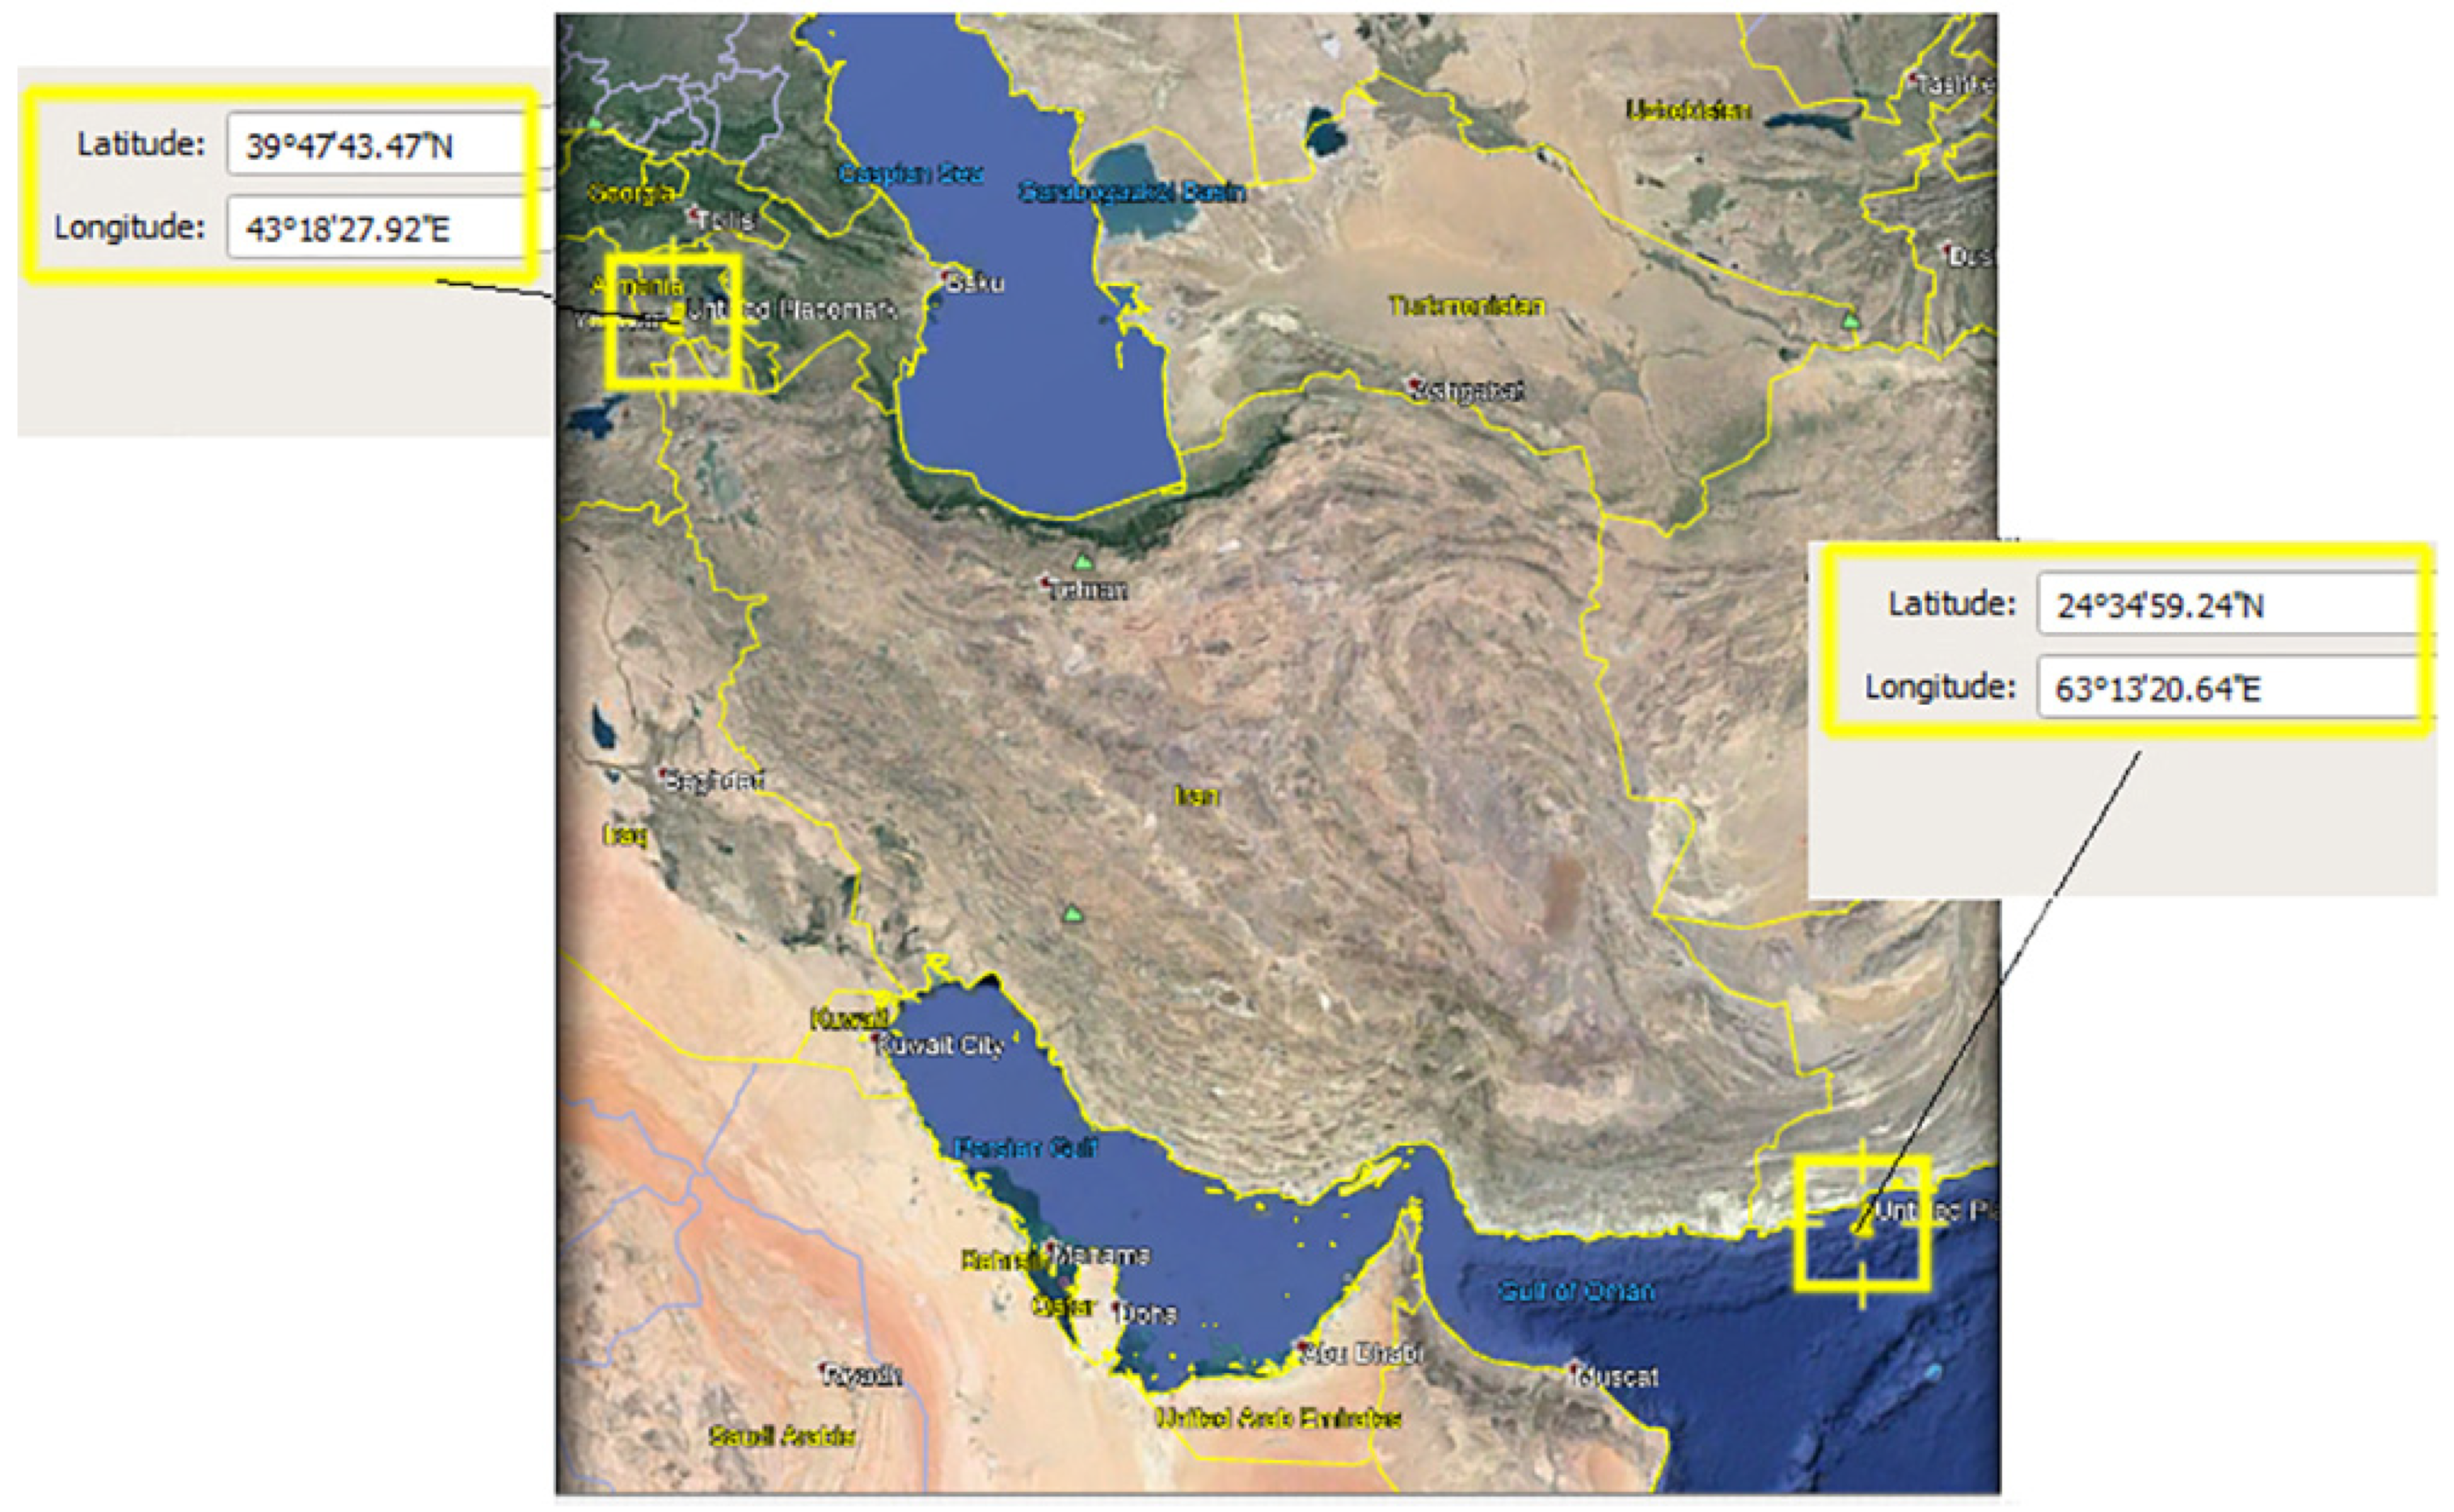
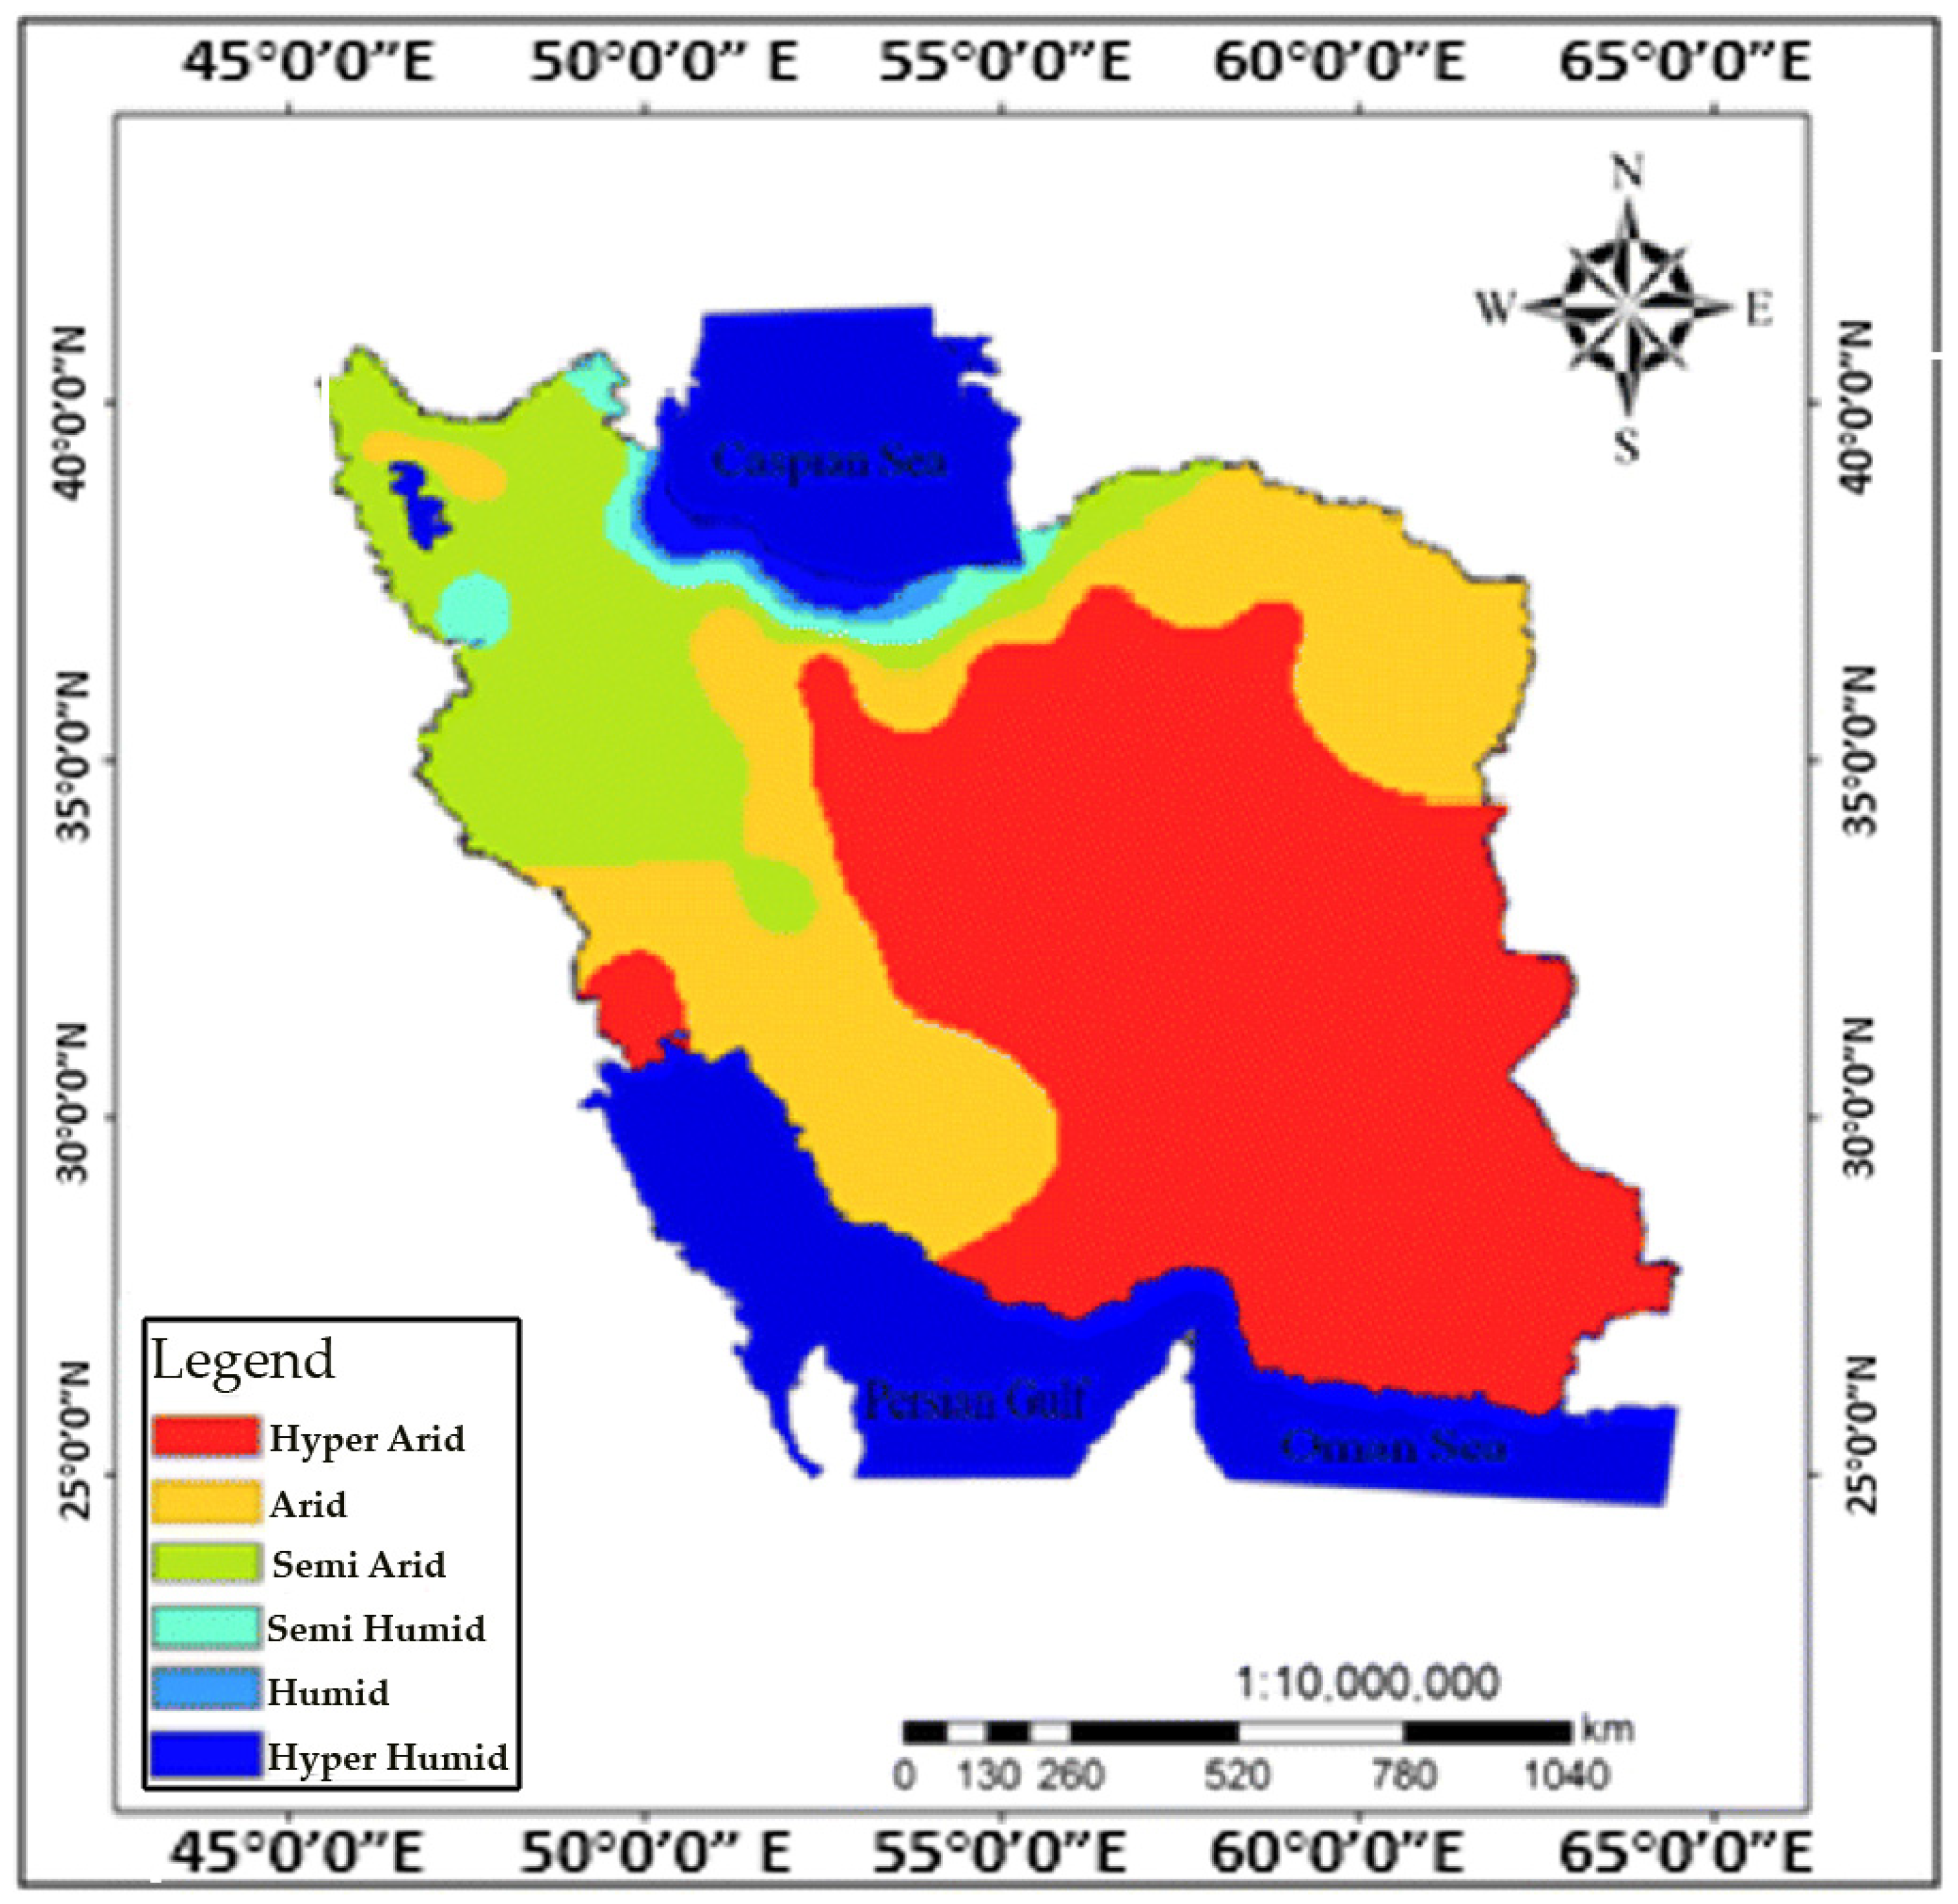
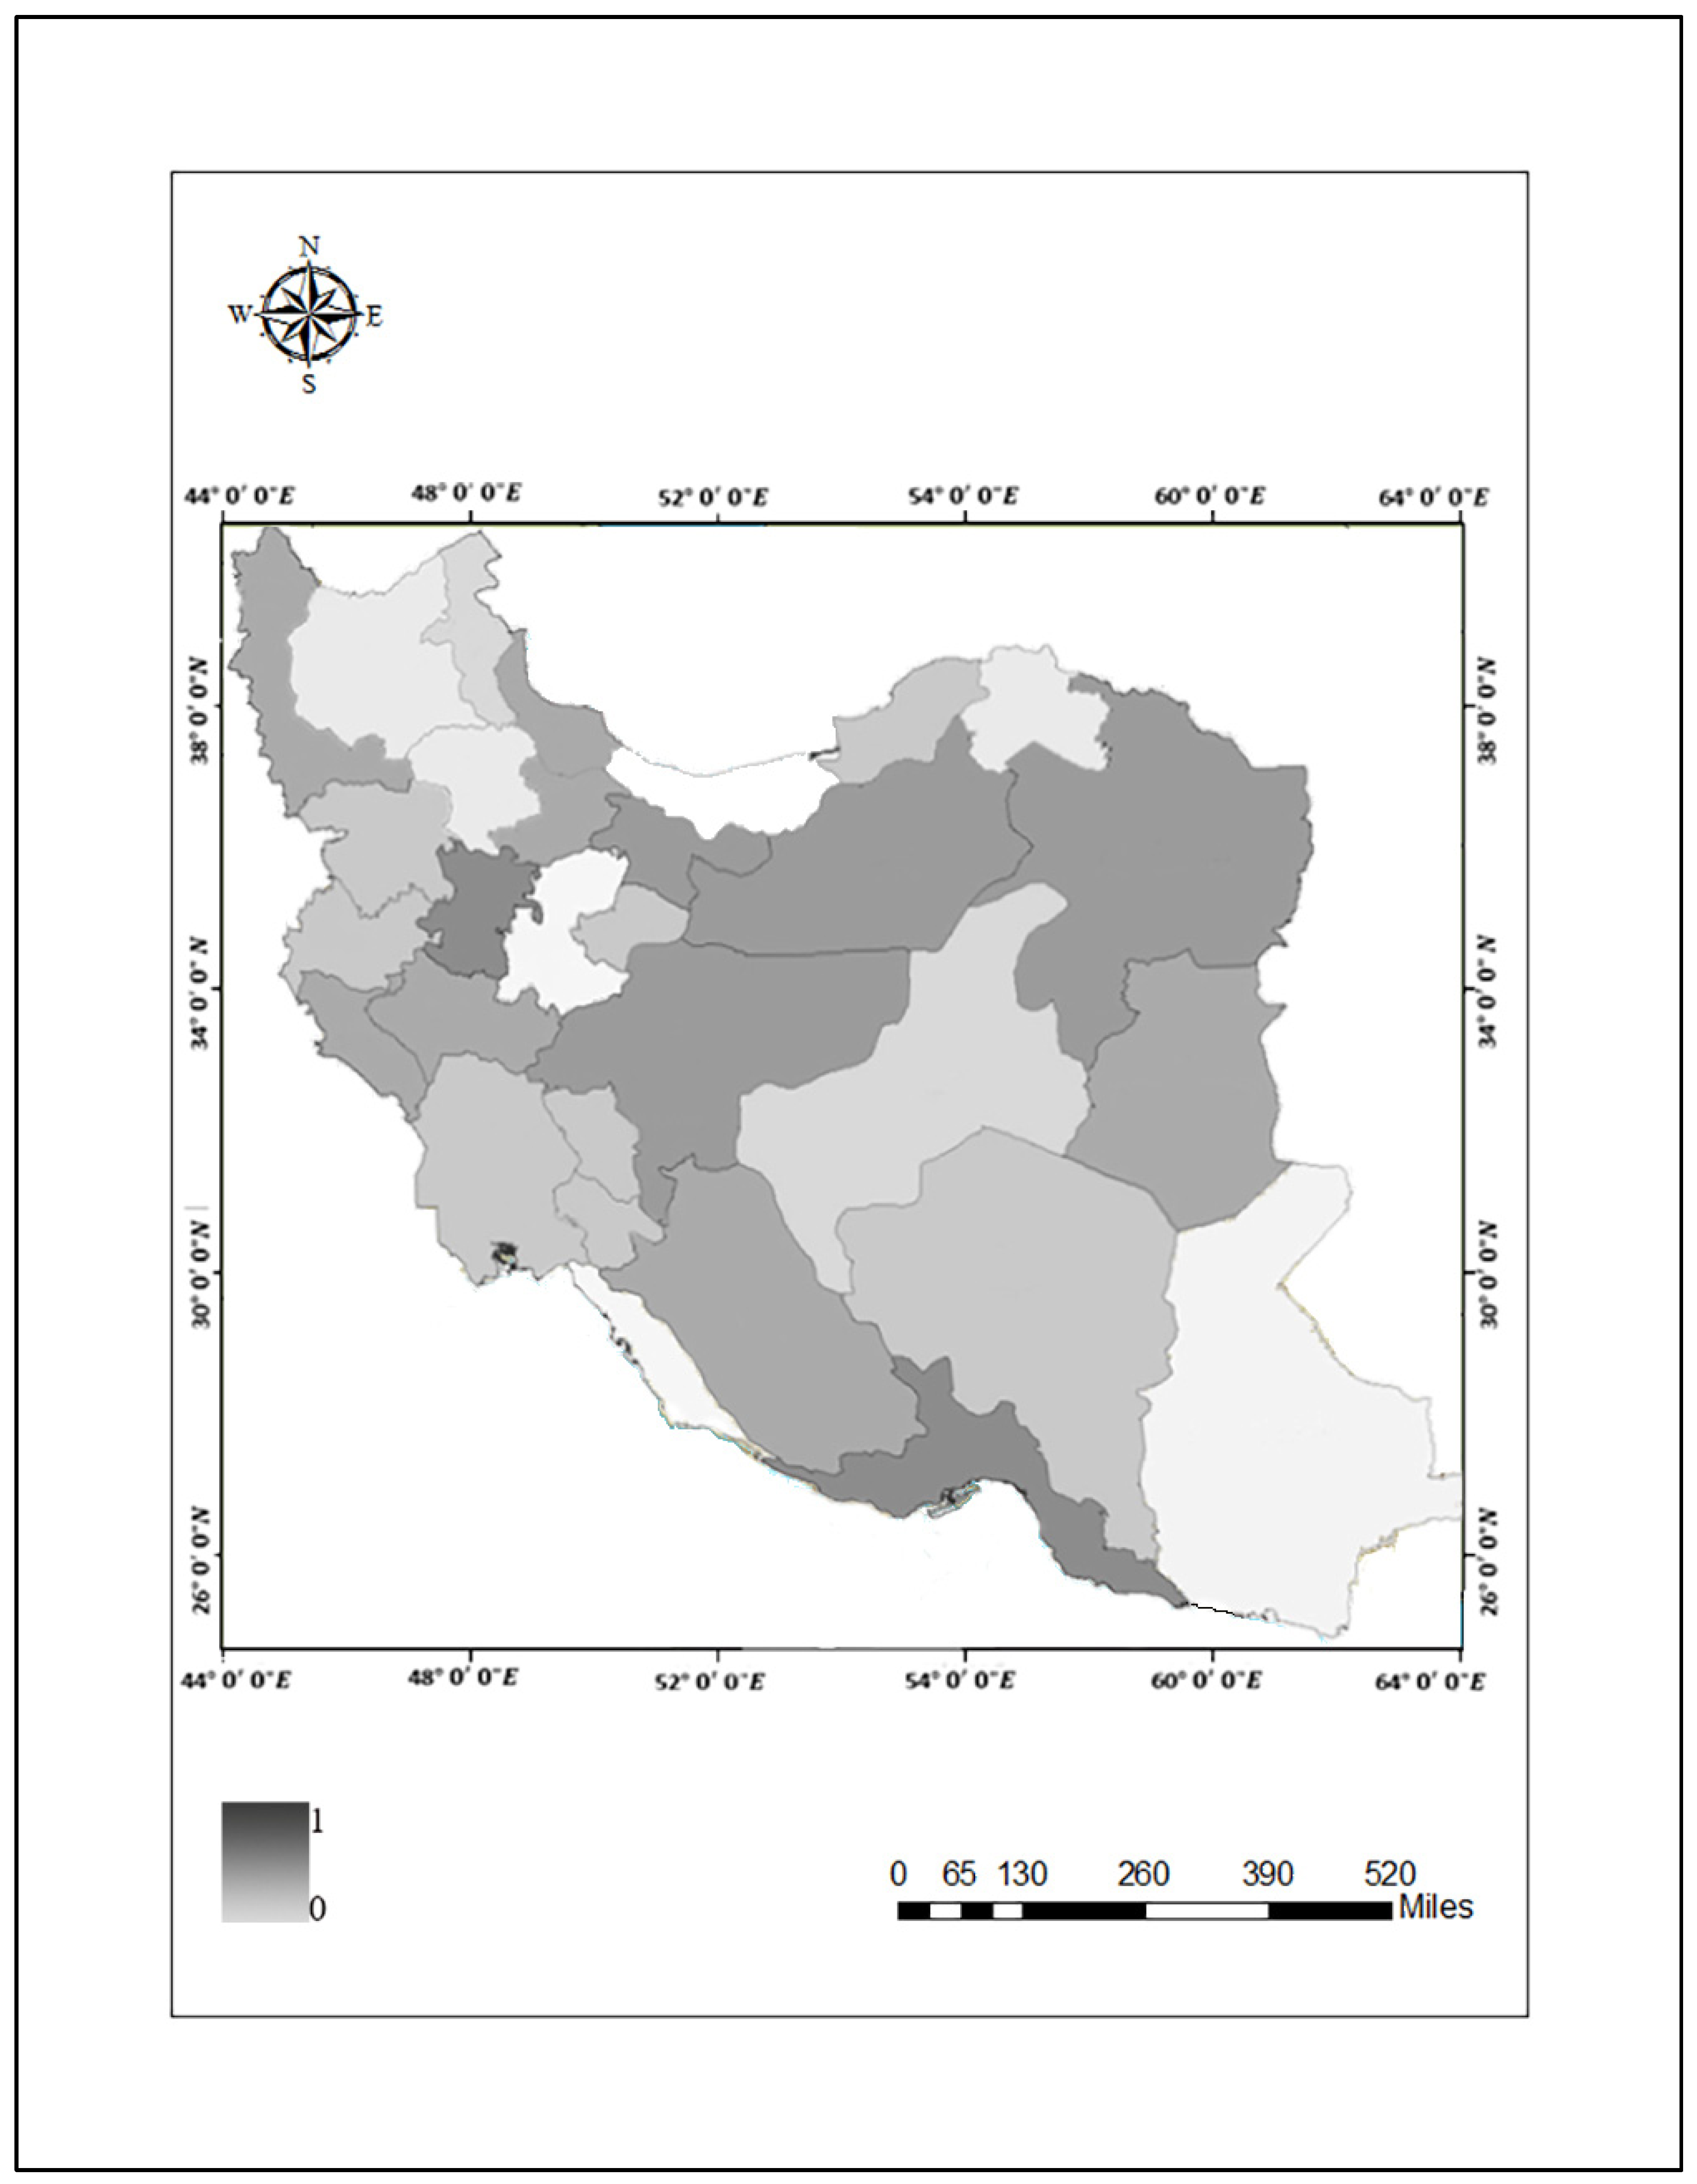
2.1. Study Area
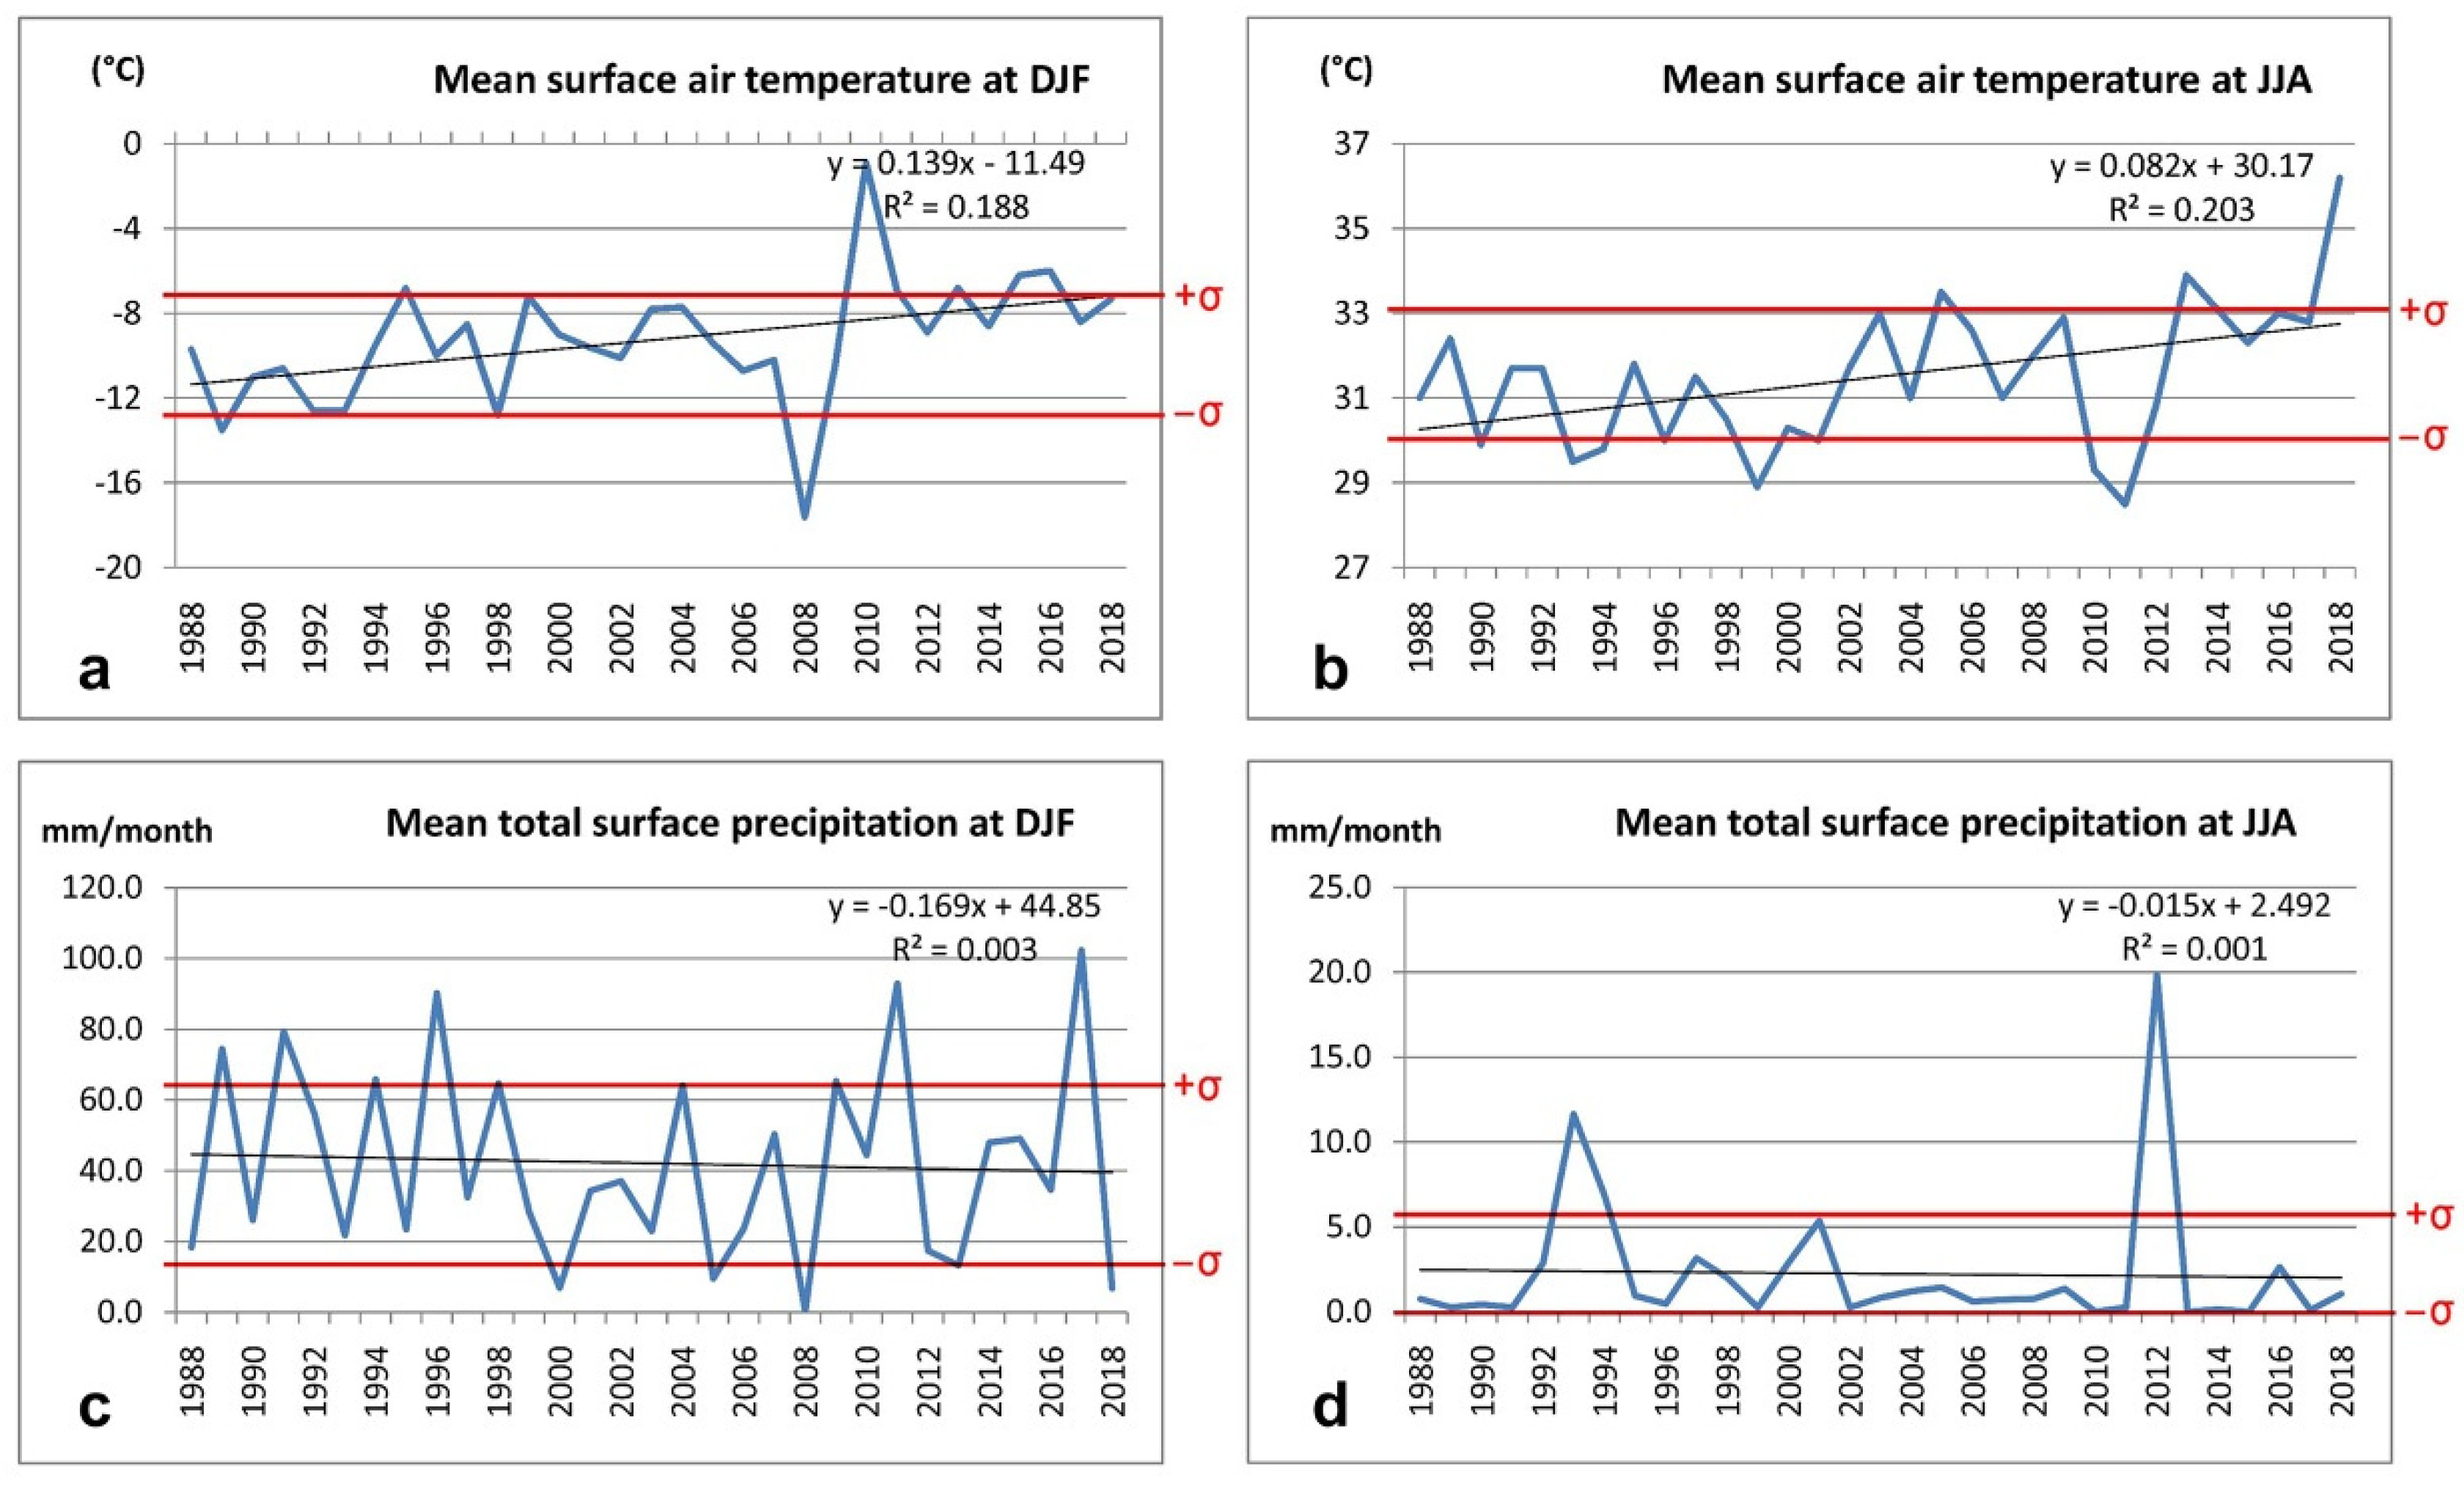
2.2. Long-Term Air Temperature and Precipitation Trends in Iran
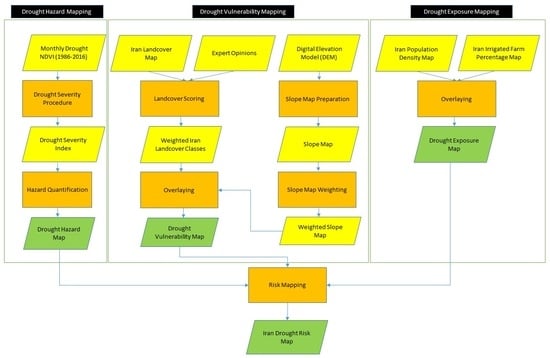
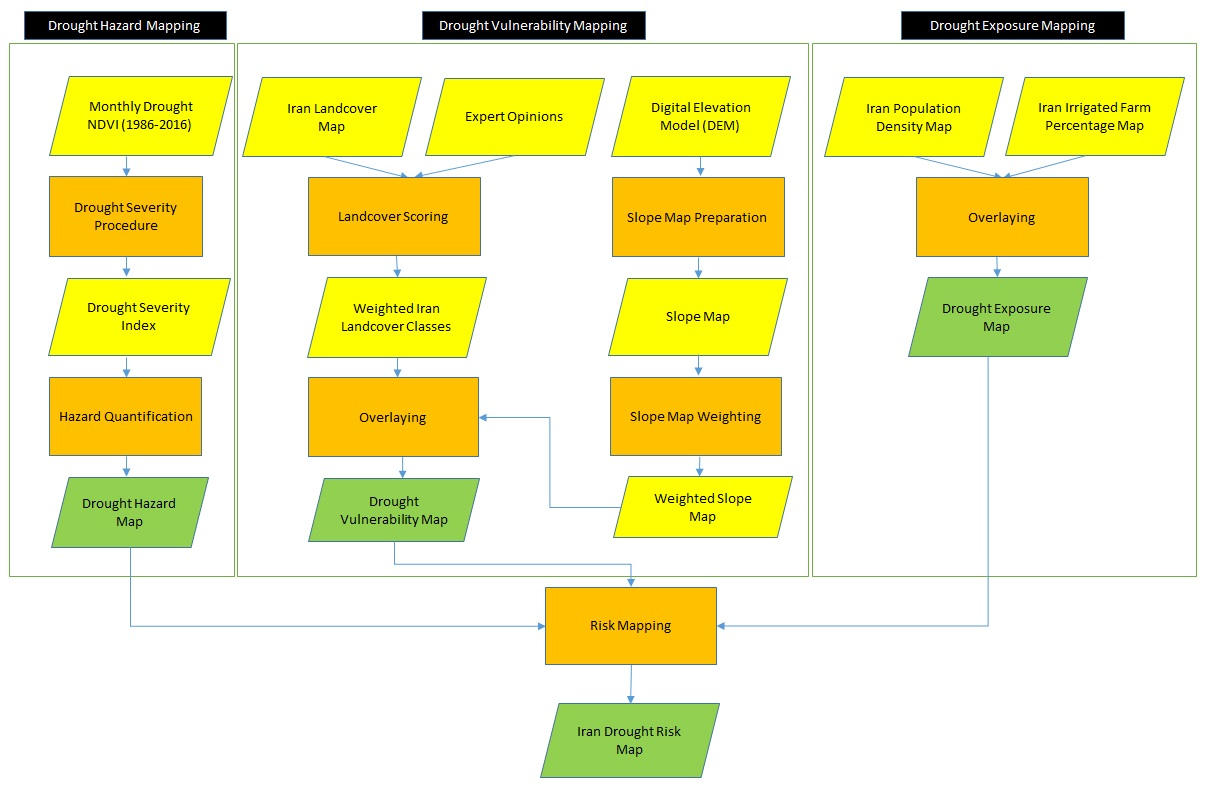
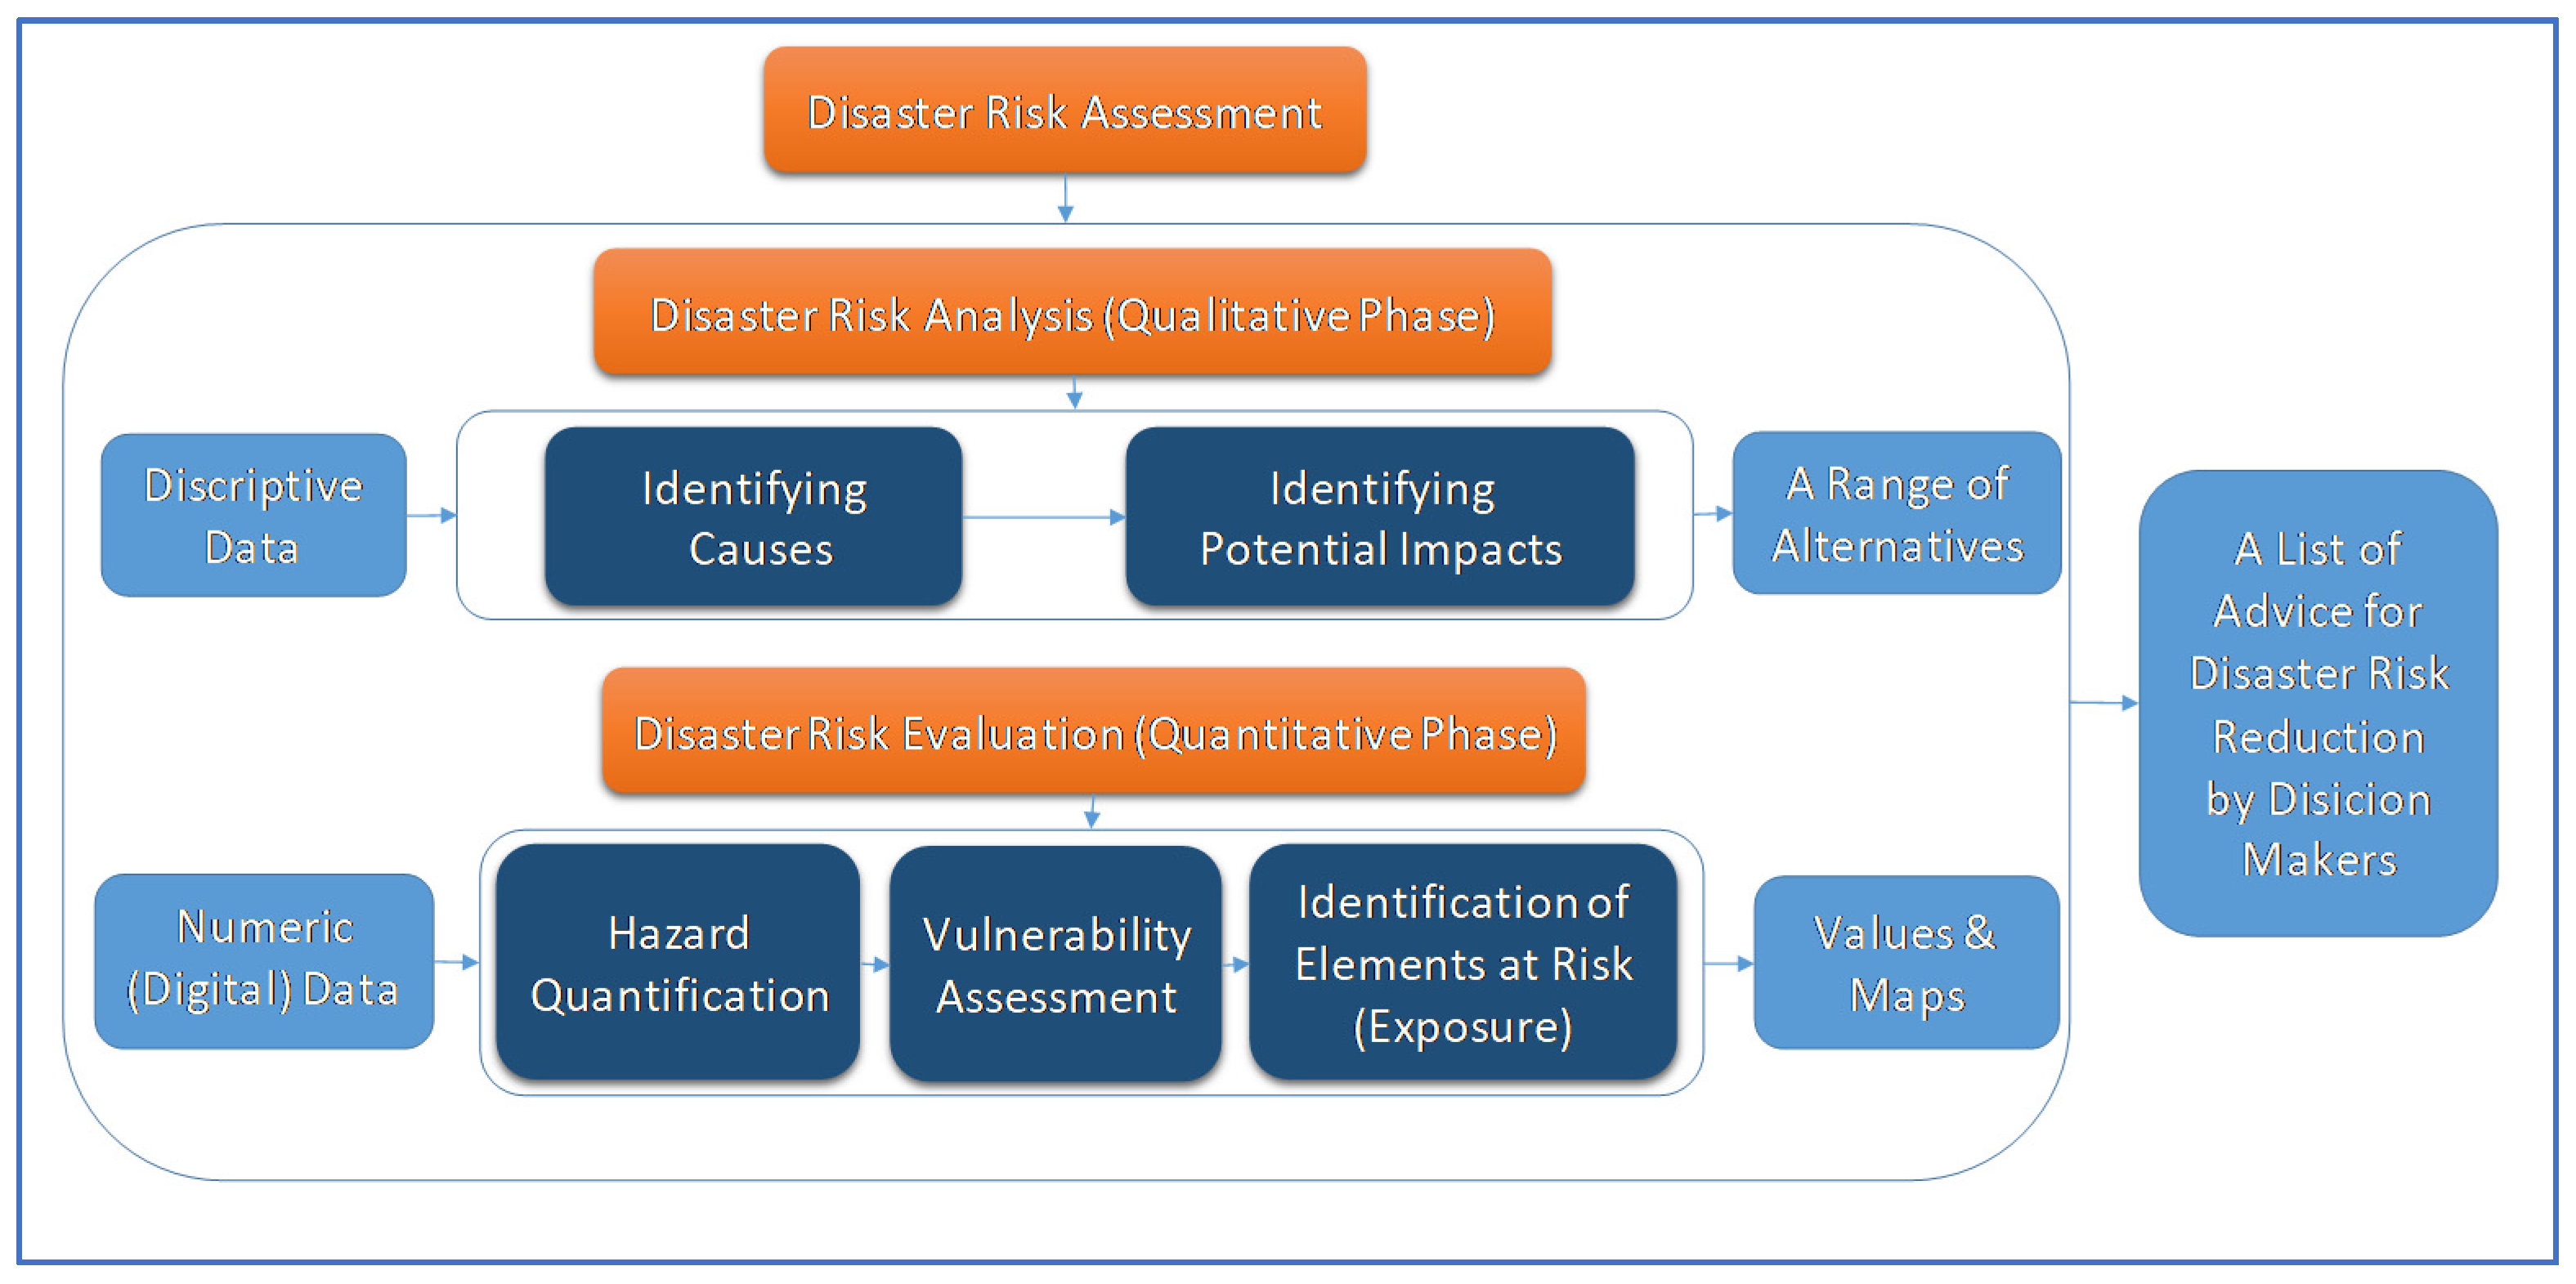
2.3. Disaster Risk Assessment
2.3.1. Disaster Risk Analysis (Qualitative Phase)
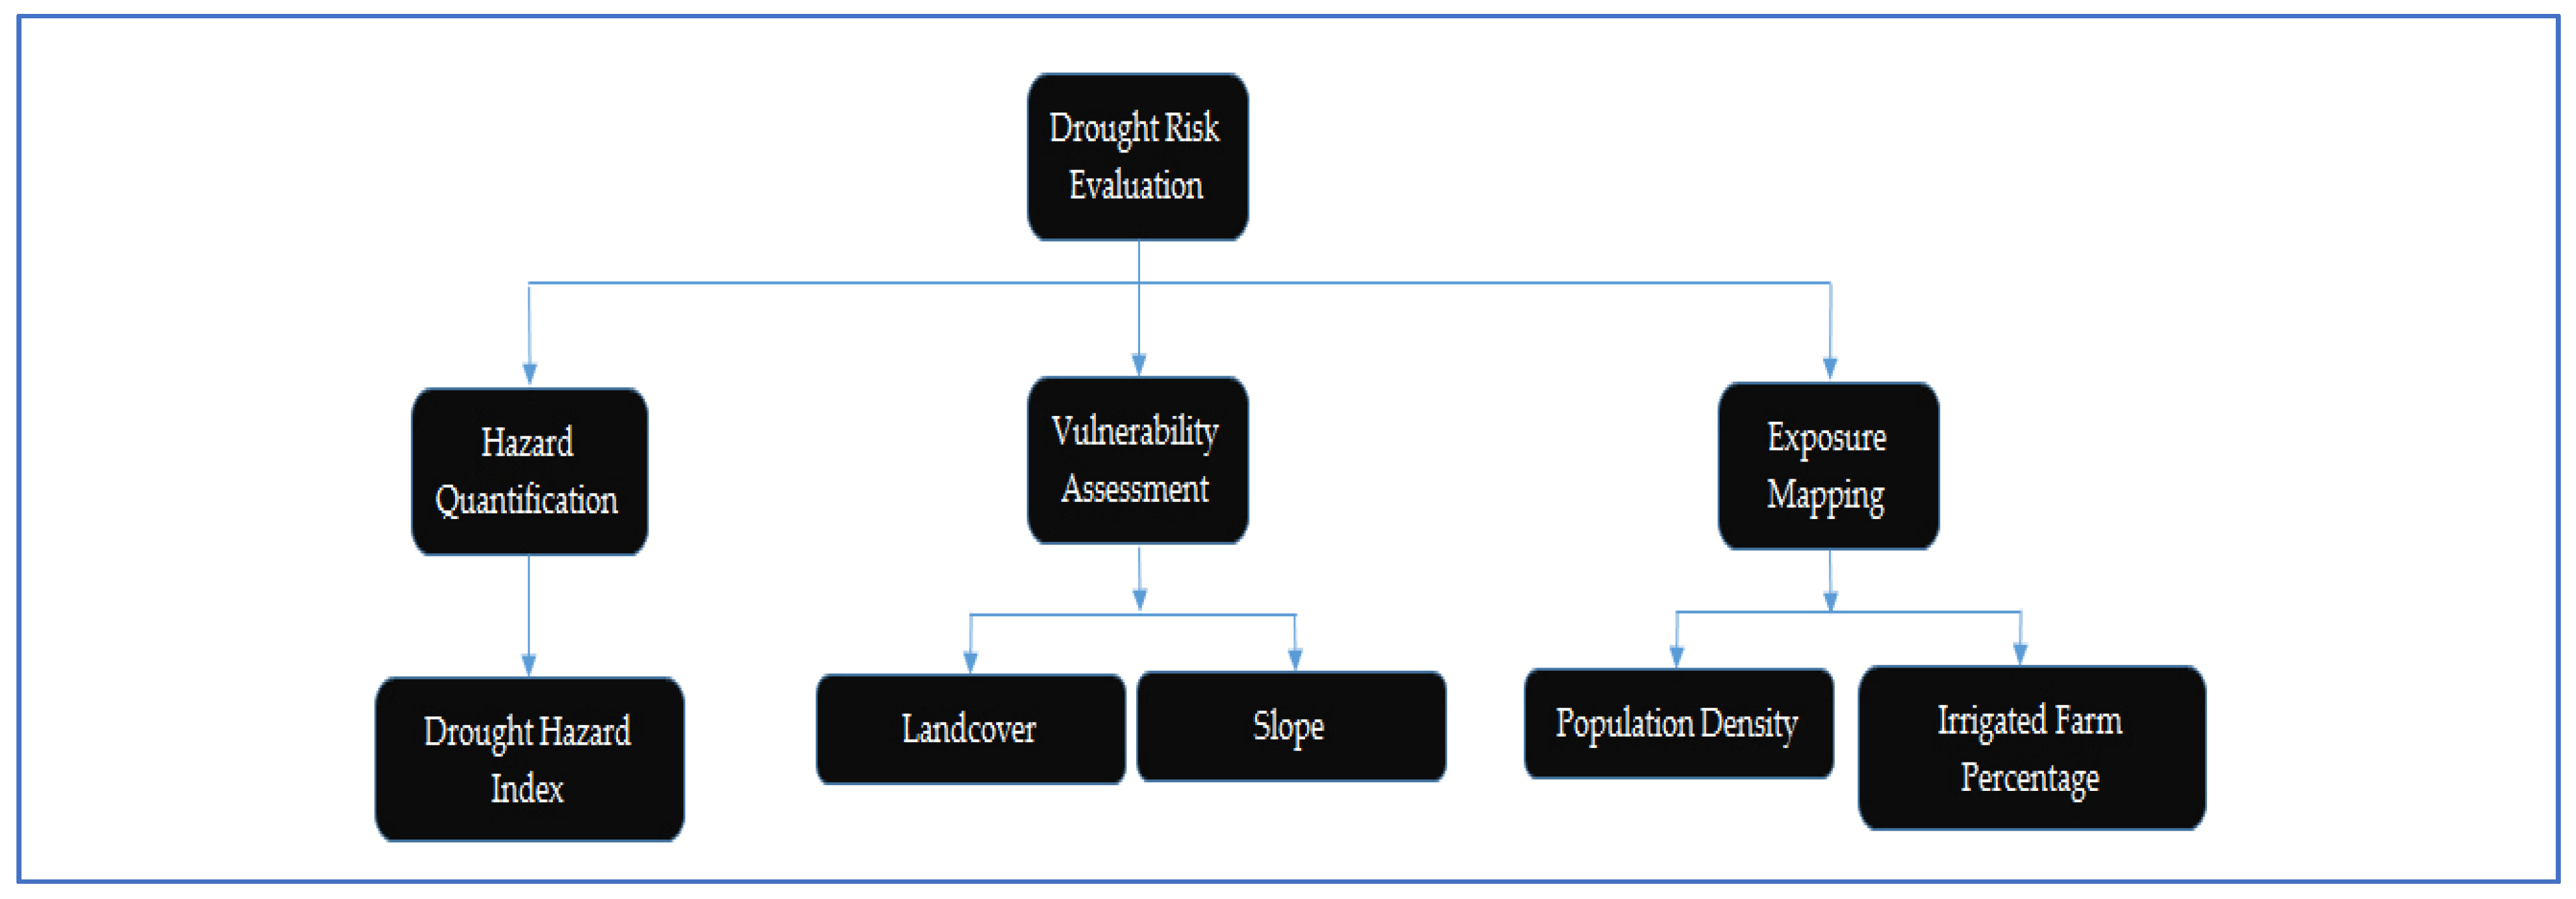
2.3.2. Disaster Risk Evaluation
- Hazard quantification (HQ);
- Vulnerability assessment (VA); and
- Identification of exposure; also called elements at risk (IER).
- Hazard quantification (HQ):
- Vulnerability assessment (VA):
- Identification of exposure or elements at risk (IER):
2.4. Research Data and Period
3. Results
3.1. Hazard Quantification
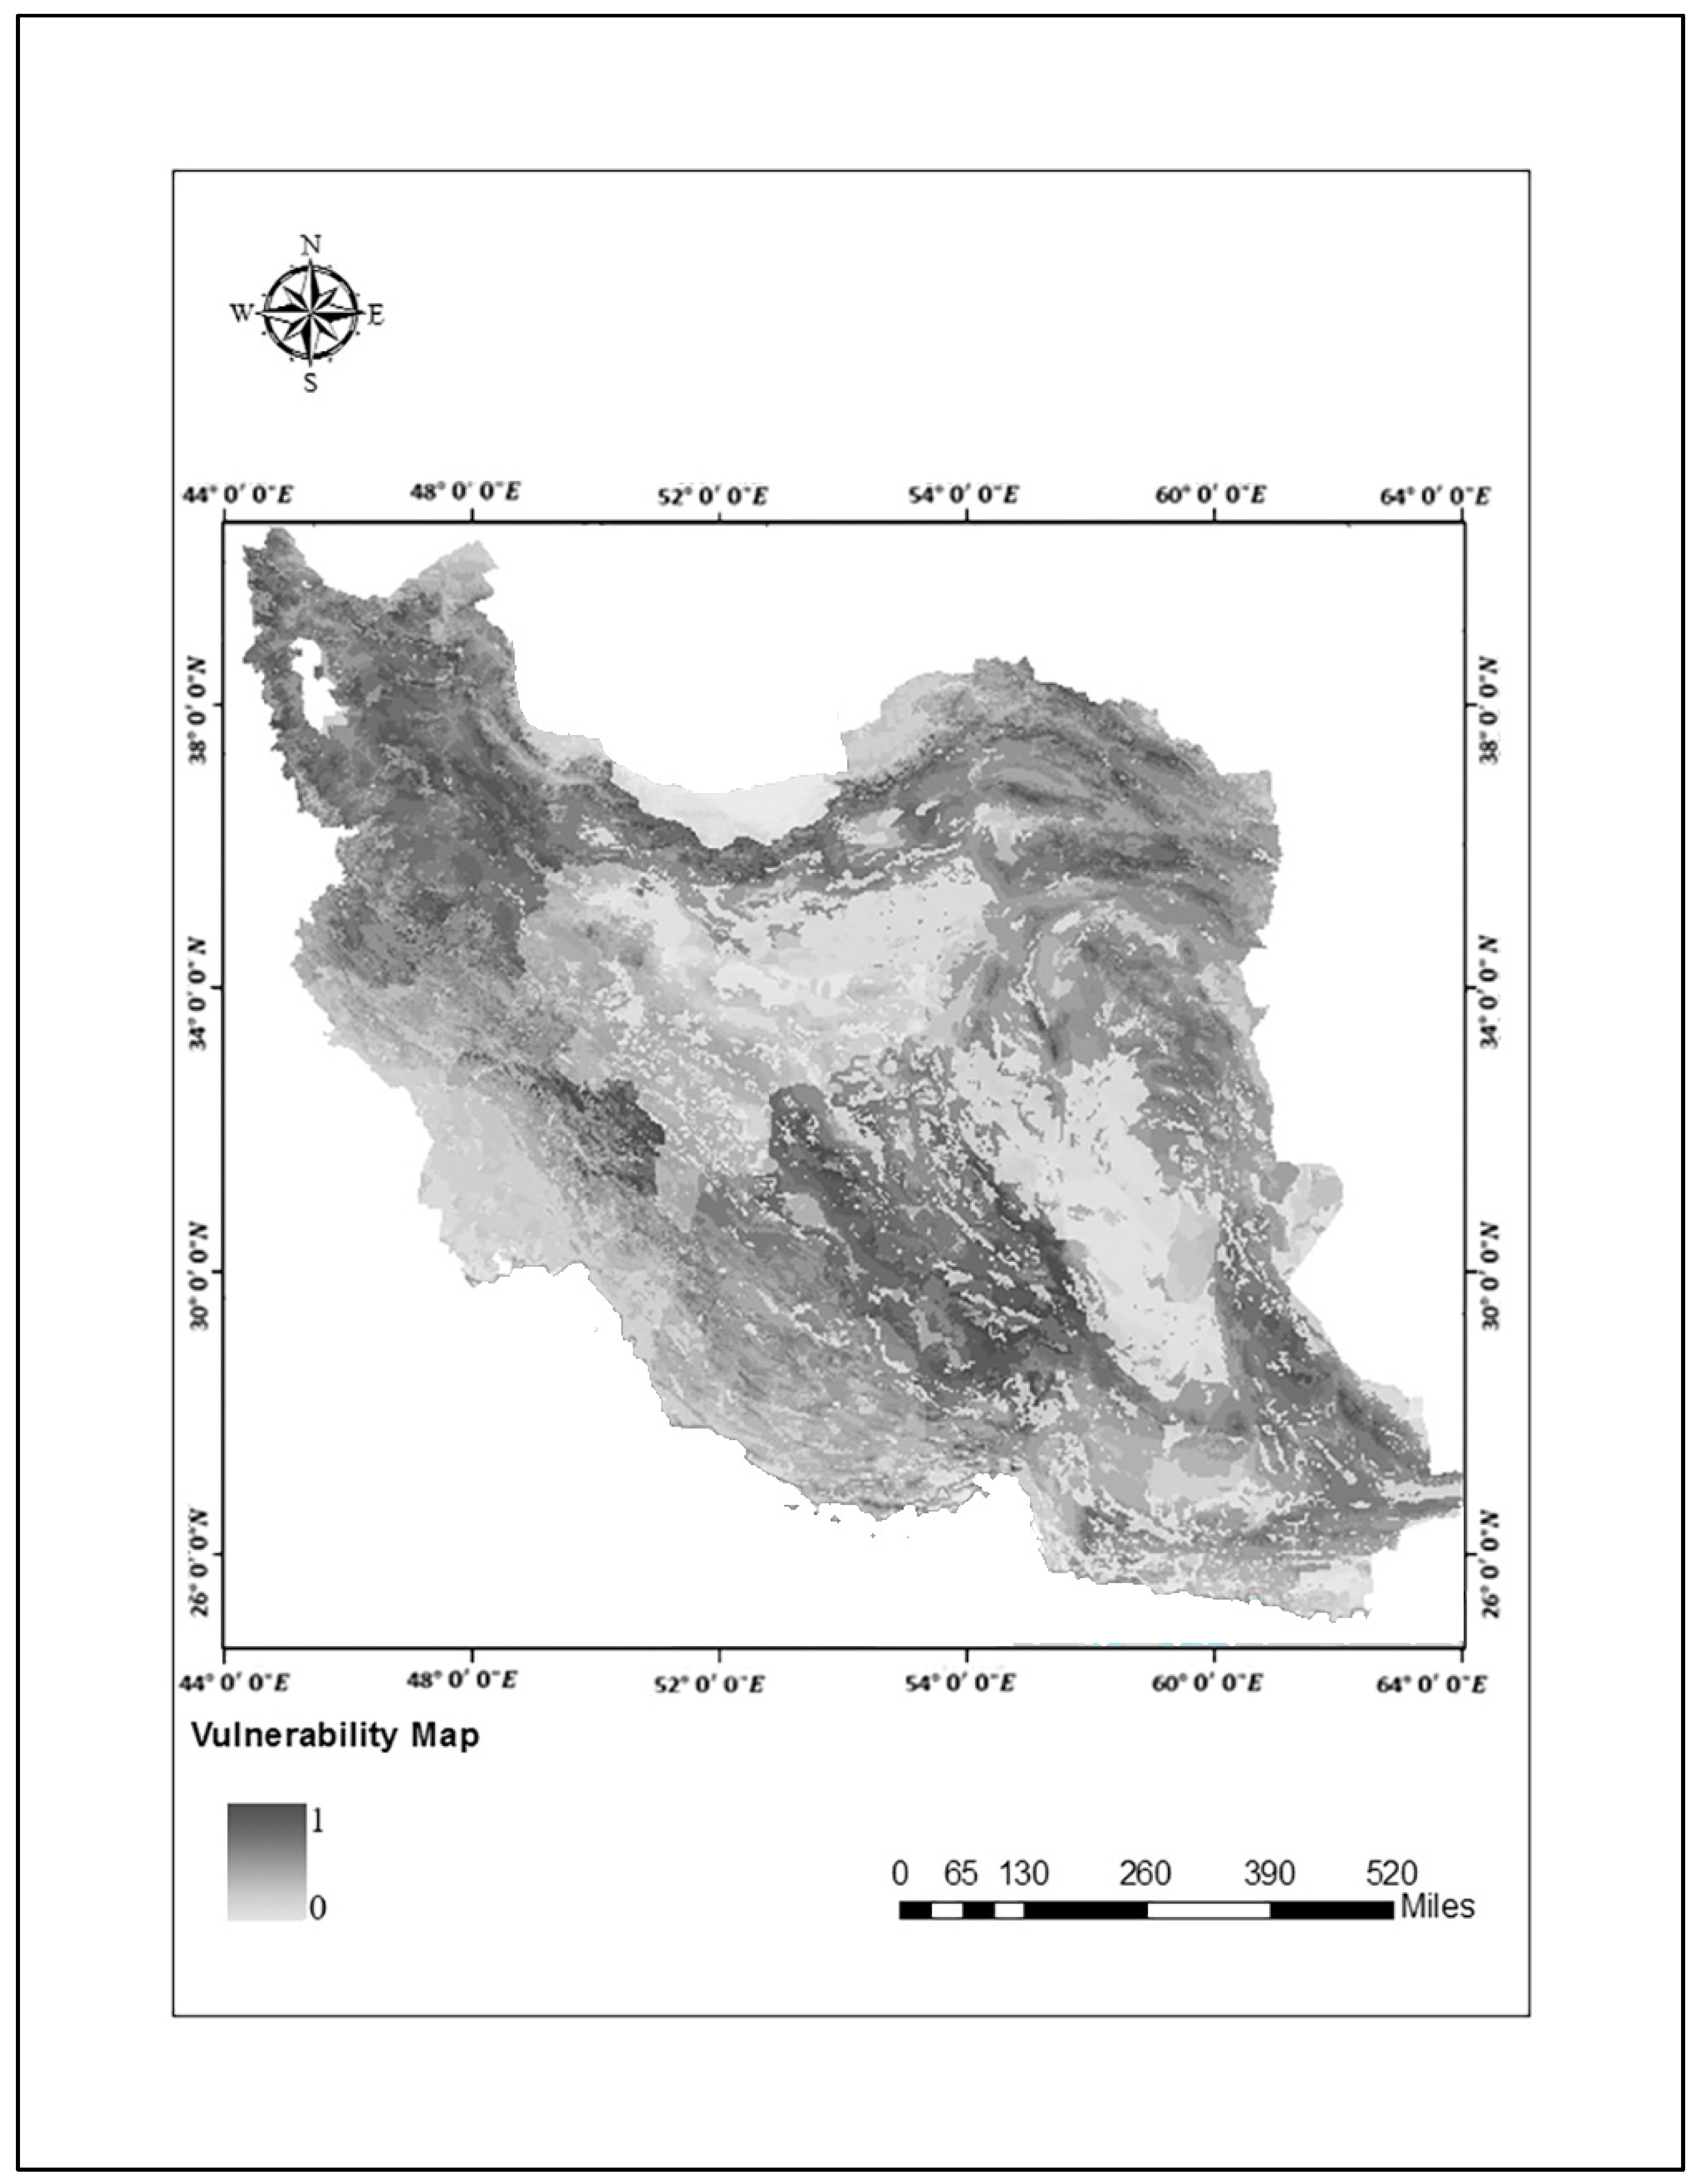
3.2. Vulnerability Assessment (VA)
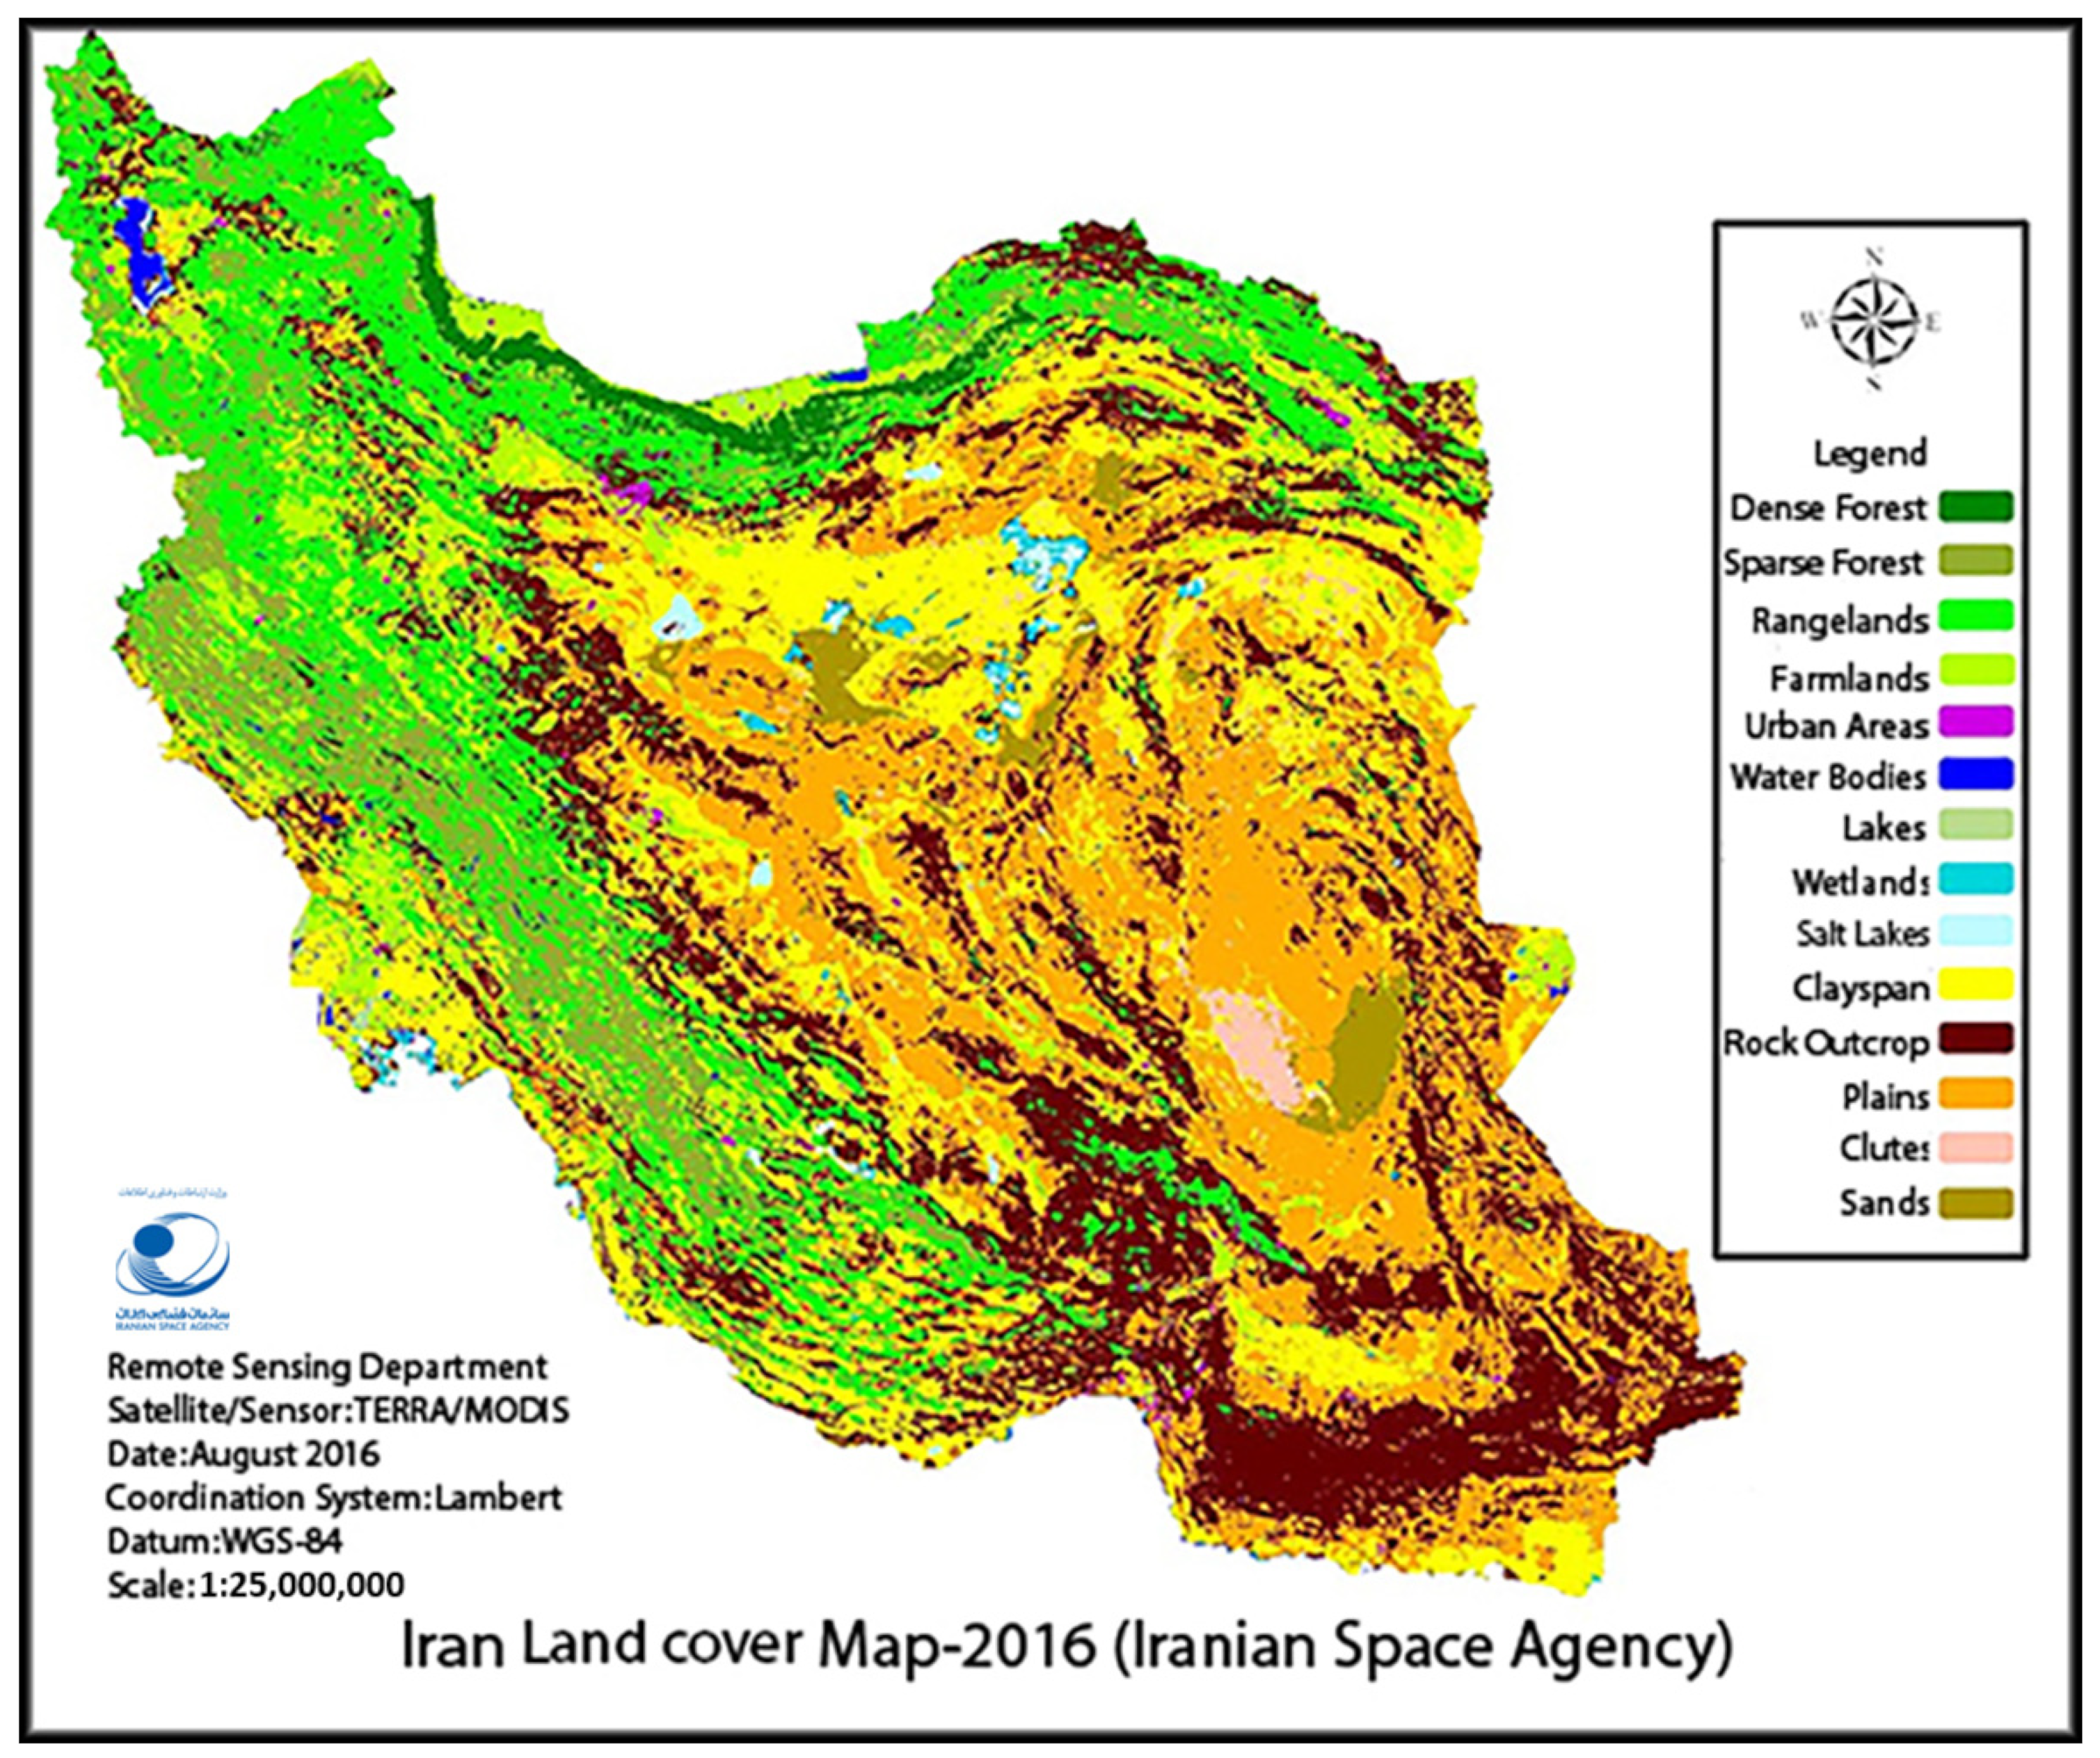
3.2.1. Land Use Map
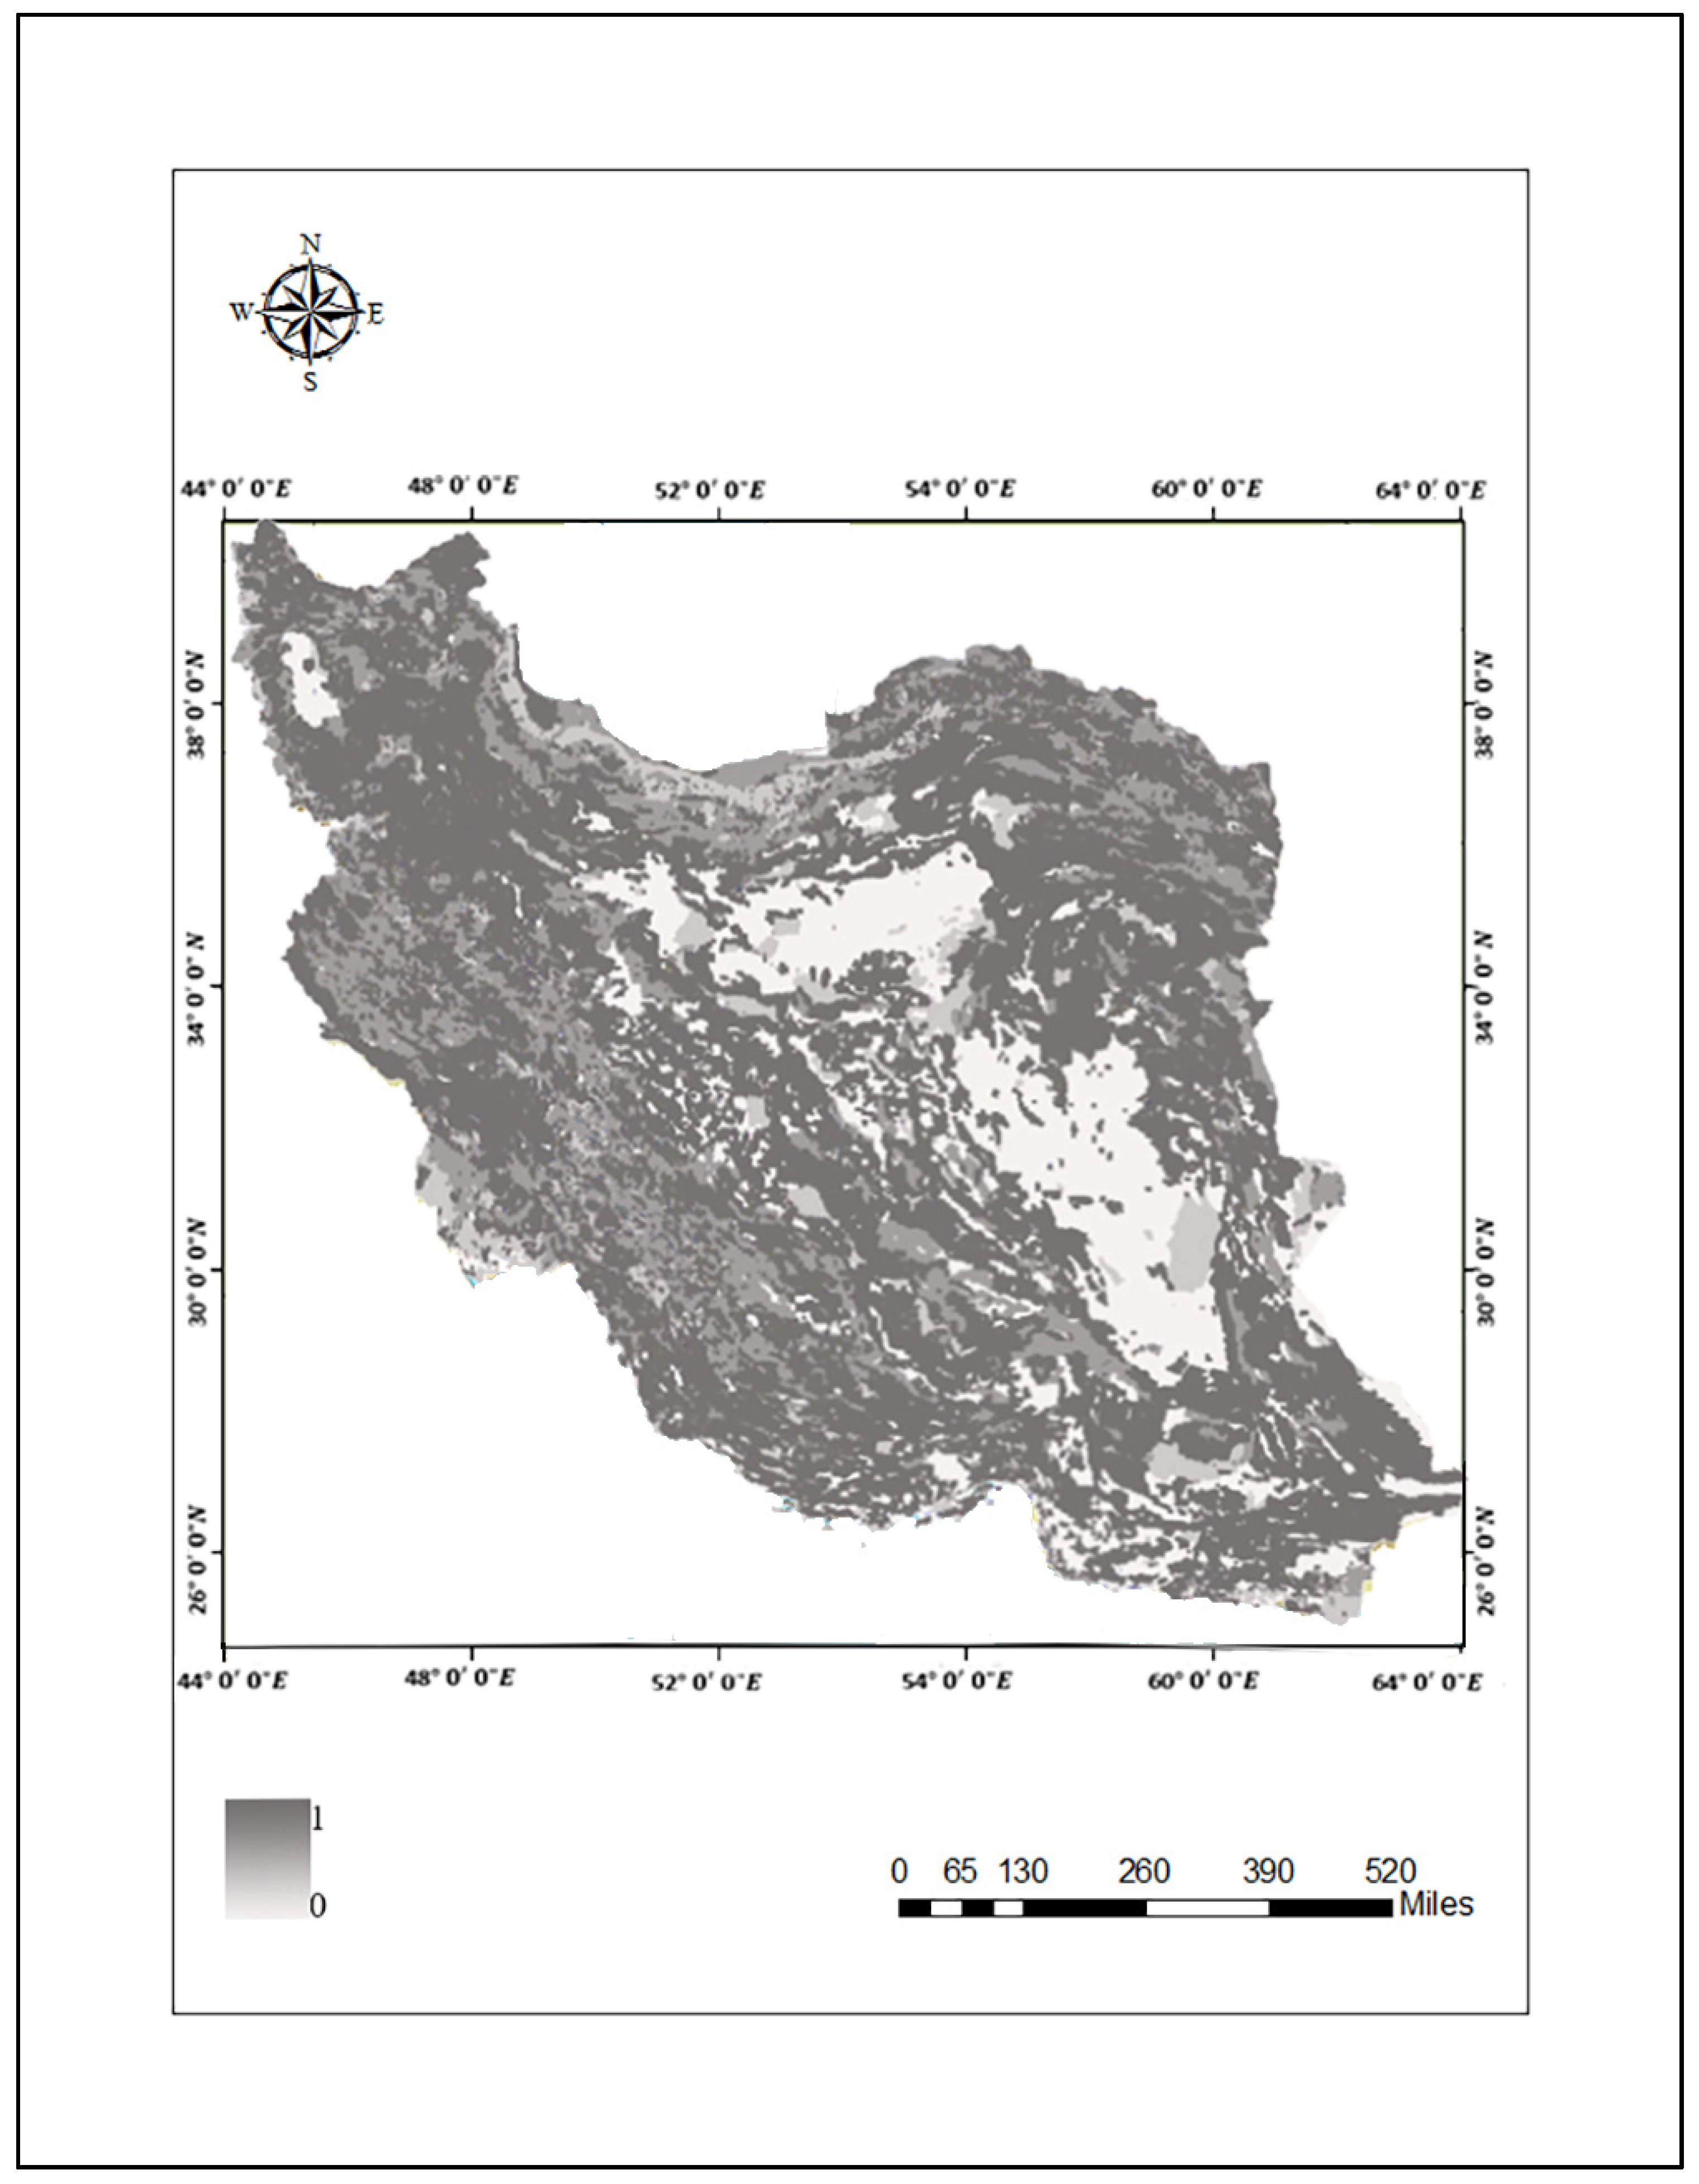
3.2.2. Slope Map
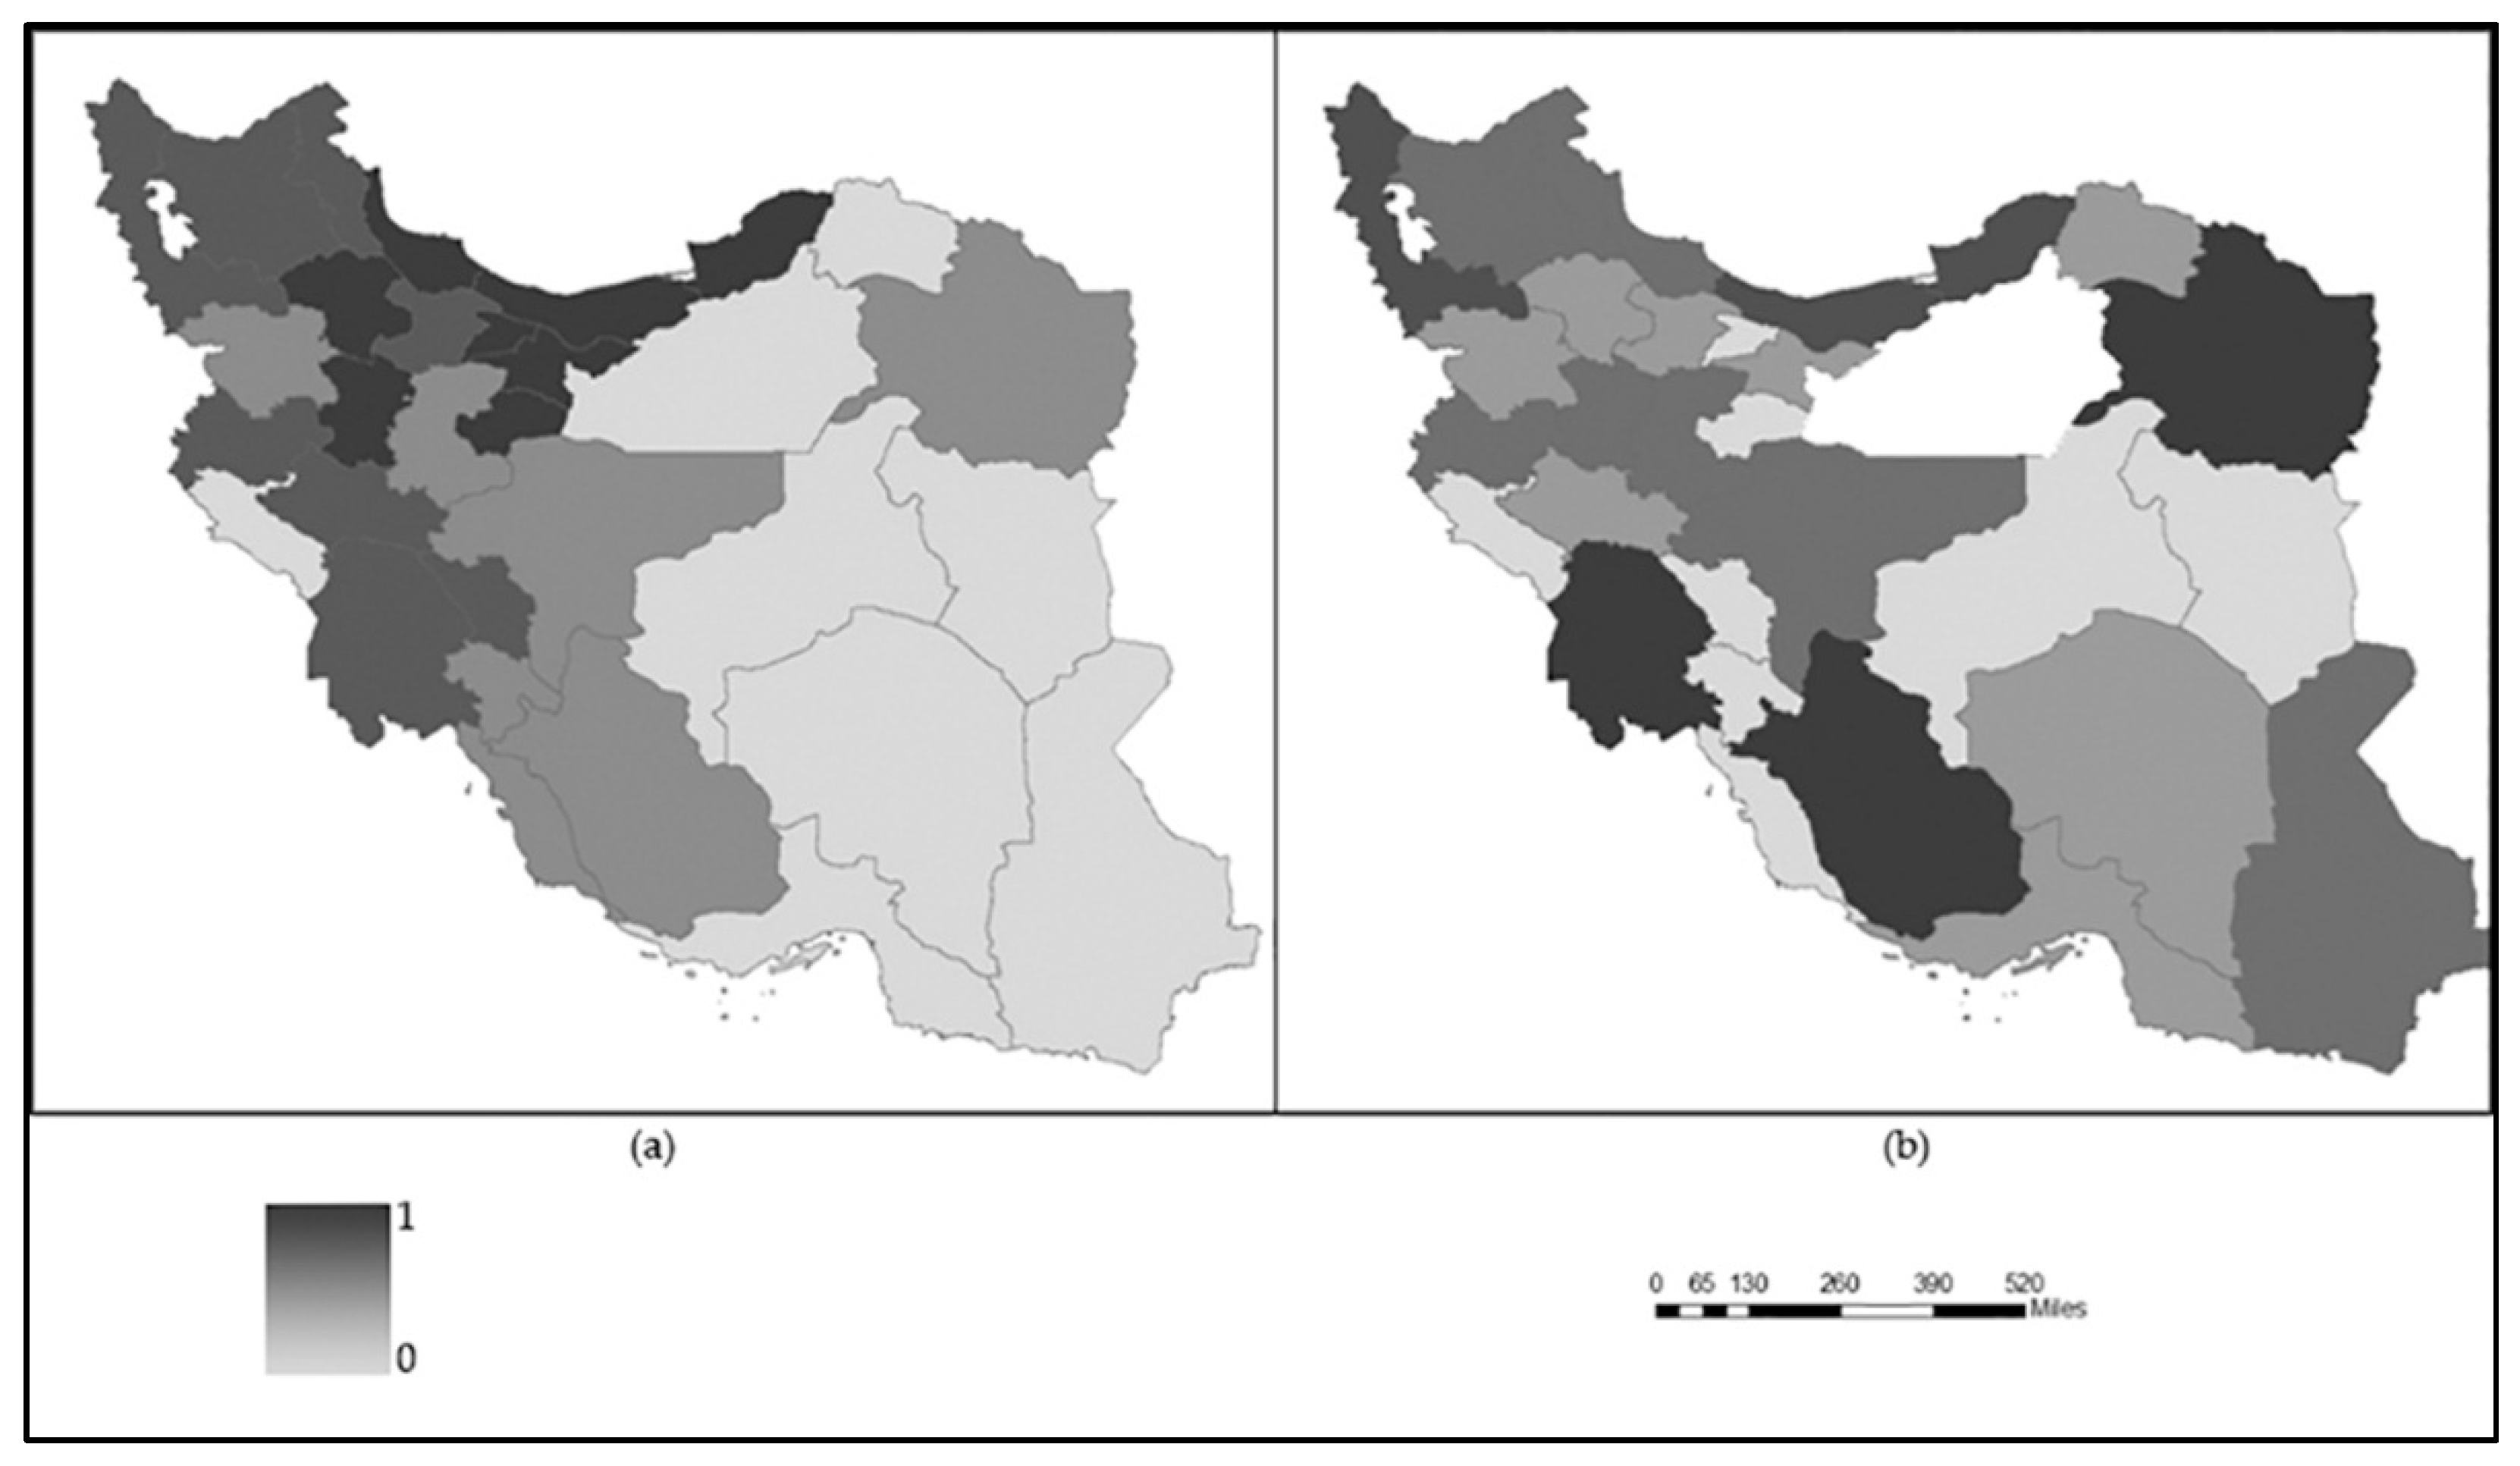
3.3. Exposure Mapping
3.3.1. Population Density Map
3.3.2. Map of Irrigated Farms Percentage
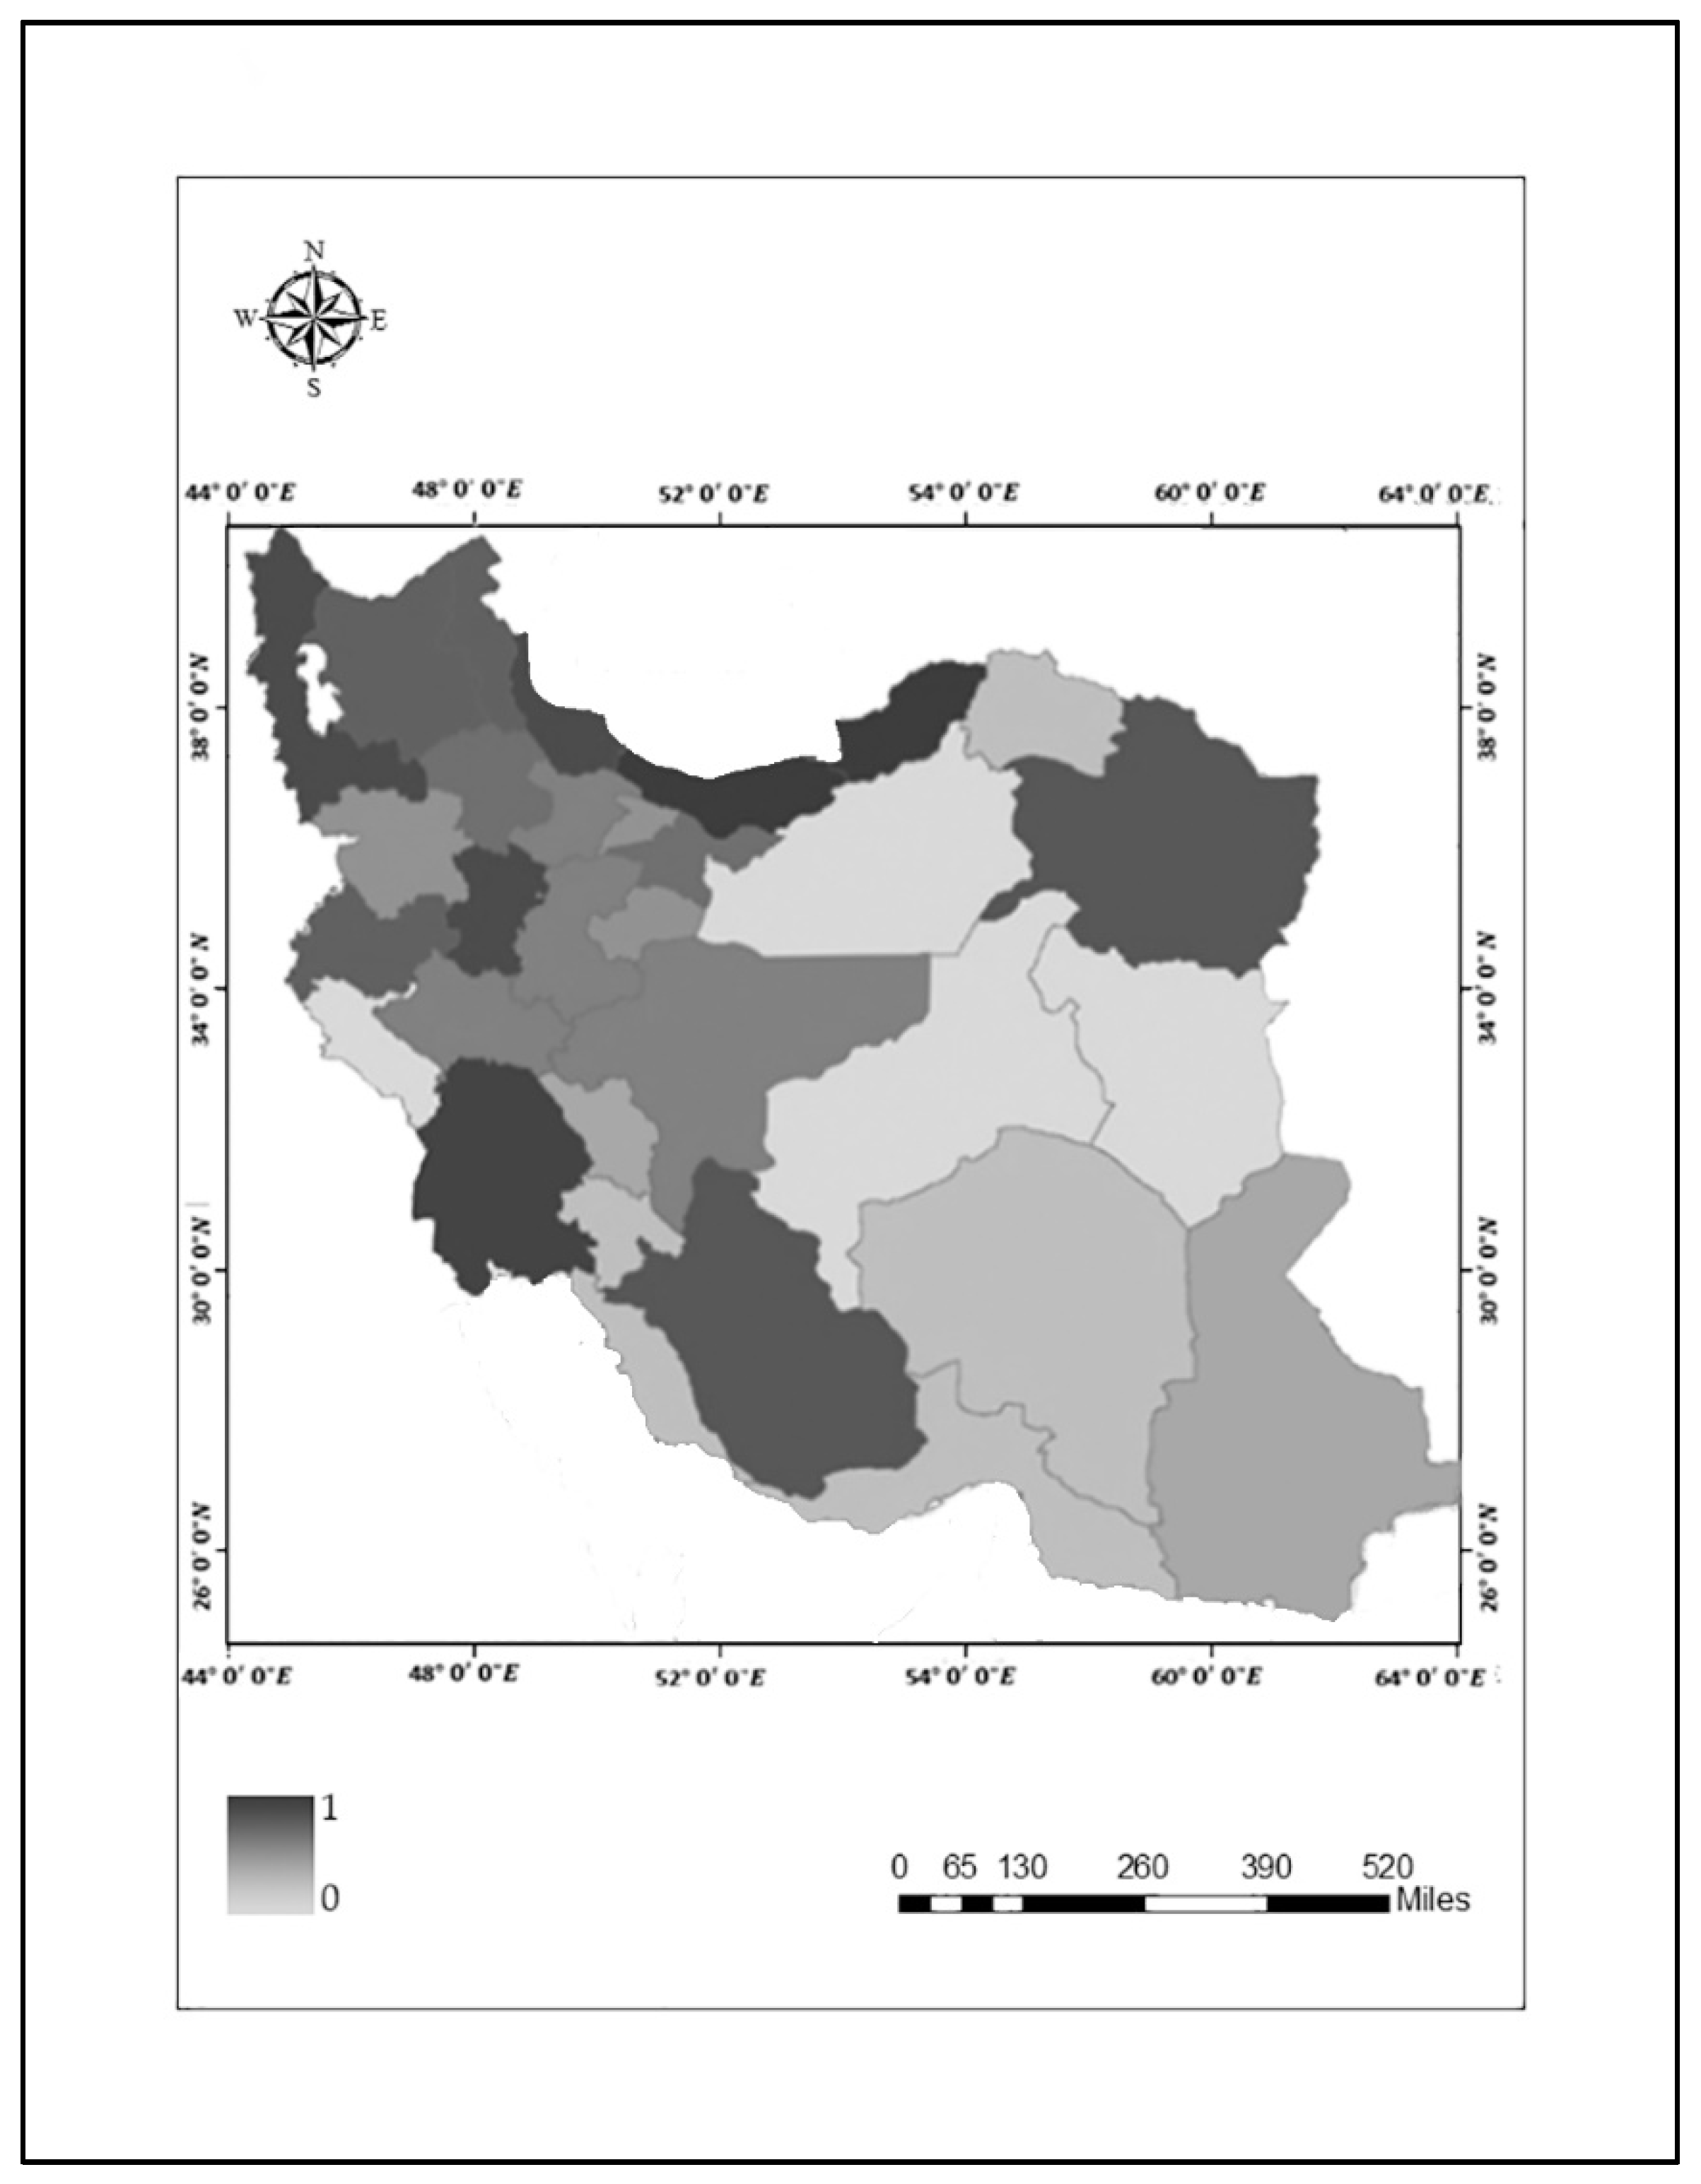
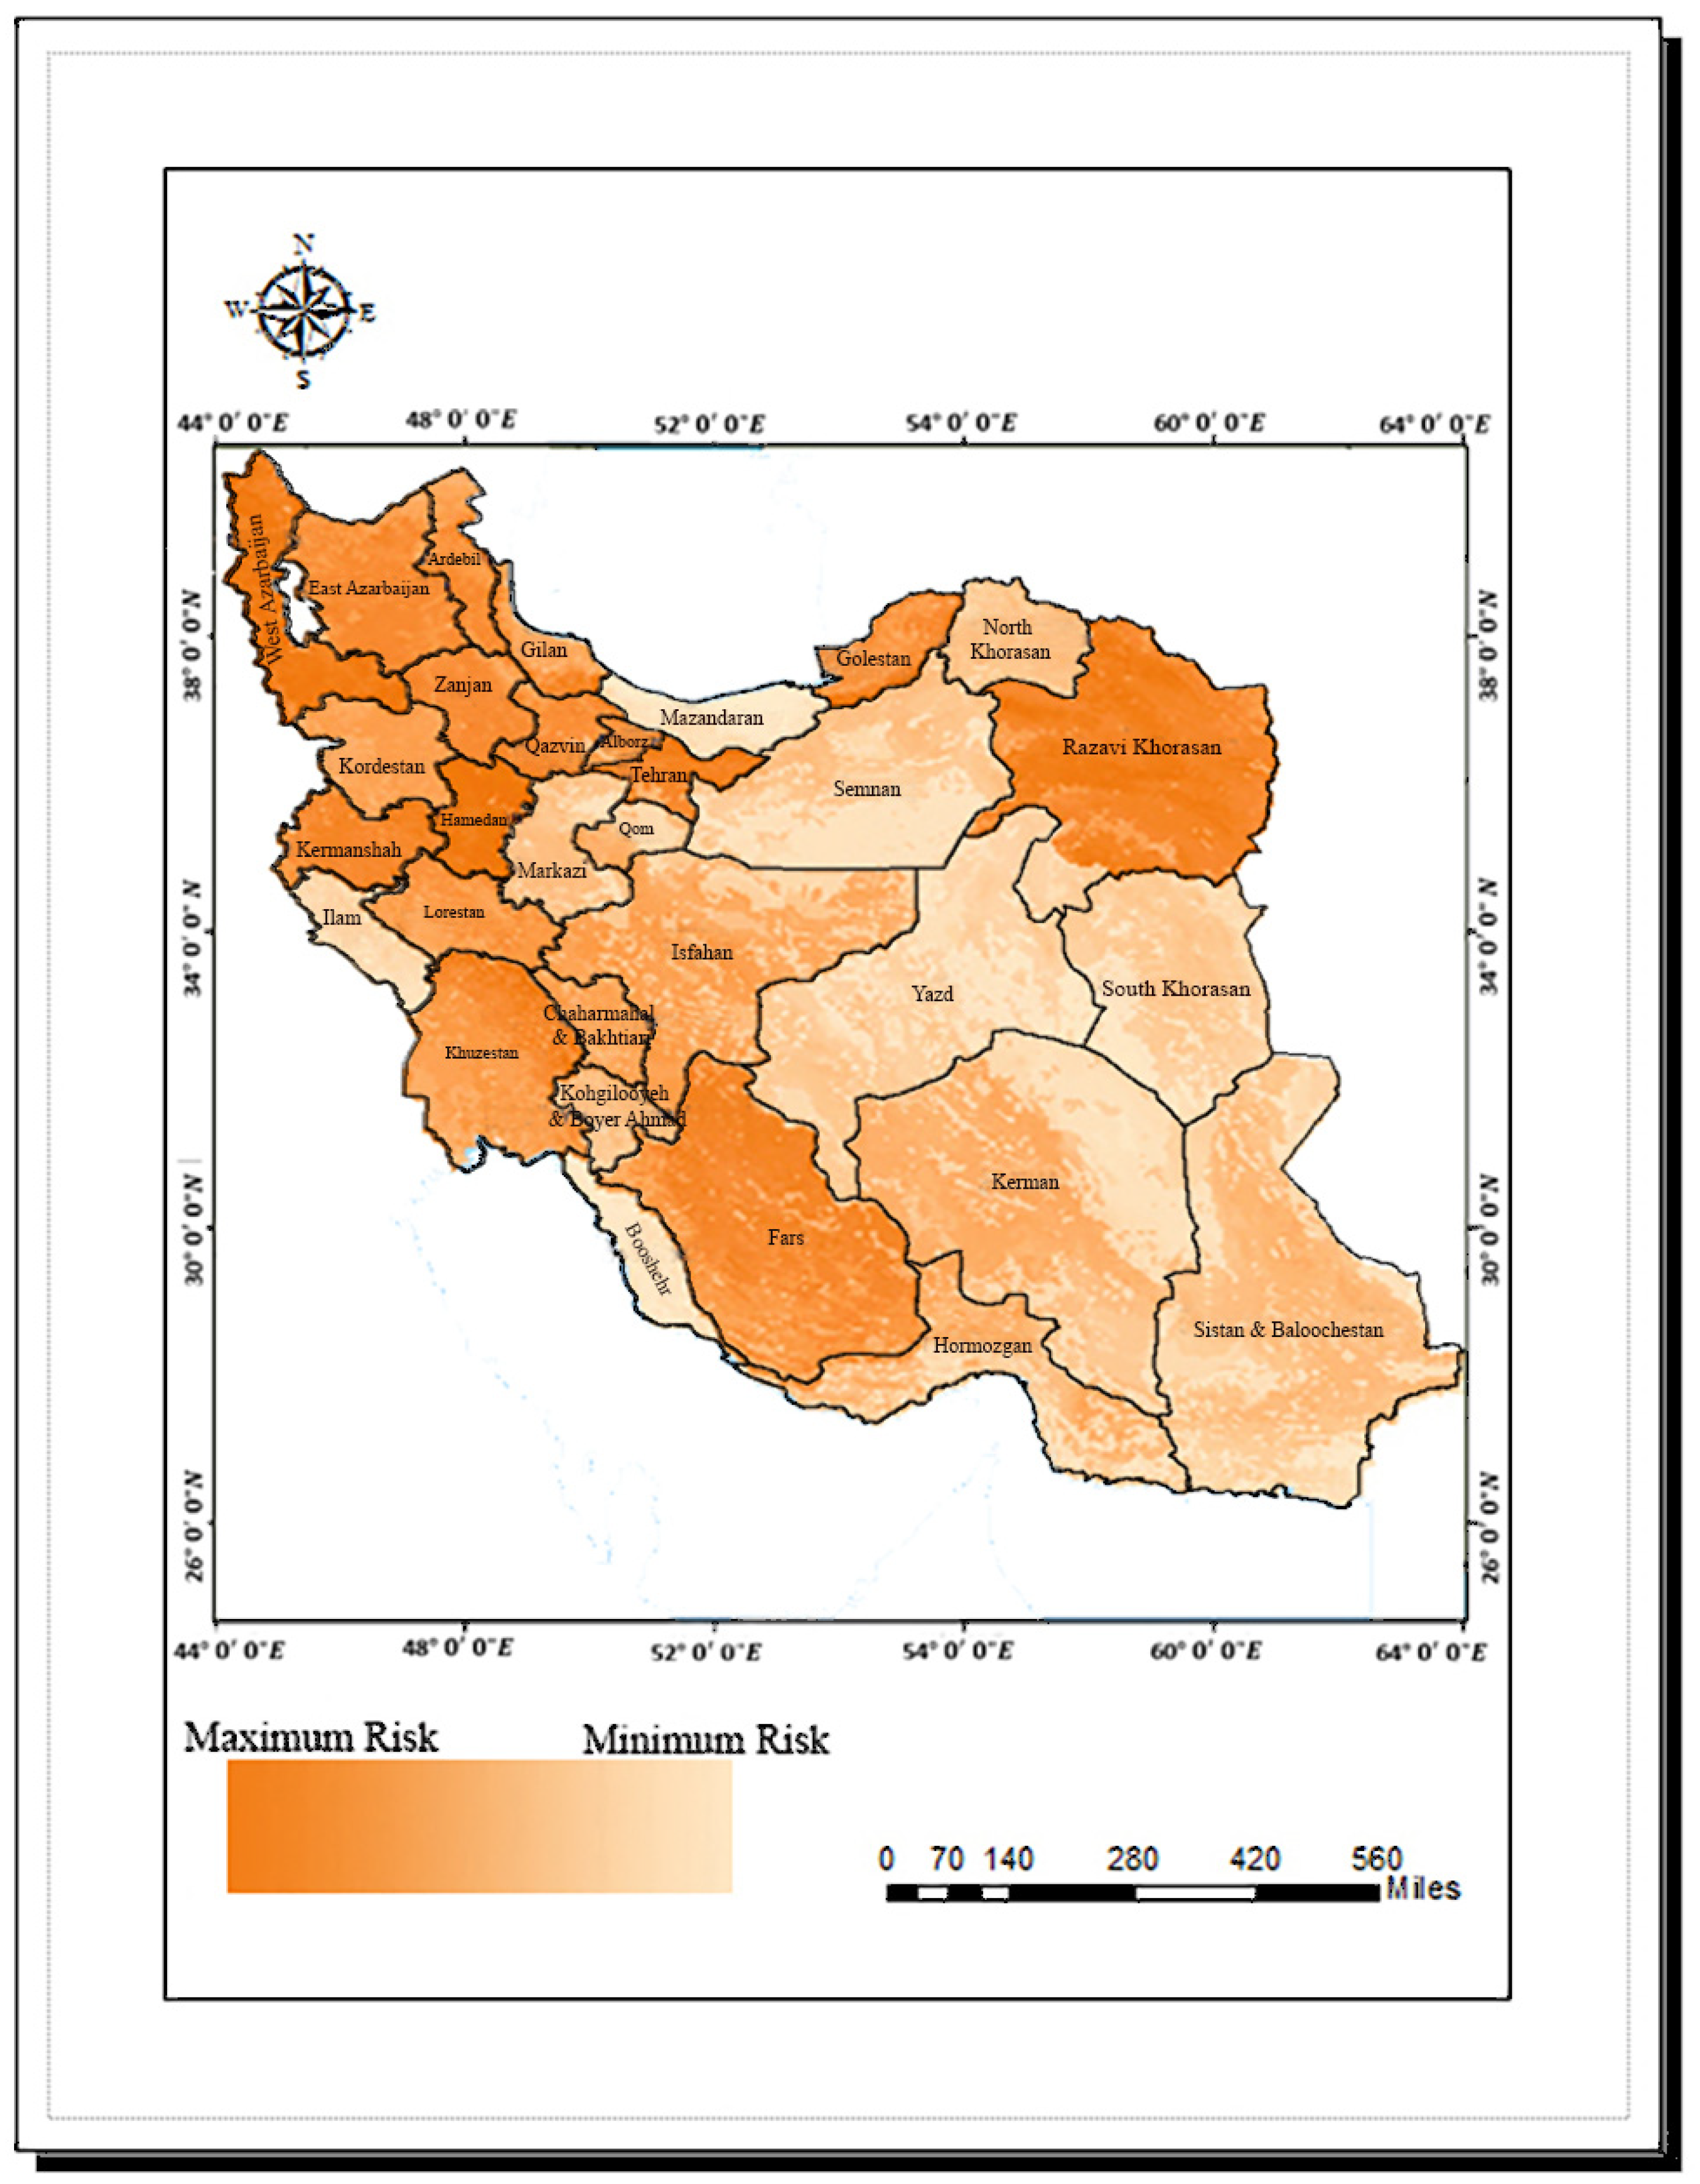
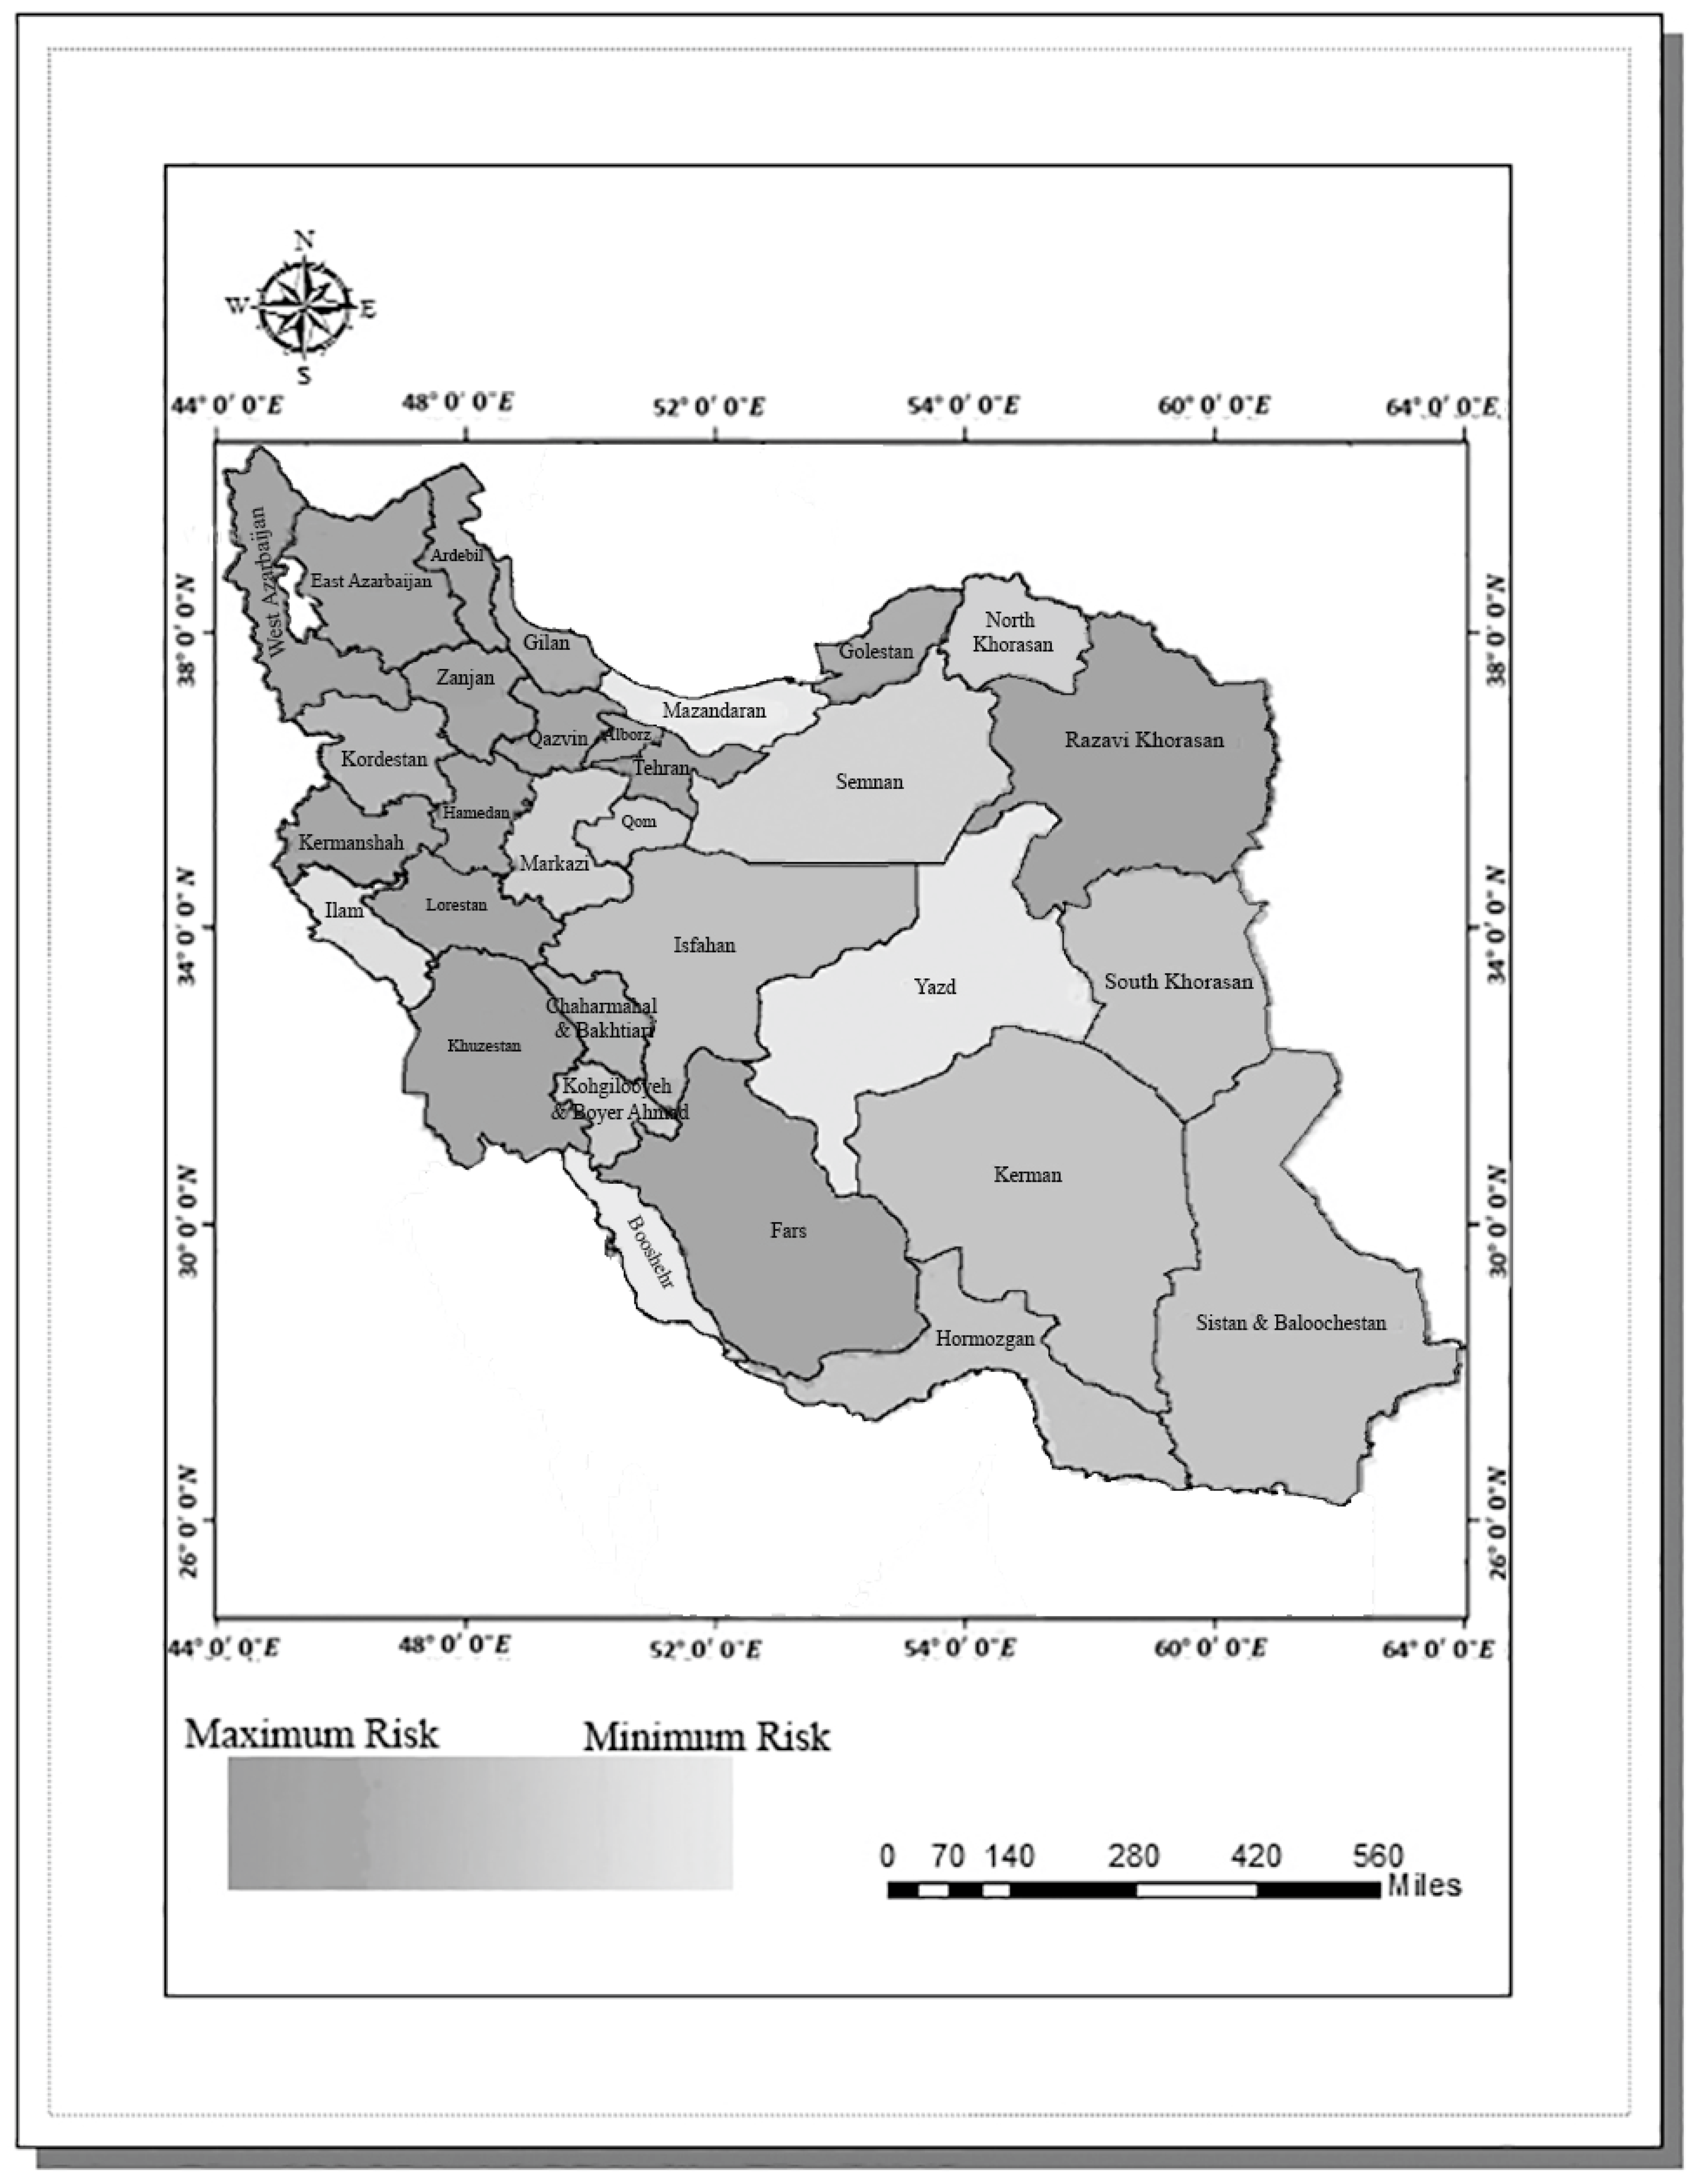
3.4. Risk Map
4. Discussion
5. Conclusions
Author Contributions
Funding
Conflicts of Interest
References
- Wilhite, D.A. Drought as a Natural Hazard: Concepts and Definitions. Drought Glob. Assess. 2000, 1, 3–18. [Google Scholar]
- Walter, J. Focus on Community Resilience. World Disasters Report. 2004. Available online: http://lib.riskreductionafrica.org/handle/123456789/1067 (accessed on 21 September 2021).
- Ding, Y.; Hayes, M.J.; Widhalm, M. Measuring Economic Impacts of Drought: A Review and Discussion. Disaster Prev. Manag. 2011, 20, 434–446. [Google Scholar] [CrossRef]
- Alston, M.; Kent, J. Social Impacts of Drought: A Report to NSW Agriculture; Centre for Rural Social Research, Charles Sturt University: Bathurst, Australia, 2004. [Google Scholar]
- Aslin, H.; Russel, J. Social Impacts of Drought: Review of Literature; Australian Government, Bureau of Rural Sciences: Canberra, Australia, 2008.
- Ansari Amoli, A.; Sadeghi Naeini, A.; Ravan, S.H. Effective Use of Space-Based Information to Monitor Disasters and Its Impacts. Lessons Learnt from Drought in Iran, United Nations SPIDER Booklet Series: Vienna, Austria, 2015.
- Wilhite, D.A. Combating Drought through Preparedness. Nat. Resour. Forum 2002, 26, 275–285. [Google Scholar] [CrossRef]
- Tadesse, T. Strategic Framework for Drought Risk Management and Enhancing Resilience in Africa. In Proceedings of the African Drought Conference 2016 Drought Risk Management and Enhancing Resilience in Africa Country Club and Resort, Windhoek, Namibia, 15–19 August 2016. [Google Scholar]
- Gedif, B.; Hadish, L.; Addisu, S.; Suryabhagavan, K.V. Drought Risk Assessment using Remote Sensing and GIS: The Case of Southern Zone, Tigray Region, Ethiopia. J. Nat. Sci. Res. 2014, 4, 23. [Google Scholar]
- Shiau, J.T.; Modarres, R. Copula-Based Drought Severity-Duration-Frequency Analysis in Iran. Meteorol. Appl. 2009, 16, 481–489. [Google Scholar] [CrossRef]
- Belal, A.A.; El-Ramady, H.R.; Elsayed, S.M.; Saleh, A.M. Drought Risk Assessment Using Remote Sensing and GIS Techniques. Arab. J. Geosci. 2012, 7, 35–53. [Google Scholar] [CrossRef]
- Khubaib Abuzar, M.; Mahmood, S.A.; Sarwar, F.; Rukya Saleem, A.; Khubaib, N.; Hamid Malik, A.; Khalil, T.; Shaista, S. Drought Risk Assessment Using GIS and Remote Sensing: A Case Study of District Khushab, Pakistan. Int. J. Econ. Environ. Geol. 2019, 10, 48–56. [Google Scholar]
- Choi, H.A.; Lee, W.K.; Kwak, H.B.; Choi, S.H.; Byun, J.G.; Yoo, S.J.; Cui, G. Climate Change Vulnerability Assessment Based on Spatio-Temporal Information. J. Korea Spat. Inform. 2009, 11, 63–69. (In Korean) [Google Scholar]
- Wu, D.; Tan, D.H.; Yang, G.Y.; Wang, X.G.; Xiao, W.H.; Zhang, H.T. Assessment on Agricultural Drought Vulnerability in the Yellow River Basin Based on a Fuzzy Clustering Iterative Model. Nat. Hazards 2013, 67, 919–936. [Google Scholar] [CrossRef]
- Jia, H.; Chen, F.; Zhang, J.; Du, E. Vulnerability Analysis to Drought Based on Remote Sensing Indexes. Int. J. Environ. Res. Public Health 2020, 17, 7660. [Google Scholar] [CrossRef]
- Obrien, L.V.; Berry, H.L.; Coleman, C.; Hanigan, I.C. Drought as a Mental Health Exposure. Environ. Res. 2014, 131C, 181–187. [Google Scholar] [CrossRef] [PubMed]
- Dabanli, I. Drought Risk Assessment by Using Drought Hazard and Vulnerability Indexes. Nat. Hazards Earth Syst. Sci. Discuss. 2018, 1–15. [Google Scholar] [CrossRef]
- World Bank. Assessing Drought Hazard & Risk, Principles and Implementation Guidance; World Bank: Washington, DC, USA, 2019. [Google Scholar]
- Office of the United Nations Disaster Relief Coordinator (UNDRO). Natural Disasters and Vulnerability Analysis 1980; Report of the Expert Group Meeting; UNDRO: Geneva, Switzerland, 1980. [Google Scholar]
- Taylor, M.; Mollard, J.; Mittaz, J. Product Use Guide AVHRR FCDR; University of Reading: Reading, UK, 2019. [Google Scholar]
- Alizadeh, A. Principles of Applied Hydrology; Imam Reza University: Mashhad, Iran, 2011. [Google Scholar]
- IPCC Climate Change. The Physical Science Basis. Intergovernmental Panel on Climate Change; Cambridge University Press: Cambridge, UK, 2009; Available online: https://www.ipcc.ch/report/ar4/wg1 (accessed on 20 December 2021).
- Balgis, O.E. Mapping of Climate Change Threats and Human Development Impacts in the Arab Region, United Nations Development Programme; Arab Human Development Report (AHDR), Research Paper Series 2010; p. 51. Available online: http://www.arabstates.undp.org/content/rbas/en/home/library (accessed on 19 November 2021).
- NCCOI. Third National Communication to UNFCCC. National Climate Change Office of Iran. 2014. Available online: https://unfccc.int/sites/default/files/resource/ThirdNationalcommunicationIRAN.pdf (accessed on 14 October 2020).
- Zhang, X.; Aguilar, E.; Sensoy, S.; Melkonyan, H.; Tagiyeva, U.; Ahmed, N.; Kutaladze, N.; Rahimzadeh, F.; Taghipour, A.; Hantosh, T.H.; et al. Trends in Middle East Climate Extremes Indices During 1930–2003. J. Geophys. Res. 2005, 110, 1–12. [Google Scholar] [CrossRef]
- Rahimzadeh, F.; Asgari, A.; Fattahi, E. Variability of Extreme Temperature and Precipitation in Iran During Recent Decades. Int. J. Climatol. 2009, 29, 329–343. [Google Scholar] [CrossRef]
- IPCC. Changes in Climate Extremes and Their Impacts on the Natural Physical Environment; Intergovernmental Panel on Climate Change: Geneva, Switzerland; Cambridge University Press: Cambridge, UK, 2012; Available online: http://www.fapesp.br/eventos/2012/08/IPCC/JMarengo.pdf (accessed on 2 April 2022).
- Mansouri Daneshvar, M.R.; Ebrahimi, M.; Nejadsoleymani, H. An Overview of Climate Change in Iran: Facts and Statistics. Environ. Syst. Res. 2019, 8, 7. [Google Scholar] [CrossRef]
- National Institute of Standards and Technology (NIST). Guide for Conducting Risk Assessments; NIST Special Publication (SP) 800-30; Revision 1; NIST: Gaithersburg, MD, USA, 2021. [Google Scholar]
- Institute for Environment and Human Security (UNU-EHS); Witting, M. Detecting Disaster Root Causes: A Framework and an Analytic Tool for Practitioners; German Committee for Disaster Reduction: Bonn, Germany, 2012. [Google Scholar]
- United States Geological Survey. Available online: https://www.usgs.gov/faqs/what-causes-drought?qt-news_science_products=0#qt-news_science_products (accessed on 21 April 2022).
- Usman, R.; Olorunfemi, F.; Awotayo, G.; Tunde, A.M.; Usman, B.A. Disaster Risk Management and Social Impact Assessment: Understanding Preparedness. Environ. Sci. 2013, 259–274. [Google Scholar]
- Henry Campbell Black, M. A Black’s Law Dictionary, 11th ed.; Thomson Reuters Publisher: Toronto, ON, Canada, 2019. [Google Scholar]
- Canadaian Center for Occupational Health and Safety. Available online: https://www.ccohs.ca/oshanswers/hsprograms/hazard_risk.html (accessed on 27 January 2022).
- Jackson, L.E. Encylopedia of Natural Hazards. Available online: https://link.springer.com/referenceworkentry/10.1007%2F978-1-4020-4399-4_147 (accessed on 25 February 2022).
- Rouse, J.W.; Haas, R.H.; Schell, J.A.; Deering, D.W. Monitoring Vegetation Systems in the Great Plains with ERTS. In Third Earth Resources Technology Satellite—1 Syposium; Technical Presentations, NASA SP-351; NASA: Washington, DC, USA, 1974; Volume I, pp. 309–317. [Google Scholar]
- Pettorelli, N. Normalized Difference Vegetation Index; Oxford University Press: Oxford, UK, 2013. [Google Scholar]
- Um, M.J.; Kim, Y.; Park, D. Evaluation and Modification of the Drought Severity Index (DSI) in East Asia. Remote Sens. Environ. 2018, 209, 66–76. [Google Scholar] [CrossRef]
- Twigg, J. Disaster Risk Reduction. Good Practice Review 9 2015, New Edition. Available online: http://bvpad.indeci.gob.pe/doc/pdf/esp/doc2601/doc2601-contenido.pdf (accessed on 11 February 2022).
- United Nations Disaster Risk Reduction (Former UNISDR). Disaster Risk Reduction: Understanding Risk Documents and Publications; United Nations Office for Disaster Risk Reduction: Geneva, Switzerland, 2013. [Google Scholar]
- United Nations Disaster Risk Reduction (Former UNISDR). Terminology on Disaster Risk Reduction; United Nations Office for Disaster Risk Reduction: Geneva, Switzerland, 2009. [Google Scholar]
- Meza, I.; Hagenlocher, M.; Naumann, G.; Vogt, J.; Frischen, J. Drought Vulnerability Indicators for Global-Scale Drought Risk Assessment; Global Expert Survey Results Report 2019. Available online: https://publications.jrc.ec.europa.eu/repository/handle/JRC117546 (accessed on 21 March 2022).
- Tsesmelis, D.E.; Oikonomou, P.D.; Vasilakou, C.G.; Skondras, N.A.; Fassouli, V.; Alexandris, S.G.; Grigg, N.S.; Karavitis, C.A. Assessing Structural Uncertainty Caused by Different Weighting Methods on the Standardized Drought Vulnerability Index (SDVI); Springer: Berlin/Heidelberg, Germany, 2019. [Google Scholar]
- United Nations Disaster Risk Reduction (Former UNISDR). Living with Risk: A Global Review of Disaster Reduction Initiatives; United Nations Office for Disaster Risk Reduction: Geneva, Switzerland, 2004. [Google Scholar]
- Shahid, S.; Behrawan, H. Drought risk assessment in the western part of Bangladesh. Nat. Hazards 2008, 46, 391–413. [Google Scholar] [CrossRef]
- Office of the United Nations Disaster Relief Coordinator (UNDRO). Natural Disasters and Vulnerability Analysis 1990; Report of the Expert Group Meeting 1990; UNDRO: Geneva, Switzerland, 1990. [Google Scholar]
- Nama, W.; Hayesa, M.J.; Svobodaa, M.D.; Tadessea, T. Drought Hazard Assessment in the Context of Climate Change for South Korea. Agric. Water Manag. 2015, 160, 106–117. [Google Scholar] [CrossRef]
- Alrubaye, A.A.; Merheg, A.O. Drought Risk Assessment Using Remote Sensing Data Case Study: The Eastern North Region in Syria. J. Int. Acad. Res. Multidsciplinary 2015, 3, 11. [Google Scholar]
- Abuzar, M.K.; Mahmood, S.A.; Sarwar, F.; Saleem, A.R.; Khubaib, N.; Malik, A.H.; Khalil, T.; Shaista, S. Drought Risk Assessment in the Khushab Region of Pakistan Using Satellite Remote Sensing and Geospatial Methods. Int. J. Econ. Environ. Geol. (IJEEG) 2019, 10, 48–56. [Google Scholar]
- Alamdarloo, E.H.; Khosravi, H.; Nasabpour, S.; Gholami, A. Assessment of drought hazard, vulnerability and risk in Iran using GIS techniques. J. Arid Land 2020, 12, 984–1000. [Google Scholar] [CrossRef]
- Khademipour, G.; Anari, M.S.; Moghadam, M.N.; Masoudi, A.; Baghini, R.J. Comprehensive Assessment and Zonation of Drought Risk and Vulnerability in Kerman Province. Health Emergencies Disasters Q. 2018, 3, 113–119. [Google Scholar] [CrossRef][Green Version]
- Keshavarz, M.; Karami, E. Farmers’ Pro-Environmental Behavior under Drought: Application of Protection Motivation Theory. J. Arid Environ. 2016, 127, 128–136. [Google Scholar] [CrossRef]
- Neisi, M.; Bijani, M.; Abbasi, E.; Mahmoudi, H.; Azadi, H. Analyzing Farmers’ Drought Risk Management Behavior: Evidence from Iran. J. Hydrol. 2020, 590, 125243. [Google Scholar] [CrossRef]
- Azadi, Y.; Yazdanpanah, M.; Forozani, M.; Mahmoudi, M. Investigating the Adaptive Behavior of Dryland Wheat Growers Facing Climate Change in Kermanshah County: By Protection Motivation Theory. J. Agroecol. 2017, 7, 94–106. (In Persian) [Google Scholar]
- Delfiyan, F.; Yazdanpanah, M.; Forozani, M. Investigating Farmers’ Behavior Management in Drought Period as Prevention Responses: The Case of Dehloran District. J. Spacial Anal. Environ. Hazards 2018, 4, 72–92. (In Persian) [Google Scholar]
- Delfiyan, F.; Yazdanpanah, M.; Forouzani, M.; Yaghobi, J. Farmers’ Adaptation to Drought Risk through Farm—Level Decisions: The Case of Farmers in Dehloran County, Southwest of Iran. Clim. Dev. 2020, 13, 152–163. [Google Scholar] [CrossRef]
- GHANIAN, M.; Ghoochani, M.O.; Dehghanpour, M.; Taqipour, M.; Taheri, F.; Cotton, M. Understanding Farmers’ Climate Adaptation Intention in Iran: A Protection Motivation Extended Model. Land Use Policy 2020, 94, 104553. [Google Scholar] [CrossRef]
- Orimoloye, I.R.; Belle, J.A.; Ololade, O.O. Drought Disaster Monitoring Using MODIS Derived Index for Drought Years: A Space-Based Information for Ecosystems and Environmental Conservation. J. Environ. Manag. 2021, 284, 112028. [Google Scholar] [CrossRef]


| Severity Categories | ||||||||
|---|---|---|---|---|---|---|---|---|
| Year | NDVI (Mean) | Normal Distributed NDVI | (−3) to (−2) | (−2) to (−1) | (−1) to (0) | (0) to (+1) | (+1) to (+2) | (+2) to (+3) |
| 1 | X1 | Xn1 | * | |||||
| 2 | X2 | Xn2 | * | |||||
| 3 | X3 | Xn3 | * | |||||
| 4 | X4 | Xn4 | * | |||||
| 5 | X5 | Xn5 | * | |||||
| 6 | X6 | Xn6 | * | |||||
| 7 | X7 | Xn7 | * | |||||
| 8 | X8 | Xn8 | * | |||||
| 9 | X9 | Xn9 | * | |||||
| 10 | X10 | Xn10 | * | |||||
| Frequency | 1 | 1 | 2 | 3 | 2 | 1 | ||
| Probability | 0.1 | 0.1 | 0.2 | 0.3 | 0.2 | 0.1 | ||
| Percentage | 10 | 10 | 20 | 30 | 20 | 10 | ||
| Weight | 6 | 5 | 4 | 3 | 2 | 1 | ||
| Channel | AVHRR/3 |
|---|---|
| 1 | 0.58–0.68 µm (VIS) |
| 2 | 0.725–1.1 µm (NIR) |
| 3A | 1.58–1.64 µm (NIR) |
| 3B | 3.55–3.93 µm (MIR) |
| 4 | 10.30–11.30 µm (TIR) |
| 5 | 11.5–12.5 µm (TIR) |
| Year | Severity Categories | |||||||
|---|---|---|---|---|---|---|---|---|
| NDVI (Mean) | Normal NDVI | (−3) to (−2) | (−2) to (−1) | (−1) to (0) | (0) to (+1) | (+1) to (+2) | (+2) to (+3) | |
| 1986 | 0.19 | 0.59 | * | |||||
| 1987 | 0.17 | 0.50 | * | |||||
| 1988 | 0.22 | 0.74 | * | |||||
| 1989 | 0.28 | 1.03 | * | |||||
| 1990 | 0.27 | 0.98 | * | |||||
| 1991 | 0.24 | 0.84 | * | |||||
| 1992 | 0.17 | 0.50 | * | |||||
| 1993 | 0.19 | 0.59 | * | |||||
| 1994 | 0.14 | 0.35 | * | |||||
| 1995 | 0.12 | 0.25 | * | |||||
| 1996 | 0.02 | −0.21 | * | |||||
| 1997 | 0.48 | 2.02 | * | |||||
| 1998 | 0.03 | −0.18 | * | |||||
| 1999 | −0.21 | −1.36 | * | |||||
| 2000 | 0.07 | 0.02 | * | |||||
| 2001 | 0.38 | 1.50 | * | |||||
| 2002 | 0.27 | 1.00 | * | |||||
| 2003 | 0.29 | 1.08 | * | |||||
| 2004 | −0.17 | −1.16 | * | |||||
| 2005 | −0.11 | −0.85 | * | |||||
| 2006 | −0.19 | −1.24 | * | |||||
| 2007 | −0.30 | −1.79 | * | |||||
| 2008 | −0.22 | −1.40 | * | |||||
| 2009 | −0.23 | −1.46 | * | |||||
| 2010 | −0.06 | −0.64 | * | |||||
| 2011 | 0.13 | 0.31 | * | |||||
| 2012 | −0.18 | −1.23 | * | |||||
| 2013 | 0.08 | 0.07 | * | |||||
| 2014 | 0.12 | 0.25 | * | |||||
| 2015 | 0.13 | 0.29 | * | |||||
| 2016 | −0.21 | −1.37 | * | |||||
| Average | 0.07 | |||||||
| Standard Deviation | 0.21 | |||||||
| Frequency | 0 | 3 | 7 | 14 | 6 | 1 | ||
| Probability | 0 | 0.10 | 0.23 | 0.45 | 0.19 | 0.03 | ||
| Percentage | 0 | 10 | 23 | 45 | 19 | 3 | ||
| Weight | 6 | 5 | 4 | 3 | 2 | 1 | ||
| Hazard | 0 | 50 | 92 | 135 | 38 | 3 | ||
| Total Hazard | 318 | |||||||
| Provinces | Total Hazards | Provinces | Total Hazards |
|---|---|---|---|
| Hormozgan | 361.9 | Kordestan | 347.62 |
| Hamedan | 361.9 | Kohgilooyeh | 347.62 |
| Tehran | 357.14 | Kerman | 347.62 |
| Khorasan Razavi | 357.14 | Golestan | 347.62 |
| Isfahan | 357.14 | Khuzestan | 347.62 |
| Semnan | 357.14 | Kermanshah | 347.62 |
| Lorestan | 325.38 | Yazd | 346 |
| Southern Khorasan | 325.38 | Ardebil | 346 |
| Ilam | 325.38 | Zanjan | 342.86 |
| Gilan | 325.38 | Northern Khorasan | 342.86 |
| Fars | 325.38 | East Azarbaijan | 342.86 |
| West Azarbaijan | 325.38 | Sistan & Baloochestan | 318 |
| Qazvin | 325.38 | Markazi | 328.57 |
| Shahrekord | 347.62 | Booshehr | 276 |
| Qom | 347.62 | Mazandaran | 90.48 |
| Classes | Weights (Scores) |
|---|---|
| Farmlands | 5 |
| Rangeland | 4 |
| Sparse Forest | 3 |
| Dense Forest | 2 |
| Salt Lakes | 1 |
| Sands | 1 |
| Clutes | 1 |
| Plains | 1 |
| Rock Outcrop | 1 |
| Clayspan | 1 |
| Wetlands | 1 |
| Lakes | 1 |
| Water Bodies | 1 |
| Urban Areas | 1 |
| Provinces | Population Density (People/km2) | Provinces | Population Density (People/km2) |
|---|---|---|---|
| Tehran | 929.2 | Kordestan | 55 |
| Alborz | 529.4 | Razavi Khorasan | 54.1 |
| Gilan | 180.2 | Bushehr | 51.2 |
| Mazandaran | 137.7 | Markazi | 49.1 |
| Qom | 112.1 | Zanjan | 48.6 |
| Golestan | 91.8 | Isfahan | 47.9 |
| Hamedan | 89.7 | Kohgiluyeh | 46 |
| West Azarbaijan | 87.3 | Fars | 40.2 |
| East Azarbaijan | 85.6 | North Khorasan | 30.4 |
| Qazvin | 81.8 | Ilam | 28.8 |
| Kermanshah | 78.1 | Hormozgan | 25.1 |
| Khuzestan | 73.5 | Kerman | 17.3 |
| Ardebil | 71.4 | Sistan & Baloochestan | 15.3 |
| Lorestan | 62.2 | Yazd | 8.8 |
| Chaharmahal | 58 | South Khorasan | 8.1 |
| Provinces | Irrigated Farms (%) | Provinces | Irrigated Farms (%) |
|---|---|---|---|
| Khuzestan | 13.1 | Qazvin | 2.6 |
| Fars | 9 | Lorestan | 2.5 |
| Razavi Khorasan | 8.6 | Kerman | 2.3 |
| South Khorasan | 8.6 | Tehran | 2.2 |
| Golestan | 5.9 | North Khorasan | 1.8 |
| Mazandaran | 5 | Zanjan | 1.8 |
| West Azarbaijan | 5 | Kordestan | 1.5 |
| East Azarbaijan | 4.1 | Hormozgan | 1.3 |
| Hamedan | 3.9 | Chaharmahal | 1.2 |
| Ardebil | 3.6 | Semnan | 1.2 |
| Isfahan | 3.5 | Ilam | 1.1 |
| Gilan | 3.3 | Booshehr | 0.8 |
| Sistan & Baloochestan | 3.1 | Kohgiluyeh | 0.7 |
| Kermanshah | 2.8 | Qom | 0.7 |
| Markazi | 2.7 | Yazd | 0.6 |
Publisher’s Note: MDPI stays neutral with regard to jurisdictional claims in published maps and institutional affiliations. |
© 2022 by the authors. Licensee MDPI, Basel, Switzerland. This article is an open access article distributed under the terms and conditions of the Creative Commons Attribution (CC BY) license (https://creativecommons.org/licenses/by/4.0/).
Share and Cite
Ansari Amoli, A.; Aghighi, H.; Lopez-Baeza, E. Drought Risk Evaluation in Iran by Using Geospatial Technologies. Remote Sens. 2022, 14, 3096. https://doi.org/10.3390/rs14133096
Ansari Amoli A, Aghighi H, Lopez-Baeza E. Drought Risk Evaluation in Iran by Using Geospatial Technologies. Remote Sensing. 2022; 14(13):3096. https://doi.org/10.3390/rs14133096
Chicago/Turabian StyleAnsari Amoli, Abdolreza, Hossein Aghighi, and Ernesto Lopez-Baeza. 2022. "Drought Risk Evaluation in Iran by Using Geospatial Technologies" Remote Sensing 14, no. 13: 3096. https://doi.org/10.3390/rs14133096
APA StyleAnsari Amoli, A., Aghighi, H., & Lopez-Baeza, E. (2022). Drought Risk Evaluation in Iran by Using Geospatial Technologies. Remote Sensing, 14(13), 3096. https://doi.org/10.3390/rs14133096