Technical Note

Day and Night Clouds Detection Using a Thermal-Infrared All-Sky-View Camera

1
Anhui Institute of Optics and Fine Mechanics, Hefei Institutes of Physical Science, Chinese Academy of Sciences, Hefei 230031, China
2
Science Island Branch, Graduate School of USTC, Hefei 230026, China
3
Anhui Air Traffic Management Bureau, Civil Aviation Administration of China, Hefei 230094, China
4
Shouxian National Climatically Observatory, Huainan 232200, China
5
Anhui Province Meteorological Science Research Institute, Hefei 230031, China
*
Author to whom correspondence should be addressed.
Remote Sens. 2021, 13(9), 1852; https://doi.org/10.3390/rs13091852
Submission received: 14 April 2021 / Revised: 26 April 2021 / Accepted: 29 April 2021 / Published: 10 May 2021

Abstract

:
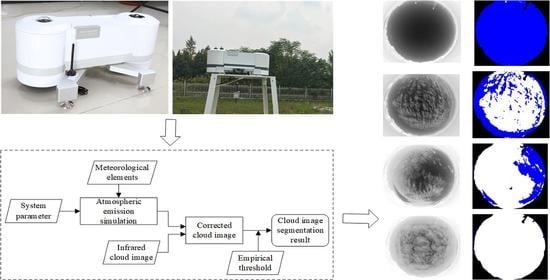
The formation and evolution of clouds are associated with their thermodynamical and microphysical progress. Previous studies have been conducted to collect images using ground-based cloud observation equipment to provide important cloud characteristics information. However, most of this equipment cannot perform continuous observations during the day and night, and their field of view (FOV) is also limited. To address these issues, this work proposes a day and night clouds detection approach integrated into a self-made thermal-infrared (TIR) all-sky-view camera. The TIR camera consists of a high-resolution thermal microbolometer array and a fish-eye lens with a FOV larger than 160°. In addition, a detection scheme was designed to directly subtract the contamination of the atmospheric TIR emission from the entire infrared image of such a large FOV, which was used for cloud recognition. The performance of this scheme was validated by comparing the cloud fractions retrieved from the infrared channel with those from the visible channel and manual observation. The results indicated that the current instrument could obtain accurate cloud fraction from the observed infrared image, and the TIR all-sky-view camera developed in this work exhibits good feasibility for long-term and continuous cloud observation.

Graphical Abstract

1. Introduction

Continuous clouds observation and the retrieved parameters can be applied to several research fields, such as solar energy prediction [1,2,3], performance evaluation of photovoltaic power generation [4], aviation/navigation, meteorology research, as well as atmospheric science and climate research [5,6,7,8]. Depending on the platform, cloud observation can be classified into space-based remote sensing [9,10] (e.g., satellite observation) and ground-based observation. In general, satellite observation has deficiencies in spatial and temporal resolution: geostationary satellites provide coarse spatial resolution images of several square kilometers [11], while polar satellites usually capture only 1-2 images per day [12]. By contrast, ground-based clouds images can provide information regarding the localized clouds presented in a given area with high spatial and temporal resolution. In addition, ground-based remote sensors cost less than space-borne platforms, making ground-based cloud observations more feasible and popular.
Clouds’ macro parameters, such as cloud fraction, clouds height, and clouds type, have been widely used in several research fields; however, they are still obtained mainly through manual observation by well-trained people, particularly in the field of meteorology [13,14,15]. However, a large bias was found by manual observation in the low cloud fraction scenario due to the arbitrary observation parameters. Some researchers have pioneered the development of cloud observation instruments to replace manual observers [16,17,18,19,20,21,22,23,24,25,26,27,28,29,30]. These instruments can be classified into two categories based on the optical bands used, that is, visible and thermal-infrared (TIR). The visible spectrum of 450–650 nm is commonly used for cloud observation. This type of instrument consists of a normal digital charge-coupled device (CCD) camera that responds in the visible spectrum and a fish-eye lens, such as the total-sky imager (TSI) [16], the Automatic Cloud Observation System (ACOS) [17] and the WIde-field aLL-sky Image Analyzing Monitoring (WILLAM) system [18,19], etc. The camera of TSI faces toward the ground, acquiring all-sky images through the reflection of a spherical mirror. The cameras of other devices in this category are installed facing the sky directly, and a sun banner is installed to protect the CCD camera from solar radiation, such as the all-sky imager (ASI) [20,21] and the wide-angle high-resolution sky imaging system [22,23]. In addition, owing to the application of the high-dynamic-range technology (HDR), a cutting-edge design was used to protect the CCD from being damaged and to obtain all-sky images without using a sun banner [24].
The other category is imaging in the TIR band (8–14 μm) for the entire sky. Devices working in this spectral band can directly detect the TIR emission of both clouds and the atmosphere, excluding the scattered light of the sun or starlight. Therefore, this category of cloud observation instruments, for example, the infrared clouds imager (ICI), can identify the clouds and estimate the cloud fraction during the day and night [25]. ICI is a passive sensor that measures the downwelling atmospheric radiance with a narrow field of view (FOV) of approximately 18 ° × 13.5 ° , and records sky images at 320 × 240 pixels. Although the FOV can reach 50° in second-generation equipment, it is still relatively small. Many infrared cameras have the same issue of a narrow FOV, such as the cameras used in Refs. [24,25,26]. In order to capture whole sky images, most infrared systems need to capture the sky images in different zenith directions by a scanning unit and splice images into a whole sky image, such as the whole sky infrared cloud measurement system (WSIRCMS) [26,27]. The all-sky infrared visible analyzer (ASIVA) [28,29] is a special instrument that can obtain a large FOV infrared sky image without using a scanning unit. However, owing to the complex structural design, ASIVA is quite expensive. In addition, the thermal-infrared cloud camera (IRCCAM) system [30] can capture the cloud conditions for the full upper hemisphere with a small FOV. The infrared camera with the FOV   18 ° × 24 ° of the system is located on top of a frame, looking downward on a gold-plated spherically shaped aluminum mirror so that the entire upper hemisphere is imaged on the camera. The complete system is 1.9m tall, and the distance between the camera and mirror is about 1.2m. Therefore, in practice, the installation of the system is relatively complex.
Instruments operating in the visible spectrum are daytime-only systems and cannot provide the correct characteristic parameters of the clouds at night. In addition, the imaging of visible instruments is greatly affected in haze weather [24]. Compared with visible spectrum observation, TIR devices exhibit more distinct advantages. The imaging of these devices is less affected by aerosols, and they can provide consistent and reliable retrieval under various air conditions during the day and night. Unfortunately, TIR systems also exhibit the disadvantages of small FOV and low image pixels, which also require a scanning unit to obtain the all-sky image. The scanning units require regular maintenance. Furthermore, the whole sky image splicing process occupies additional computer resources and is also time-consuming.
To address these issues, an instrument using a TIR all-sky-view camera for long-term and continuous cloud observation is developed in this work. This instrument consists of a TIR microbolometer array and a germanium lens, which can obtain infrared sky images with a FOV greater than 160°. In addition, this proposed instrument is merged into our previous all-sky camera (ASC) system [24] to form a new system termed ASC-200. The previous ASC system is a cloud observation device working in the visible spectrum and cannot provide useful information at night. The visible observation module of the ASC retained in the ASC-200 is used as a reference for the TIR observation module.
The remainder of the paper is organized as follows: The structure of ASC-200 is introduced in Section 2. The principle and algorithm of cloud detection in the infrared spectrum are described in Section 3. The experimental results and the relevant discussions are presented in Section 4. Section 5 shows a summary of the conclusions.

2. Description of the ASC-200 System

The ASC-200 system is a second-generation ASC instrument by adding a thermal-infrared all-sky-view camera module to the previous ASC system, as shown in Figure 1a,b. ASC-200 consists of two cameras facing toward the sky, one works in the visible band (450–650 nm), and the other is used for TIR measurement (8–14 μm). The time resolution of ASC-200 was 10 min during the day and night. In the daytime, the visible and TIR cameras simultaneously capture the all-sky images. At night, only the TIR camera continues to operate. The working period of the visible camera depends on the sunrise and sunset times at which the instrument is located. The major goal for developing ASC-200 is to make up for the inability of the ASC system to perform observations at night. Simultaneously, multi-spectrum band observations can provide more cloud parameter information.
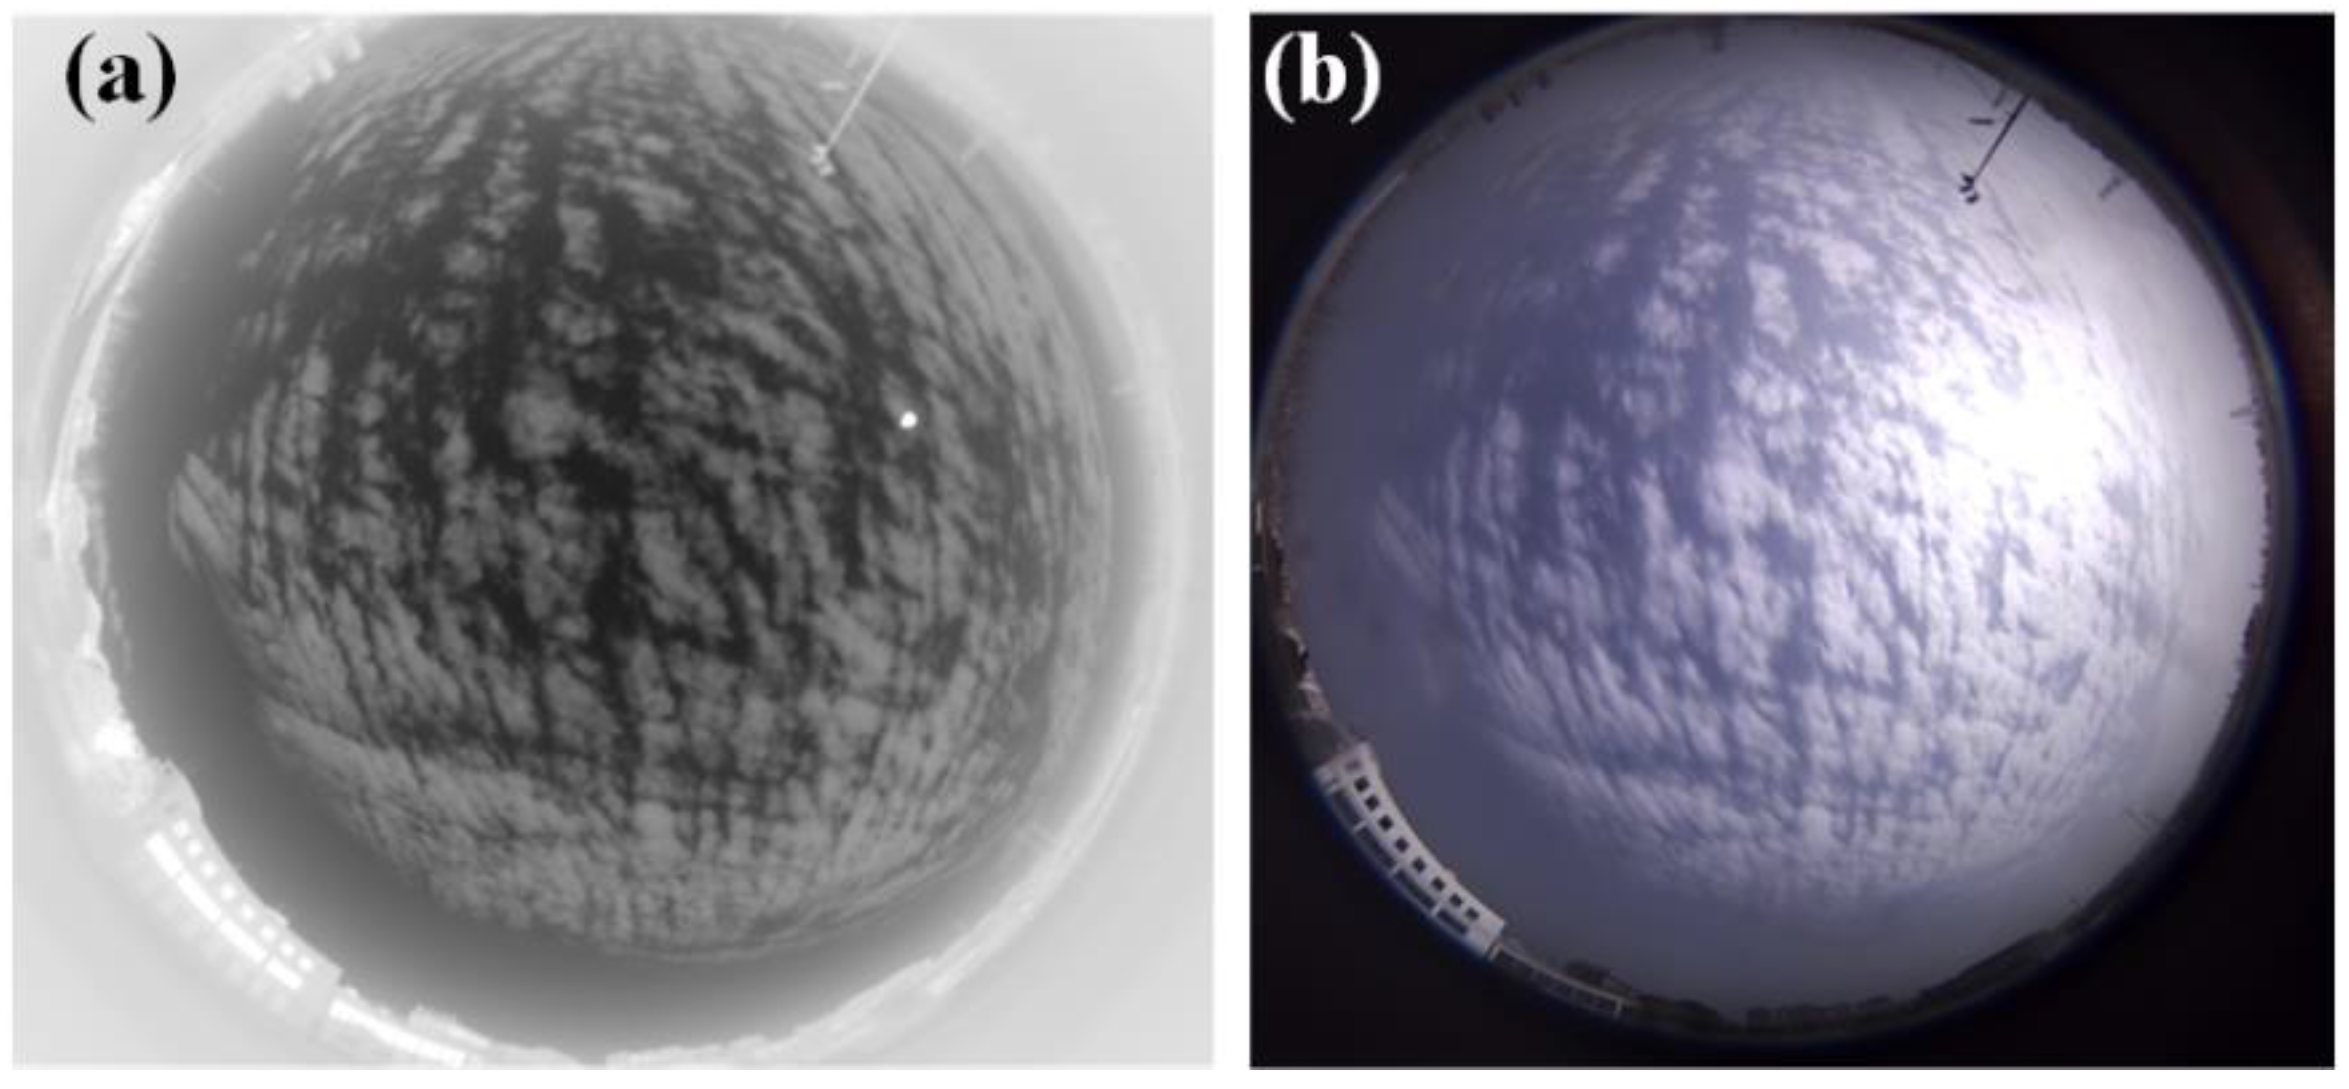
The ASC-200 instrument contains the following parts: a visible observation subsystem, a TIR observation subsystem, an internal environmental regulation unit, and a data analysis module. The visible observation subsystem adopts the same mechanical design and image processing method as the ASC instrument. The camera consists of a CCD sensor with a resolution of 2000 × 1944 and a fish-eye lens. It can capture a 180° sky hemisphere, as shown in Figure 2b. This subsystem is not similar to the TSI instrument utilizing a sun tracker to block solar radiation. Instead, a shutter was installed between the CCD sensor and the fish-eye lens. When the camera is working, the shutter is open, and the ambient light is allowed to pass through. On the contrary, when the shutter is closed, no light can enter the sensor. Therefore, direct sunlight causes little damage to the sensor. Simultaneously, the ASC uses an algorithm proposed by Debevec et al. [31] to create an HDR radiance map. This algorithm uses several images with different exposures to fuse to an HDR image, whose pixel values are proportional to the true radiance values in the scene. More details can be found in our previous paper about the ASC system [24].
The TIR observation subsystem is the most notable part of this system, with the TIR all-sky-view camera (TIRASVC) as its key component. TIRASVC consists of a thermal microbolometer array sensitive in the 8–14 μm spectral region and a customized germanium fish-eye lens. The focal length of the lens is 4 mm, and the FOV is over 160°. The TIR image resolution is 640 × 512 pixels. The large FOV and high resolution allow the subsystem to provide spatial cloud statistics over a wide range with no need for scanning and splicing. Therefore, such a mechanism of this subsystem not only lowers the complexity and the cost of the system but also reduces the image post-processing tasks. Figure 2a shows a TIR all-sky image. In addition, the TIR lens is waterproof; thus, it can be directly exposed to the ambient with no protective device.
To monitor and regulate the system’s working status, an internal environmental conditioning unit (ECU) is added to measure the internal and external conditions of the system. It consists of a set of temperature and relative humidity sensors. The ECU is used to maintain the internal temperature ranging between °C and 55°, which is suitable for the normal operation of the ASC-200 system. The working mechanism of the ASC-200 is controlled by a data analysis module, which is a small computing platform of the advanced RISC (Reduced Instruction Set Computer) machine (ARM) framework, and is installed inside the instrument. The sky images and preliminary analysis results can be stored inside the instrument or transmitted to the client via wired or wireless means. All the designs improve the ability of the equipment to adapt to the complex working environment and extend working hours without human intervention. More than 10 sets of ASC-200 instruments have been installed in different meteorological observation stations to assist meteorological staff in cloud observation.

3. Retrieval of Clouds Information from TIR Image

3.1. Atmospheric Infrared Radiation Characteristics

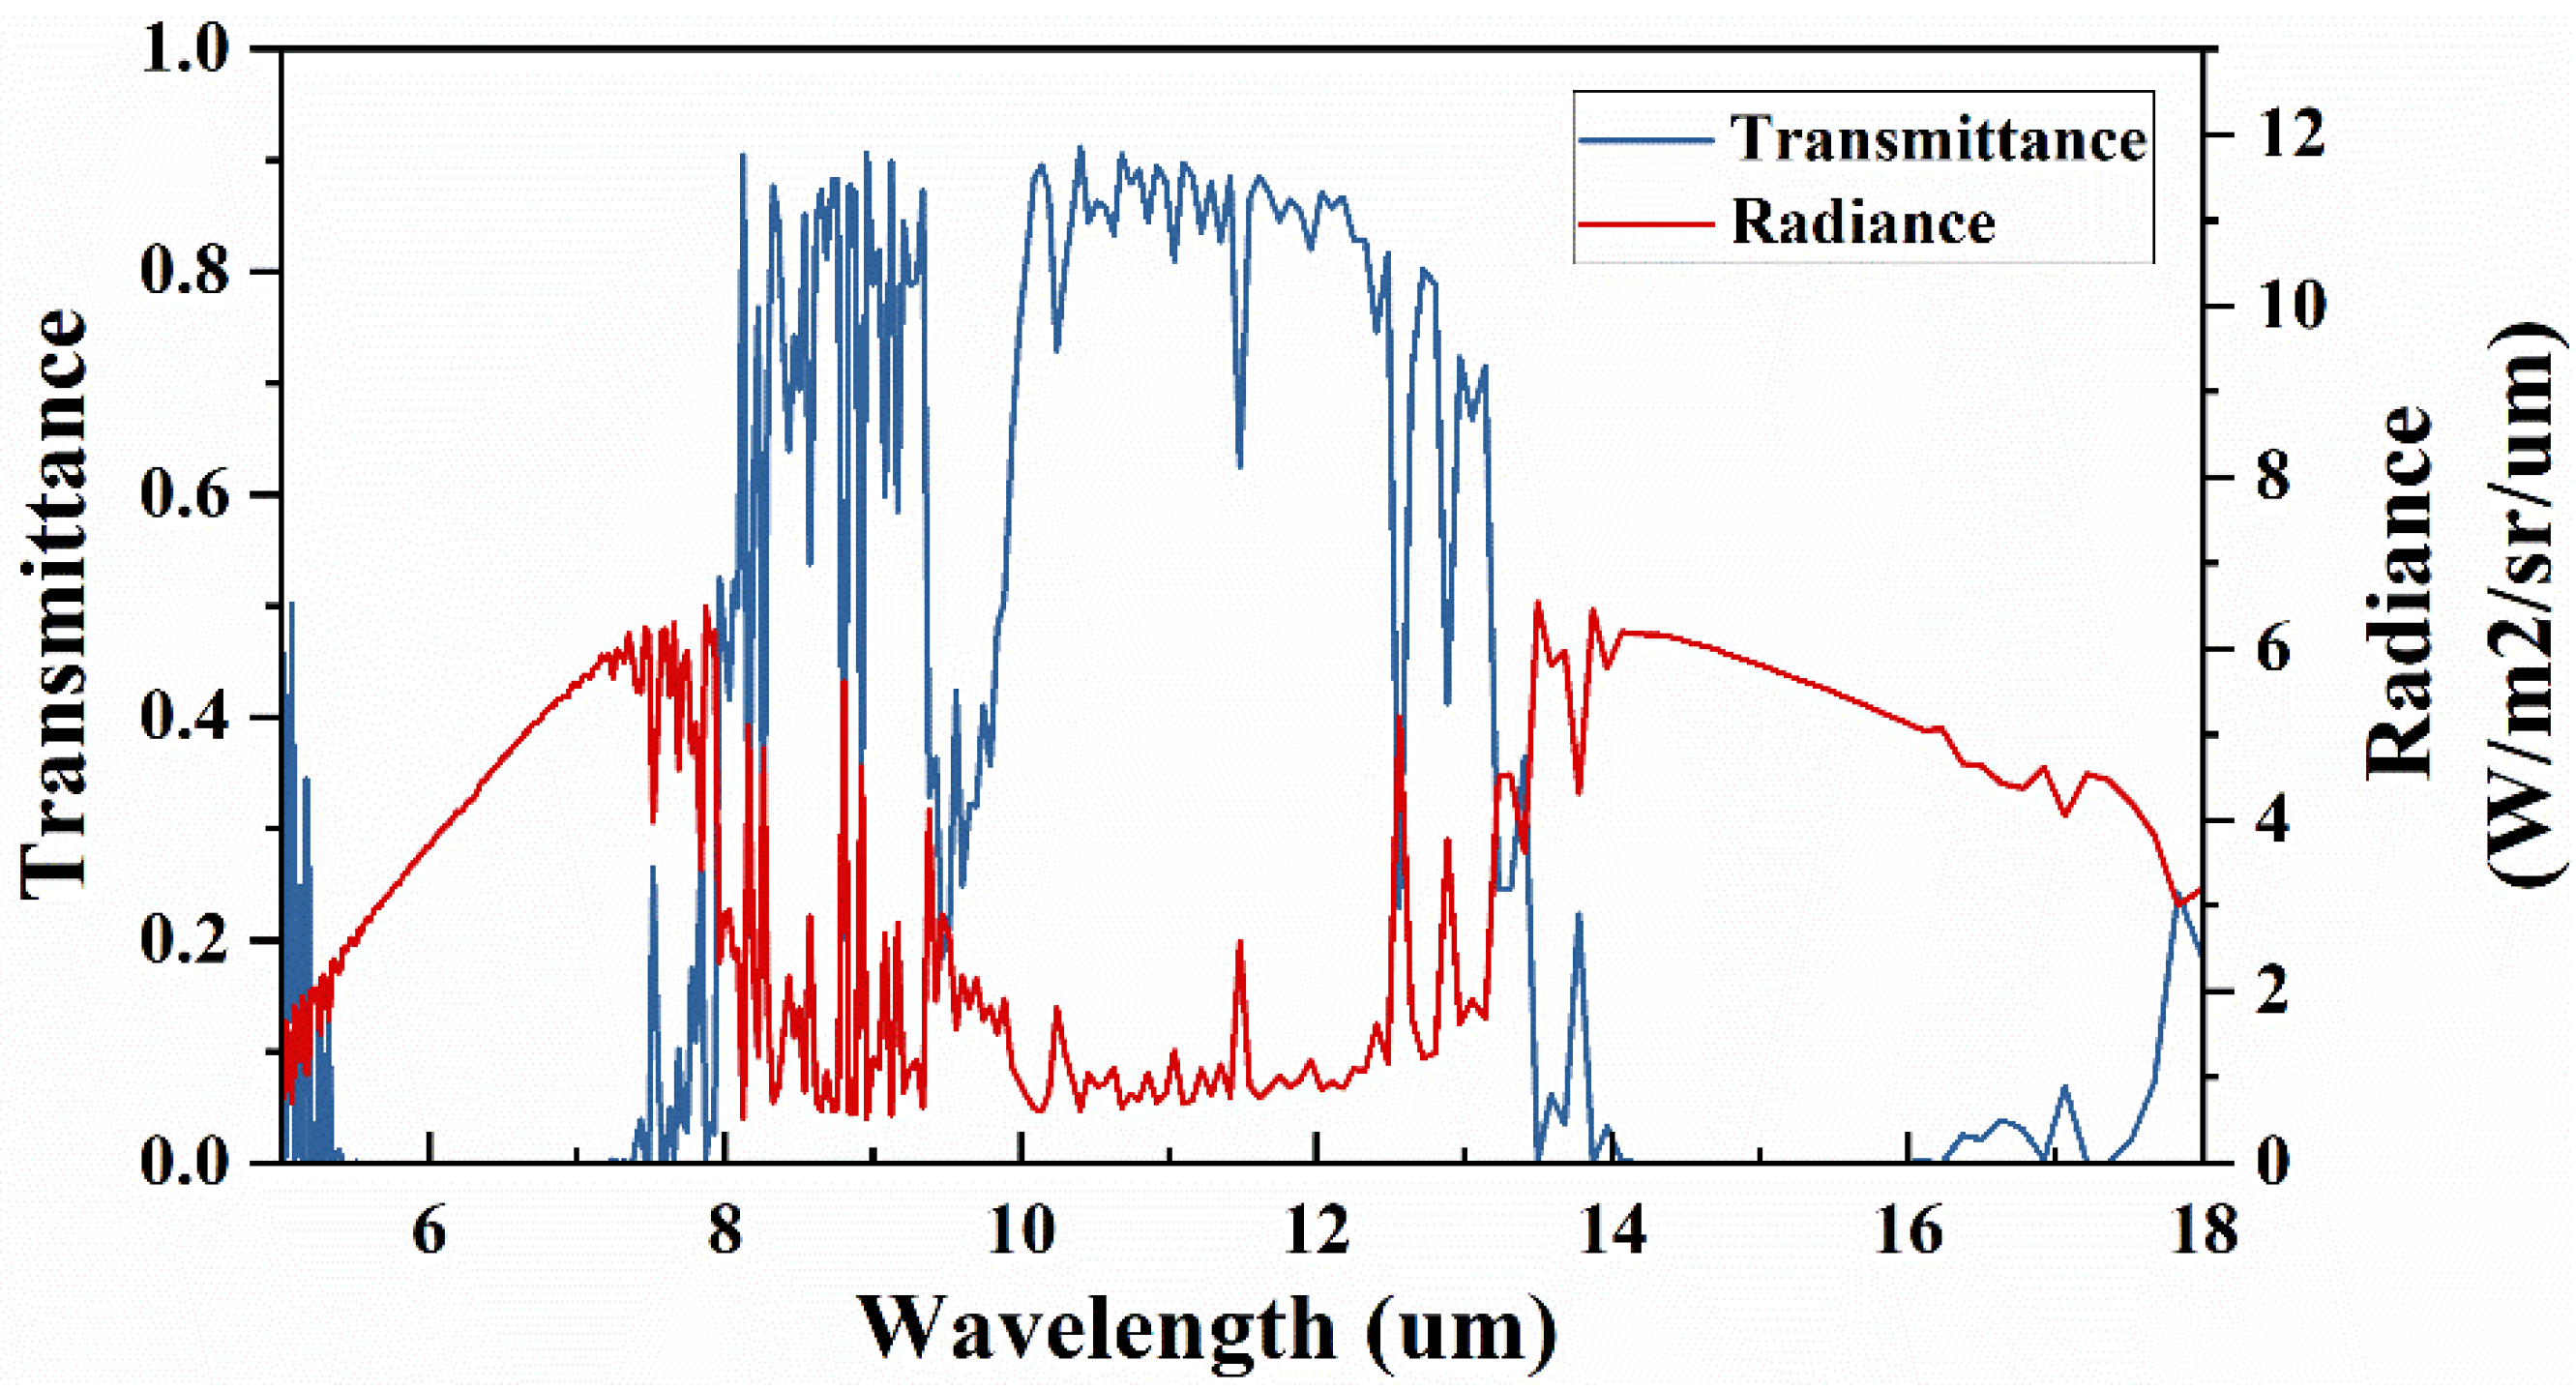
Infrared radiation has long been known to have broad prospects for providing valuable cloud properties and atmospheric data [25,32,33]. The effect of the atmosphere on infrared radiation varies with the spectral band. In particular, owing to the low atmospheric emission and low absorption, the spectral band of 8–14 μm is referred to as the long wave infrared (LWIR) atmospheric window. To further illustrate the characteristics of the atmospheric window, the atmospheric spectrum radiance and atmospheric transmittance versus the wavelength were simulated by the atmospheric radiation transfer software MODTRAN [34], and the results are shown in Figure 3. The figure shows the simulated transmittance (blue line) and radiance (red line) of a clear sky for the zenith path to space by using the 1976 US Standard Atmosphere [35] of a rural atmosphere model with a visibility of 23 km and a ground altitude of 100m. The CO 2 mixing ratio was set to 390 ppmv. The water vapor and ozone column use the default values. As shown in Figure 3, the atmospheric window (8–14 μm) has a very high atmospheric transmittance and a low atmospheric emission, except for the region around 9.6 μm due to ozone O 3 absorption. However, the ozone in the troposphere is not highly variable in space or time. Therefore, the influence of O 3 would not be compensated in this study.
In the atmospheric window, the absorption and emission of infrared radiation by the atmosphere are mainly dominated by water vapor and clouds. In cloudless weather, the radiation received on the ground is small and varies with the water vapor content [25,36]. Previous researches show that a second-order polynomial relationship exists between downwelling infrared radiation and precipitable water vapor (PWV), as formulated below [29,37]:
L = a   ×   PWV 2 + b   ×   PWV + c
where L is the downwelling infrared radiance in the 8–14 μm spectral band, and a, b and c are the fitting coefficients.
If clouds present, the radiation received by the ground-based TIR camera at the atmospheric window corresponds to the altitude-dependent cloud temperature and cloud emissivity [36], but it is insensitive to changes in the effective radius of clouds particles [38]. Clouds are strong infrared emitters, and optically thick clouds emission is similar to that of a blackbody at or near the temperature of the clouds [36]. If the optical thickness is greater than eight, the clouds can be treated as blackbodies and the radiation will not increase with the optical thickness [37]. After removing the atmosphere emission, the residual radiance can be used to identify the presence of clouds. With these characteristics, the LWIR spectral region is an ideal spectrum for cloud detection.

3.2. TIR Clouds Imaging

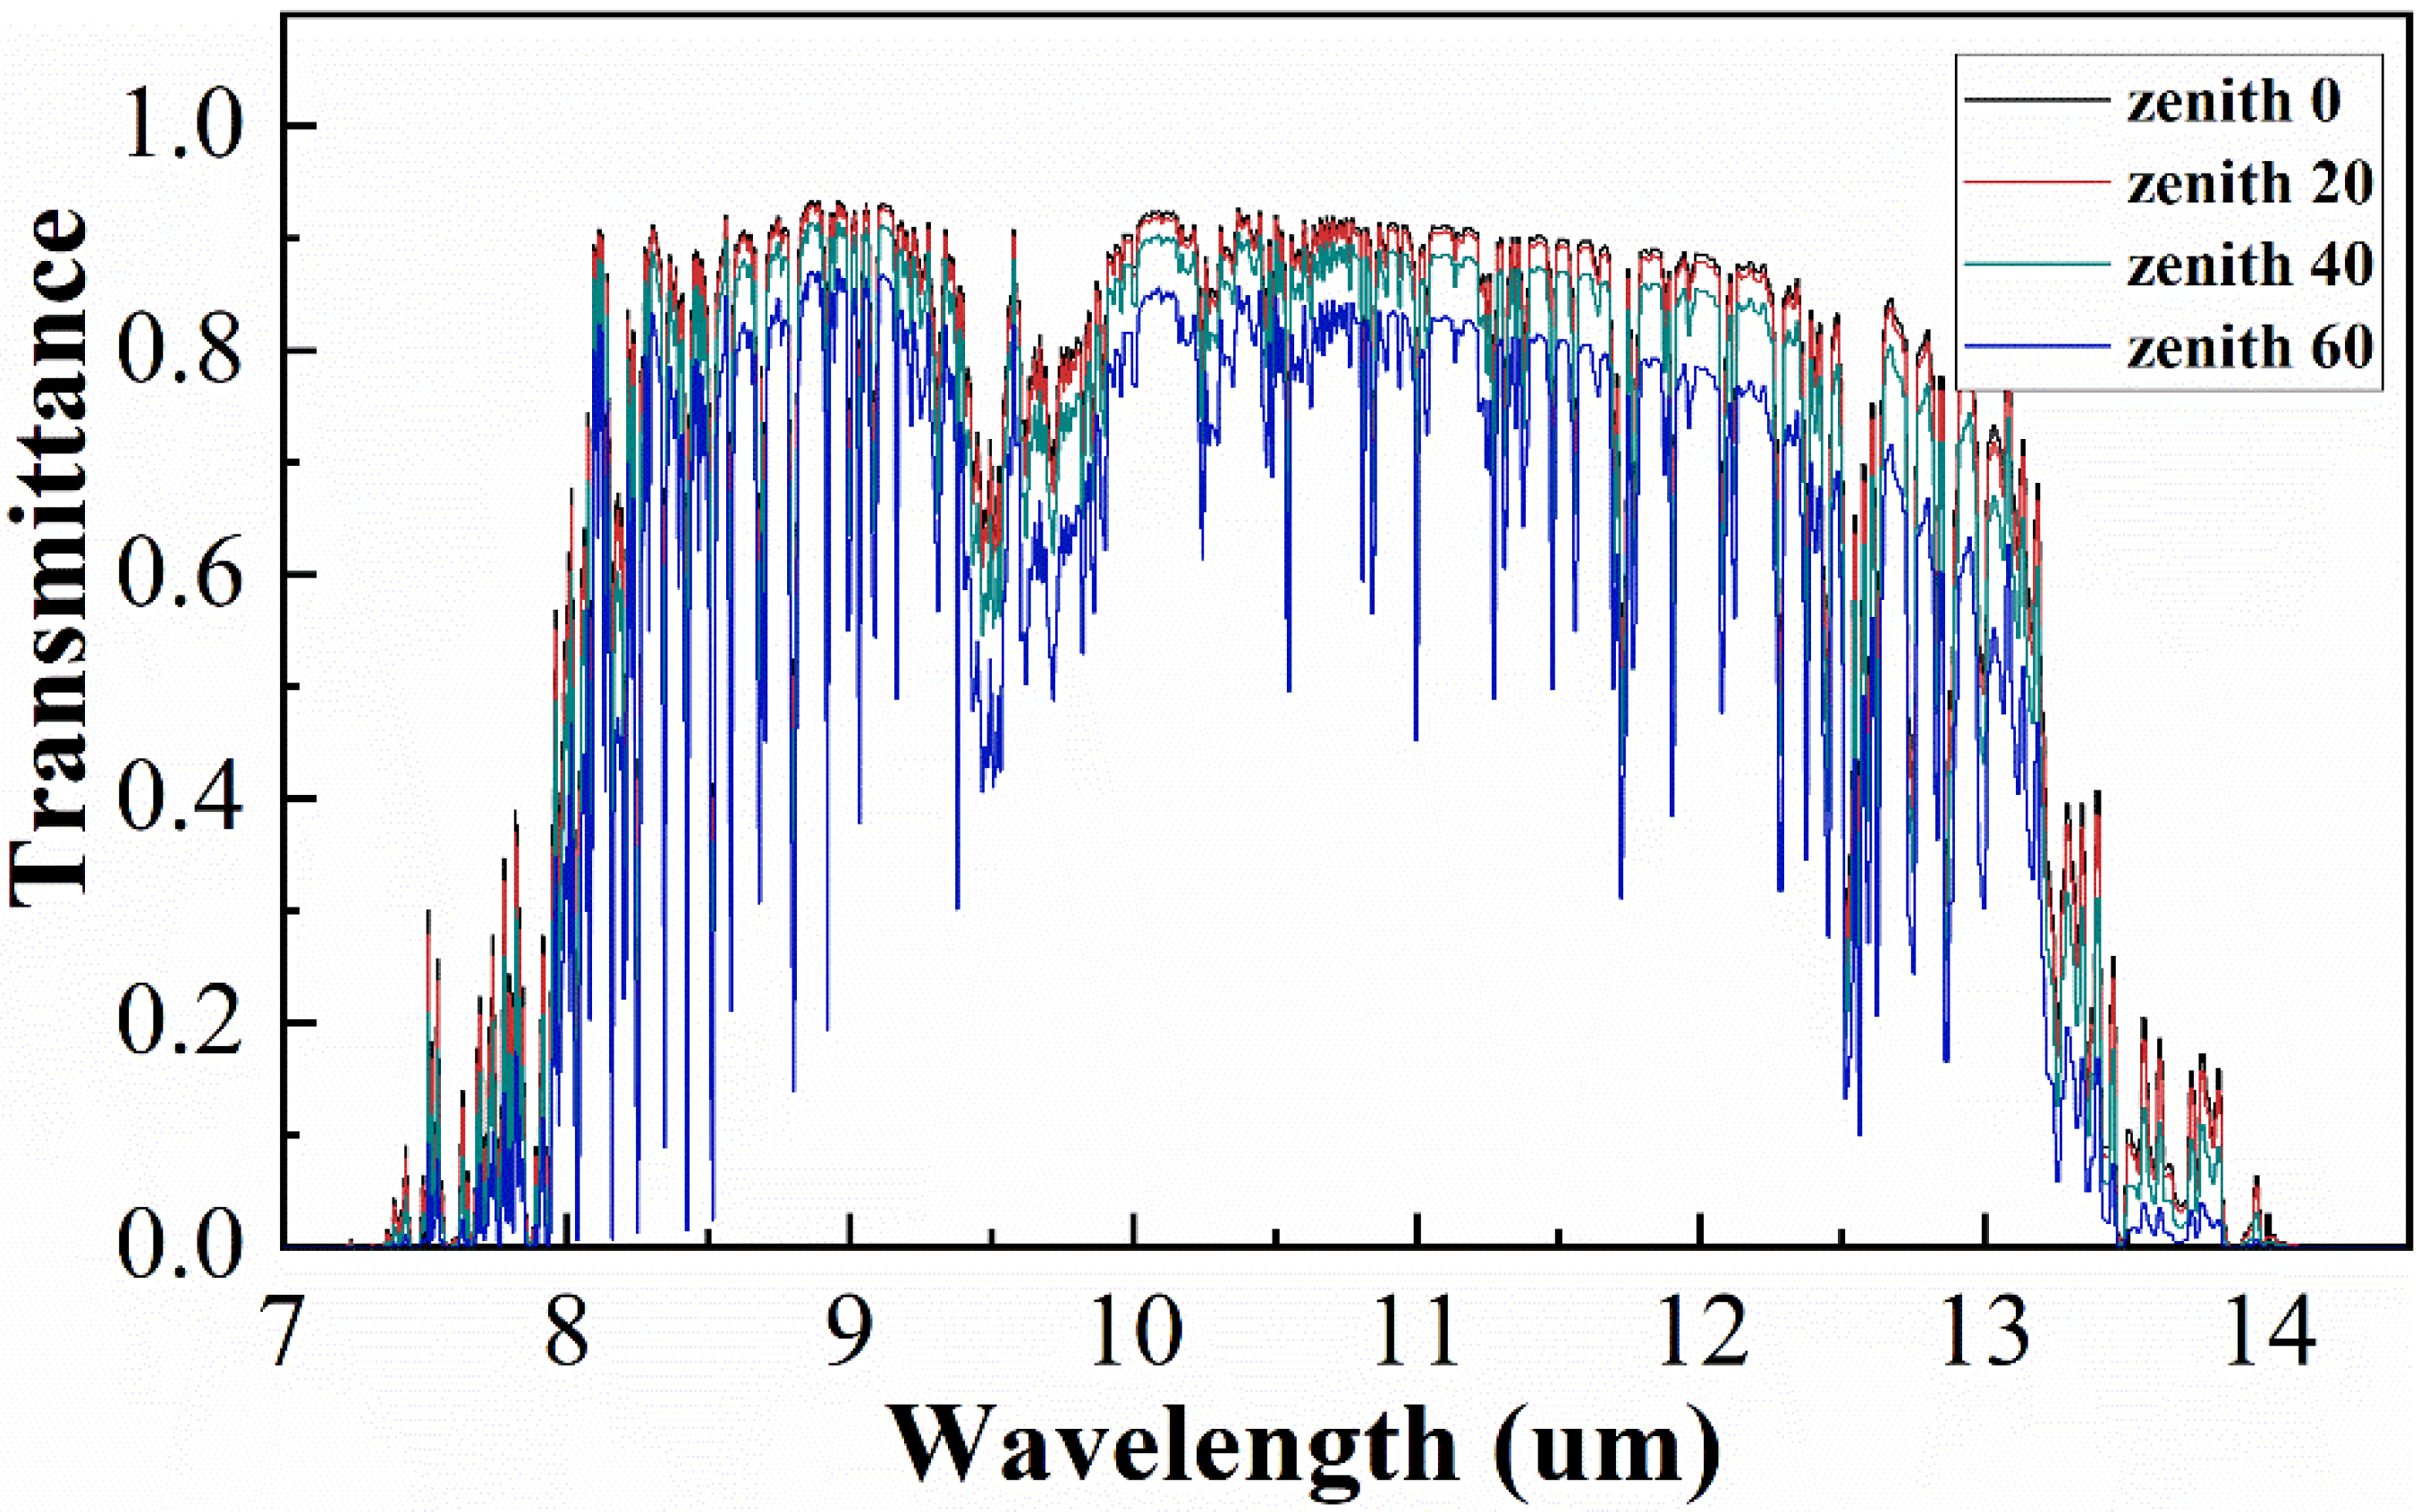
On the clear sky, the perceived radiance by the ground-based TIR camera is dependent on the PWV and the path length through the atmosphere. The path length increases with the sensor zenith angle (SZA). For a narrow FOV TIR camera, the received radiation varies little with the path length through the atmosphere. However, with a larger FOV, the influence of the atmospheric path cannot be neglected. Figure 4 shows a series of MODTRAN simulation results of atmospheric transmittance variations with the SZA. The downwelling atmospheric transmittance is largest at zenith direction. This demonstrates that the atmospheric transmittance decreases with the increase in the zenith angle. From previous studies, we know that the lower atmospheric transmittance, the higher infrared radiation in the atmosphere. Therefore, the atmospheric radiance received by the ground-based camera is the lowest in the zenith direction, and it gradually increases with the increase in SZA, and the radiance measured on the horizon is almost equal to the surface radiance.
If clouds are present, cloud radiation and the atmospheric path length together contribute to form an infrared clouds image. The increase in effective atmospheric path causes an increase in perceived radiance, especially near the edge of the camera’s field of view. As a result, on a cloudless day, the radiance at the center of the infrared image is the smallest and gradually increases from the center to the edge; while on a cloudy day, even if there are clouds at the zenith, the radiation is possibly less than or equal to that of the cloudless areas at the edge of the image. The increase in radiance with zenith angle poses a problem when attempting to remove the background atmospheric radiance. Therefore, a fixed threshold cannot be applied to the infrared sky images to segment the cloud pixels or sky pixels. As the FOV of the TIR camera is over 160°, the influence of the path length through the atmosphere should be considered and corrected before cloud discrimination.
The TIR camera can be affected by the installation environment. To provide an accurate reading of the downwelling radiance of infrared images, the TIR camera stabilizes itself to adapt to the changes in the environmental radiance by calibrating the response of each pixel. Every pixel is calibrated by the shutter of the camera, which is used as a calibration source for the offset during the deployment. Generally, the pixel value of the infrared raw image is a digital number (DN), which is not calibrated to a meaningful unit. The absolute radiance in Wm−2 sr−1 can be calibrated using a blackbody reference to obtain the gain of the camera. Radiometric calibration typically requires a quantitative relationship between the camera output and the source radiance or temperature. This is usually done by measuring the camera’s output when it views one or more blackbody sources. Since cloud detection depends less on absolute calibration than many radiometric sensing applications, the approximate linear relationship is used to calibrate the TIR camera in previous application studies [32,38]. Then, the raw image can be converted into a radiance image by a linear calibration equation, as shown below:
L λ   = G   ×   DN + offset
where G and offset are the conversion gain and offset, respectively, which are related to the TIR camera. L λ represents the value of the radiation received by the infrared camera.

3.3. Determination of the Clouds Region

The clouds and the atmospheric emission together form an infrared sky image; hence, detecting the clouds from the infrared raw sky image requires removing the atmospheric emission. Therefore, a threshold can be applied to the image to identify clouds from the remaining residual radiance. Based on MODTRAN radiative transfer calculations, Brentha et al. [25] used the measurements of PWV and the near-surface air temperature to remove atmospheric emission from infrared images then identified the clouds based on the residual radiance with a threshold filter. Smith et al. [38] proposed a new function for calculating the clear-sky atmospheric emission shown in Equation (3) to identify cloudy pixels in an infrared sky image, which only uses the TIR camera data without requiring the knowledge of the total amount of atmospheric water vapor.
T = ( T h     a ) ( θ 90 ) b + a
where T is the brightness temperature; T h is the horizon temperature; a and b are fitting parameters; θ is the SZA. The brightness temperature is a descriptive measure of radiance in terms of the radiance temperature. Brightness temperature and radiance are related through Planck’s radiation law and expressed as follows:
L λ ( T ) = 2 hc 2 λ 5 1 e hc k λ T 1
The above equation shows that the radiance emitted by an object is a function of the brightness temperature T of the object, the wavelength λ, Planck constant h (6.626 × 10⁻³⁴ J∙S), the speed of light c (2.998 × 10⁸ ms−1) in a vacuum and the Boltzmann constant k (1.38 × 10⁻²³ JK−1). Based on Equations (3) and (4), the brightness temperature of the clear sky at any SZA can be calculated, and the atmospheric temperatures can be removed from infrared sky images to identify clouds pixels.
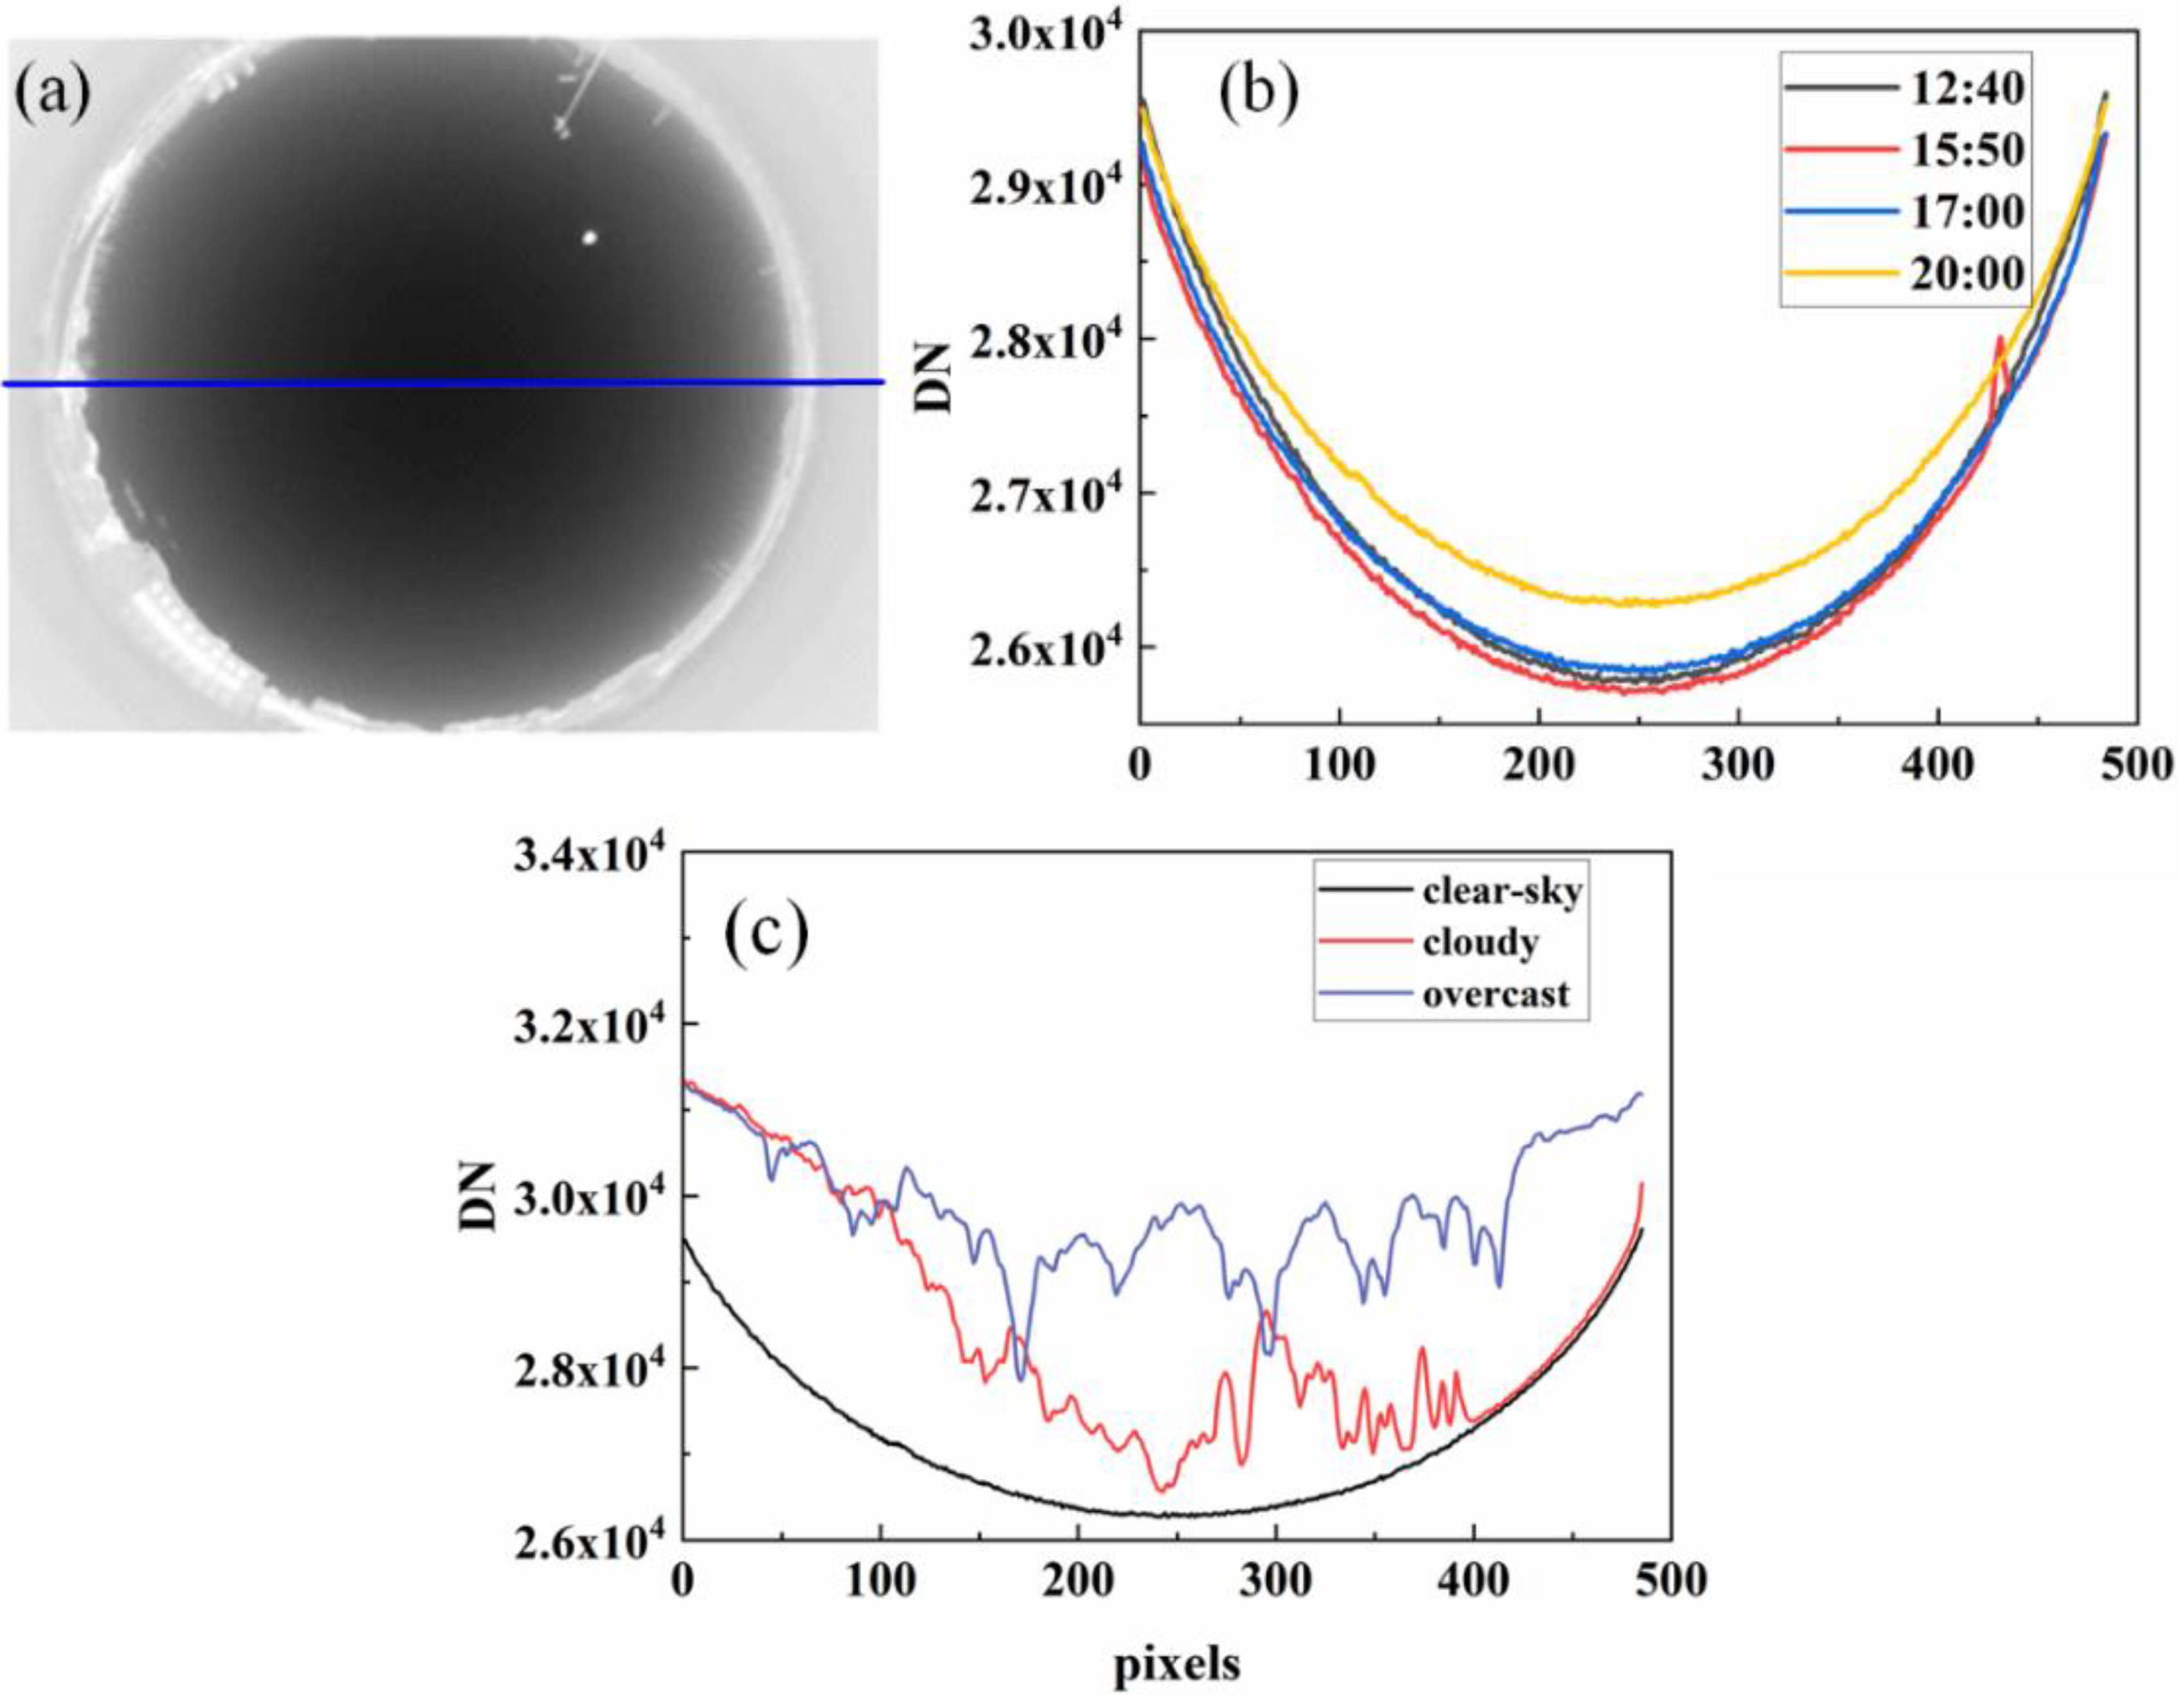
In this study, atmospheric emission is eliminated based on the raw infrared sky image. This method does not require calibration of the TIR camera system, nor does it need to convert the raw images into radiometric images or brightness temperature images; thus, the error caused by the calibration can be avoided. Figure 5a is an infrared cloudless all-sky image captured by the ASC-200 system on March 12th, 2019, local time (LT), at the Baoshan Meteorological Bureau, Shanghai. Figure 5b presents the DN distribution of different SZA along with one azimuthal position (blue line in Figure 5a) on the cloud-free day at different times. It is worth noting that the area of the sky within the circle in Figure 5a, rather than the part outside of the circle, is the region of interest. Figure 5b shows that the atmospheric emission has a smooth increase with the SZA. This is mainly influenced by the effective water vapor, which increases with the length of the path through the atmosphere. During the daytime, the profiles of the emission distribution show considerable agreement. However, at night, there is a large deviation (shown by the yellow line in Figure 5b), which is caused by the variations of temperature and humidity [38]; however, the DN points are fit to a second-order polynomial correlation for the entire day. In Figure 5b, the peak between 400 and 500 pixels at 15:50 LT is due to the sun exactly appearing in the azimuth indicated by the blue line in Figure 5a. Figure 5c presents the DN distribution in the case of a clear sky (black line), partially cloudy sky(red line) and overcast sky (blue line) along the same azimuthal position on Jan 27th, 2019 LT, at the Baoshan Meteorological Bureau, Shanghai. Figure 5c shows that image radiance is significantly higher in the cloudy and overcast sky than in the clear sky. At other times during the measurement period, the observation data showed the same characteristics. These indicate that, even at different times, atmospheric emission reflected in infrared images is still fit to a quadratic polynomial correlation, and the radiation of the cloudy sky is significantly greater than the clear sky.
According to previous researches [30,38], the clear-sky radiance increases with the SZA. The statistical results of the historical observation data of the ASC-200 confirm that the radiance received by the ground-based TIR camera fit to a quadratic polynomial along one azimuth position in the infrared sky image coordinate system. Therefore, before developing an accurate angular dependence of the water vapor removal algorithm, the characterization of the per-pixel pointing angle and instantaneous field of view needs to be included. The pointing angle of each pixel can be determined by the method proposed in Nugent’s research [39]. As the path length through the atmosphere increases with the SZA following a cos θ relationship ( θ represents the zenith angle), the clear-sky emission can be described by a polynomial equation about the SZA.
L sky = a   ×   ( PWV cos θ ) 2 + b ( T k )   × PWV cos θ + c ( T k )
where b ( T k ) and c ( T k ) are empirical parameters related to the near-surface ambient temperature T k . The increase in atmospheric emission with the zenith angle results in an increase in the pixel gray value in the infrared raw sky image.
Combining Equations (2) and (5), as well as the statistical characteristics of the gray value of the infrared raw sky image (shown in Figure 5), we propose a clear-sky emission simulation model based on the gray values of the infrared raw sky image as follows:
D sky = a   ×   ( DN θ = 0 ° cos θ ) 2 + b ( T k )   × ( DN θ = 0 ° cos θ ) + c ( T k )
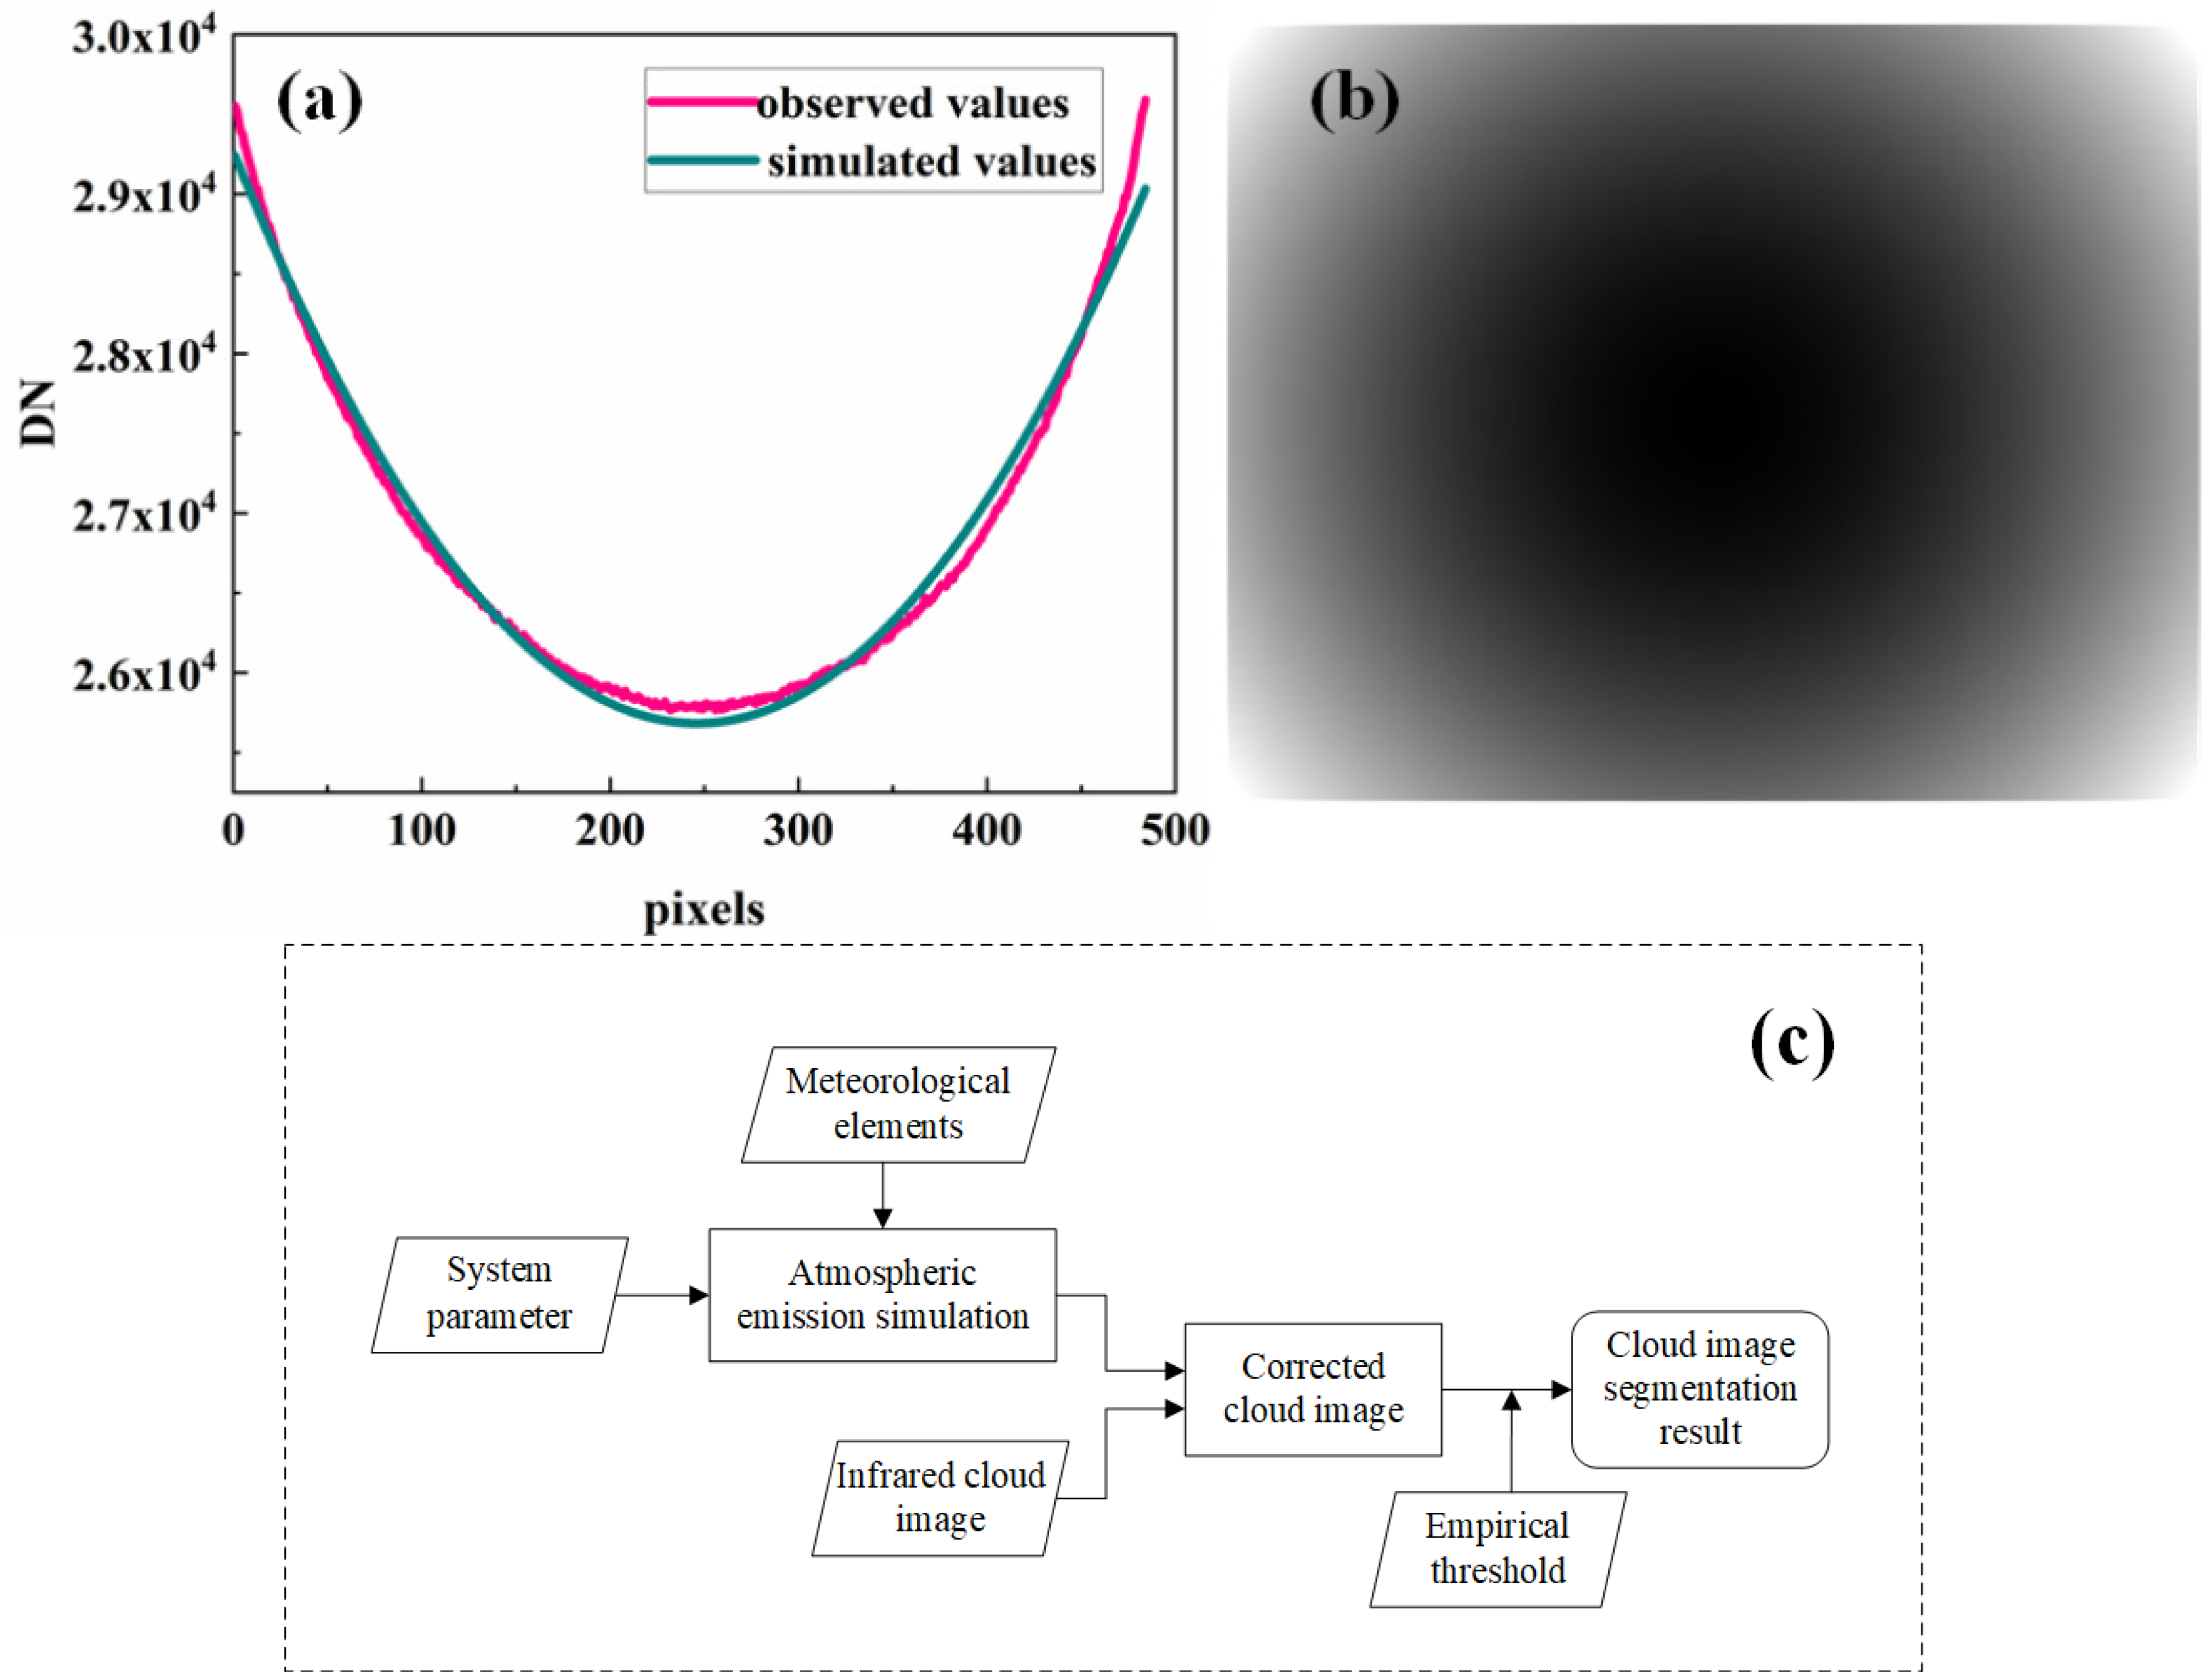
The above equation fits the data from an infrared sky image by plotting each pixel value as a function of its angle to the zenith. DN θ = 0 ° represents the pixel value at the zenith in the sky image; b ( T k ) and c ( T k ) are parameters related to ambient temperature T k ; a is the system parameter. According to the above equations, the pixel values of the infrared clear-sky image at different zenith angles can be simulated. The simulation results and actual observation values along one azimuth position of the sky are shown in Figure 6a. The DN image of the whole clear sky simulated by Equation (6) is shown in Figure 6b.
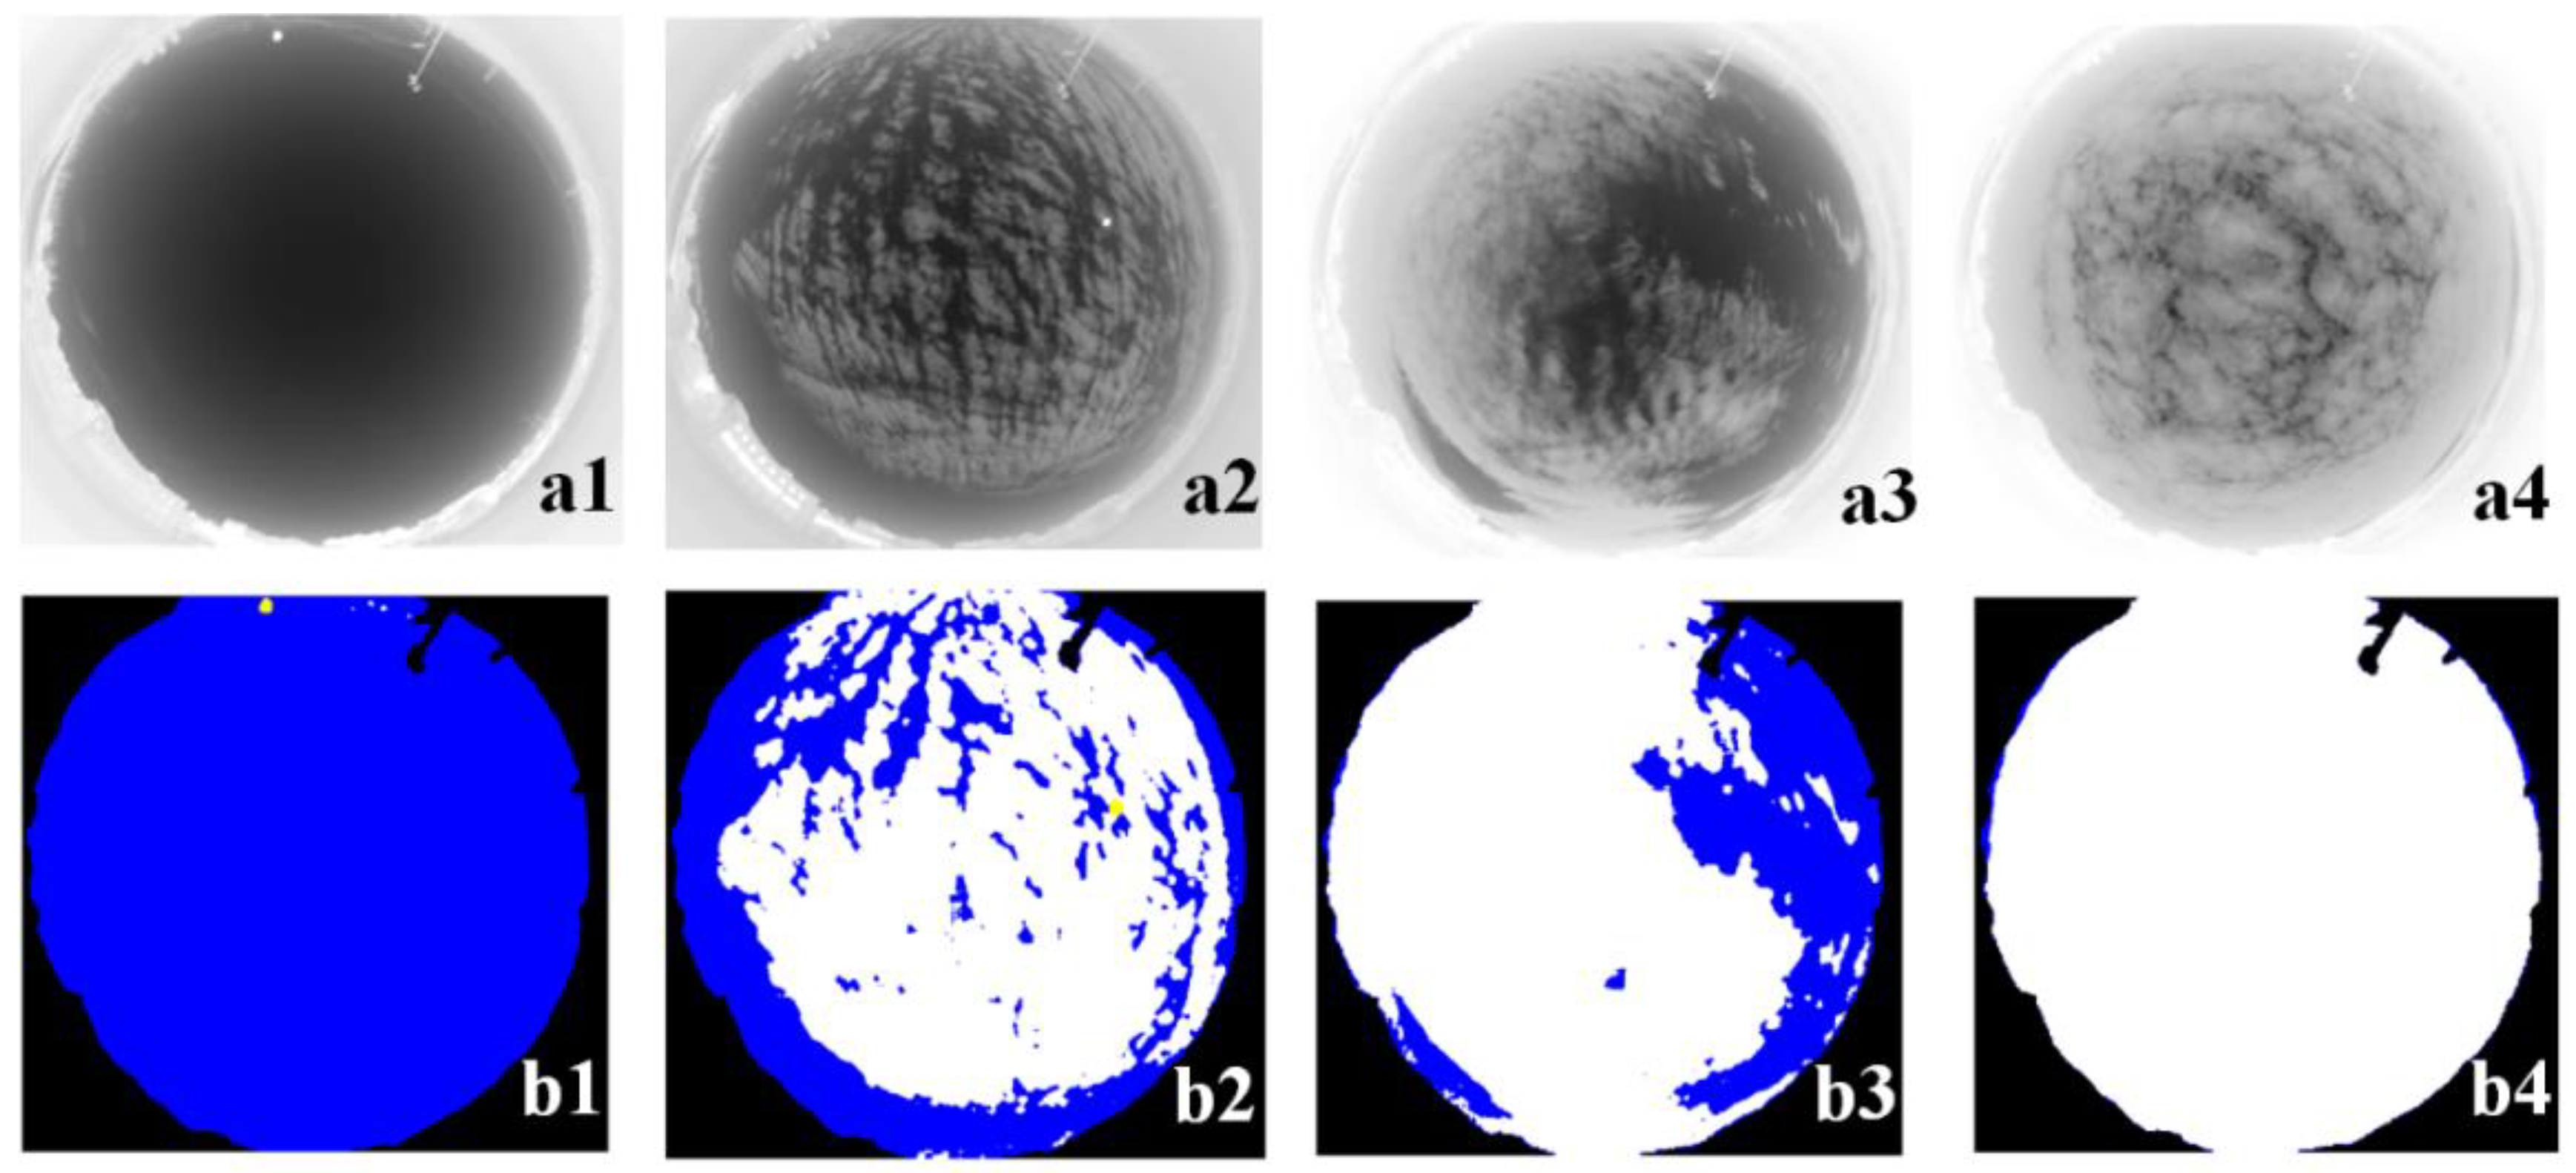
After determining the clear-sky emission, cloud pixel recognition can be determined by applying empirical thresholds to the subtracted clear-sky images. The framework of the proposed method is shown in Figure 6c. The images in Figure 7 showing the different conditions of the sky, such as cloud-free (Figure 7(a1)), cloudy (Figure 7(a2,a3)), and overcast sky (Figure 7(a4)) were captured at different times on 3rd April 2019, LT, at the Baoshan Meteorological Bureau, Shanghai. Among them, Figure 7(a1,a2) were collected during the daytime (16:00 and 11:00 LT), while Figure 7(a3,a4) were collected at night (23:10 and 23:40 LT). Figure 7(b1–b4) show the cloud recognition results for infrared cloud images using the proposed method. The black areas in the result maps represent the invalid pixels of the infrared sky image and the areas blocked by obstacles. The black areas are created to determine the areas of the sky hemisphere in the ASC-200 image after the instrument was installed. The blue and white areas represent the blue sky and the clouds in the resulting image, respectively.
Figure 7(b1,b2) show the cloud segmentation results of the clear sky and cloudy images in the daytime. Additionally, Figure 7(a3,a4) present the detection results of the cloudy and overcast sky images at night. The clear-sky emission was properly estimated and removed from the infrared sky images. Therefore, most of the sky cloud pixels were correctly classified. One may notice that the results for the cloudy sky (Figure 7(b2,b3)) show that some pixels of the transition area between the sky and clouds cannot be classified correctly. However, these pixels account for a small proportion and have little impact on cloud recognition results. In general, the proposed method can effectively identify most of the cloud pixels from infrared sky images, no matter in the daytime or at night.

4. Results and Discussion

To assess the performance of the proposed infrared clouds detection system, we conducted observational comparison experiments in several locations and obtained the test data. In this section, the cloud fraction from the infrared channel was compared with the data from the visible channel and those obtained via manual observations. Then, the observation accuracy for different cloud types was analyzed to provide a reference for the use of the cloud fraction data from the ASC-200 instrument.

4.1. Dataset Description

Sky images were collected from the experiments at Baoshan Meteorological Bureau, Shanghai (31°24′ N, 121°27′ E), from 8th March to 31st May 2019. Simultaneously, professional human observers conducted cloud observations four times a day, i.e., at 8:00, 11:00, 14:00, and 17:00 LT. Therefore, the comparison is only performed for daytime data of the TIR camera because only daytime data are available for the visible camera and manual observation. In the experiment, the well-trained meteorologists divide the all-sky into ten oktas based on the visible images and calculate the cloud fraction according to the proportion of the sky covered by clouds based on their experience. This means that a clear sky is denoted by zero-ten oktas, whereas an overcast sky is set as ten-ten oktas. Therefore, to compare the cloud fraction observed by the different methods, the infrared and visible sky images corresponding to human observation times were selected to calculate the cloud fraction.
The experiment lasted 84 days, from 8th March to 31st May. Except for the missing data due to ASC-200 failure and rainy days, 316 groups of available data were filtered based on manual observation time. This means that this dataset has a total of 632 sky images, of which 316 are infrared images, and 316 are visible images, and the captured times of the infrared and visible images correspond to each other.
To estimate the cloud fraction, it is essential to identify the cloud pixels in a sky image. After obtaining the clouds’ segmentation image, the cloud fraction P cloud can be calculated according to the following formula [24]:
P cloud = M cloud / N all-sky
where M cloud is the number of cloud pixels, and N all-sky is defined as:
N all-sky   = M sky + M cloud
In the formula, M sky represents the number of sky pixels in an all-sky image (invalid pixels and sun pixels are not included, such as the black and yellow areas in Figure 7(b1–b4). According to the clouds’ segmentation results from the clouds detection method mentioned in Section 3, the infrared cloud fraction data can be estimated.
The visible image segmentation algorithm of ASC-200 is the same as the ASC system. In our previous studies [40], a novel convolutional neural network (CNN) model named SegCloud was developed for accurate cloud segmentation. The SegCloud network was constructed by an encoder and a decoder network. The encoder network transforms the input images to high-level cloud feature representation. The decoder network is used to restore the obtained high-level cloud feature maps to the same resolution of input images and achieve end-to-end cloud image segmentation. In this study, the pixels of visible cloud images are segmented into four categories (sky pixels, cloud pixels, sun pixels and invalid pixels). Compared with the conventional visible cloud recognition methods, the CNN model extracts not only the R-G-B color information of sky images but also high-level feature information. Therefore, the performance of the Segcloud model is effective and accurate. Validation experiments were conducted, and the identification of cloud pixels was also demonstrated by Xie et al. [40].

4.2. Consistency Analysis of the Observation Results

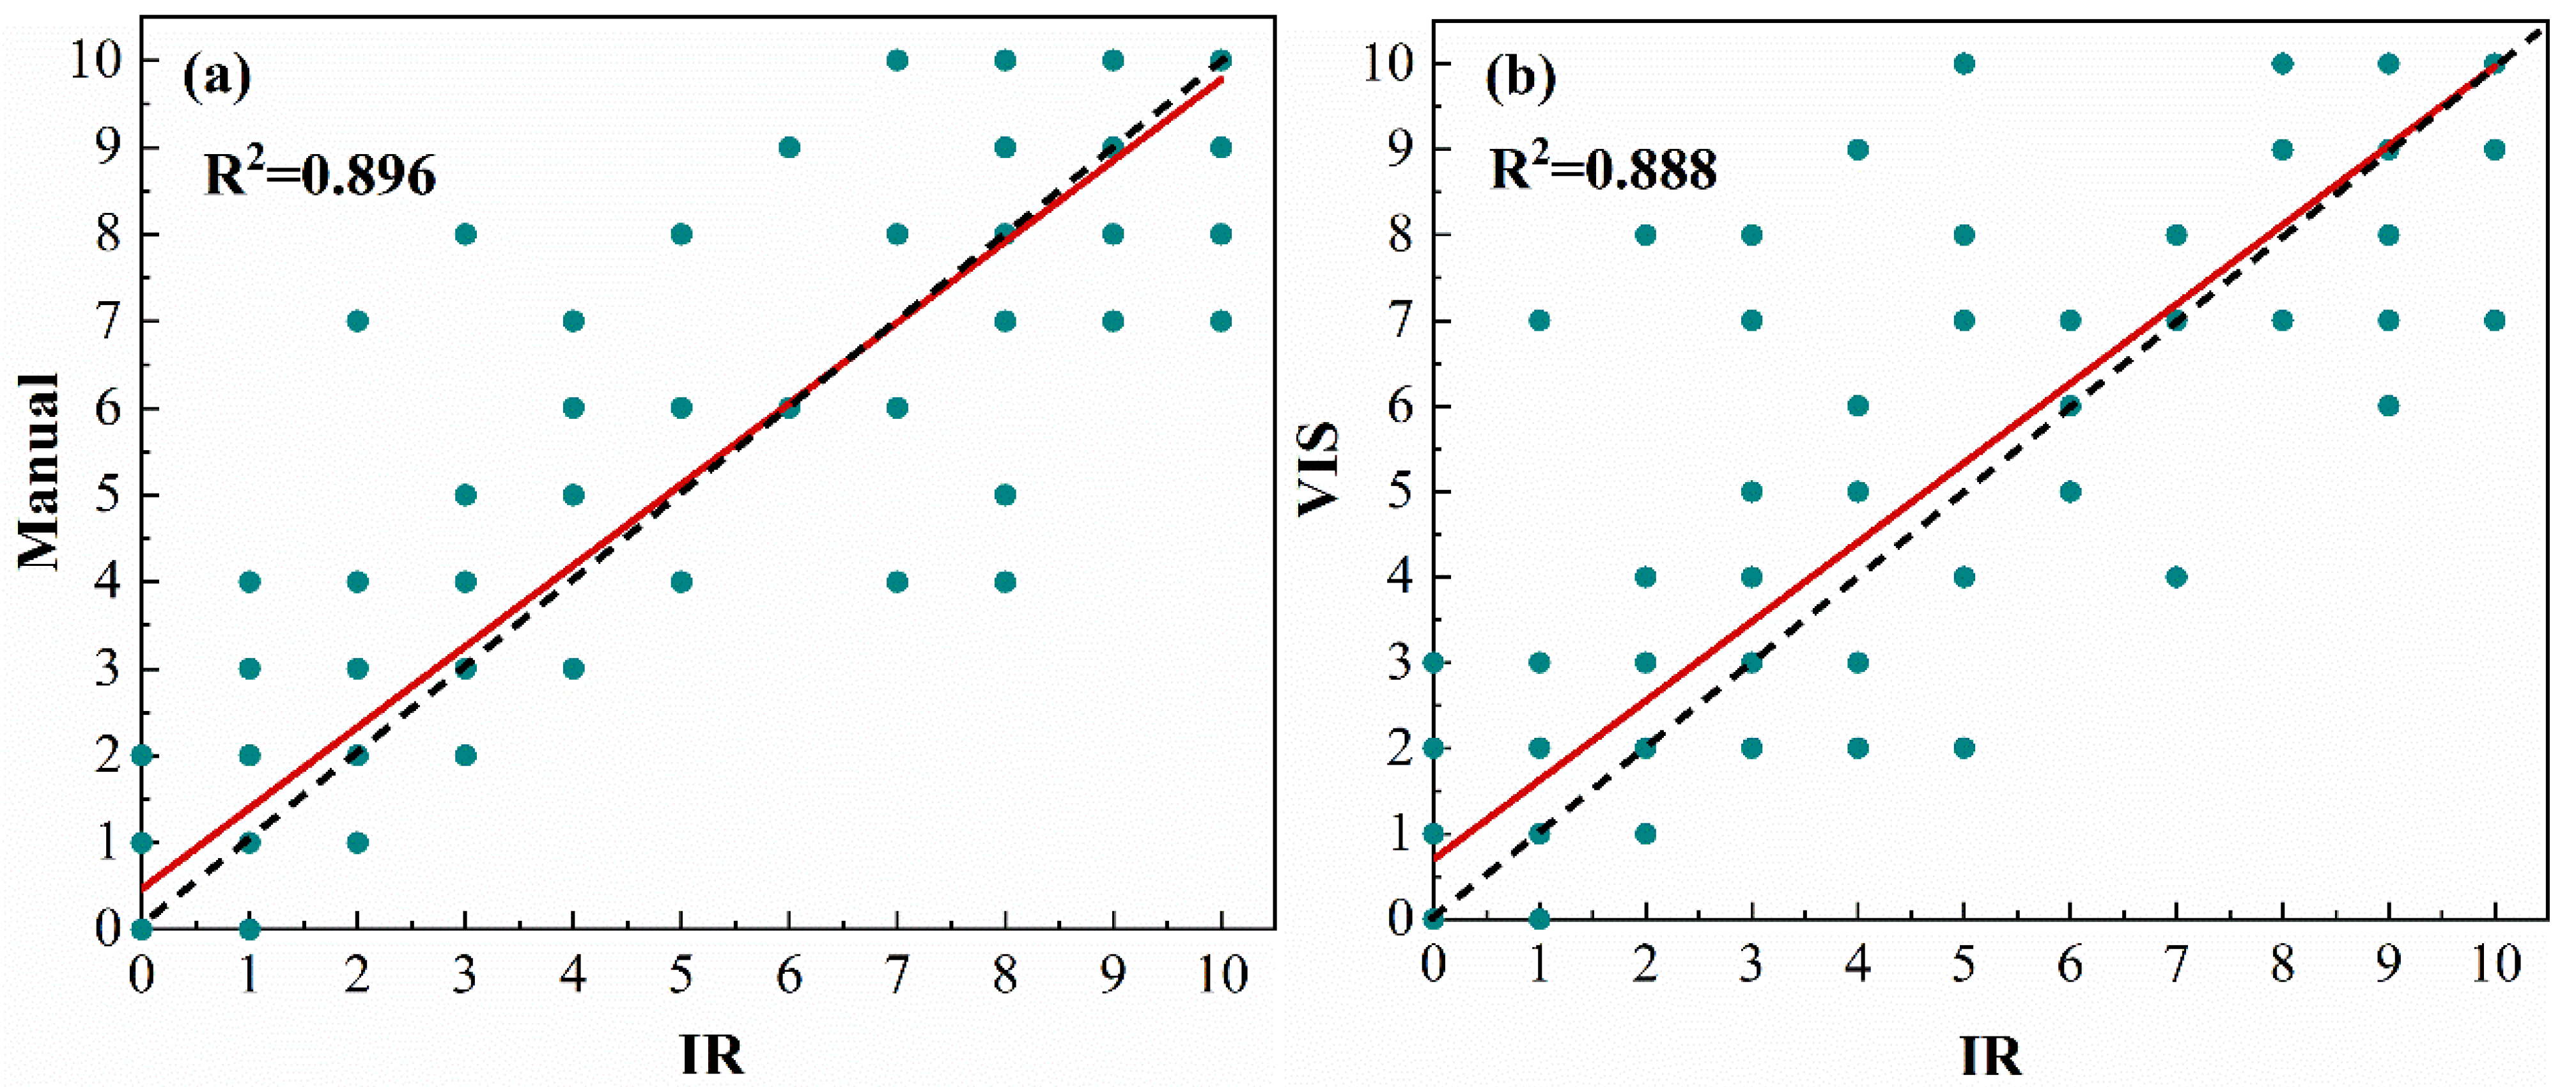
To quantify the accuracy of the TIR camera, the cloud fraction of the TIR camera was matched to the results of visible and manual. To be comparable with the human observation results, the cloud fraction results of both TIR and visible data are divided into integers between zero and ten with the rounding method. Figure 8a,b show the results of fitting the infrared results to the manual and visible results, respectively. Because the rounding method was applied to obtain the cloud fraction of the infrared and the visible images, many groups of cloud fraction data have the same value and overlap in Figure 8. From the fitting results, the coefficient of determination (R squared) of infrared and manual observation is 0.896 (Figure 8a), which is 0.888 (Figure 8b) between infrared and visible results. This indicates that the proposed TIR camera demonstrates good consistency with the manual and the visible images.
Although the cloud fractions of the infrared images have a good correlation with visible and manual observations (consistency rates of this dataset are more than 80%), there are still discrete points that deviate from the 1:1 line. In Figure 8a, the reason for the discrepancy between the infrared and manual results could be the subjective factors affecting the manual results. In Figure 8b, some infrared results are larger than the visible results (points below the 1:1 line), and some are less than the visible results (points above the 1:1 line). Since the results in Figure 8b are not influenced by subjectivity, the reasons for the difference between the infrared and the visible images will be analyzed in the following contents.
On the other hand, in order to make the discrepant cases clearer, the differences between the infrared cloud fraction and the visible and the manual results were counted, as shown in Figure 9. The percentages of the difference of the IR-Manual within zero-ten and one-ten oktas are 64.3% and 16.8%, respectively. Meanwhile, the percentages of the difference of IR-VIS within zero-ten and one-ten oktas are 62.8% and 19.6%, respectively. The percentage of the differences of IR-Manual less than three-ten oktas is 91.2%, and it is 88.3% between the infrared and the visible results. This indicates that most of the results of IR-Manual and IR-VIS are not large, but there are still differences between the infrared and the other two manners. For the purpose of optimizing the ASC-200 system in future research, it is important to analyze the cases with large differences between infrared and visible cloud fractions.
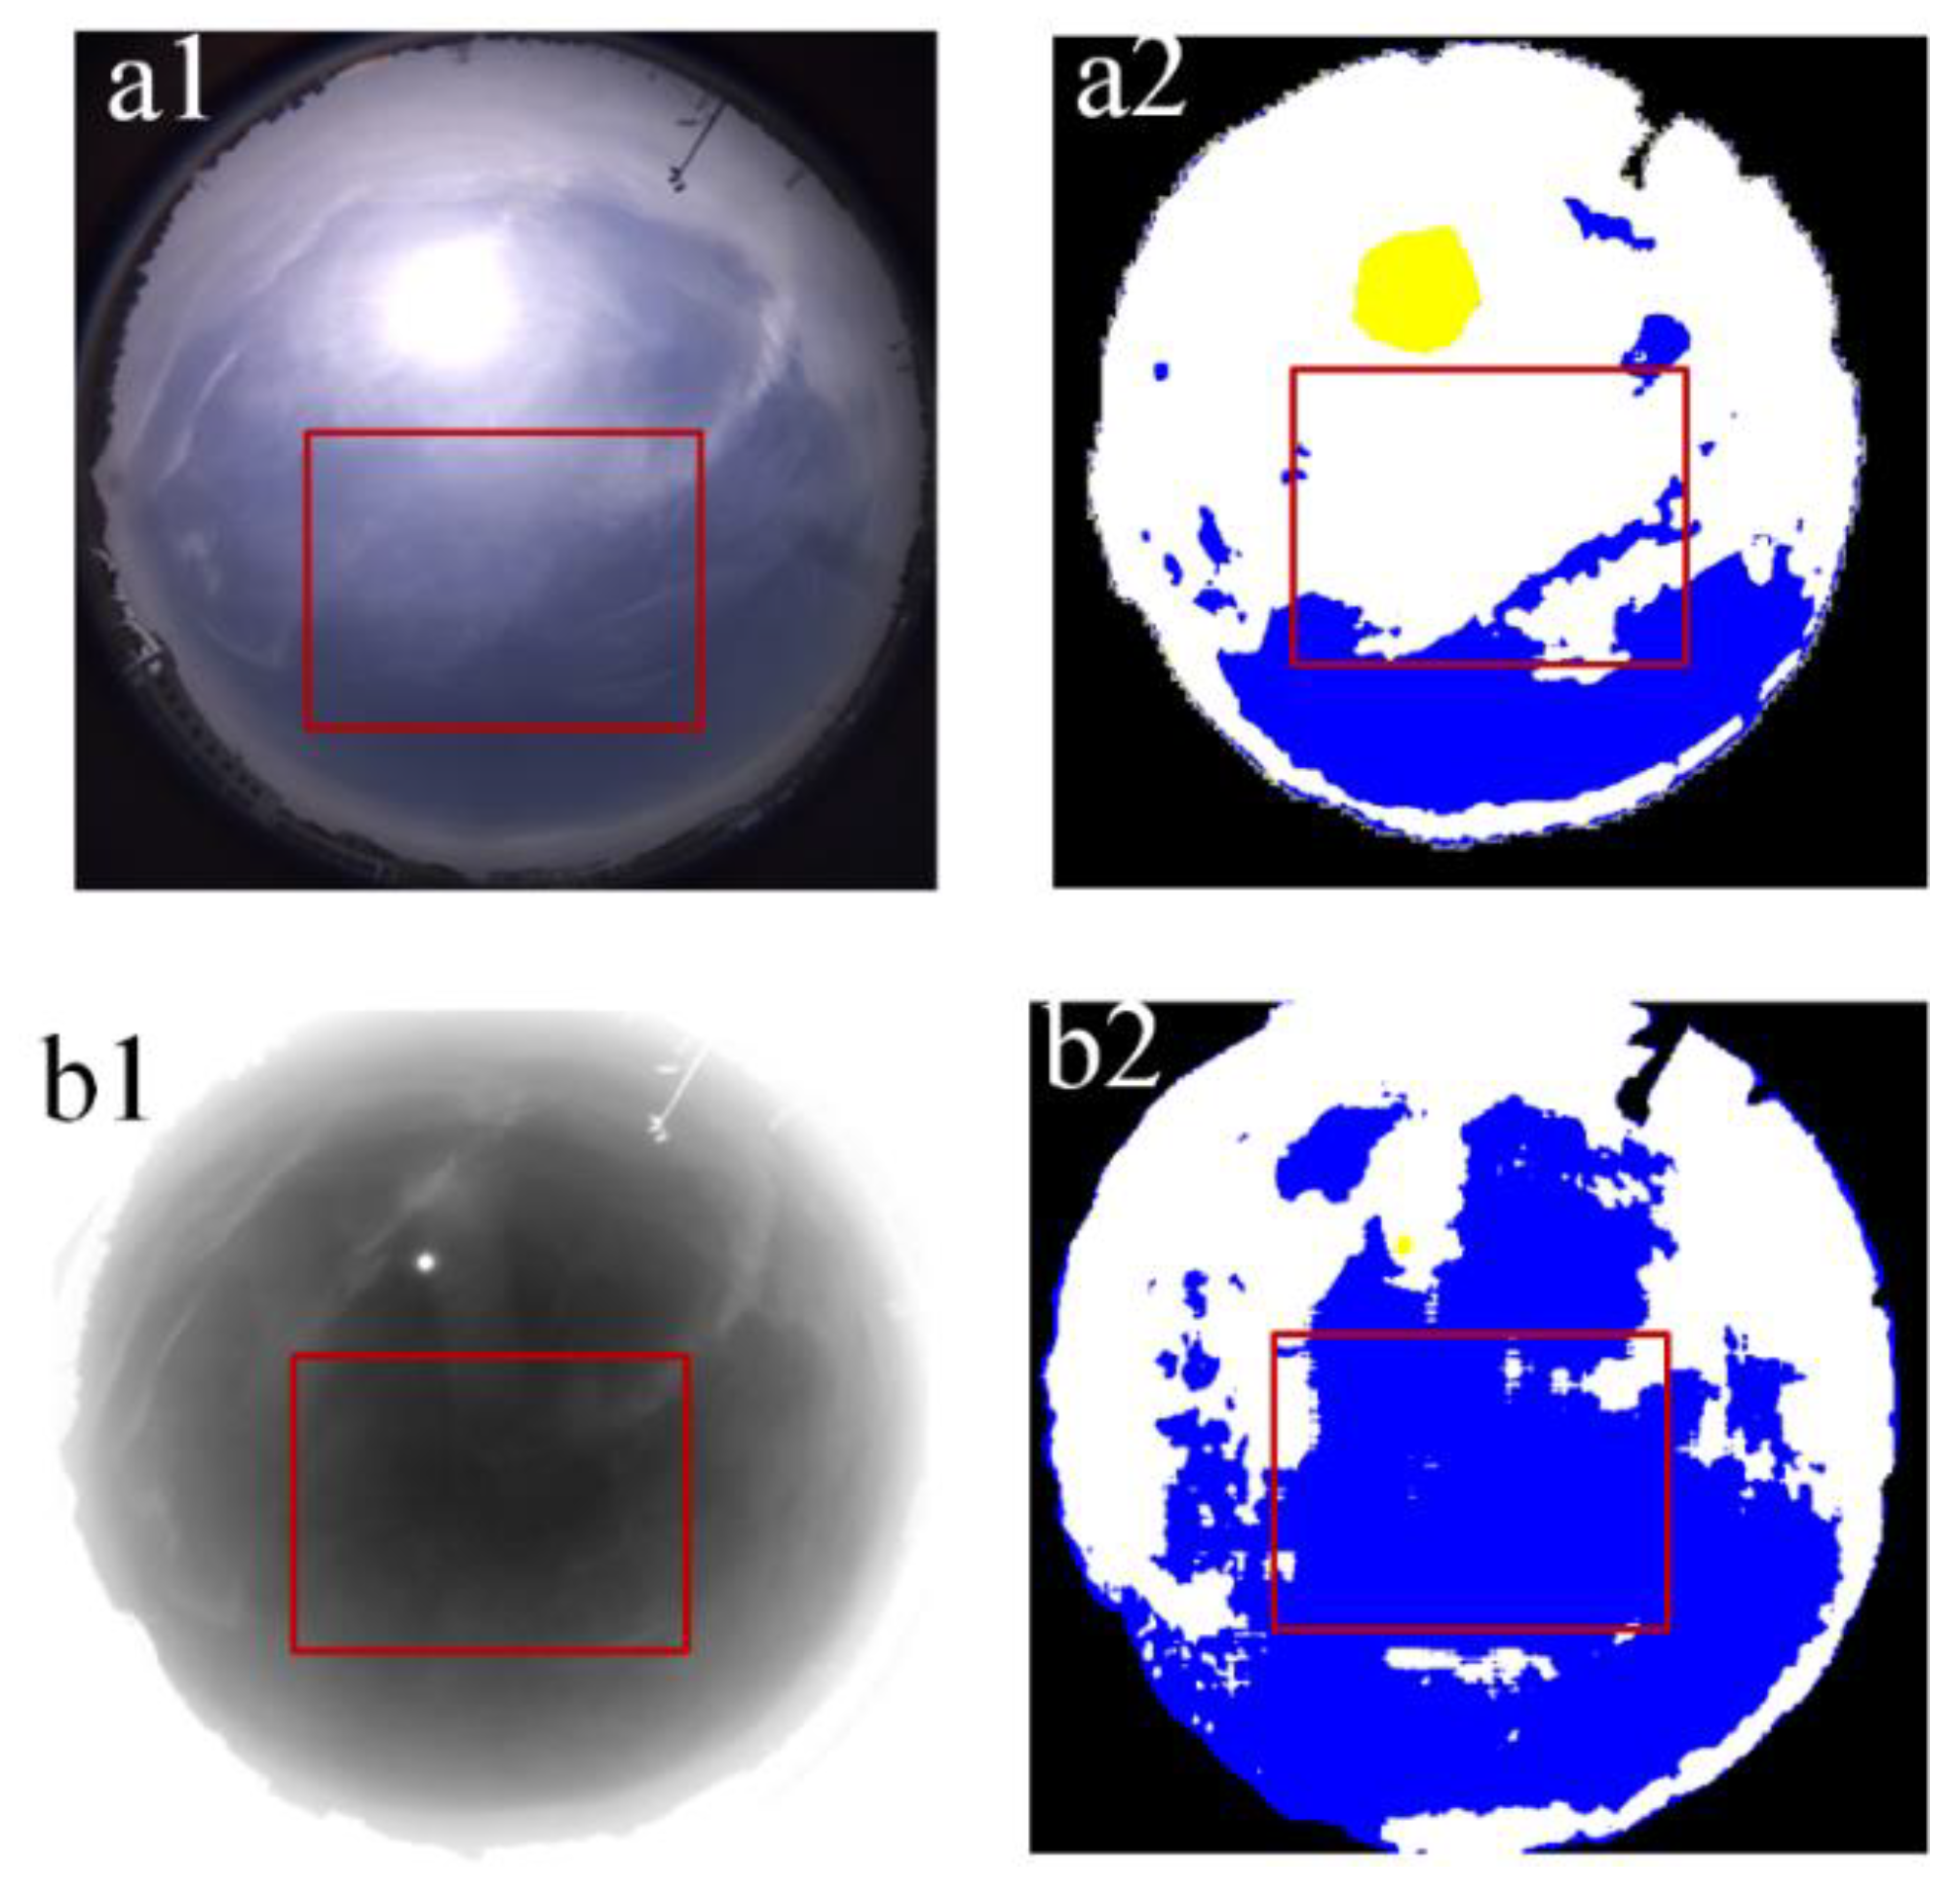
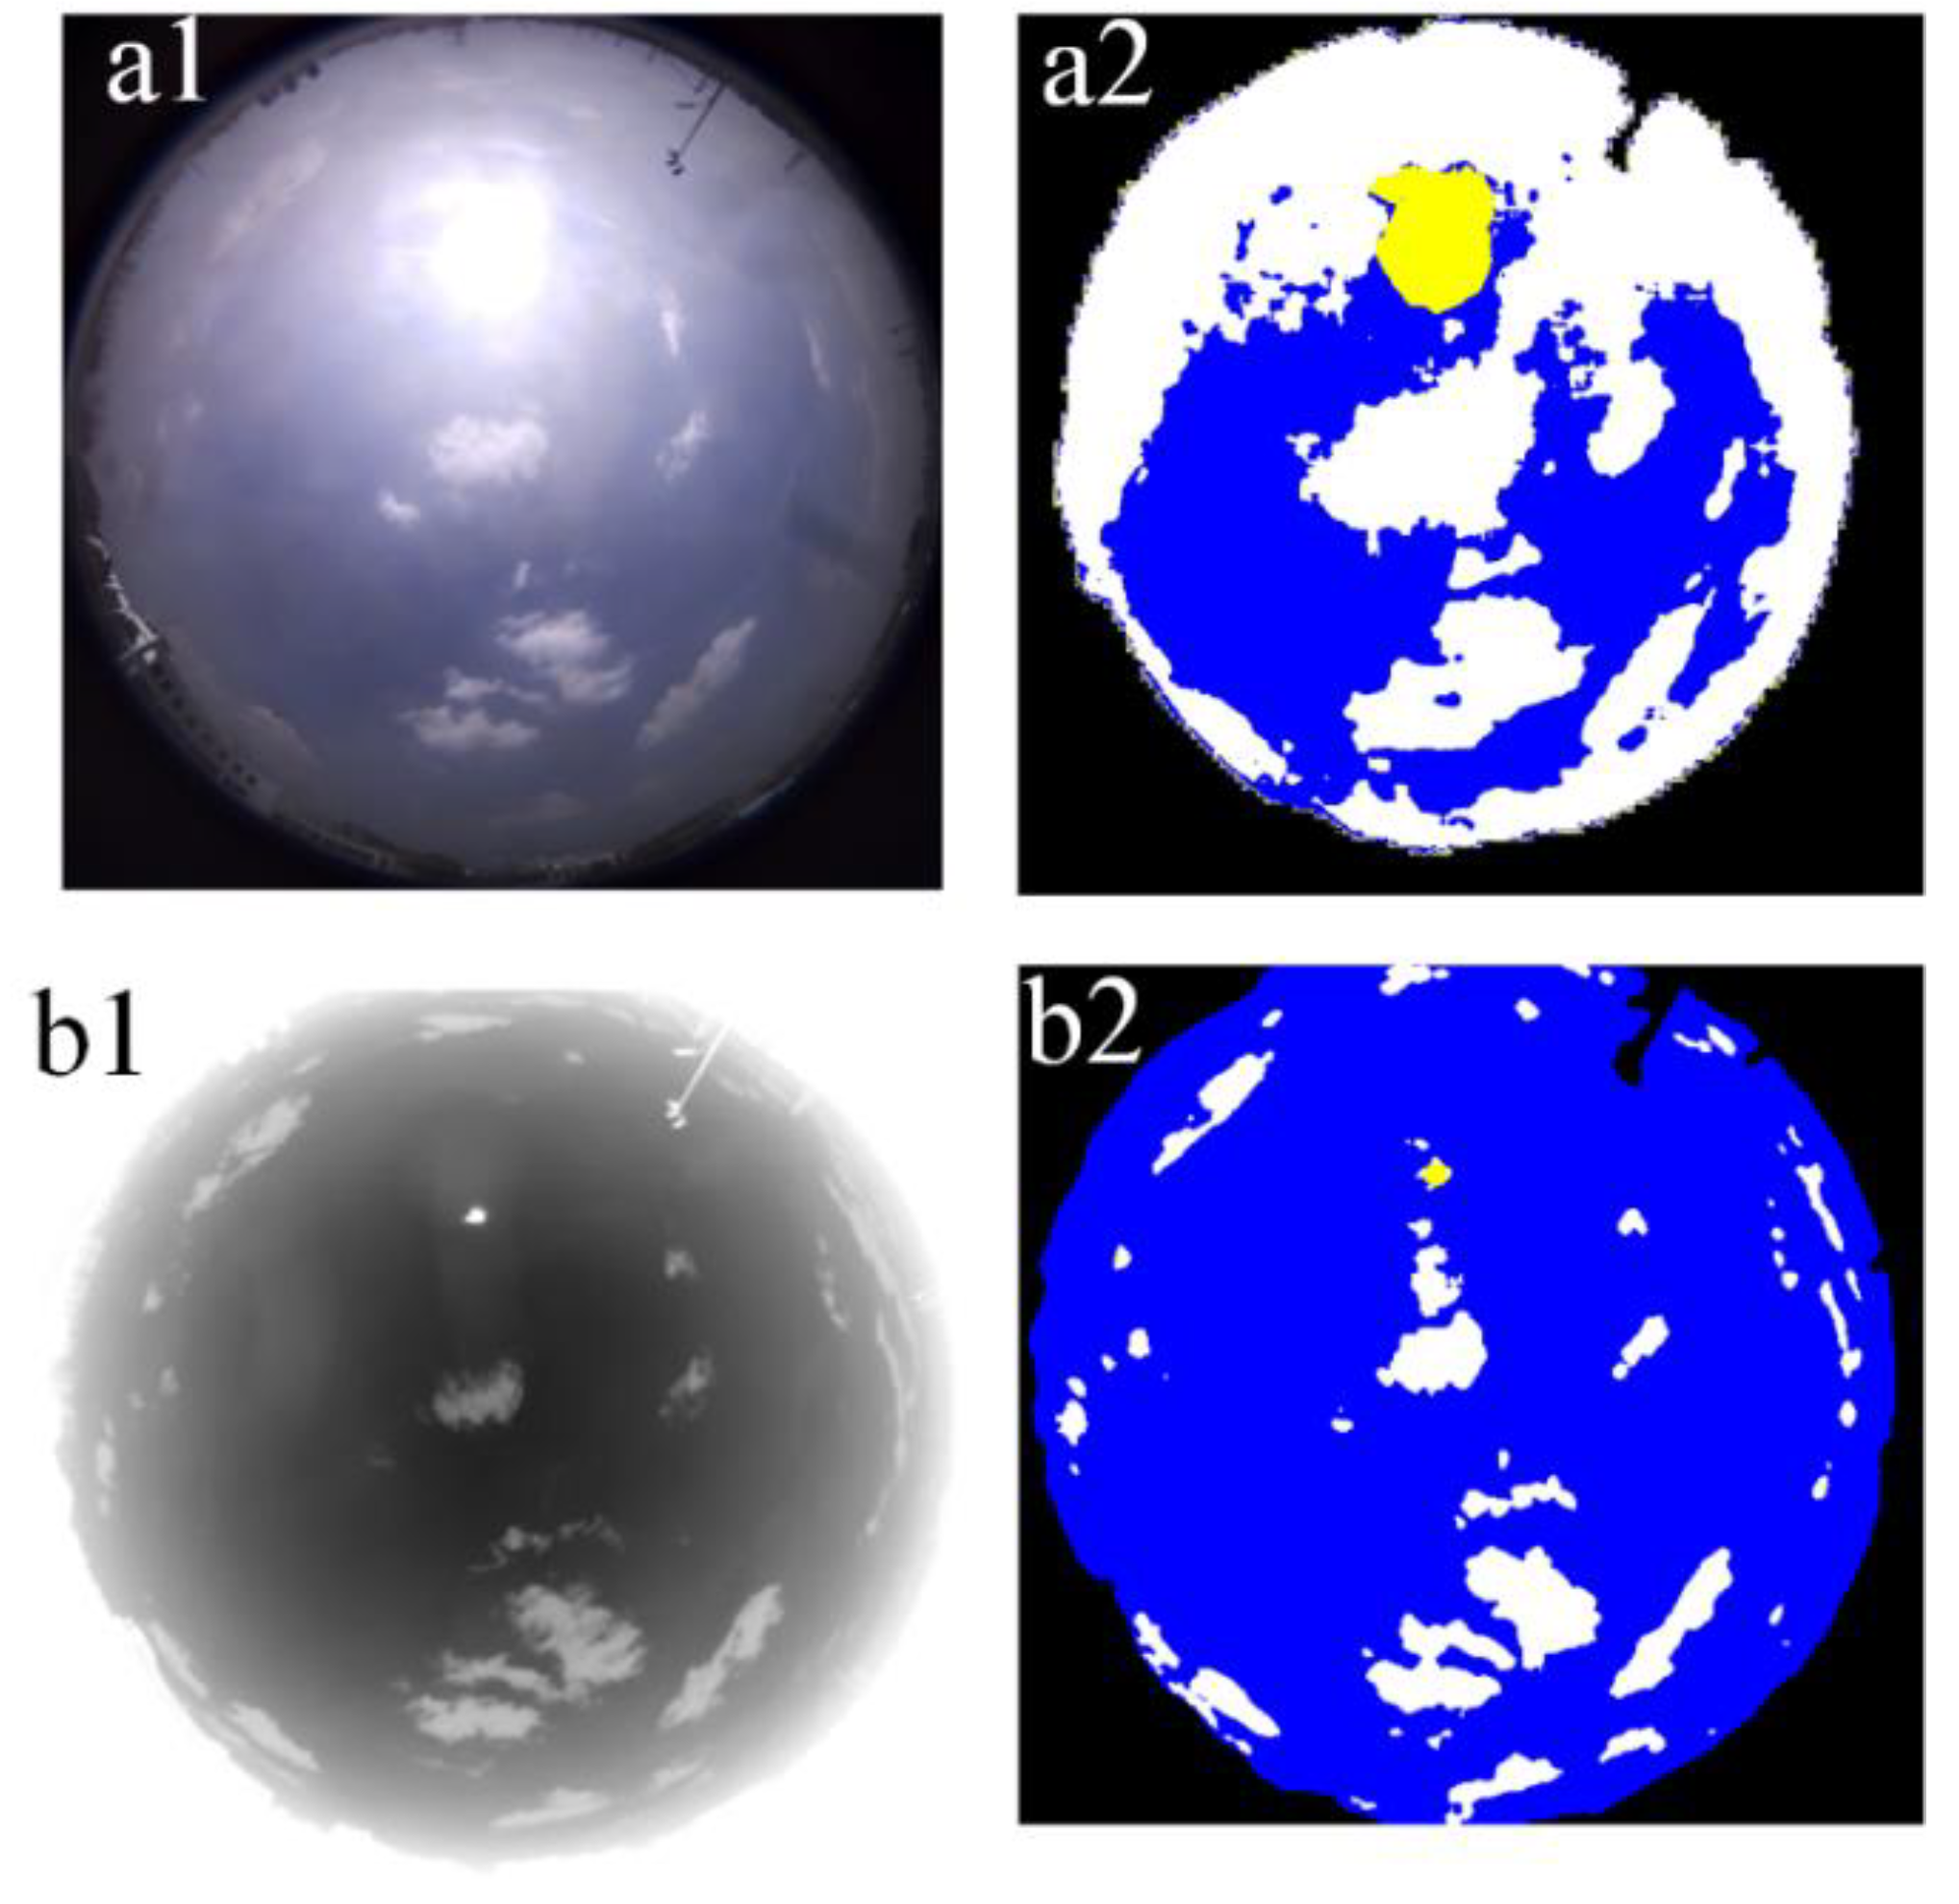
One of the typical cases with a large difference between the infrared and the visible is shown in Figure 10. Figure 10(a1,b1) show the visible and TIR cloud images, respectively, and there is thin cirrus (the area marked with the red boxes) in the sky. Figure 10(a2,b2) are the visible and the infrared clouds detection results, respectively. Using the SegCloud recognition model proposed in our previous study [40], the visible cloud messages can be easily captured (marked with the red box in Figure 10(a2)). In the visible images, the white area represents the cloud information and the blue area represents the sky area, and the yellow area represents the region of the sun. However, it is difficult for the infrared images to identify the cloud region marked with the red box in Figure 10(b2). This is because the TIR camera has poor detection capability for the radiance from cirrus. In this situation, the infrared cloud fraction is less than the visible cloud fraction.
In another situation, as shown in Figure 11, the weather condition is hazy. The visible all-sky image is greatly affected by the existence of aerosols. In Figure 11(a1), due to the presence of aerosols, the whole image seems to be added with a layer of shadow, and the difference between the clouds and the sky area is greatly reduced. In particular, the sky information at the edge of the visible image is completely submerged. As a result, the cloud-free area on the edge of the visible image is mistakenly identified as clouds, such as the detection results in Figure 11(a2). On the contrary, the infrared image at this time is less affected. In Figure 11(b1), the clouds’ texture information can be clearly distinguished at the edge of the infrared image. The cloud pixels of the infrared image can be correctly identified by the proposed clouds discrimination algorithm, and the result is shown in Figure 11(b2). In this situation, the visible cloud fraction is more than the infrared cloud fraction.
Sometimes the scattering of sunlight by particles in the atmosphere causes the all-visible image to glow blue, even in the areas with clouds. In this case, the clouds in the visible image were incorrectly identified as blue sky, resulting in the cloud fraction of visible less than infrared. In addition, the dust protection cover in front of the lens can also lead to a difference in cloud recognition between the visible and infrared images.

4.3. Recognition Accuracy of Different Types of Clouds by Infrared Observation

To analyze differences in cloud fraction of different types of clouds, the cloud fraction data from visible and infrared sky images with different types of clouds were compared in this study. A dataset containing 333 sets of sky images with different cloud types was established with the help of professional meteorological observers and based on the sky visible images (at the same time, the types of clouds in visible and infrared are the same). The dataset was collected at the Anhui Air Traffic Management Bureau in Hefei city for seven months (from 1st June to 31st December 2019 LT). This period is long enough for ASC-200 to capture different types of cloud images. Due to the correlation between cloud type and cloud-based height (CBH), the classification accuracy was improved by using the CBH data, which was measured by the laser ceilometer VAISALA CL31.
In the international cloud classification system published by the World Meteorological Organization (WMO) (1987), clouds are classified into ten types. Based on visual similarity, meteorological observers combined some clouds genera to reduce the chance of error in manual classification. Therefore, the cloud conditions are classified into six categories: altocumulus (AC), cirrus (CI), cumulus (CU), stratocumulus (SC), stratus (ST), and cloud-free (CF). Due to the lack of available data, as well as the difficulty in detecting very thin clouds, some types of cirrostratus were merged, such as the genera CI and cirrostratus. In Table 1, the characteristics of several types of clouds are briefly described. Meanwhile, the CBH data of different types of clouds in the dataset are presented in the table.
The differences in cloud fractions for various visible and infrared clouds are listed in Table 2. The table includes the number of samples and ratios where the difference in cloud fraction between the two wavelength bands is greater than two-ten oktas. As shown in Table 2, when there is cirrus in the sky, the number of samples with the difference of infrared and visible cloud fractions greater than two-ten oktas is 15, accounting for 26% of the total number of samples. In other cases, the number of samples with cloud fraction difference greater than two-ten oktas between the two bands is relatively small. This shows that the consistency of infrared and visible cloud factions for different cloud types is good except for the CI.
The above data analysis indicates that TIR technology is able to obtain reliable cloud fraction data, and the observation results are independent of cloud types, with the exception of thin cirrus clouds. Furthermore, infrared imaging does not vary with sunlight. Therefore, the TIR all-sky-view camera can be used to obtain infrared sky images during the day and night continuously. Especially, aerosols have less impact on infrared imaging; therefore, TIR cameras can provide more accurate cloud information on hazy days. In the practical application, some special problems are usually unavoidable, such as the scattering of sunlight by particles in the atmosphere. Therefore, it is interesting and meaningful to use the information of the infrared and the visible spectra to get more accurate information of the cloud fraction.

5. Conclusions

In this study, a TIR all-sky-view camera and clouds discrimination algorithm was developed for infrared cloud fraction estimation. In contrast to other similar instruments, the TIR camera comprises a high-resolution thermal microbolometer array and a fish-eye lens with a large FOV of over 160°, and it can obtain the all-sky image without scanning and splicing. Therefore, it greatly reduces the complexity of the system and reduces the development and maintenance costs. In addition, the previous visible module is merged to provide a reference for the TIR observation, which formed the second-generation instrument of all-sky-view cameras named ASC-200. The visible subsystem of the ASC-200 works from the local sunrise to sunset time, while the infrared camera can continuously capture images of the sky both during the day and night. The proposed calculation algorithm for the infrared cloud fraction can remove the contamination of the atmospheric emission from the total TIR all-sky raw images. The performance of the algorithm was validated by comparing the cloud fractions retrieved from the visible channel and infrared channel and human observation. The results show good agreement, except for the cirrus clouds due to their weak TIR emissions.
The ASC-200 system has a number of useful benefits for cloud detection, such as the observation area (coverage), image resolution, and observation period. It can be employed in various fields of research, such as atmospheric science, meteorology, civil aviation, and clean energy (solar power stations). Its multi-sensor imaging technique in the infrared and the visible spectra can provide more valuable information to retrieve cloud parameters. At the same time, addressing existing problems of the system, such as solar scattering and haze affecting the visible module, and the TIR module does not detect cirrus with high accuracy, will be an important part of our future work.

Author Contributions

Conceptualization, Y.W. and Y.X.; Data curation, M.Y., X.L. and C.L.; Formal analysis, Y.W. and W.X.; Funding acquisition, D.L., Z.G., Y.H. and Y.L.; Investigation, Y.W. and Y.X.; Methodology, Y.W. and Y.X.; Resources, D.L., Y.L. and Y.X.; Software, Y.W.; Validation, D.L. and W.X.; Visualization, D.L.; Writing—original draft, Y.W.; Writing—review & editing, Y.W., D.L. and W.X. All authors have read and agreed to the published version of the manuscript.

Funding

This work was funded by the International Partnership Program of the Chinese Academy of Sciences, grant number 116134KYSB20180114; the Key Collaborative Research Program of the Alliance of International Science Organizations, grant number ANSO-CR-KP-2020-09; the CASHIPS Director’s Fund, grant number YZJJ2020QN34.

Institutional Review Board Statement

No applicable.

Data Availability Statement

The data presented in this study are available on request from the corresponding author. The data are not publicly available due to privacy restrictions.

Acknowledgments

The authors gratefully acknowledge financial support provided by the Chinese Academy of Sciences and the Alliance of International Science Organizations. Additionally, the authors would like to thank the anonymous reviewers for their constructive comments to improve the paper’s quality.

Conflicts of Interest

The authors declare no conflict of interest.

References

  1. Fu, C.L.; Cheng, H.Y. Predicting solar irradiance with all-sky image features via regression. Sol. Energy 2013, 97, 537–550. [Google Scholar] [CrossRef]
  2. Urquhart, B.; Kurtz, B.; Dahlin, E.; Ghonima, M.; Shields, J.E.; Kleissl, J. Development of a sky imaging system for short-term solar power forecasting. Atmos. Meas. Tech. 2015, 8, 875–890. [Google Scholar] [CrossRef] [Green Version]
  3. Mondragón, R.; Alonso-Montesinos, J.; Riveros-Rosas, D.; Valdés, M.; Estévez, H.; González-Cabrera, A.E.; Stremme, W. Attenuation Factor Estimation of Direct Normal Irradiance Combining Sky Camera Images and Mathematical Models in an Inter-Tropical Area. Remote Sens. 2020, 12, 1212. [Google Scholar] [CrossRef] [Green Version]
  4. Koyasu, T.; Yukita, K.; Ichiyanagi, K.; Minowa, M.; Yoda, M.; Hirose, K. Forecasting variation of solar radiation and movement of cloud by sky image data. In Proceedings of the IEEE International Conference on Renewable Energy Research and Applications (ICRERA), Birmingham, UK, 20–23 November 2016. [Google Scholar]
  5. Yin, B.; Min, Q. Climatology of aerosol and cloud optical properties at the Atmospheric Radiation Measurements Climate Research Facility Barrow and Atqasuk sites. J. Geophys. Res. Atmos. 2014, 119, 1820–1834. [Google Scholar] [CrossRef]
  6. Reinke, D.L.; Combs, C.L.; Kidder, S.Q.; Haar, T.H.V. Satellite Cloud Composite Climatologies: A New High Resolution Tool in Atmospheric Research and Forecasting. Bull. Am. Meteor. Soc. 2010, 73, 278–286. [Google Scholar] [CrossRef] [Green Version]
  7. Mace, G.G.; Benson, S.; Kato, S. Cloud radiative forcing at the Atmospheric Radiation Measurement Program Climate Research Facility: 2. Vertical redistribution of radiant energy by clouds. J. Geophys. Res. Atmos. 2006, 111. [Google Scholar] [CrossRef] [Green Version]
  8. Redman, B.J.; Shaw, J.A.; Nugent, P.W.; Clark, R.T.; Piazzolla, S. Reflective all-sky thermal infrared cloud imager. Opt. Express 2018, 26, 11276–11283. [Google Scholar] [CrossRef] [PubMed] [Green Version]
  9. Ren, R.; Gu, L.; Wang, H. Clouds and Clouds Shadows Detection and Matching in MODIS Multispectral Satellite Images. In Proceedings of the 2012 International Conference on Industrial Control and Electronics Engineering, IEEE, Xi’an, China, 23–25 August 2012. [Google Scholar]
  10. Li, X.; Shen, H.; Zhang, L.; Zhang, H.; Yuan, Q.; Yang, G. Recovering Quantitative Remote Sensing Products Contaminated by Thick Clouds and Shadows Using Multitemporal Dictionary Learning. IEEE Trans. Geosci. Remote Sens. 2014, 52, 7086–7098. [Google Scholar]
  11. Alonso-Montesinos, J. Real-Time Automatic Cloud Detection Using a Low-Cost Sky Camera. Remote Sens. 2020, 12, 1382. [Google Scholar] [CrossRef]
  12. Ghonima, M.S.; Urquhart, B.; Chow, C.W.; Shields, J.E.; Cazorla, A.; Kleissl, J. A method for cloud detection and opacity classification based on ground based sky imagery. Atmos. Meas. Tech. 2012, 5, 2881–2892. [Google Scholar] [CrossRef] [Green Version]
  13. Liu, Y.; Key, J.R.; Wang, X. The influence of changes in cloud cover on recent surface temperature trends in the Arctic. J. Clim. 2008, 21, 705–715. [Google Scholar] [CrossRef]
  14. Naud, C.M.; Booth, J.F.; Del Genio, A.D. The relationship between boundary layer stability and cloud cover in the post-cold-frontal region. J. Clim. 2016, 29, 8129–8849. [Google Scholar] [CrossRef] [PubMed]
  15. Kazantzidis, A.; Tzoumanikas, P.; Bais, A.F.; Fotopoulos, S.; Economou, G. Cloud detection and classification with the use of whole-sky ground-based images. Atmos. Res. 2012, 113, 80–88. [Google Scholar] [CrossRef]
  16. Long, C.; Slater, D.; Tooman, T.P. Total Sky Imager Model 880 Status and Testing Results; Pacific Northwest National Laboratory: Richland, WA, USA, 2001. [Google Scholar]
  17. Kim, B.Y.; Cha, J.W. Cloud Observation and Cloud Cover Calculation at Nighttime Using the Automatic Cloud Observation System (ACOS) Package. Remote Sens. 2020, 12, 2314. [Google Scholar] [CrossRef]
  18. Krauz, L.; Janout, P.; Blažek, M.; Páta, P. Assessing Cloud Segmentation in the Chromacity Diagram of All-Sky Images. Remote Sens. 2020, 12, 1902. [Google Scholar] [CrossRef]
  19. Janout, P.; Blažek, M.; Páta, P. New generation of meteorology cameras. In Photonics, Devices, and Systems VII; International Society for Optics and Photonics: Bellingham, WA, USA, 2017. [Google Scholar]
  20. Román, R.; Antón, M.; Cazorla, A.; de Miguel, A.; Olmo, F.J.; Bilbao, J.; Alados-Arboledas, L. Calibration of an all-sky camera for obtaining sky radiance at three wavelengths. Atmos. Meas. Tech. 2012, 5, 2013–2024. [Google Scholar] [CrossRef] [Green Version]
  21. Cazorla, A. Development of a Sky Imager for Cloud Classification and Aerosol Characterization. Ph.D. Thesis, University of Granada, Granada, Spain, 2010. [Google Scholar]
  22. Dev, S.; Savoy, F.M.; Lee, Y.H.; Winkler, S. Design of low-cost, compact and weather-proof whole sky imagers for High-Dynamic-Range captures. In Proceedings of the 2015 IEEE International Geoscience and Remote Sensing Symposium (IGARSS), Milan, Italy, 26–31 July 2015; pp. 5359–5362. [Google Scholar]
  23. Dev, S.; Savoy, F.M.; Lee, Y.H.; Winkler, S. WAHRSIS: A low-cost high-resolution whole sky imager with near-infrared capabilities. In Infrared Imaging Systems: Design, Analysis, Modeling, and Testing; International Society for Optics and Photonics: Bellingham, WA, USA, 2014. [Google Scholar]
  24. Tao, F.; Xie, W.; Wang, Y.; Xia, Y. Development of an all-sky imaging system for cloud cover assessment. Appl. Opt. 2019, 58, 5516–5524. [Google Scholar]
  25. Thurairajah, B.; Shaw, J.A. Cloud statistics measured with the infrared cloud imager (ICI). IEEE Trans. Geosci. Remote Sens. 2005, 43, 2000–2007. [Google Scholar] [CrossRef]
  26. Sun, X.; Gao, T.; Zhai, D.; Zhao, S.; Lian, J.G. Whole sky infrared cloud measuring system based on the uncooled infrared focal plane array. Infrared Laser Eng. 2008, 37, 761–764. [Google Scholar]
  27. Sun, X.; Liu, L.; Zhao, S. Whole Sky Infrared Remote Sensing of Clouds. Procedia Earth Planet. Sci. 2011, 2, 278–283. [Google Scholar] [CrossRef] [Green Version]
  28. Klebe, D.I.; Blatherwick, R.D.; Morris, V.R. Ground-based all-sky mid-infrared and visible imagery for purposes of characterizing cloud properties. Atmos. Meas. Tech. 2014, 7, 637–645. [Google Scholar] [CrossRef] [Green Version]
  29. Klebe, D.; Sebag, J.; Blatherwick, R.D. All-Sky Mid-Infrared Imagery to Characterize Sky Conditions and Improve Astronomical Observational Performance. Publ. Astron. Soc. Pac. 2012, 124, 1309–1317. [Google Scholar] [CrossRef]
  30. Aebi, C.; Gröbner, J.; Kämpfer, N. Cloud fraction determined by thermal infrared and visible all-sky cameras. Atmos. Meas. Tech. 2018, 11, 5549–5563. [Google Scholar] [CrossRef] [Green Version]
  31. Debevec, P.E.; Malik, J. Recovering high dynamic range radiance maps from photographs. In ACM SIGGRAPH 2008 Classes; Association for Computing Machinery: New York, NY, USA, 2008; pp. 1–10. [Google Scholar]
  32. Shaw, J.A.; Nugent, P.W.; Pust, N.J.; Thurairajah, B.; Mizutani, K. Radiometric cloud imaging with an uncooled microbolometer thermal infrared camera. Opt. Express 2005, 13, 5807–5817. [Google Scholar] [CrossRef] [PubMed]
  33. Nugent, P.W.; Shaw, J.A.; Piazzolla, S. Infrared cloud imaging in support of Earth-space optical communication. Opt. Express 2009, 17, 7862–7872. [Google Scholar] [CrossRef]
  34. Anderson, G.P.; Clough, S.A.; Kneizys, F.X.; Chetwynd, J.H.; Shettle, E.P. AFGL Atmospheric Constituent Profiles (0.120 km); Air Force Geophysics Lab Hanscom AFB MA; No. AFGL-TR-86-0110; Air Force Geophysics Lab: Bedford, MA, USA, 1986. [Google Scholar]
  35. Anderson, G.P.; Berk, A.; Acharya, P.K.; Matthew, M.W.; Bernstein, L.S.; Chetwynd, J.H., Jr.; Jeong, L.S. MODTRAN4: Radiative transfer modeling for remote sensing. In Algorithms for Multispectral, Hyperspectral, and Ultraspectral Imagery VI; International Society for Optics and Photonics: Bellingham, WA, USA, 2000; Volume 4049, pp. 176–183. [Google Scholar]
  36. Shaw, J.A.; Nugent, P.W. Physics principles in radiometric infrared imaging of clouds in the atmosphere. Eur. J. Phys. 2013, 34, S111–S121. [Google Scholar] [CrossRef]
  37. Sun, X.; Qin, C.; Qin, J.; Liu, L.; Hu, Y. Ground-based infrared remote sensing based on the height of middle and low cloud. J. Remote Sens. 2012, 16, 166–173. [Google Scholar]
  38. Smith, S.; Toumi, R. Measuring Cloud Cover and Brightness Temperature with a Ground-Based Thermal Infrared Camera. J. Appl. Meteorol. Climatol. 2008, 47, 683–693. [Google Scholar] [CrossRef]
  39. Nugent, P.W. Wide-Angle Infrared Cloud Imaging for Clouds Cover Statistics. Ph.D. Thesis, Montana State University, Bozeman, MT, USA, 2008. [Google Scholar]
  40. Xie, W.; Liu, D.; Yang, M.; Chen, S.; Wang, B.; Wang, Z.; Xia, Y.; Liu, Y.; Wang, Y.; Zhang, C. SegCloud: A novel clouds image segmentation model using deep Convolutional Neural Network for ground-based all-sky-view camera observation. Atmos. Meas. Tech. 2020, 13, 1953–1954. [Google Scholar] [CrossRef] [Green Version]
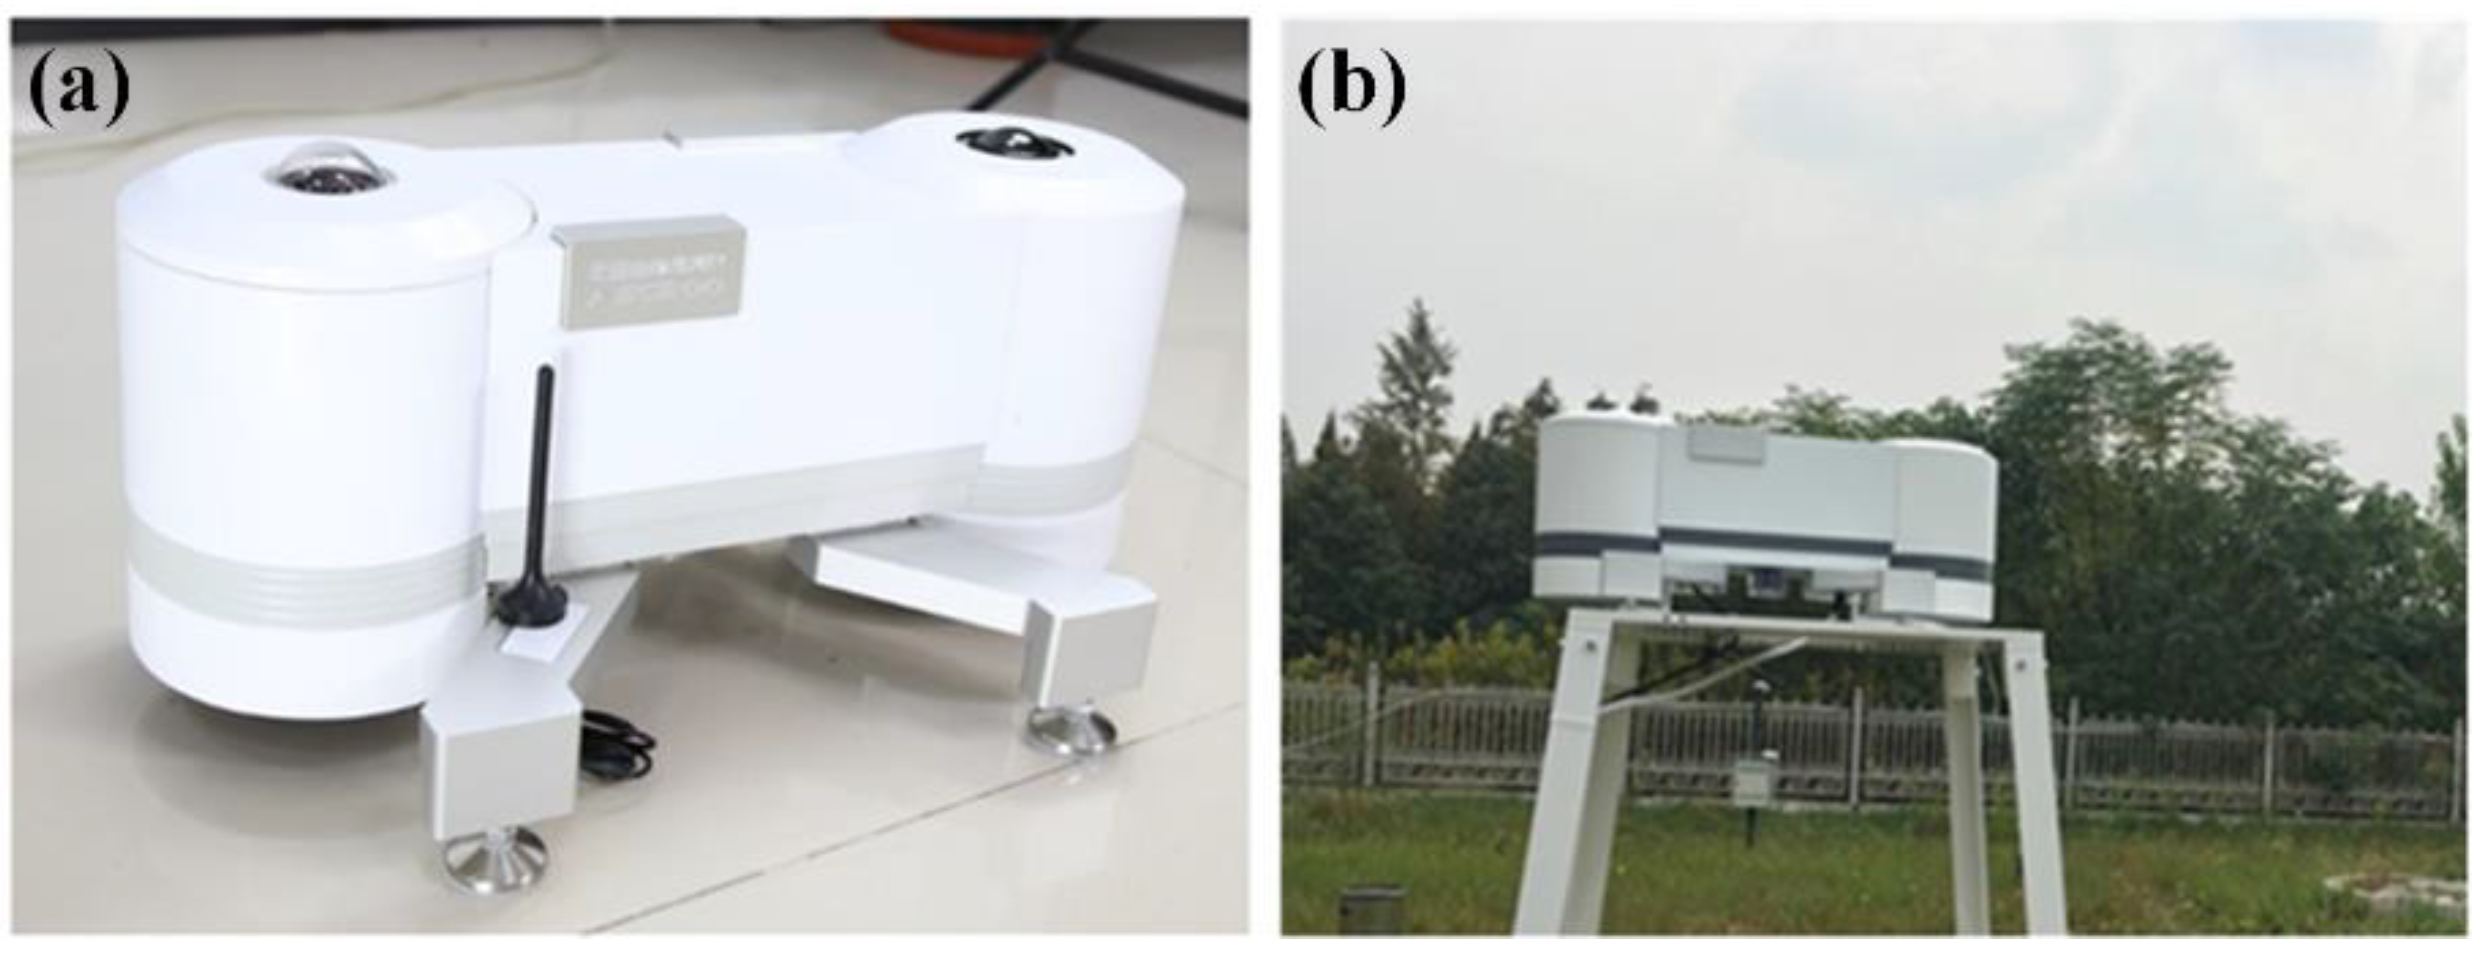
Figure 1. (a) All-sky camera 200 (ASC-200) and (b) ASC-200 in the meteorological observation station.
Remotesensing 13 01852 g001
Figure 2. (a) Thermal-infrared all-sky-view image and (b) visible image at the same time.
Remotesensing 13 01852 g002
Figure 3. Clear-sky downwelling spectrum radiance (red line) and atmospheric transmittance (blue line) versus wavelength, simulated using MODTRAN for the zenith path to space through a 1976 US Standard Atmospheric model.
Remotesensing 13 01852 g003
Figure 4. Variation of atmospheric transmittance with sensor zenith angle.
Remotesensing 13 01852 g004
Figure 5. (a) Infrared raw clear-sky image, (b) measured profiles of the gray value of infrared clear-sky images along one azimuth position at different times on March 12th, 2019, and (c) measured profiles of the gray value of infrared images under different sky conditions.
Remotesensing 13 01852 g005
Figure 6. (a) Measured and modeled profile of the pixel value of clear sky along one azimuth; (b) modeled infrared clear sky image; (c) the framework of the proposed method.
Remotesensing 13 01852 g006
Figure 7. (a1a4) are the original infrared sky images, and (b1b4) show the segmentation results of clouds detection, indicating the clouds (in white) and clear sky (in blue).
Remotesensing 13 01852 g007
Figure 8. Correlation of infrared cloud fraction estimation with (a) manual and (b) visible observation results. The dotted line in the figure represents the 1:1 line, and the solid line represents the fitting line.
Remotesensing 13 01852 g008
Figure 9. Distribution of cloud fraction difference between the infrared and visible (IR-VIS), and the infrared and manual observations (IR-Manual).
Remotesensing 13 01852 g009
Figure 10. Comparison of the cloud detection results of infrared and visible sky image with cirrus in the sky. (a1,b1) show the visible and the TIR cloud images, and (a2,b2) show the results of the cloud identification of the two cloud images.
Remotesensing 13 01852 g010
Figure 11. Comparison of the cloud detection results of infrared and visible images with hazy weather conditions. (a1,b1) show the visible and TIR cloud images, respectively. (a2,b2) are the results of the cloud identification of the two cloud images.
Remotesensing 13 01852 g011
Table 1. Characteristics of various clouds.
Clouds TypesDescriptionClouds-Based Height (m)
ACHigh patched clouds with small cloudlets, mosaic-like, white2700–5500
CIHigh, thin clouds, wisplike or sky covering, whitish6000–7500
CULow, puff clouds with clearly defined edges600–1600
SCLow or mid-level, lumpy layer of clouds, broken to almost overcast700–2400
STLow or mid-level layer of clouds, uniform, generally overcast, gray200–500
Table 2. Consistency of infrared and visible cloud fractions for different cloud types.
Clouds TypesACCICUSCSTCF
Samples585749575260
Diff > 25156020
Ratio8.6%26%12.2%0%3.8%0%
Publisher’s Note: MDPI stays neutral with regard to jurisdictional claims in published maps and institutional affiliations.