Abstract
The rapid urbanization process has threatened the ecological environment. Net primary productivity (NPP) can effectively indicate vegetation growth status in an urban area. In this paper, we evaluated the change in NPP in China and China’s urban lands and assessed the impact of temperature, precipitation, the sunshine duration, and vegetation loss due to urban expansion on NPP in China’s three fast-growing urban agglomerations and their buffer zones (~5–20 km). The results indicated that the NPP in China exhibited an increasing trend. In contrast, the NPP in China’s urban lands showed a decreasing trend. However, after 1997, China’s increasing trend in NPP slowed (from 9.59 Tg C/yr to 8.71 Tg C/yr), while the decreasing trend in NPP in China’s urban lands weakened. Moreover, we found that the NPP in the Beijing–Tianjin–Hebei urban agglomeration (BTHUA), the Yangtze River Delta urban agglomeration (YRDUA), and the Pearl River Delta urban agglomeration (PRDUA) showed a decreasing trend. The NPP in the BTHUA showed an increasing trend in the buffer zones, which was positively affected by temperature and sunshine duration. Additionally, nonsignificant vegetation loss could promote the increase of NPP. In the YRDUA, the increasing temperature was the main factor that promoted the increase of NPP. The effect of temperature on NPP could almost offset the inhibition of vegetation reduction on the increase of NPP as the buffer zone expanded. In PRDUA, sunshine duration and vegetation loss were the main factors decreasing NPP. Our results will support future urban NPP prediction and government policymaking.
1. Introduction
More than 50% of the world’s total population lives in urban areas. According to the World Population Prospects revised by the United Nations in 2017, the world’s urban population will grow to approximately 8.5 billion by 2030 [1]. Population growth and rapid economic development are important factors contributing to the urbanization process, which has become a common phenomenon around the world [2,3,4]. Previous studies have demonstrated that Asia and North America have the most newly urbanized areas. Europe has already been highly urbanized, and the increase in urban area there is the smallest [5]. Urban expansion in China has been most obvious from 2000 to 2010, with the expansion area accounting for approximately 65% of total urban land growth in Asia and 28% of global urban expansion [5].
The rapid urbanization process has led to a series of problems, such as the increased frequency of heatwave events caused by the urban heat island effect [6], a decline in water quality, and an increase in greenhouse gas emissions [2,7,8]. Urban expansion affects the global carbon cycle through the conversion of high-productivity forests or croplands into urban lands, which reduces the carbon sequestration capacity of soils and vegetation and poses a threat to natural resources and food security [3,9,10,11]. Therefore, vegetation plays an irreplaceable role in the human living environment within urban areas [4]. Urban vegetation improves air quality, increases terrestrial carbon sinks, and provides huge psychological and socioeconomic benefits for urban residents [12,13,14]. As an important parameter for monitoring vegetation growth and ecosystem health, net primary productivity (NPP) expresses the amount of carbon fixed by plant communities through photosynthesis per unit of time and space and is of considerable significance to the global terrestrial biosphere carbon cycle [15,16]. Based on long-term NPP data, we can effectively monitor long-term dynamic variations in vegetation in urban areas and assess the impact of urban expansion on the environment and food security [5,9,11].
To assess the growth of vegetation within an urban area, some studies have focused on the impact of urban expansion on NPP in China at different spatiotemporal scales. Tian and Qiao [17] studied the reduction of NPP in China from 1989 to 2000 due to urban expansion. He, et al. [9] analyzed the pressure of urban expansion on food security based on the impact of urban expansion on cropland NPP in China from 1992 to 2015. Additionally, there have been previous studies on typical urban agglomerations in China. For example, Yan, et al. [11] evaluated the impact of urban expansion on NPP in the Pearl River Delta from 2001 to 2009. However, most studies do not examine long-term data sequences from the 1980s to the present. Since the reform and opening of China in 1978, the economy and urban areas have grown rapidly. Monitoring the complete time series of urban NPP in China or Chinese regions can reflect the impact of urban development on vegetation since China’s reform and opening. In addition, most previous studies have used China or a certain region as a research area. However, the NPP differences among different urban agglomerations and whether certain meteorological variables promote urban NPP are still worth discussing. These are of great significance for prediction of future urban differences and for policy formulation.
To assess and monitor long time series of vegetative growth in ecological environments in urban areas, we (1) analyzed the NPP variations within China’s urban areas from 1982 to 2015 based on the urban lands in the 1980s and 2015 and, further (2) separately analyzed the NPP variations in different typical urban agglomerations and their surrounding areas. Finally, (3) we evaluated the importance and contribution of different variables to NPP in these urban agglomerations and surrounding areas.
2. Materials and Methods
2.1. Data Sources
In this study, China’s urban land covers in the 1980s, 1995, 2000, 2005, 2010, and 2015 were obtained from the Chinese land-use/cover dataset (CLUD) [18]. The CLUD is based on a variety of multispectral satellite data, including data from the Landsat multispectral scanner (MSS), thematic mapper (TM), enhanced thematic mapper plus (ETM+), operational land imager (OLI), and the Huanjing-1 (HJ-1) satellite. The land use/land cover (LULC) maps of CLUD were extracted through human-computer interaction and visual interpretation after a series of preprocessing methods [18,19]. Through field surveys, Liu, et al. [18,19] found that the average classification accuracy of the six primary land cover categories (i.e., cropland, forests, grassland, water bodies, built-up land, and unused land) of this dataset reached 94.3% [20,21]. We extracted the urban land boundaries for the 1980s, 1995, 2000, 2005, 2010, and 2015 by converting raster urban land of CLUD to vector urban boundaries using ENVI software. In addition, we clipped NPP data based on urban boundaries in the 1980s and 2015 using ENVI software, and focused on analyzing changes in NPP in these ranges.
In addition, Xu, et al. [21] produced annual 30-m land use/land cover maps of China for 1980–2015 using multisource remote sensing data based on the breaks for additive seasonal and trend (BFAST) algorithm. This dataset provides open access products with a 1 km resolution (http://doi.org/10.5281/zenodo.3923728), in which each pixel value represents the proportion of various LULC types. This dataset is more continuous than the CLUD and corresponds to the annual NPP. We obtained this dataset to represent the dynamic changes in the proportion of land cover types within cities and surrounding areas and explore the impact of changes in LULC on NPP.
We collected monthly meteorological station data from the Chinese National Meteorological Information Center (data.cma.cn) from 1982 to 2015. To explore the importance and contribution of meteorological factors to NPP of urban lands and surrounding areas, the point-based data were spatially interpolated to produce continuous raster images. Firstly, we used stepwise regression in SPSS 22 to construct a three-dimensional quadratic trend surface of the monthly meteorological data and the elevation, longitude and latitude of meteorological stations [22,23]. Secondly, we calculated the spatially gridded simulated meteorological dataset based on the above regression model using the Band math tool in ENVI 5.3. Thirdly, the residual values were calculated by subtracting the simulated values from the actual values. The residual values were spatially interpolated to raster data based on the inverse distance weighted (IDW) method [24] using ArcGIS. Finally, the simulated meteorological raster and residual raster data were added to obtain the monthly spatial meteorological data with a resolution of 1 km. This study aggregated the meteorological data at an annual scale and obtained the annual average air temperature, annual cumulative precipitation, and annual cumulative sunshine duration.
2.2. Annual NPP in China from 1982 to 2015
We collected multiresolution satellite remote sensing (MUSES) global vegetation productivity dataset with a temporal resolution of 8 days and a spatial resolution of 0.05°. The gross primary productivity (GPP) and NPP products of this dataset were estimated with the global land surface satellite (GLASS) leaf area index (LAI)/fraction of absorbed photosynthetically active radiation (FPAR) products and multi-source data synergized quantitative (MuSyQ) algorithm, which is a light use efficiency (LUE) model [25]. Compared with moderate-resolution imaging spectroradiometer (MODIS) LAI/FPAR products, GLASS FPAR/LAI products are more continuous and complete in terms of their temporal and spatial distributions and have better accuracy [26,27]. MuSyQ algorithm integrates high quality GLASS data, and adds clearness index (CI) to LUE estimation [28], which is used to express the effect of the fraction of diffuse solar radiation on LUE, so as to improve the estimation accuracy of GPP and NPP. Validation of the MUSES NPP was carried out using BigFoot NPP data. The objective of BigFoot was to provide ground validation of MODLand (MODIS Land Discipline Group) land cover, leaf area index (LAI), fAPAR, and net primary production (NPP) products. The BigFoot NPP product was an image extrapolated from field measurements based on biome bio-geochemical cycle (Biome-BGC) model, using Landsat ETM+ derived land cover and LAI, tower measured meteorological data and eco-physical parameters [29]. The verification results showed that for the estimated NPP based on the MuSyQ algorithm and BigFoot NPP, the R2 value was 0.80, and the root mean square error (RMSE) was 214.6 g C/m²/yr. Currently, the detailed algorithm and global vegetation productivity products are shared in https://zenodo.org/record/3996814.
This study extracted NPP products for China from 1982 to 2015 and aggregated NPP products with a temporal resolution of 8 days into the annual total NPP.
2.3. Piecewise Regression Analysis
Normally, linear regression is used to analyze the changing trend of a time series. However, previous studies have indicated that ordinary linear regression models cannot describe long-term vegetation changes due to climate change and human activities [30,31,32]. In this study, some linear regression models were transformed into piecewise regression models according to the Akaike information criterion (AIC). The AIC is a standard to measure the goodness of fit of statistical models. The criterion is calculated by the number of parameters (k), residual sum of squares (RSS), and sequence length (n), as shown in Equation (1):
For ordinary linear regression equations, k = 2, and k for the piecewise models is 5. Burnham and Anderson [33] showed that a threshold of −2 for the difference in the AIC between two models could be used to select a better model. In this study, the difference between the AIC of the piecewise and ordinary linear regression models (δAIC = AICpiecewise − AIClinear regression) is less than −2, which means that the piecewise model can better represent the NPP trends and the turning point at which the NPP trend changes are extracted. Conversely, there was no significant difference in NPP changes before and after the turning point.
2.4. Buffer Analysis Based on Urban Lands in 2015
To assess the changes in vegetation growth and ecological environment outside the urban lands and the impact of urban expansion, 5, 10, 15, and 20 km buffer zones of urban lands in 2015 were established separately. This study analyzed the long-term series NPP within the buffer zones (~5–20 km) of urban agglomerations. We investigated the variation in the NPP trend as the buffer zones expanded.
2.5. Variables Importance Assessment Based on Random Forest
To evaluate the degree of influence of different variables on urban NPP, we used a random forest model to calculate the importance of variables. In this study, we selected meteorological data, including the annual average air temperature, the annual cumulative precipitation, the annual cumulative sunshine duration, and the proportion of vegetation (including cropland, forest, and grassland). In each tree of the random forest model, a randomly selected training sample was used to build the tree, and the average increase in the mean square error of the variable was calculated by arranging the out-of-bag data of the variable while keeping the other variables unchanged, thereby measuring the importance of the variables [34,35].
2.6. Contribution of Variables Based on Multiple Regression Model
Taking the annual cumulative precipitation, the annual average air temperature, the annual cumulative sunshine duration, and the proportion of vegetation as input data, the multiple linear regression model can simulate NPP change [30]. We built a multiple linear regression model like Equation (2):
where , , , and represent annual cumulative precipitation, annual average air temperature, annual cumulative sunshine duration, and the proportion of vegetation (including cropland, forest and, grassland) respectively; , , , and represent the regression coefficients corresponding to these variables; c is a constant term; and is an error term. Based on Equation (3), the contribution of different variables to the NPP trends can be estimated as:
where represents different variables, and represents the derivative concerning the time of the product of i and its coefficient in Equation (2). also represents the contribution of variable i to the NPP trends [36]. In this paper, “positive contribution” indicates that the change in the variable could promote the increase of NPP and contribute to the increasing trend of NPP, while “negative contribution” indicates that the change in the variable could inhibit the increase of NPP and contribute to the decreasing trend of NPP. For example, when the of temperature is positive, the change in temperature could promote the increase of NPP and make a positive contribution to the NPP trends.
3. Results
3.1. China’s Urban Area Expansion from the 1980s to 2015
Using CLUD, the area of urban expansion from the 1980s to 2015 was extracted. As shown in Figure 1a, the 12 cities with the largest urban expansion area in China account for 20% of China’s total urban expansion area. Most of these cities belong to the three fastest-growing urban agglomerations in China, namely, the Beijing–Tianjin–Hebei urban agglomeration (BTHUA), Yangtze River Delta Urban Agglomeration (YRDUA), and Pearl River Delta urban agglomeration (PRDUA). From the 1980s to 2015, the urban expansion of these three urban agglomerations was almost equal to that of the 1980s (Figure 1b). According to the above results, in addition to examining China’s overall urban lands, we also selected the BTHUA, YRDUA, and PRDUA as the typical urban agglomerations in China for research. China’s urban land in the 1980s, its urban expansion, and the three urban agglomerations are shown in Figure 2.
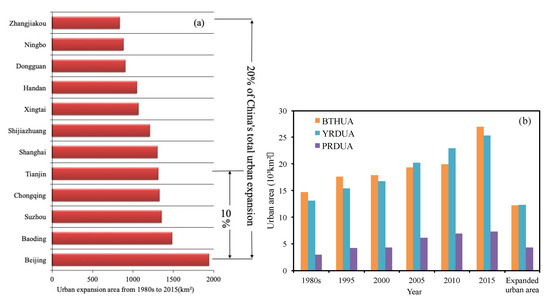
Figure 1.
(a) Changes in urban area from the 1980s to 2015 and (b) changes in the urban area of the three urban agglomerations.
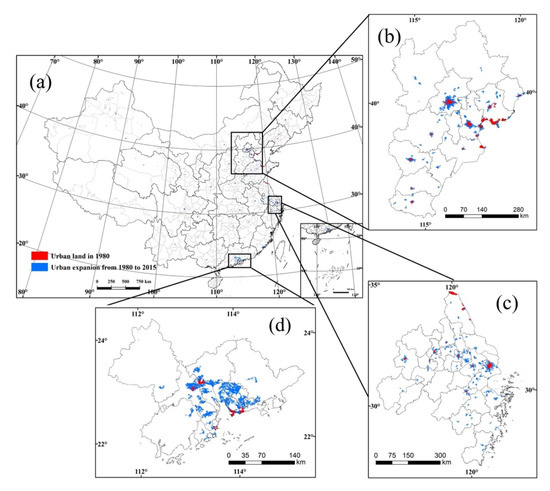
Figure 2.
Urban lands in the 1980s and urban expansion from the 1980s to 2015 in (a) China, (b) the Beijing–Tianjin–Hebei urban agglomeration (BTHUA), (c) the Yangtze River Delta urban agglomeration (YRDUA), and (d) the Pearl River Delta urban agglomeration (PRDUA).
3.2. Spatiotemporal Dynamics of NPP in China from 1982 to 2015
As shown in Figure 3, the annual total NPP in China increased significantly (R2 = 0.84, p < 0.001) at a rate of 17.15 Tg C/yr. Based on piecewise regression, the turning point of the NPP trend was 1997. From 1982 to 1997, the total annual NPP in China increased slightly (R2 = 0.31, p < 0.05) at a rate of 9.59 Tg C/yr. After 1997, the rate of increase in annual total NPP decelerated, reaching 8.71 Tg C/yr, and the trend was significant (R2 = 0.45, p < 0.01).
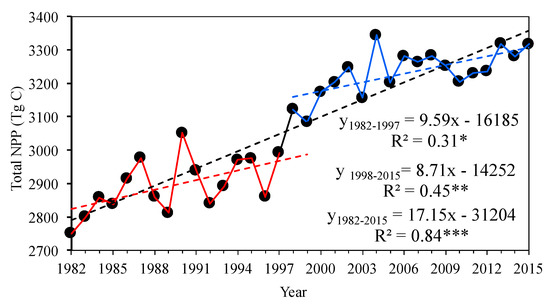
Figure 3.
Trend of annual total net primary productivity (NPP) in China from 1982 to 2015. The mark (***) indicates relative levels of significance with p < 0.001, the mark (**) indicates relative levels of significance with p < 0.01, and the mark (*) indicates relative levels of significance with p < 0.05.
To describe the spatial patterns of NPP variation, the trend from 1982 to 2015 was analyzed at a pixel level (Figure 4). The NPP presented an increasing trend in most areas of China, and the pixels whose NPP change rate was greater than 5 g C/m²/yr were mainly distributed in the central, eastern, and southern regions. Moreover, the pixels with a decreasing NPP trend were mainly distributed in northern and northwest China and in the Yangtze River Delta and Pearl River Delta regions along the coast. Among them, the NPP in the Yangtze River Delta and Pearl River Delta decreased significantly (p < 0.001), and the decreasing NPP trend was greater than 10 g C/m²/yr.
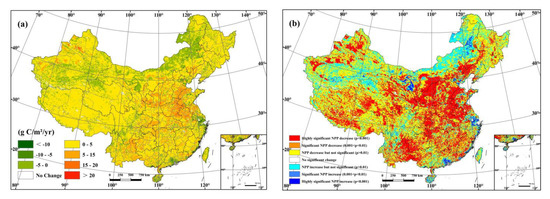
Figure 4.
(a) Slope of NPP obtained from the regression of each single pixel during the period of 1982 to 2015 and (b) the relative levels of significance.
3.3. Annual NPP of Urban Lands in China from 1982 to 2015
In this study, the urban lands extracted from CLUD data for the 1980s and 2015 were used to evaluate long-term NPP variations in China’s urban lands. The 1980s urban lands can represent permanent urban lands, and the NPP variations within these areas can reflect the vegetation changes caused by urban development and greening. The 2015 urban lands were utilized to study the trend in NPP caused by urbanization processes.
As shown in Figure 5a,b, the total NPP and average NPP variations based on the urban lands in the 1980s and 2015 were determined. In Figure 5a, the total NPP of the 1980s and 2015 urban lands both showed a slightly decreasing trend. However, within the 2015 urban lands, the total NPP decrease rate was −0.0185 Tg C/yr, which is higher than that of the 1980s (−0.0034 Tg C/yr). The average NPP has the same trend as the total NPP, and the decrease rates of the average NPP within the 1980s and 2015 urban lands were −0.2081 g C/m2/yr and −0.3355 g C/m2/yr, respectively.
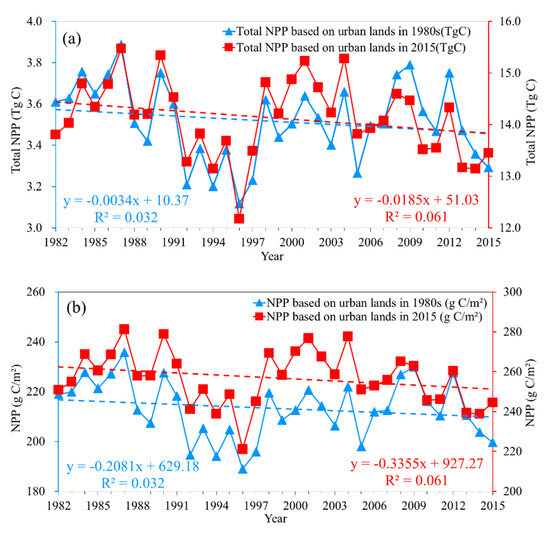
Figure 5.
(a) Total NPP trend and (b) average NPP trend based on urban lands in the 1980s (blue lines, left-hand vertical axis) and 2015 (red lines, right-hand vertical axis).
According to the trend of the annual total NPP in China (Figure 3) and the 2015 urban lands (Figure 5a), from 1982 to 2015, China’s NPP increased by 566.23 Tg C, while the NPP based on the 2015 urban lands decreased by 0.36 Tg C, accounting for 0.063% of China’s NPP growth. According to the piecewise regression model, 1997 was extracted as the turning point of the time series. From 1982 to 1997, China’s NPP increased by 241.06 Tg C, while the NPP based on the 2015 urban lands decreased by 0.32 Tg C, accounting for 0.13% of China’s NPP growth. From 1998 to 2015, China’s NPP growth rate slowed, with an increase of 195.98 Tg C, while the NPP based on 2015 urban lands decreased by 1.37 Tg C, accounting for 0.70% of China’s NPP growth. From the change in average NPP based on the 1980s urban lands, the rate of NPP change from 1982 to 1997 was −2.31 g C/m²/yr, while from 1998 to 2015, the rate became −0.21 g C/m²/yr. This result indicated that the decreasing NPP trend for the permanent urban lands weakened, and the ecological environment improved. From the average NPP based on the 2015 urban lands, the NPP change rates in the two periods from 1982 to 1997 and 1998 to 2015 were −1.80 g C/m²/yr and −1.66 g C/m²/yr, respectively, and the rate of decrease was also slightly reduced.
To explore the spatial distribution of land use types converted to urban lands, changes in land cover types were extracted within the 2015 urban lands based on CLUD. As shown in Figure 6, China’s urbanization took up a large amount cropland. In 2015, 72.85% of urban lands were converted from cropland, and these urban lands were mainly distributed in the central and eastern regions of China. Additionally, 9.68% and 9.21% of urban lands were converted from forest and grassland, respectively, mainly distributed in the northern and southern regions of China.
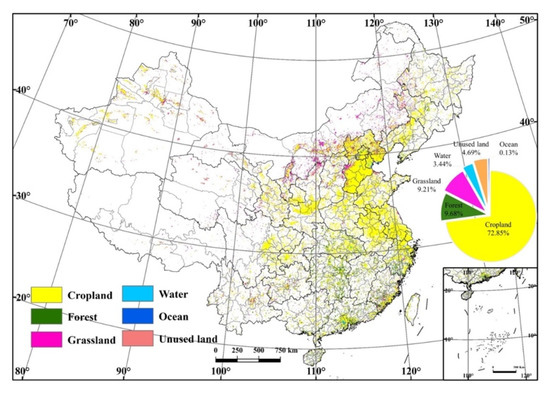
Figure 6.
Spatial distribution of land use types converted to urban lands. Displayed by land use type with the largest proportion in 3 × 3 km pixels.
3.4. Spatiotemporal Distribution of NPP in Three Urban Agglomerations in China
In this study, the difference between NPP in 2015 and 1982 was used to explore NPP changes within urban lands in 2015. As shown in Figure 7, the regions with a significant decrease in NPP were mainly distributed in the central cities of urban agglomerations, such as Beijing in the BTHUA (Figure 7a), Shanghai in the YRDUA (Figure 7b), and Guangzhou and Foshan in the PRDUA (Figure 7c). In the areas surrounding the central cities of urban agglomerations, the NPP reduction decreased, and many regions even showed an increasing trend.
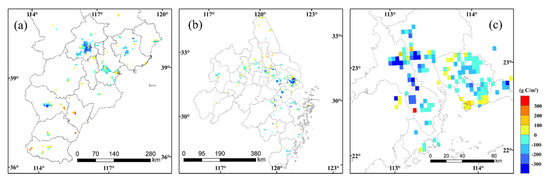
Figure 7.
NPP difference between 1982 and 2015 in (a) the BTHUA, (b) the YRDUA, and (c) the PRDUA within urban lands in 2015.
The NPP trends between 1982 and 2015 in the BTHUA, the YRDUA, and the PRDUA within urban lands in 2015 are shown in Figure 8. The NPP values of the three urban agglomerations present a decreasing trend. Specifically, the NPP in the BTHUA has a slightly decreasing trend, with a rate of change of −1.67 g C/m²/yr. The NPP values in the YRDUA and PRDUA both had significantly decreasing trends, with rates of −2.45 g C/m²/yr and −4.18 g C/m²/yr, respectively.
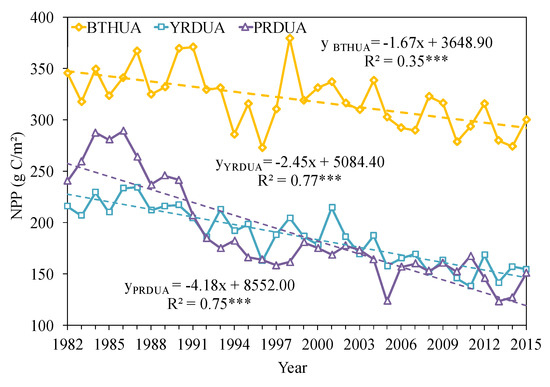
Figure 8.
NPP trends between 1982 and 2015 in the BTHUA, YRDUA, and PRDUA within urban lands in 2015. The mark (***) indicates relative levels of significance with p < 0.001.
The buffer analysis results indicated the NPP trends in different buffer zones of three urban agglomerations based on urban lands in 2015 (Figure 9). As shown in Figure 9a, the NPP variations in buffer zones of urban lands in the BTHUA indicated that the NPP increased in different buffer zones. With the expansion of the buffer zone in the BTHUA, the NPP trend changed from a nonsignificant (p > 0.1) increase to a significant (p < 0.001) increase. The rate of change increased from 0.6734 g C/m²/yr to 2.8977 g C/m²/yr. For the YRDUA (Figure 9b), the NPP significantly decreased (p < 0.001) in the 5 km buffer zone, with a change rate of −1.7282 g C/m2/yr. As the buffer zone expanded to 15 km, the NPP decreased, but not significantly (p < 0.01). The change rates for the 10 km and 15 km buffer zones were −1.0591 g C/m2/yr and −0.4442 g C/m2/yr, respectively. However, when the buffer zone expanded to 20 km, the NPP showed a slightly increasing trend (p < 0.1), where the change rate was 0.042 g C/m2/yr. Unlike the BTHUA and the YRDUA, the NPP in the PRDUA buffer zones showed a significantly decreasing trend (p < 0.001), with a decreasing rate from −3.1007 g C/m2/yr to −1.7506 g C/m2/yr.
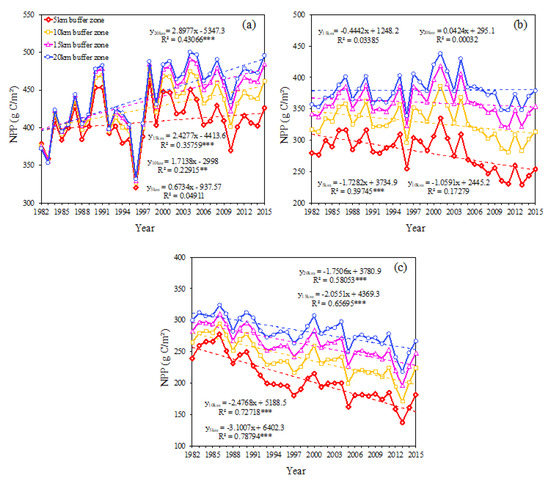
Figure 9.
The NPP trends in the buffer zones (~5–20 km) based on urban lands in 2015 between 1982 and 2015 in (a) the BTHUA, (b) the YRDUA, and (c) the PRDUA. The mark (***) indicates a relative level of significance where p < 0.001, and the mark (**) indicates a relative level of significance p < 0.01.
3.5. Changes in Multiple Variables Affecting NPP in Three Urban Agglomerations in China
In addition, we analyzed changes in multiple variables including the annual cumulative precipitation, the annual average air temperature, the annual cumulative sunshine duration, and the proportion of vegetation in the urban lands, 5 km buffer zone, 10 km buffer zone, and 20 km buffer zone of the BTHUA, the YRDUA, and the PRDUA (Figure 10).
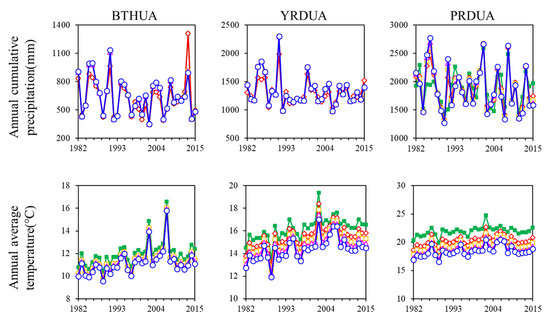
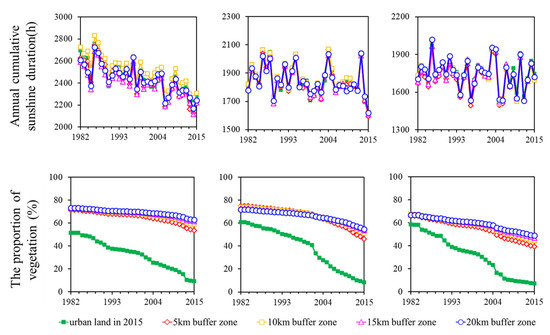
Figure 10.
The annual cumulative precipitation, the annual average air temperature, the annual cumulative sunshine duration, and the proportion of vegetation in the BTHUA, the YRDUA, and the PRDUA.
In the BTHUA, precipitation, sunshine duration, and proportion of vegetation all showed a decreasing trend, while temperature showed an increasing trend. Specifically, the average annual cumulative precipitation in the BTHUA was less than in other urban agglomerations. From urban lands to the 20 km buffer zone, the decreasing trend of precipitation was accelerated from −1.75 mm/yr to −4.51 mm/yr. In addition, the increasing trend of temperature slowed down, from 0.050 °C/yr to 0.047 °C/yr. The sunshine duration decreased significantly, and the decreasing trend was the fastest in the 5 km buffer zone, which was −12.23 h/yr. In the BTHUA and its buffer zones, cropland accounted for the vast majority of vegetation. With urban expansion, the proportion of vegetation in urban lands was rapidly decreasing at a rate of −1.27%/yr. From the 5 km to 20 km buffer zone, although the proportion of vegetation still showed a decreasing trend, the rate of decrease was relatively low, which was only −0.27%/yr in the 20 km buffer zone.
In the YRDUA, the precipitation showed a decreasing trend. Although the decreasing trend of precipitation was faster than that in the BTHUA, the average annual cumulative precipitation was higher than that in the BTHUA. The temperature showed an increasing trend. From urban lands to the 20 km buffer zone, the increasing trend of temperature was slowed down, from 0.061 °C/yr to 0.056 °C/yr. The sunshine duration in urban lands and buffer zones had a similar decreasing trend, and the rate decrease was slower than that in the BTHUA. For the proportion of vegetation, it decreased at a rate of −1.78%/yr in urban lands. Although the rate of vegetation reduction slowed down from −0.81%/yr in the 5 km buffer zone to −0.48%/yr in the 20 km buffer zone, it was still faster than that in the BTHUA.
In the PRDUA, the precipitation showed an increasing trend in urban lands, but it showed a decreasing trend in the buffer zones. The temperature in urban lands was higher than that in the buffer zones, and they increased at almost the same rate (around 0.04 °C/yr). The sunshine duration showed a decreasing trend, and its decreasing rate was the slowest among the three urban agglomerations. Moreover, forest and cropland were the main vegetation types in the PRDUA, and the proportion of forest was higher than that in other urban agglomerations. It was obvious that urban expansion had a great impact on the vegetation in the PRDUA. Whether in urban land or its buffer zones, the proportion of vegetation decreased rapidly. Even in the 20 km buffer zone, the proportion of vegetation was still decreasing at a rate of −0.54%/yr, which was higher than that in other two urban agglomerations.
3.6. The Importance of Multiple Variables to the NPP of the Three Urban Agglomerations
Moreover, we evaluated the importance of the annual cumulative precipitation, the annual average air temperature, the annual cumulative sunshine duration, and the proportion of vegetation to the NPP in the urban lands, 5 km buffer zone, 10 km buffer zone, and 20 km buffer zone of the BTHUA, the YRDUA, and the PRDUA (Figure 11).
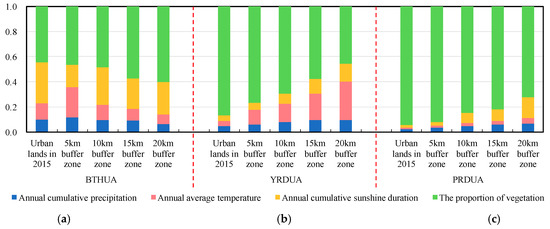
Figure 11.
The importance to NPP of the annual cumulative precipitation, the annual average air temperature, the annual cumulative sunshine duration, and the proportion of vegetation in urban lands in 2015, also including the 5 km buffer zone, 10 km buffer zone, and 20 km buffer zone of (a) the BTHUA, (b) the YRDUA, and (c) the PRDUA.
In the BTHUA, the importance of the annual cumulative sunshine duration to the NPP of urban lands, which was 0.33, was significantly higher than that of other environmental variables. The importance of the three meteorological variables to NPP in urban lands was dominant, with a sum of 0.56. The importance of the proportion of vegetation here was 0.44. However, in the ~5–20 km buffer zones, the importance of the three meteorological variables to NPP gradually decreased, while the importance of the proportion of vegetation increased. Among them, the importance to NPP of both the annual cumulative precipitation and the annual average air temperature in the 20 km buffer zone was less than 0.1 (0.065 and 0.073 respectively), and the importance of the proportion of vegetation reached 0.6.
In the YRDUA, the importance of the three meteorological variables to NPP increased linearly with the expansion of the buffer zones. The corresponding change in the importance of the proportion of vegetation was opposite to that in the BTHUA and gradually decreased. In urban lands, the proportion of vegetation was the most important of all variables for NPP, and its importance reached 0.87. In the 20 km buffer zone, its importance decreased significantly, reaching 0.46. Noticeably, the importance of the annual average air temperature increased significantly among the three meteorological variables. In urban lands, its importance was only 0.04, but in the 20 km buffer zone, its importance to NPP rose to 0.3.
In the PRDUA, the changing trend of the importance to NPP of the meteorological variables and of the proportion of vegetation were similar to those in the YRDUA. However, the importance of the proportion of vegetation decreased with the expansion of the buffer zone, but its importance was still 0.72 in the 20 km buffer zone. In urban land, its importance to NPP was as high as 0.94, occupying an absolute dominant status. Among meteorological variables, although the importance of the annual cumulative precipitation and the annual average air temperature increased with the expansion of the buffer zone, their importance was still less than 0.1 in the 20 km buffer zone (0.07 and 0.04, respectively). Compared with the other two meteorological variables, the importance to NPP of the annual cumulative sunshine duration increased the most, from 0.02 to 0.17.
3.7. The Contribution of Multiple Variables to the NPP Trends of the Three Urban Agglomerations
To evaluate the contribution of environmental variables to the NPP trends, we established a fitting relationship between multiple variables and NPP based on the multiple linear regression model, and estimated the contribution of the variable to the NPP trends through the regression coefficients of each variable (Figure 12).
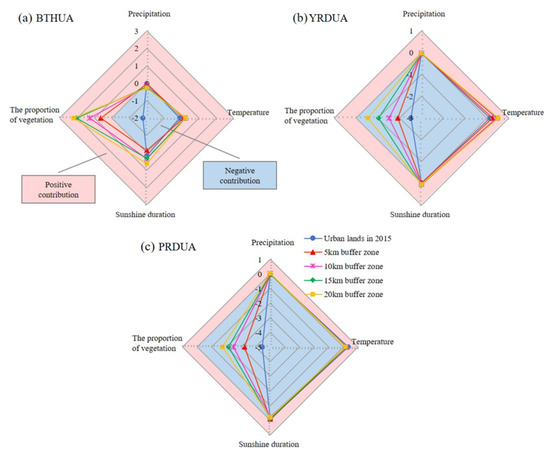
Figure 12.
The contribution of the annual cumulative precipitation, the annual average air temperature, the annual cumulative sunshine duration, and the proportion of vegetation to the NPP trends in urban lands in 2015, also including the 5 km buffer zone, 10 km buffer zone, and 20 km buffer zone of (a) the BTHUA, (b) the YRDUA, and (c) the PRDUA (unit: g C/m2/yr).
In the BTHUA, the proportion of vegetation was the most important factor leading to the downward trend of NPP in urban lands, contributing −1.77 g C/m2/yr to the rate of change, followed by the annual cumulative precipitation and the annual average air temperature, with contributions of −0.014 g C/m2/yr and −0.16 g C/m2/yr, respectively. The annual cumulative sunshine duration promoted the increase of NPP, its contribution was 0.17 g C/m2/yr, and obviously it failed to offset the inhibitory effect of other variables on the increase of NPP. In the buffer zones around urban lands, the proportion of vegetation promoted the increase of NPP, and its contribution gradually increased with the expansion of the buffer zones, reaching the highest level in the 20 km buffer zone (2.19 g C/m2/yr). Among these three meteorological variables, with the expansion of the buffer zone, the inhibitory effect of the annual accumulated precipitation on the increase of NPP was further enhanced. It gradually became the main factor that made a negative contribution to the NPP trends. In contrast, the annual average air temperature became one of the causes of the increase of NPP, and its contribution gradually increased. The annual cumulative sunshine duration inhibited the increase of NPP in the 5 km buffer zones and contributed −0.14 g C/m2/yr to the NPP trends, while it became one of the causes of the increase of NPP in the ~10–20 km buffer zones.
In the YRDUA, Figure 12b shows that changes in the annual cumulative precipitation and the proportion of vegetation were the reasons for the decrease of NPP, and the vegetation reduction was the main reason for the decrease of NPP. From urban lands to the 20 km buffer zone, the negative contribution of the two to the decrease of NPP weakened. Additionally, the annual average air temperature was the main factor that promoted the increase of NPP and its positive contribution was significantly enhanced with the expansion of the buffer zone, reaching 0.52 g C/m2/yr in the 20 km buffer zone. The annual cumulative sunshine duration was the factor that caused the decrease of NPP, but its effect gradually decreased, becoming the factor that caused the increase of NPP in the 10 km buffer zone. With the expansion of the buffer zone, the positive contribution of the annual cumulative sunshine duration to NPP gradually strengthen, but its contribution was slight.
In the PRDUA, among all the variables, the annual cumulative sunshine duration and the proportion of vegetation were always the reasons for the decrease of NPP. However, from the urban lands to the 20 km buffer zone, the effect of the proportion of vegetation decreased and its contribution decreased from −4.45 g C/m2/yr to −1.73 g C/m2/yr. In contrast, the effect of the annual cumulative sunshine duration increased and its contribution increased from −0.0065 g C/m2/yr to −0.20 g C/m2/yr. In addition, the annual average air temperature was the main factor to promote the increase of NPP. Unfortunately, this promotion and positive contribution also decreased as the buffer zone expanded. The influence of the annual cumulative precipitation to the NPP trends in urban lands and buffer zones in PRDUA was almost negligible. In urban lands, the annual cumulative precipitation made NPP decrease and its negative contribution was only −0.006 g C/m2/yr. Although the annual cumulative precipitation became a factor that promoted NPP increased in the buffer zones, its contribution was always less than 0.01 g C/m2/yr.
4. Discussion
Based on our results, we confirmed that the range of the annual NPP in China is between 2751 and 3343 Tg C, which is consistent with previous studies [37,38]. In addition, the NPP in China shows a significant increasing trend from 1982 to 2015. After 1997, China’s rate of increase in NPP slowed. Liang, et al. [39] also demonstrated that the increased rate of NPP after 2000 decreased to 0.008 Pg C/yr, similar to our results.
Since the reform and opening-up policy of the late 1970s, China’s hydroclimatic conditions and LULC have undergone extensive changes, which have led to dramatic changes in China’s terrestrial ecosystem [39,40,41]. Rapid urban expansion and economic development have caused tremendous changes to the LULC and ecological environment in and around the cities. In this study, we found that most of the newly added urban lands were converted from croplands. He, et al. [9] showed that from 1992 to 2015, China’s urban expansion put pressure on food security and reduced the average annual food self-sufficiency rate by 2%. In this study, whether within the permanent urban lands or the urban lands in 2015, NPP presented a decreasing trend. Using a piecewise regression analysis, we found that 1997 was the turning point of NPP change. Although the NPP still showed a decreasing trend in the two time periods, the environmental conditions improved, and the rate of decrease decreased significantly. China is a largely agricultural country [42], so both the output and security of grain are related to the country’s long-term interests and the foundation of national survival. Since 1978, the Chinese government has been aware of the importance of protecting cropland, and in 1998, the Chinese government formally confirmed the legislation that “rational use of land and effective protection of cropland is China’s basic national policy.” This also echoes our research results. In addition, a series of ecological and environmental protection policies will also affect changes in NPP, such as ecological redlines, which mainly protect areas with important ecological functions and a fragile ecological environment [43,44]. Milesi, et al. [45] indicated that concentrated urban forest planning could alleviate NPP decreases. These policies need to be considered for NPP changes and future predictions.
The three urban agglomerations have a strong position in China in terms of both population and economy. However, most of the above studies have explored NPP changes within the city’s administrative scope. In this study, the temporal and spatial changes in NPP in the urban lands of the three urban agglomerations were studied separately. Additionally, the NPP changes in the urban land buffer zones (~5 km–20 km) were explored. Furthermore, to investigate the multiple variables affecting urban NPP, we calculated the importance and the contribution of multiple variables to the NPP trends of urban lands and their buffer zones in different urban agglomerations. We expected that by investigating and analyzing the changes in the ecological environment in these three urban agglomerations, we could predict changes in the ecological environment in other developing cities or agglomerations in the future.
The Beijing–Tianjin–Hebei region is China’s capital economic circle. Our study indicated that in the BTHUA, the NPP showed a decreasing trend, and the decrease in NPP was mainly concentrated in Beijing, Tianjin, and Shijiazhuang. Peng, et al. [46] found that in Beijing, the core city of the BTHUA, urban expansion caused a loss of NPP at both the temporal and spatial scales, consistent with our research. In the BTHUA, the proportion of vegetation made a major negative contribution to the NPP trends in urban lands. Its contribution became positive and gradually increased in the ~5–20 km buffer zones. Correspondingly, the importance of the proportion of vegetation also increased. Although the proportion of vegetation in the ~5–20 km buffer zones had a decreasing trend, this trend was slight. For the BTHUA, there are many nature reserves around the urban lands. As of 2014, 71 nature reserves have been established in the Beijing-Tianjin-Hebei region, with a total area of 9177.5 km2 [47]. In addition, the Beijing–Tianjin–Hebei area is located in the “Three North Shelterbelt Project” area, which was initiated in 1978 and is the world’s largest ecological restoration project [23]. A series of environmental protection measures taken in the Beijing Tianjin Hebei region was also an important factor in reducing the impact of urban development on the ecosystem. In the BTHUA, the proportion of cropland in the buffer zone was the highest among the three urban agglomerations. To increase the yield of crops, the government has taken a series of field measures, including the promotion of high-quality crop varieties, the optimization of irrigation strategies aimed at reducing water shortages, and rational fertilization. In addition, the government has laid out basic farmland protection measures in Beijing Tianjin Hebei region to restrain urban expansion. In addition, the process of urban expansion and industrialization led to an increase in the CO2 concentration in the atmosphere. Many studies have suggested that an increase in the CO2 concentration produces a “CO2 fertilization effect” on vegetation [48,49,50]. The experiments on forest plots by Norby, et al. [48] showed that when the CO2 concentration rose from 0.4% to 0.5%, the forest NPP increased by 23%. The increase in the CO2 concentration promoted the photosynthesis of the vegetation that still existed. All of these contributed to the increase of NPP. Moreover, meteorological factors cannot be ignored. The importance of meteorological variables in urban lands was even higher than that of the proportion of vegetation, and the sunshine duration was the most important meteorological variable, the only one that made a positive contribution to the NPP trends in urban lands. During a given period, the sunshine duration is defined as the sum of that subperiod for which the direct solar irradiance exceeds 120 W/m2 [51]. Its contribution to the NPP trends was basically positive, and the sunshine duration in the BTHUA was higher than that in the other two urban agglomerations. Although the sunshine duration was decreasing (Figure 10), compared with the solar direct radiation, when the sky has clouds, the photosynthetic rate of the vegetation canopy is higher than when the sky is clear because cloudy days cause light scattering. It is easier for light to enter the canopy to allow more leaves to obtain solar radiation, and the increase of diffuse solar radiation could increase the LUE of crop [52]. In the BTHUA, the temperature increased temporarily promoted the growth of vegetation. The optimum temperature of vegetation refers to the environmental temperature most conducive to vegetation growth and the temperature at which the vegetation’s photosynthetic enzyme shows the maximum activity [53]. The BTHUA is located in a warm temperate subhumid area, and the optimum temperature for vegetation in this area is ~18–20 °C [54]. A previous study which classified the optimal temperature according to vegetation type indicated that the optimal temperature for cropland in China was 24.8 °C [55]. The precipitation showed decreasing trends (Figure 10) and negatively contributed to the NPP trends. However, a slight change made its importance to NPP less obvious.
In the YRDUA, our results showed that the NPP decreased in urban lands and was more significant than that in the BTHUA. The areas where NPP decreased significantly were Shanghai, Suzhou, and Jiaxing, consistent with the conclusions of many other studies. For example, when studying the urban expansion and vegetation dynamics in Shanghai, the central city of the Yangtze River Delta, Zhong, et al. [4] found that with urban expansion, the GPP and enhanced vegetation index (EVI) of vegetation within the city both showed a significant decreasing trend. With the expansion of the buffer zones, the reduction rate of NPP in the buffer zone of the YRDUA has gradually become nonsignificant, even though the NPP showed a slight increase in the 20 km buffer zone of urban lands. We found that the importance of meteorological variables increased significantly with the expansion of the buffer zone, and the variable with the fastest increase was temperature. Moreover, the importance of the proportion of vegetation decreased accordingly. The precipitation in the YRDUA showed a decreasing trend, and its contribution to the NPP trend was negative but weaker than that in the BTHUA. This was due to the higher precipitation and the slower decreasing rate of the precipitation than in the BTHUA. Temperature was the variable that made the most positive contribution to the NPP trend. The YRDUA is located in northern subtropical humid area. The optimum temperature of vegetation in this area is ~20–22 °C [54]. In addition, the optimum temperatures for the main vegetation types in the YRDUA, cropland, and forest, are 24.8 °C and 23.4 °C, respectively [55]. The temperature rise promoted the growth of vegetation. The contribution of sunshine duration to the NPP trends changed from negative to positive in the 10 km buffer zone and had an increasing trend. However, in the YRDUA, the variation rate of sunshine duration was relatively minor, almost one-third of that in the BTHUA. The slight variation in sunshine duration also made it less important to NPP. The proportion of vegetation in the YRDUA decreased significantly faster than in the BTHUA. For example, in the 5 km buffer zone, the proportion of vegetation in the YRDUA had a rate of −0.81%/yr, while in the BTHUA, the rate was only −0.48%/yr (Figure 10). The positive contributions of a series of variables to the NPP trends cannot offset the negative contribution caused by the obvious reduction in vegetation area. Until the 20 km buffer zone, the decline rate of the proportion of vegetation decreased to −0.47%/yr, and the other positive contributions were barely higher than the negative contributions. In recent years, the Yangtze River Delta region has also proposed the “Yangtze River Delta Regional Integration Development Plan,” which is necessary to improve cross-basin and cross-regional ecological compensation mechanisms [56]. With policy implementation, the future ecological environment will be strictly protected, and the ecological environment around the city will continue to develop healthily.
The rate of NPP reduction in the PRDUA was the fastest among the three urban agglomerations. In Foshan and Guangzhou, NPP decreased the most, while NPP increased in southern Shenzhen and northwestern Dongguan. Jiang, et al. [57] confirmed that tremendous LULC changes caused by rapid urbanization process in the Pearl River Delta region had reduced NPP, mainly because the replacement of cropland and forests with urban lands. A previous study showed that the relationship between precipitation and forest growth had a threshold value [58]. When the average annual cumulative precipitation was between 1000 and 2500 mm, the relationship between mature forest growth and precipitation was not significant [58]. When the average annual cumulative precipitation was higher than 2500 mm, the mature forest growth and precipitation were negatively correlated [58]. The PRDUA is located in the southern subtropical humid area, with abundant precipitation. The accumulated precipitation was significantly higher than the other two urban agglomerations. As shown in Figure 10, precipitation tended to increase in urban lands. In contrast, the precipitation showed a decreasing trend in buffer zones, contrary to the precipitation contribution to the NPP trends. However, this contribution was weak, and its importance to NPP was not high. The temperature changed little over the years. Whether from the ecological geographical area or the main vegetation types, the temperature in the PRDUA did not reach the optimum temperature of the vegetation [53,54], and an increase in temperature would still promote the growth of vegetation. The sunshine duration in the PRDUA made a negative contribution to the NPP trends, and this negative contribution had an increasing trend. In the PRDUA, the proportion of forest was higher than that of other urban agglomerations. The decrease of sunshine duration could cause the decrease of solar direct radiation penetrating through the forest canopy and reaching the understory, which may lead to the decrease of light scattering in the canopy and light reabsorption by leaves [59]. Correspondingly, the importance of sunshine duration to NPP gradually increased. Wang, et al. [60] also showed that the interannual variation in NPP in southern China was more sensitive to solar radiation than to precipitation. As shown in Figure 11, the proportion of vegetation was more important to the NPP in the PRDUA than in the other two urban agglomerations. Moreover, the proportion of vegetation had the strongest negative contribution to NPP trends in the PRDUA. Even in the 20 km buffer zone, the change rate of the proportion of vegetation was still −0.54%/yr (Figure 10), and the rapid reduction in vegetation area threatened the ecological environment. Fortunately, the “Guangdong-Hong Kong-Macao Greater Bay Area Development Planning Outline” [61] launched by the Chinese government in 2019 clearly requires the promotion of sustainable development, the creation of ecological protection barriers, the implementation of major projects for the protection and restoration of important ecosystems, the delineation and strict observance of the ecological protection red line, and the strengthening of protection for mountains, hills, and forest ecosystems around the delta. After implementing this ecological protection policy, the rate of reduction in NPP outside the cities in the Pearl River Delta region will be further reduced in the future and, and NPP may increase.
There are also some limitations to our research. First, the more detailed NPP changes caused by urban expansion or the change in LULC in China may not be fully captured. This is because the NPP has a spatial resolution of 5 km, but it can still reflect the changes in spatial and temporal scales. We are currently producing NPP products with a spatial resolution of 500 m. We believe that we could better explore this issue in the future. Second, although the NPP products used in the study are produced with low-uncertainty data (such as LAI and FPAR), some uncertainties in their accuracy remain. However, the NPP product was verified through Bigfoot data and compared with the MODIS NPP product, and it was found that the product was reliable. Finally, the temperature, precipitation, sunshine duration, and proportion of vegetation were selected as the variables influencing NPP change. In fact, many other factors influence NPP changes, including human activities, CO2 concentrations, and nitrogen deposition. Moreover, the NPP products used in the study are calculated based on a LUE model, which does not consider the factors such as the CO2 concentration and nitrogen deposition. There is a relationship between these factors and other variables, and the effect on NPP is very complex. A simple model cannot well reflect their impact on NPP. Nevertheless, our assessment is still worthwhile because it quantifies the factors that affect urban NPP and clearly shows the differences between different urban agglomerations and buffer zones.
5. Conclusions
The NPP in China from 1982 to 2015 had an increasing trend, with an average annual growth of 17.15 Tg C, and the turning point of China’s NPP trend was found in 1997. The increasing rate of the NPP was 9.59 Tg C/yr before 1997 and changed to 8.71 Tg C/yr after 1997. Although the NPP in the Chinese permanent urban lands (urban lands in the 1980s) decreased at −0.0185 Tg C/yr from 1982 to 2015, NPP had a lower decrease after 1997 than before 1997.
The BTHUA, the YRDUA, and the PRDUA are the three fastest-growing urban agglomerations in China. In the BTHUA, the NPP in urban lands decreased at −1.67 g C/m2/yr, and showed an increasing trend in the ~5 km–20 km buffer zones of urban lands, because the proportion of vegetation in the buffer zones was less affected by urban expansion. The increase in the temperature and the decrease in sunshine duration made positive contributions to the NPP trends. In the YRDUA, the NPP in urban lands decreased slightly faster (−2.45 g C/m2/yr) than in the BTHUA. The decreased rate of NPP slowed down from the 5 km buffer zone to the 15 km buffer zone, and even showed an increasing trend in the 20 km buffer zone. The increasing temperature was the main positive contribution to the NPP trends. From the 5 km buffer zone to the 20 km buffer zone, the rate of vegetation loss became slower, reducing its negative contribution to the NPP trends. In the PRDUA, the NPP decrease rate (−4.18 g C/m2/yr) in urban lands was the fastest among the three urban agglomerations. In addition to the decrease in vegetation, the reduction in sunshine duration also made negative contributions to the NPP trends.
A series of policies around urban agglomerations delayed the damage to the ecological environment caused by urban expansion. In addition to the reduction in vegetation, the contribution of meteorological variables to the NPP trends cannot be ignored. This study provides a reference for future urban ecological environment prediction and policy formulation.
Author Contributions
Data curation, H.Z., R.S., D.P., Y.W., S.Z., J.Z., J.B. and Q.L.; formal analysis, H.Z., R.S., D.P., Y.H. and X.Y.; funding acquisition, D.P. and R.S.; investigation, H.Z., R.S. and D.P.; methodology, H.Z., R.S. and D.P.; project administration, D.P. and R.S.; resources, D.P., R.S., Y.H. and X.Y.; software, H.Z., Y.W., S.Z., J.Z., J.B. and Q.L.; supervision, R.S. and D.P.; validation, H.Z., R.S., D.P. and Y.W.; visualization, H.Z., D.P., Y.W., S.Z., J.Z., J.B. and Q.L.; writing—original draft, H.Z., R.S. and D.P.; writing—review and editing, H.Z., R.S., D.P. and Y.W. All authors have read and agreed to the published version of the manuscript.
Funding
This work was supported by the Strategic Priority Research Program of the Chinese Academy of Sciences (XDA19090112), the National Key R&D Program of China (2017YFA0603002) and the National Key Scientific and Technological Infrastructure project “Earth System Science Numerical Simulator Facility” (EarthLab).
Institutional Review Board Statement
“Not applicable” for studies not involving humans or animals.
Informed Consent Statement
“Not applicable” for studies not involving humans.
Data Availability Statement
The CLUD used in this study are available from the corresponding author upon request. The annual 30-m land use/land cover maps of China for 1980–2015 used in our work can be freely accessed at https://zenodo.org/record/3923728. The meteorological station data are obtained from data.cma.cn. The NPP data used in our work can be freely accessed at https://zenodo.org/record/3996814.
Conflicts of Interest
The authors declare no conflict of interest.
References
- United Nations. World Population Prospects: The 2017 Revision; United Nations Department of Economic and Social Affairs, Population Division: New York, NY, USA, 2017. [Google Scholar]
- Gao, B.; Huang, Q.; He, C.; Sun, Z.; Zhang, D. How does sprawl differ across cities in China? A multi-scale investigation using nighttime light and census data. Landsc. Urban Plan. 2016, 148, 89–98. [Google Scholar] [CrossRef]
- Grimm, N.B.; Faeth, S.H.; Golubiewski, N.E.; Redman, C.L.; Wu, J.; Bai, X.; Briggs, J.M. Global change and the ecology of cities. Science 2008, 319, 756–760. [Google Scholar] [CrossRef] [PubMed]
- Zhong, Q.; Ma, J.; Zhao, B.; Wang, X.; Zong, J.; Xiao, X. Assessing spatial-temporal dynamics of urban expansion, vegetation greenness and photosynthesis in megacity Shanghai, China during 2000–2016. Remote Sens. Environ. 2019, 233, 111374. [Google Scholar] [CrossRef]
- Liu, X.; Pei, F.; Wen, Y.; Li, X.; Wang, S.; Wu, C.; Cai, Y.; Wu, J.; Jun, C.; Feng, K.; et al. Global urban expansion offsets climate-driven increases in terrestrial net primary productivity. Nat. Commun. 2019, 10, 5558. [Google Scholar] [CrossRef] [PubMed]
- Stone, B.; Hess Jeremy, J.; Frumkin, H. Urban form and extreme heat events: Are sprawling cities more vulnerable to climate change than compact cities? Environ. Health Perspect. 2010, 118, 1425–1428. [Google Scholar] [CrossRef]
- Ewing, R.; Pendall, R.; Chen, D. Measuring sprawl and its transportation impacts. Transport Res. Rec. 2003, 1831, 175–183. [Google Scholar] [CrossRef]
- Tu, J.; Xia, Z.-G.; Clarke, K.C.; Frei, A. Impact of urban sprawl on water quality in eastern Massachusetts, USA. Environ. Manag. 2007, 40, 183–200. [Google Scholar] [CrossRef]
- He, C.; Liu, Z.; Xu, M.; Ma, Q.; Dou, Y. Urban expansion brought stress to food security in China: Evidence from decreased cropland net primary productivity. Sci. Total Environ. 2017, 576, 660–670. [Google Scholar] [CrossRef]
- Xu, C.; Liu, M.; An, S.; Chen, J.M.; Yan, P. Assessing the impact of urbanization on regional net primary productivity in Jiangyin County, China. J. Environ. Manag. 2007, 85, 597–606. [Google Scholar] [CrossRef]
- Yan, Y.; Liu, X.; Wang, F.; Li, X.; Ou, J.; Wen, Y.; Liang, X. Assessing the impacts of urban sprawl on net primary productivity using fusion of Landsat and MODIS data. Sci. Total Environ. 2018, 613–614, 1417–1429. [Google Scholar] [CrossRef]
- Awal, M.A.; Ohta, T.; Matsumoto, K.; Toba, T.; Daikoku, K.; Hattori, S.; Hiyama, T.; Park, H. Comparing the carbon sequestration capacity of temperate deciduous forests between urban and rural landscapes in central Japan. Urban For. Urban Green. 2010, 9, 261–270. [Google Scholar] [CrossRef]
- Donovan, G.H.; Butry, D.T. Trees in the city: Valuing street trees in Portland, Oregon. Landsc. Urban Plan. 2010, 94, 77–83. [Google Scholar] [CrossRef]
- Lohr, V.; Pearson-Mims, C.; Tarnai, J.; Dillman, D. How urban residents rate and rank the benefits and problems associated with trees in cities. J. Arboric. 2004, 30, 28–36. [Google Scholar]
- Liu, Y.; Wang, Q.; Zhang, Z.; Tong, L.; Wang, Z.; Li, J. Grassland dynamics in responses to climate variation and human activities in China from 2000 to 2013. Sci. Total Environ. 2019, 690, 27–39. [Google Scholar] [CrossRef] [PubMed]
- Piao, S.; Fang, J.; He, J. Variations in vegetation net primary production in the Qinghai-Xizang Plateau, China, from 1982 to 1999. Clim. Chang. 2006, 74, 253–267. [Google Scholar] [CrossRef]
- Tian, G.; Qiao, Z. Assessing the impact of the urbanization process on net primary productivity in China in 1989–2000. Environ. Pollut. 2014, 184, 320–326. [Google Scholar] [CrossRef] [PubMed]
- Liu, J.; Liu, M.; Tian, H.; Zhuang, D.; Zhang, Z.; Zhang, W.; Tang, X.; Deng, X. Spatial and temporal patterns of China’s cropland during 1990–2000: An analysis based on Landsat TM data. Remote Sens. Environ. 2005, 98, 442–456. [Google Scholar] [CrossRef]
- Liu, J.; Kuang, W.; Zhang, Z.; Xu, X.; Quin, Y.; Ning, J.; Zhou, W.; Zhang, S.; Li, R.; Yan, C.; et al. Spatiotemporal characteristics, patterns, and causes of land-use changes in China since the late 1980s. J. Geogr. Sci. 2014, 24, 195–210. [Google Scholar] [CrossRef]
- Ning, J.; Liu, J.; Kuang, W.; Xu, X.; Zhang, S.; Yan, C.; Li, R.; Wu, S.; Hu, Y.; Du, G.; et al. Spatiotemporal patterns and characteristics of land-use change in China during 2010–2015. J. Geogr. Sci. 2018, 28, 547–562. [Google Scholar] [CrossRef]
- Xu, Y.; Yu, L.; Peng, D.; Zhao, J.; Cheng, Y.; Liu, X.; Li, W.; Meng, R.; Xu, X.; Gong, P. Annual 30-m land use/land cover maps of China for 1980–2015 from the integration of AVHRR, MODIS and Landsat data using the BFAST algorithm. Sci. China Earth Sci. 2020. [Google Scholar] [CrossRef]
- Peng, D.L.; Huang, J.F.; Cai, C.X.; Deng, R.; Xu, J.F. Assessing the response of seasonal variation of net primary productivity to climate using remote sensing data and geographic information system techniques in Xinjiang. J. Integr. Plant Biol. 2008, 50, 1580–1588. [Google Scholar] [CrossRef] [PubMed]
- Peng, D.L.; Zhang, H.L.; Liu, L.Y.; Huang, W.; Huete, A.R.; Zhang, X.; Wang, F.; Yu, L.; Xie, Q.; Wang, C.; et al. Estimating the aboveground biomass for planted forests based on stand age and environmental variables. Remote Sens. 2019, 11, 2270. [Google Scholar] [CrossRef]
- Zheng, X.; Zhu, J.J. A methodological approach for spatial downscaling of TRMM precipitation data in North China. Int. J. Remote Sens. 2015, 36, 144–169. [Google Scholar] [CrossRef]
- Yu, T.; Sun, R.; Xiao, Z.Q.; Zhang, Q.; Liu, G.; Cui, T.X.; Wang, J.M. Estimation of global vegetation productivity from global land surface satellite data. Remote Sens. 2018, 10, 327. [Google Scholar] [CrossRef]
- Xiao, Z.Q.; Liang, S.L.; Sun, R.; Wang, J.D.; Jiang, B. Estimating the fraction of absorbed photosynthetically active radiation from the MODIS data based GLASS leaf area index product. Remote Sens. Environ. 2015, 171, 105–117. [Google Scholar] [CrossRef]
- Xiao, Z.Q.; Liang, S.L.; Wang, J.D.; Xiang, Y.; Zhao, X.; Song, J.L. Long-Time-Series global land surface satellite leaf area index product derived from MODIS and AVHRR surface reflectance. IEEE Trans. Geosci. Remote Sens. 2016, 54, 5301–5318. [Google Scholar] [CrossRef]
- Wang, M.J.; Sun, R.; Zhu, A.R.; Xiao, Z.Q. Evaluation and comparison of light use efficiency and gross primary productivity using three different approaches. Remote Sens. 2020, 12, 1003. [Google Scholar] [CrossRef]
- Cohen, W.B.; Turner, D.P.; Gower, S.T.; Running, S.W. Linking In Situ Measurements, Remote Sensing, and Models to Validate MODIS Products Related to the Terrestrial Carbon Cycle. NASA Terrestrial Ecology Program. 2009. Available online: http://www.fsl.orst.edu/larse/bigfoot/index.html (accessed on 5 December 2017).
- Feng, Y.H.; Zhu, J.X.; Zhao, X.; Tang, Z.Y.; Zhu, J.L.; Fang, J.Y. Changes in the trends of vegetation net primary productivity in China between 1982 and 2015. Environ. Res. Lett. 2019, 14, 124009. [Google Scholar] [CrossRef]
- Peng, S.S.; Chen, A.P.; Xu, L.; Cao, C.X.; Fang, J.Y.; Myneni, R.B.; Pinzon, J.E.; Tucker, C.J.; Piao, S.L. Recent change of vegetation growth trend in China. Environ. Res. Lett. 2011, 6, 044027. [Google Scholar] [CrossRef]
- Piao, S.L.; Wang, X.H.; Ciais, P.; Zhu, B.; Wang, T.; Liu, J. Changes in satellite-derived vegetation growth trend in temperate and boreal Eurasia from 1982 to 2006. Glob. Chang. Biol. 2011, 17, 3228–3239. [Google Scholar] [CrossRef]
- Burnham, K.P.; Anderson, D.R. Model Selection and Multimodel Inference; Springer: New York, NY, USA, 2002. [Google Scholar]
- Pflugmacher, D.; Cohen, W.B.; Kennedy, R.E.; Yang, Z. Using landsat-derived disturbance and recovery history and lidar to map forest biomass dynamics. Remote Sens. Environ. 2014, 151, 124–137. [Google Scholar] [CrossRef]
- Zhang, X.; Liu, L.; Wu, C.; Chen, X.; Gao, Y.; Xie, S.; Zhang, B. Development of a global 30 m impervious surface map using multisource and multitemporal remote sensing datasets with the Google Earth Engine platform. Earth Syst. Sci. Data 2020, 12, 1625–1648. [Google Scholar] [CrossRef]
- He, H.L.; Wang, S.Q.; Zhang, L.; Wang, J.; Ren, X.; Zhou, L.; Piao, S.; Yan, H.; Ju, W.; Gu, F.; et al. Altered trends in carbon uptake in China’s terrestrial ecosystems under the enhanced summer monsoon and warming hiatus. Natl. Sci. Rev. 2019, 6, 505–514. [Google Scholar] [CrossRef]
- Gao, Z.Q.; Liu, J.Y. Simulation study of China’s net primary production. Chin. Sci. Bull. 2008, 53, 434–443. [Google Scholar] [CrossRef]
- Cao, M.K.; Tao, B.; Li, K.R.; Shao, X.M.; Prience, S.D. Interannual variation in terrestrial ecosystem carbon fluxes in China from 1981 to 1998. Acta Bot. Sin. 2003, 45, 552–560. [Google Scholar]
- Liang, W.; Yang, Y.; Fan, D.; Guan, H.; Zhang, T.; Long, D.; Zhou, Y.; Bai, D. Analysis of spatial and temporal patterns of net primary production and their climate controls in China from 1982 to 2010. Agric. For. Meteorol. 2015, 204, 22–36. [Google Scholar] [CrossRef]
- Liu, Y.; Ju, W.; He, H.; Wang, S.; Sun, R.; Zhang, Y. Changes of net primary productivity in China during recent 11 years detected using an ecological model driven by MODIS data. Front. Earth Sci. 2013, 7, 112–127. [Google Scholar] [CrossRef]
- Piao, S.; Ciais, P.; Huang, Y.; Shen, Z.; Peng, S.; Li, J.; Zhou, L.; Liu, H.; Ma, Y.; Ding, Y.; et al. The impacts of climate change on water resources and agriculture in China. Nature 2010, 467, 43–51. [Google Scholar] [CrossRef]
- Wang, F. Some advances in climate warming impact research in China since 1990. Acta Meteorol. Sin. 2001, 15, 498–508. [Google Scholar]
- Gao, J.; Wang, Y.; Zou, C.; Xu, D.; Lin, N.; Wang, L.; Zhang, K. China’s ecological conservation redline: A solution for future nature conservation. Ambio 2020, 49, 1519–1529. [Google Scholar] [CrossRef]
- Bai, Y.; Wong, C.P.; Jiang, B.; Hughes, A.C.; Wang, M.; Wang, Q. Developing China’s Ecological Redline Policy using ecosystem services assessments for land use planning. Nat. Commun. 2018, 9, 3034. [Google Scholar] [CrossRef] [PubMed]
- Milesi, C.; Elvidge, C.D.; Nemani, R.R.; Running, S.W. Assessing the impact of urban land development on net primary productivity in the southeastern United States. Remote Sens. Environ. 2003, 86, 401–410. [Google Scholar] [CrossRef]
- Peng, J.; Shen, H.; Wu, W.; Liu, Y.; Wang, Y. Net primary productivity (NPP) dynamics and associated urbanization driving forces in metropolitan areas: A case study in Beijing City, China. Landsc. Ecol. 2016, 31, 1077–1092. [Google Scholar] [CrossRef]
- Zhou, X.; Huang, Z.H.; Zhang, X.R.; Xing, S.H. Protection of natural vegetation and distribution of nature reserves in Beijing-Tianjin-Hebei region. Ecol. Sci. 2017, 36, 64–71. [Google Scholar] [CrossRef]
- Norby, R.J.; DeLucia, E.H.; Gielen, B.; Calfapietra, C.; Giardina, C.P.; King, J.S.; Ledford, J.; McCarthy, H.R.; Moore, D.J.P.; Ceulemans, R.; et al. Forest response to elevated CO2 is conserved across a broad range of productivity. Proc. Natl. Acad. Sci. USA 2005, 102, 18052–18056. [Google Scholar] [CrossRef]
- Keenan, T.F.; Hollinger, D.Y.; Bohrer, G.; Dragoni, D.; Munger, J.W.; Schmid, H.P.; Richardson, A.D. Increase in forest water-use efficiency as atmospheric carbon dioxide concentrations rise. Nature 2013, 499, 324–327. [Google Scholar] [CrossRef]
- Talhelm, A.F.; Pregitzer, K.S.; Kubiske, M.E.; Zak, D.R.; Company, C.E.; Burton, A.J.; Dickson, R.E.; Hendrey, G.R.; Isebrands, J.G.; Lewin, K.F.; et al. Elevated carbon dioxide and ozone alter productivity and ecosystem carbon content in northern temperate forests. Glob. Chang. Biol. 2014, 20, 2492–2504. [Google Scholar] [CrossRef]
- Mellit, A.; Eleuch, H.; Benghanem, M.; Elaoun, C.; Pavan, A.M. An adaptive model for predicting of global, direct and diffuse hourly solar irradiance. Energy Convers. Manag. 2010, 51, 771–782. [Google Scholar] [CrossRef]
- Xin, Q.C.; Gong, P.; Suyker, A.E.; Si, Y.L. Effects of the partitioning of diffuse and direct solar radiation on satellite-based modeling of crop gross primary production. Int. J. Appl. Earth Obs. Geoinf. 2016, 50, 51–63. [Google Scholar] [CrossRef]
- Cui, Y. Preliminary estimation of the realistic optimum temperature for vegetation growth in China. Environ. Manag. 2013, 52, 151–162. [Google Scholar] [CrossRef]
- Cui, Y.; Liu, J.; Hu, Y.; Bing, L.; Tao, F.; Wang, J. Estimating and analyzing the optimum temperature for vegetation growth in China. J. Nat. Resour. 2012, 27, 281–292. [Google Scholar] [CrossRef]
- Liu, Z.; Liu, J.; Shao, Q. Optimum temperature of vegetation growth for various land cover types in China. J. Geo Inf. Sci. 2014, 16, 1–10. [Google Scholar] [CrossRef]
- Han, J.; Meng, X.; Zhou, X.; Yi, B.; Liu, M.; Xiang, W.N. A long-term analysis of urbanization process, landscape change, and carbon sources and sinks: A case study in China’s Yangtze River Delta region. J. Clean. Prod. 2017, 141, 1040–1050. [Google Scholar] [CrossRef]
- Jiang, C.; Wu, Z.F.; Cheng, J.; Yu, Q.; Rao, X.Q. Impacts of urbanization on net primary productivity in the Pearl River Delta, China. Int. J. Plant Prod. 2015, 9, 581–598. [Google Scholar]
- Liu, Y.C.; Yu, G.R.; Wang, Q.F.; Zhang, Y.J. How temperature, precipitation and stand age control the biomass carbon density of global mature forests. Glob. Ecol. Biogeogr. 2014, 23, 323–333. [Google Scholar] [CrossRef]
- Chazdon, R.L.; Pearcy, R.W. The importance of Sunflecks for forest understory plants-photosynthetic machinery appears adapted to brief, unpredictable periods of radiation. Bioscience 1991, 41, 760–766. [Google Scholar] [CrossRef]
- Wang, J.; Dong, J.; Yi, Y.; Lu, G.; Oyler, J.; Smith, W.K.; Zhao, M.; Liu, J.; Running, S. Decreasing net primary production due to drought and slight decreases in solar radiation in China from 2000 to 2012. J. Geophys. Res. Biogeosci. 2017, 122, 261–278. [Google Scholar] [CrossRef]
- Zheng, S. Has “The outline of the plan for the reform and development of the Pearl River Delta” promoted to the coordination of Guangdong-Hong Kong-Macao Greater Bay Area. Mod. Econ. 2019, 10, 1348–1367. [Google Scholar] [CrossRef][Green Version]


Publisher’s Note: MDPI stays neutral with regard to jurisdictional claims in published maps and institutional affiliations. |
© 2021 by the authors. Licensee MDPI, Basel, Switzerland. This article is an open access article distributed under the terms and conditions of the Creative Commons Attribution (CC BY) license (http://creativecommons.org/licenses/by/4.0/).