
Decades of Ground Deformation in the Weihe Graben, Shaanxi Province, China, in Response to Various Land Processes, Observed by Radar Interferometry and Levelling

Abstract
1. Introduction
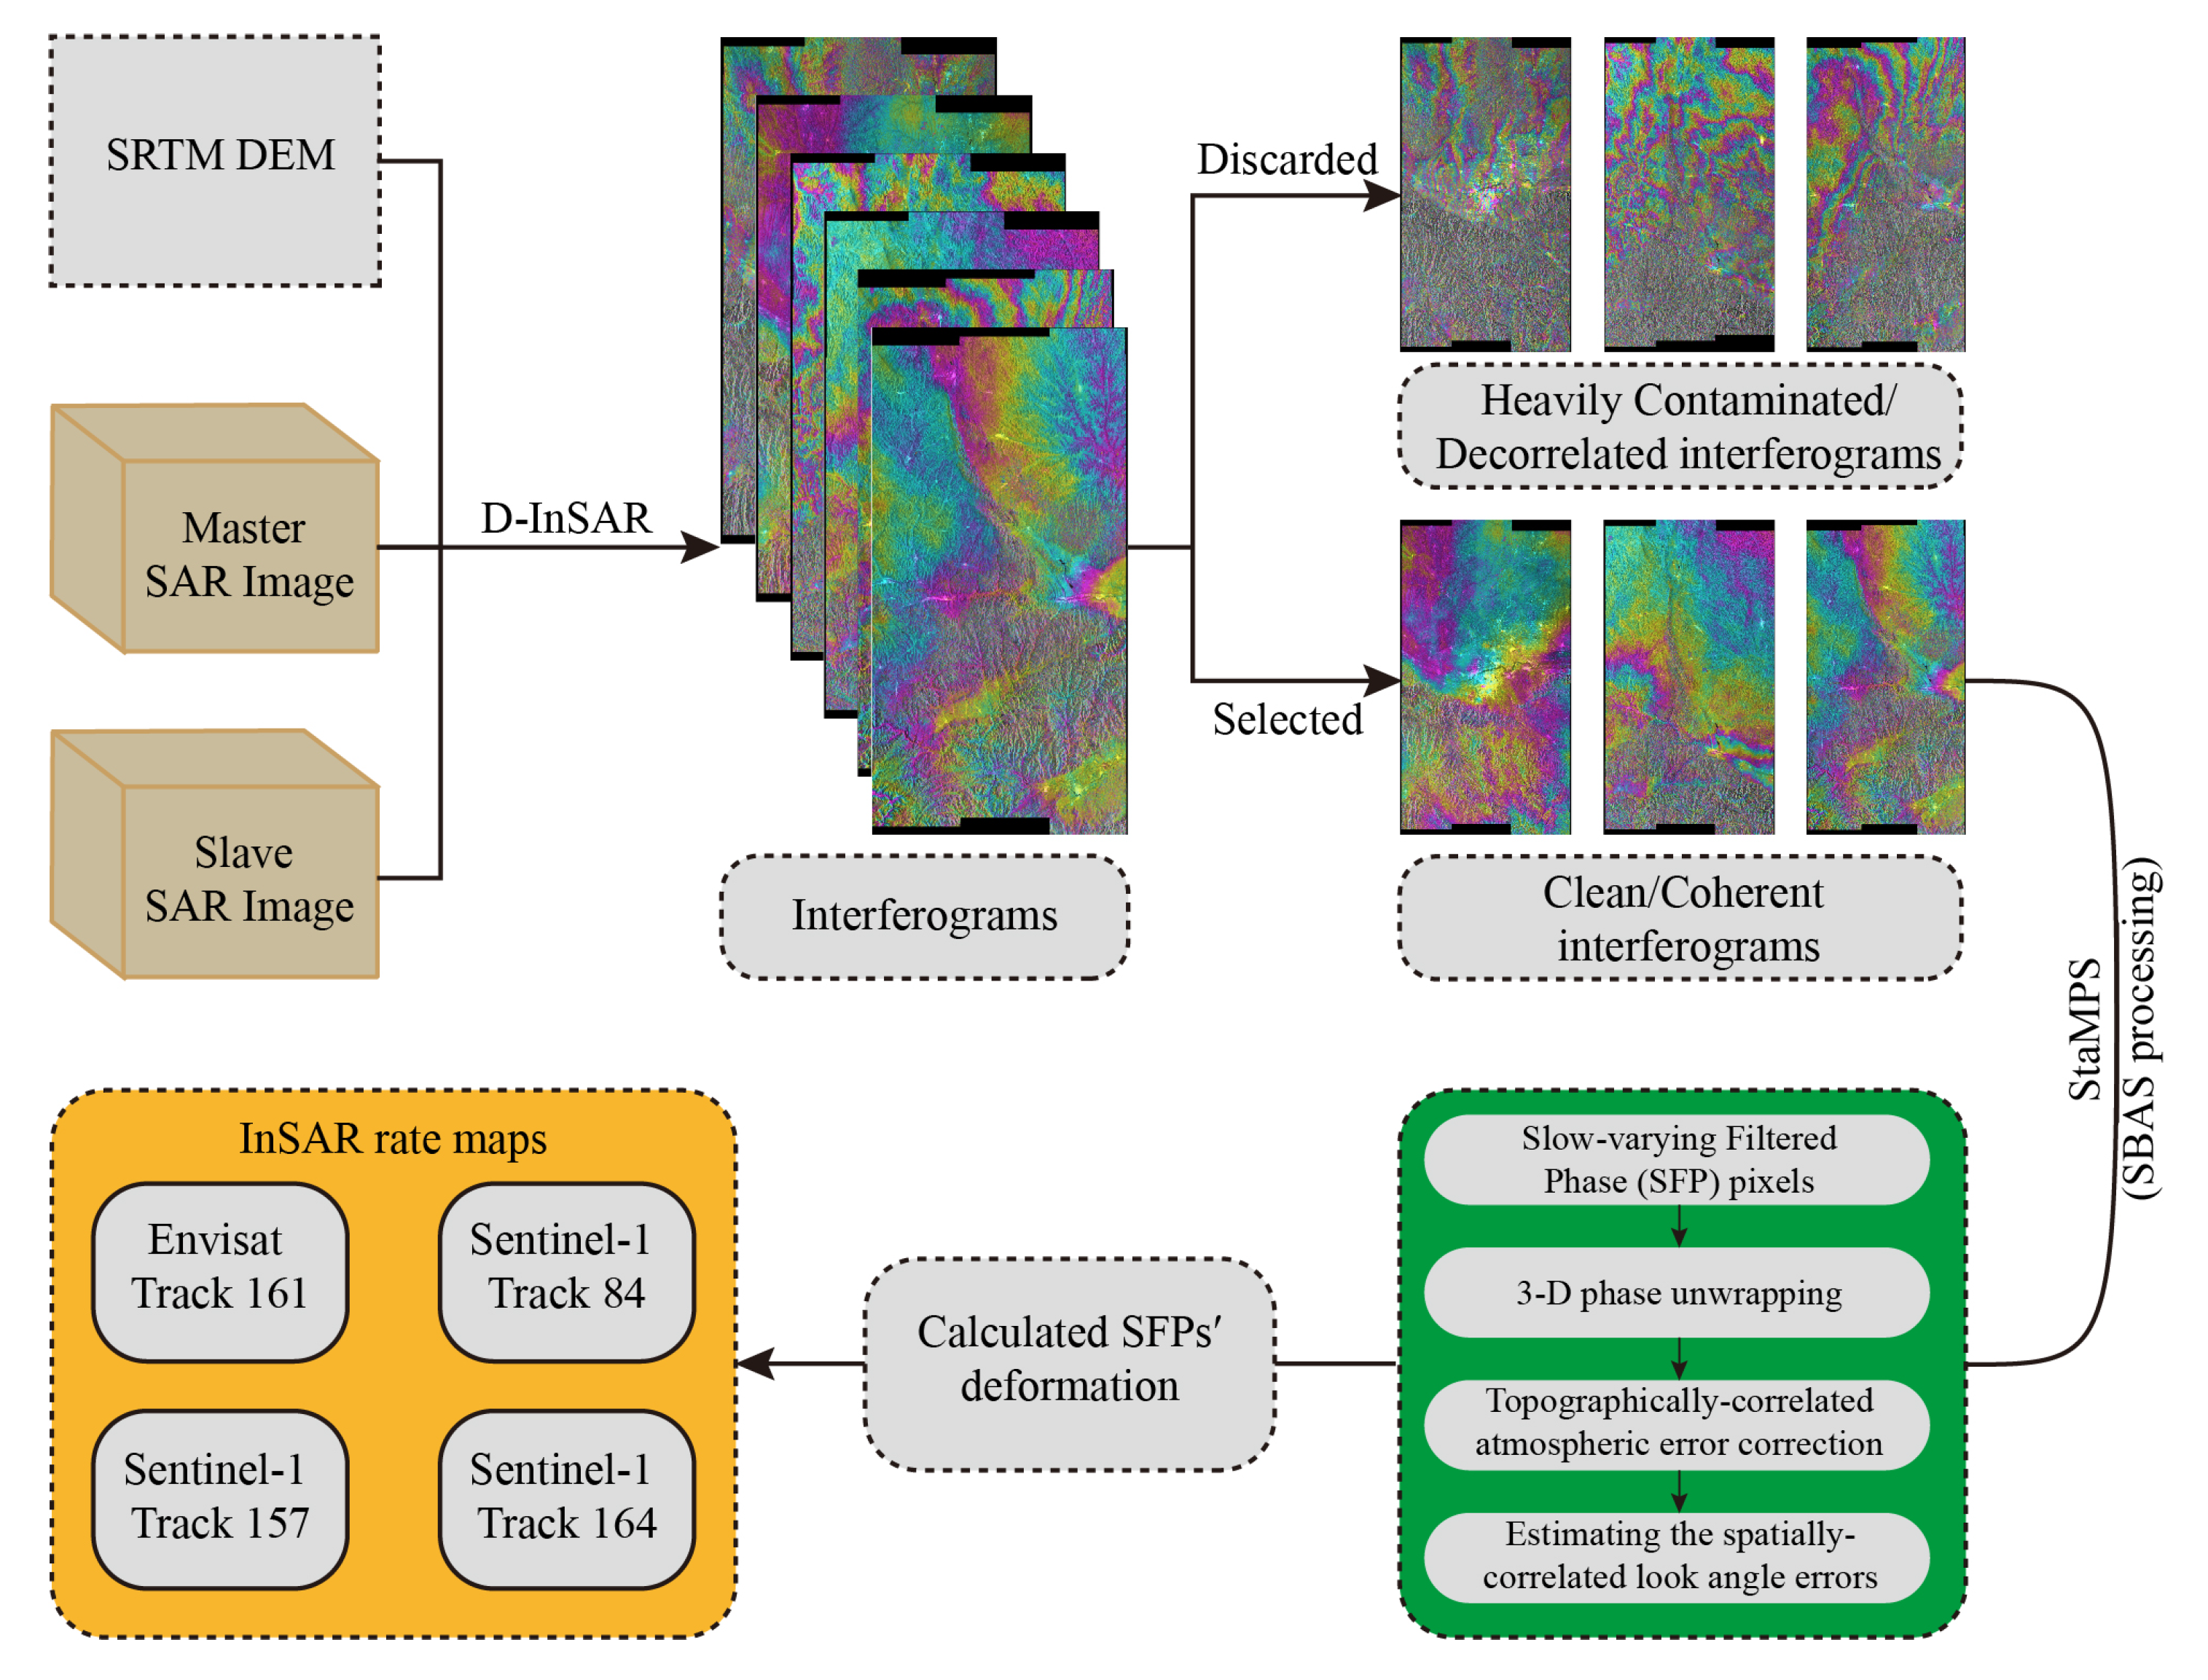
2. Data and Methods
2.1. Envisat Data in 2003–2010
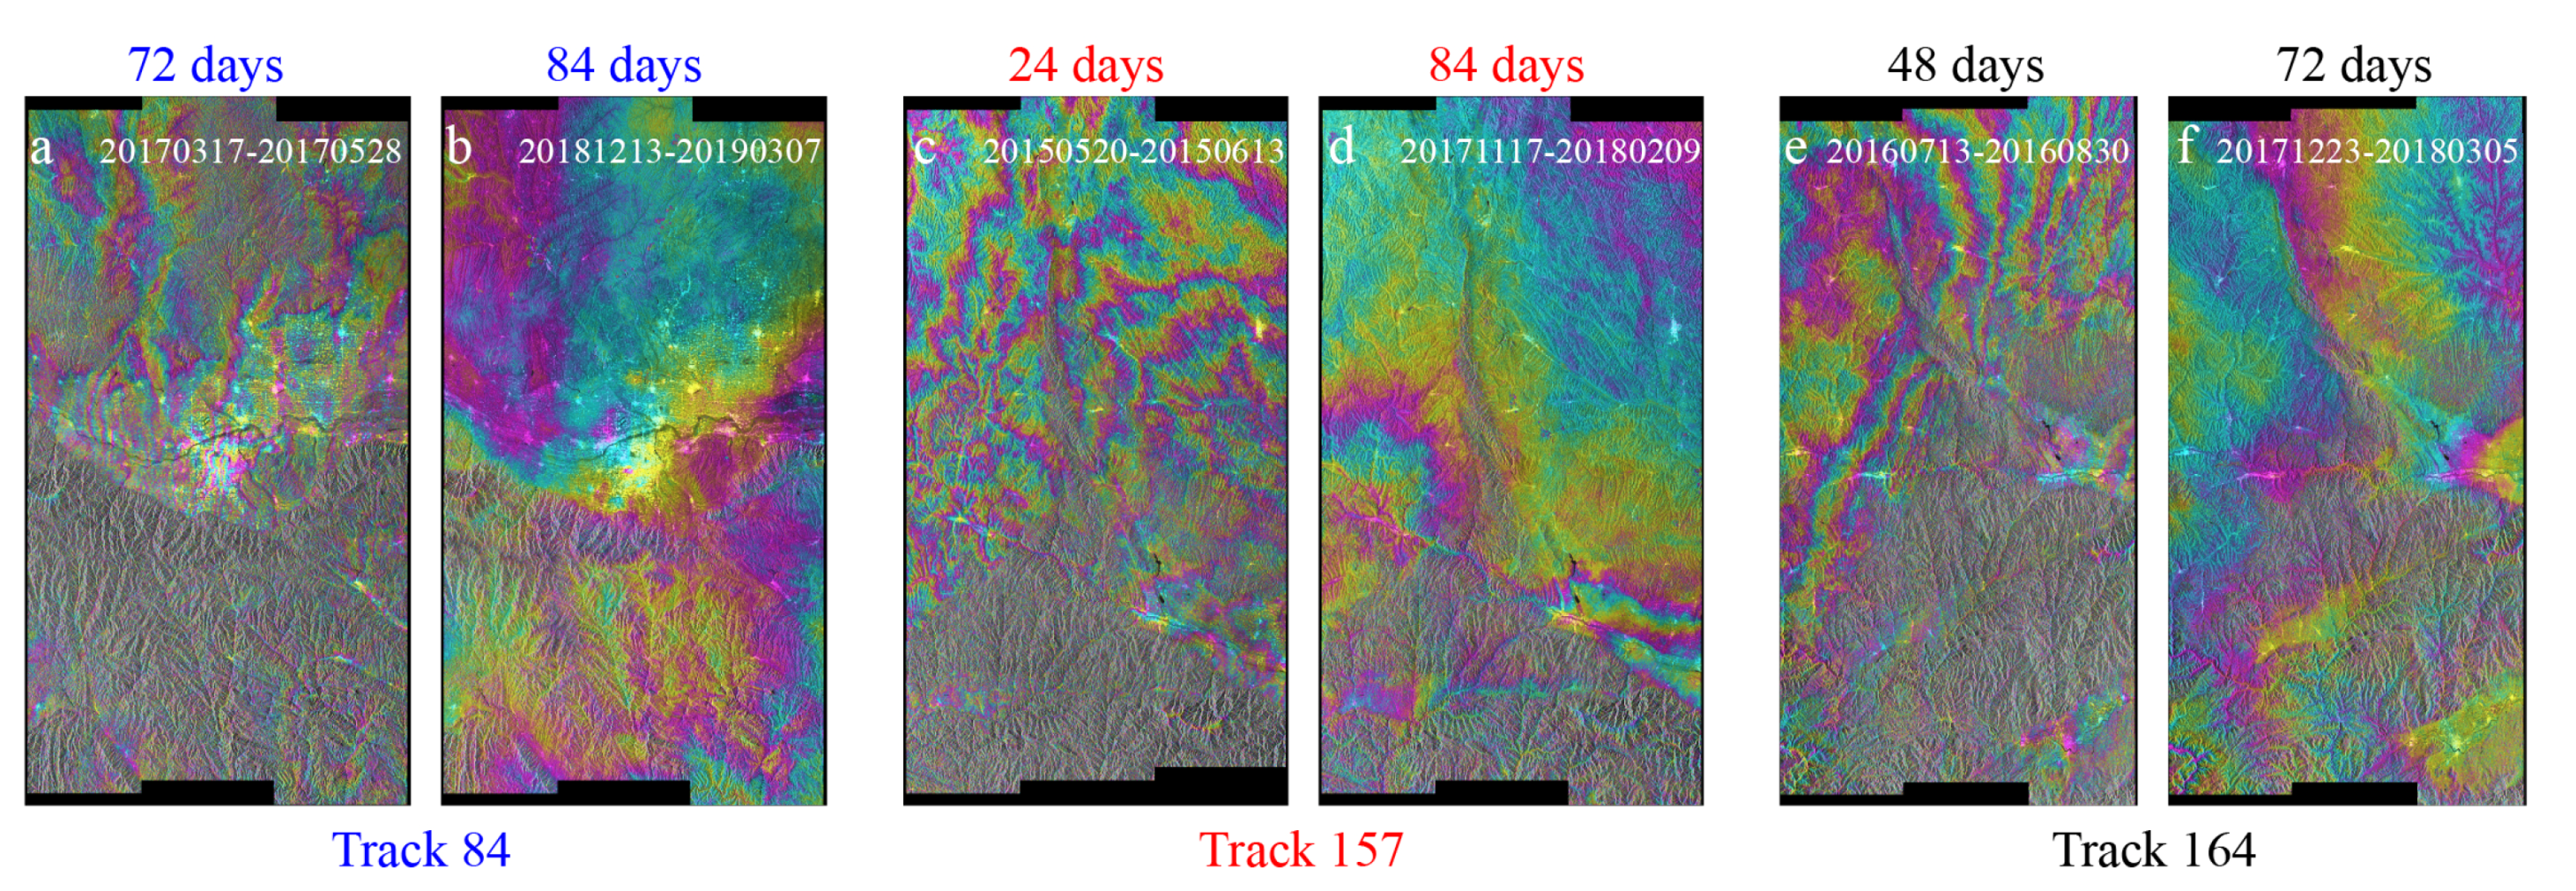
2.2. Sentinel-1 Data in 2014–2021
2.3. Levelling Data in 1970–2014
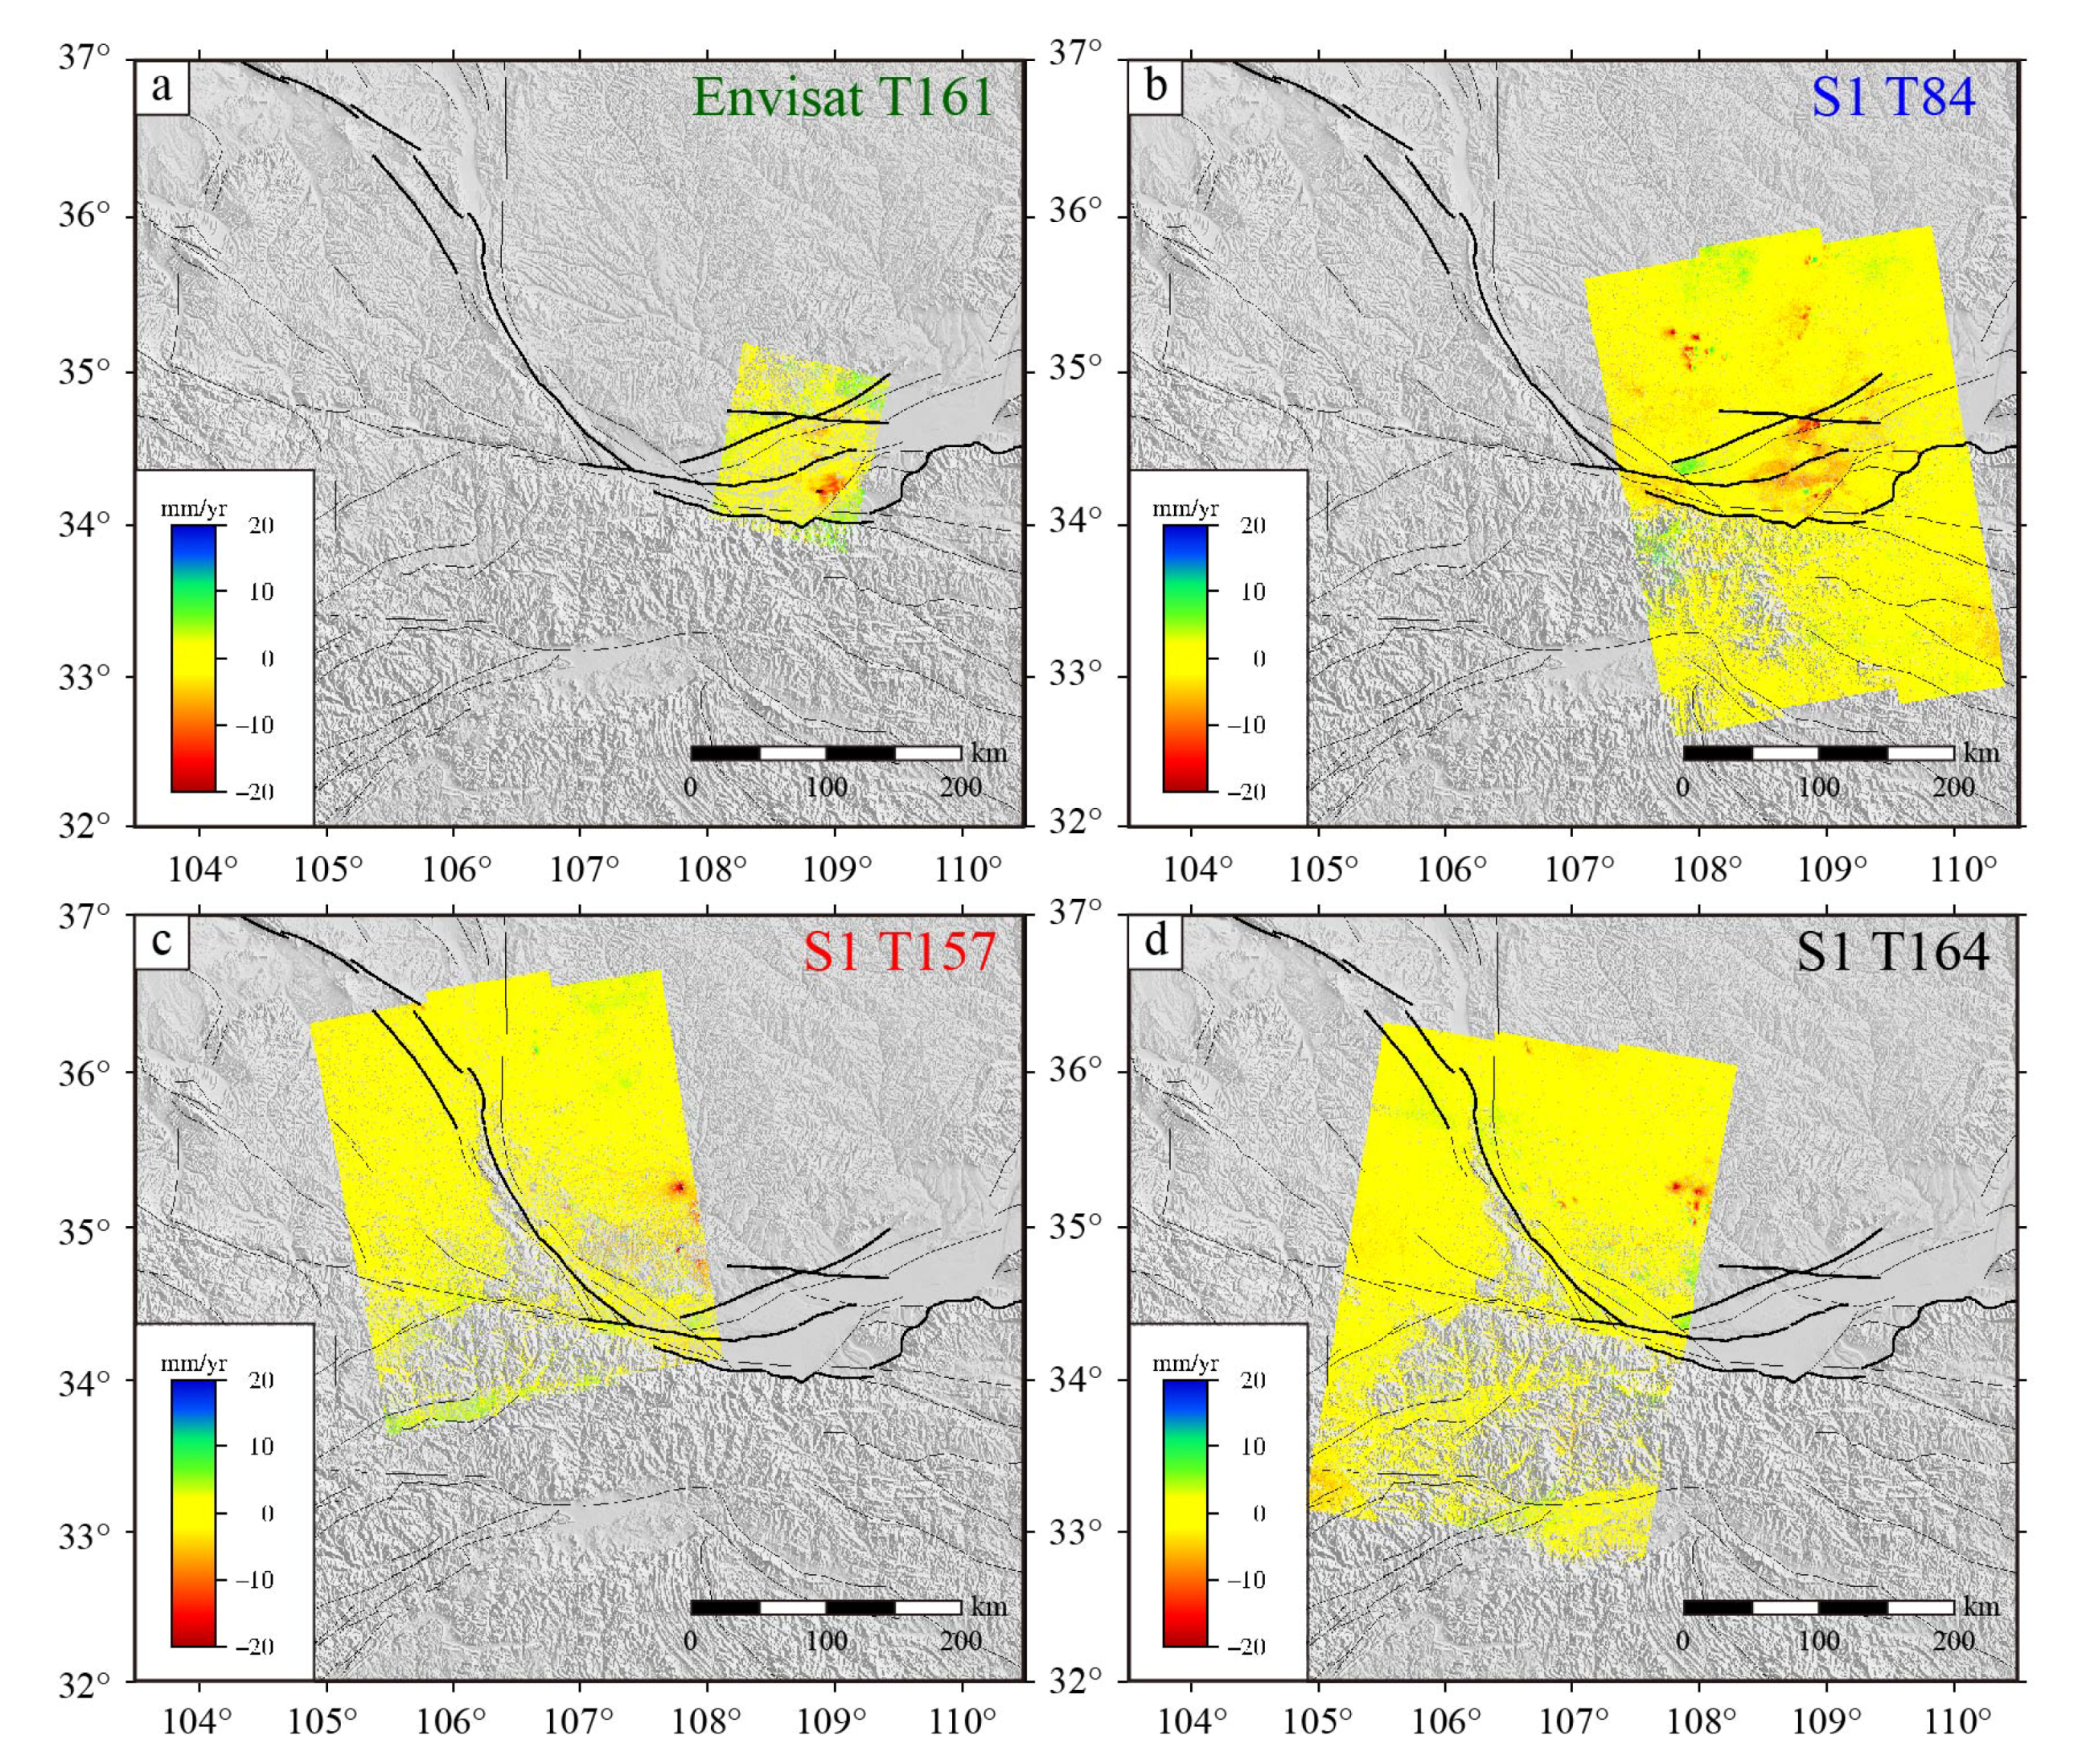
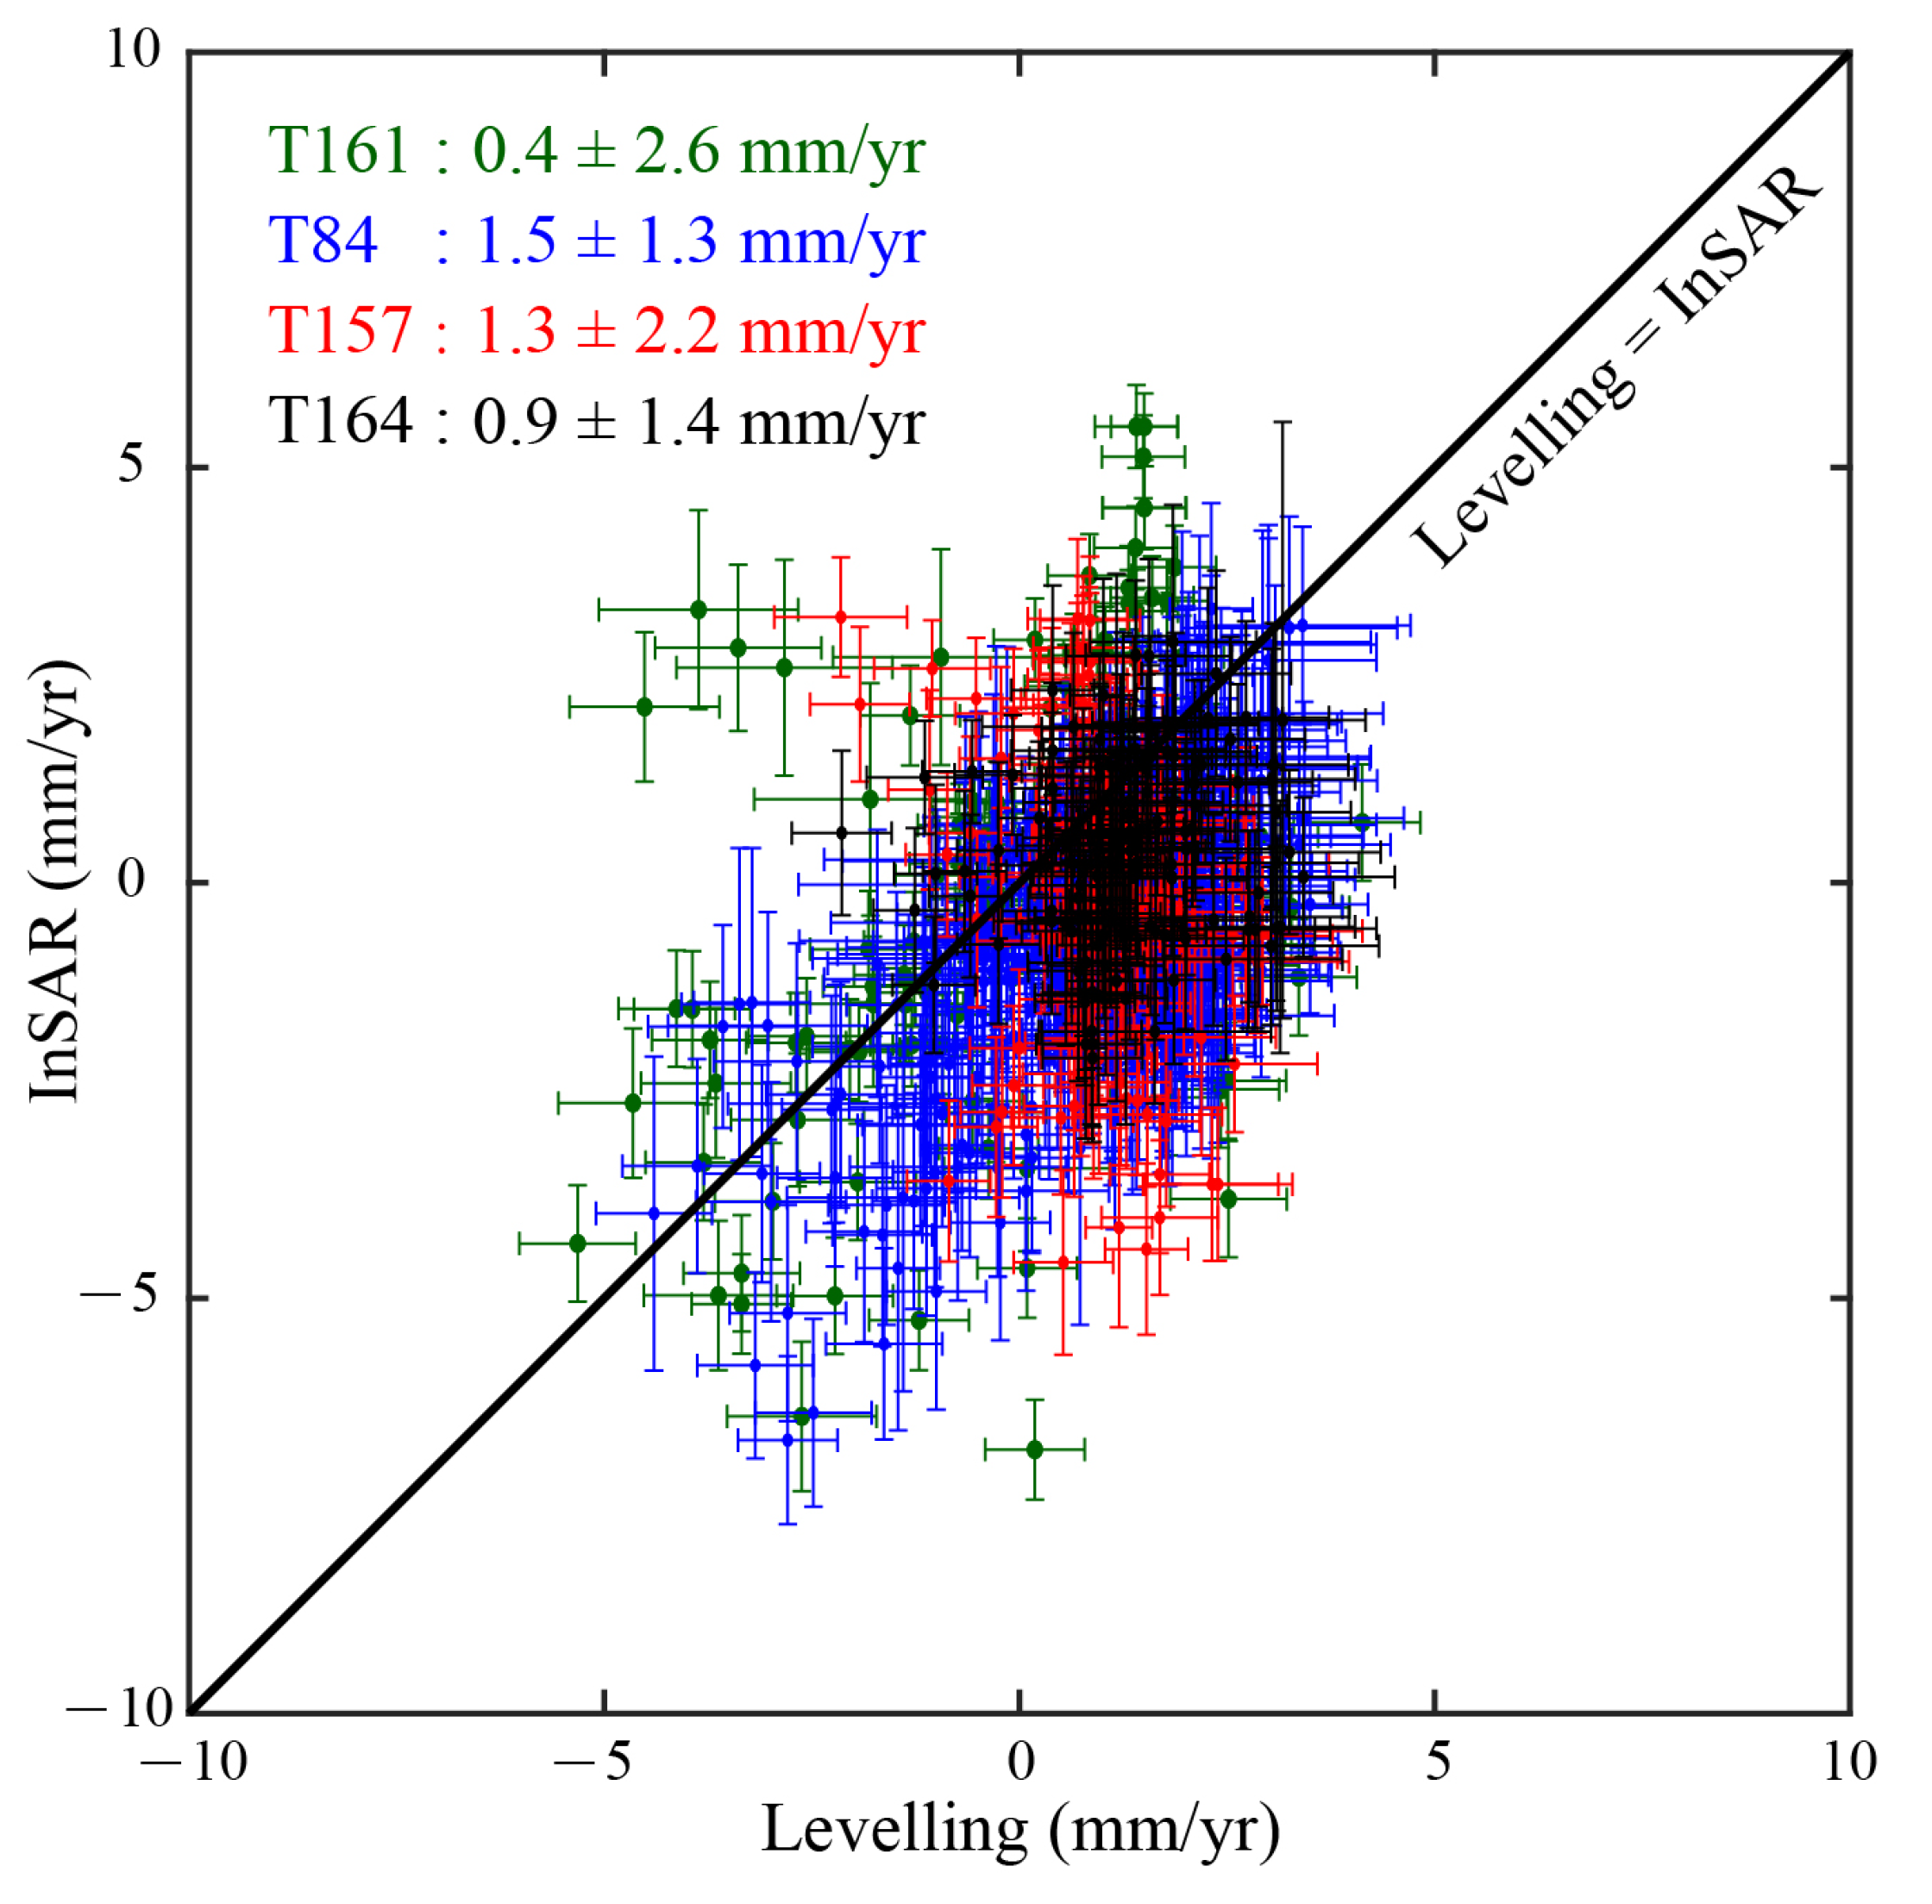
3. Results
4. Discussion
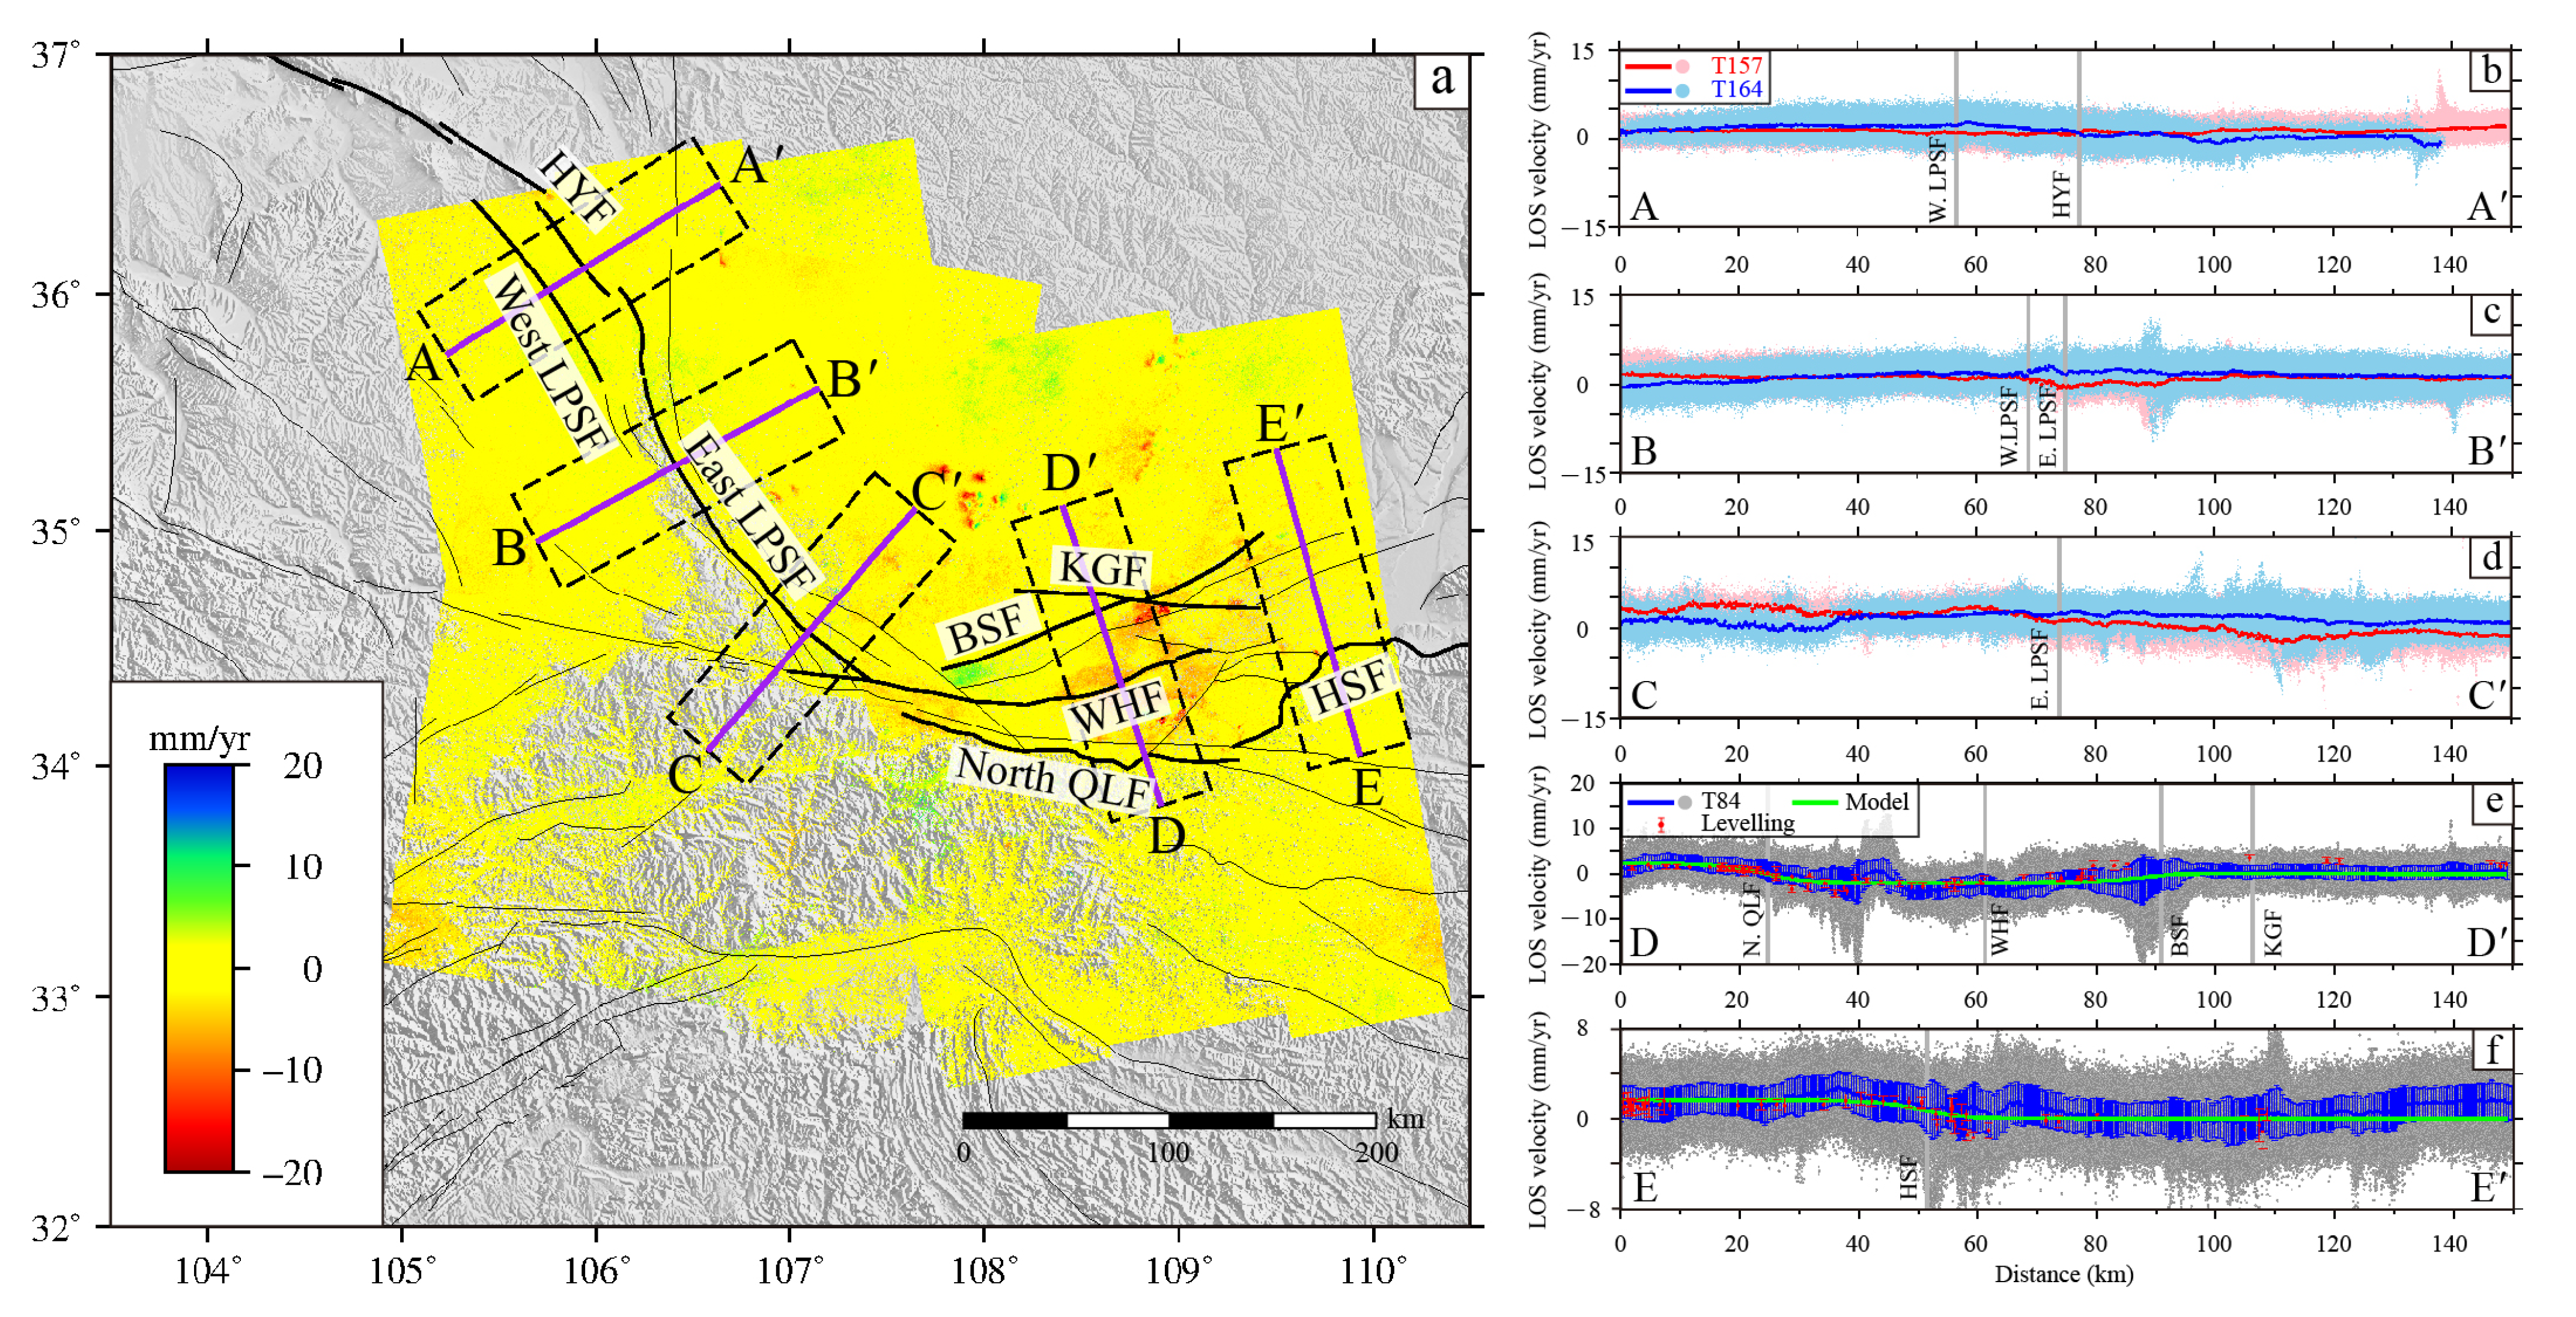
4.1. Tectonic Deformation Surrounding the Weihe Graben
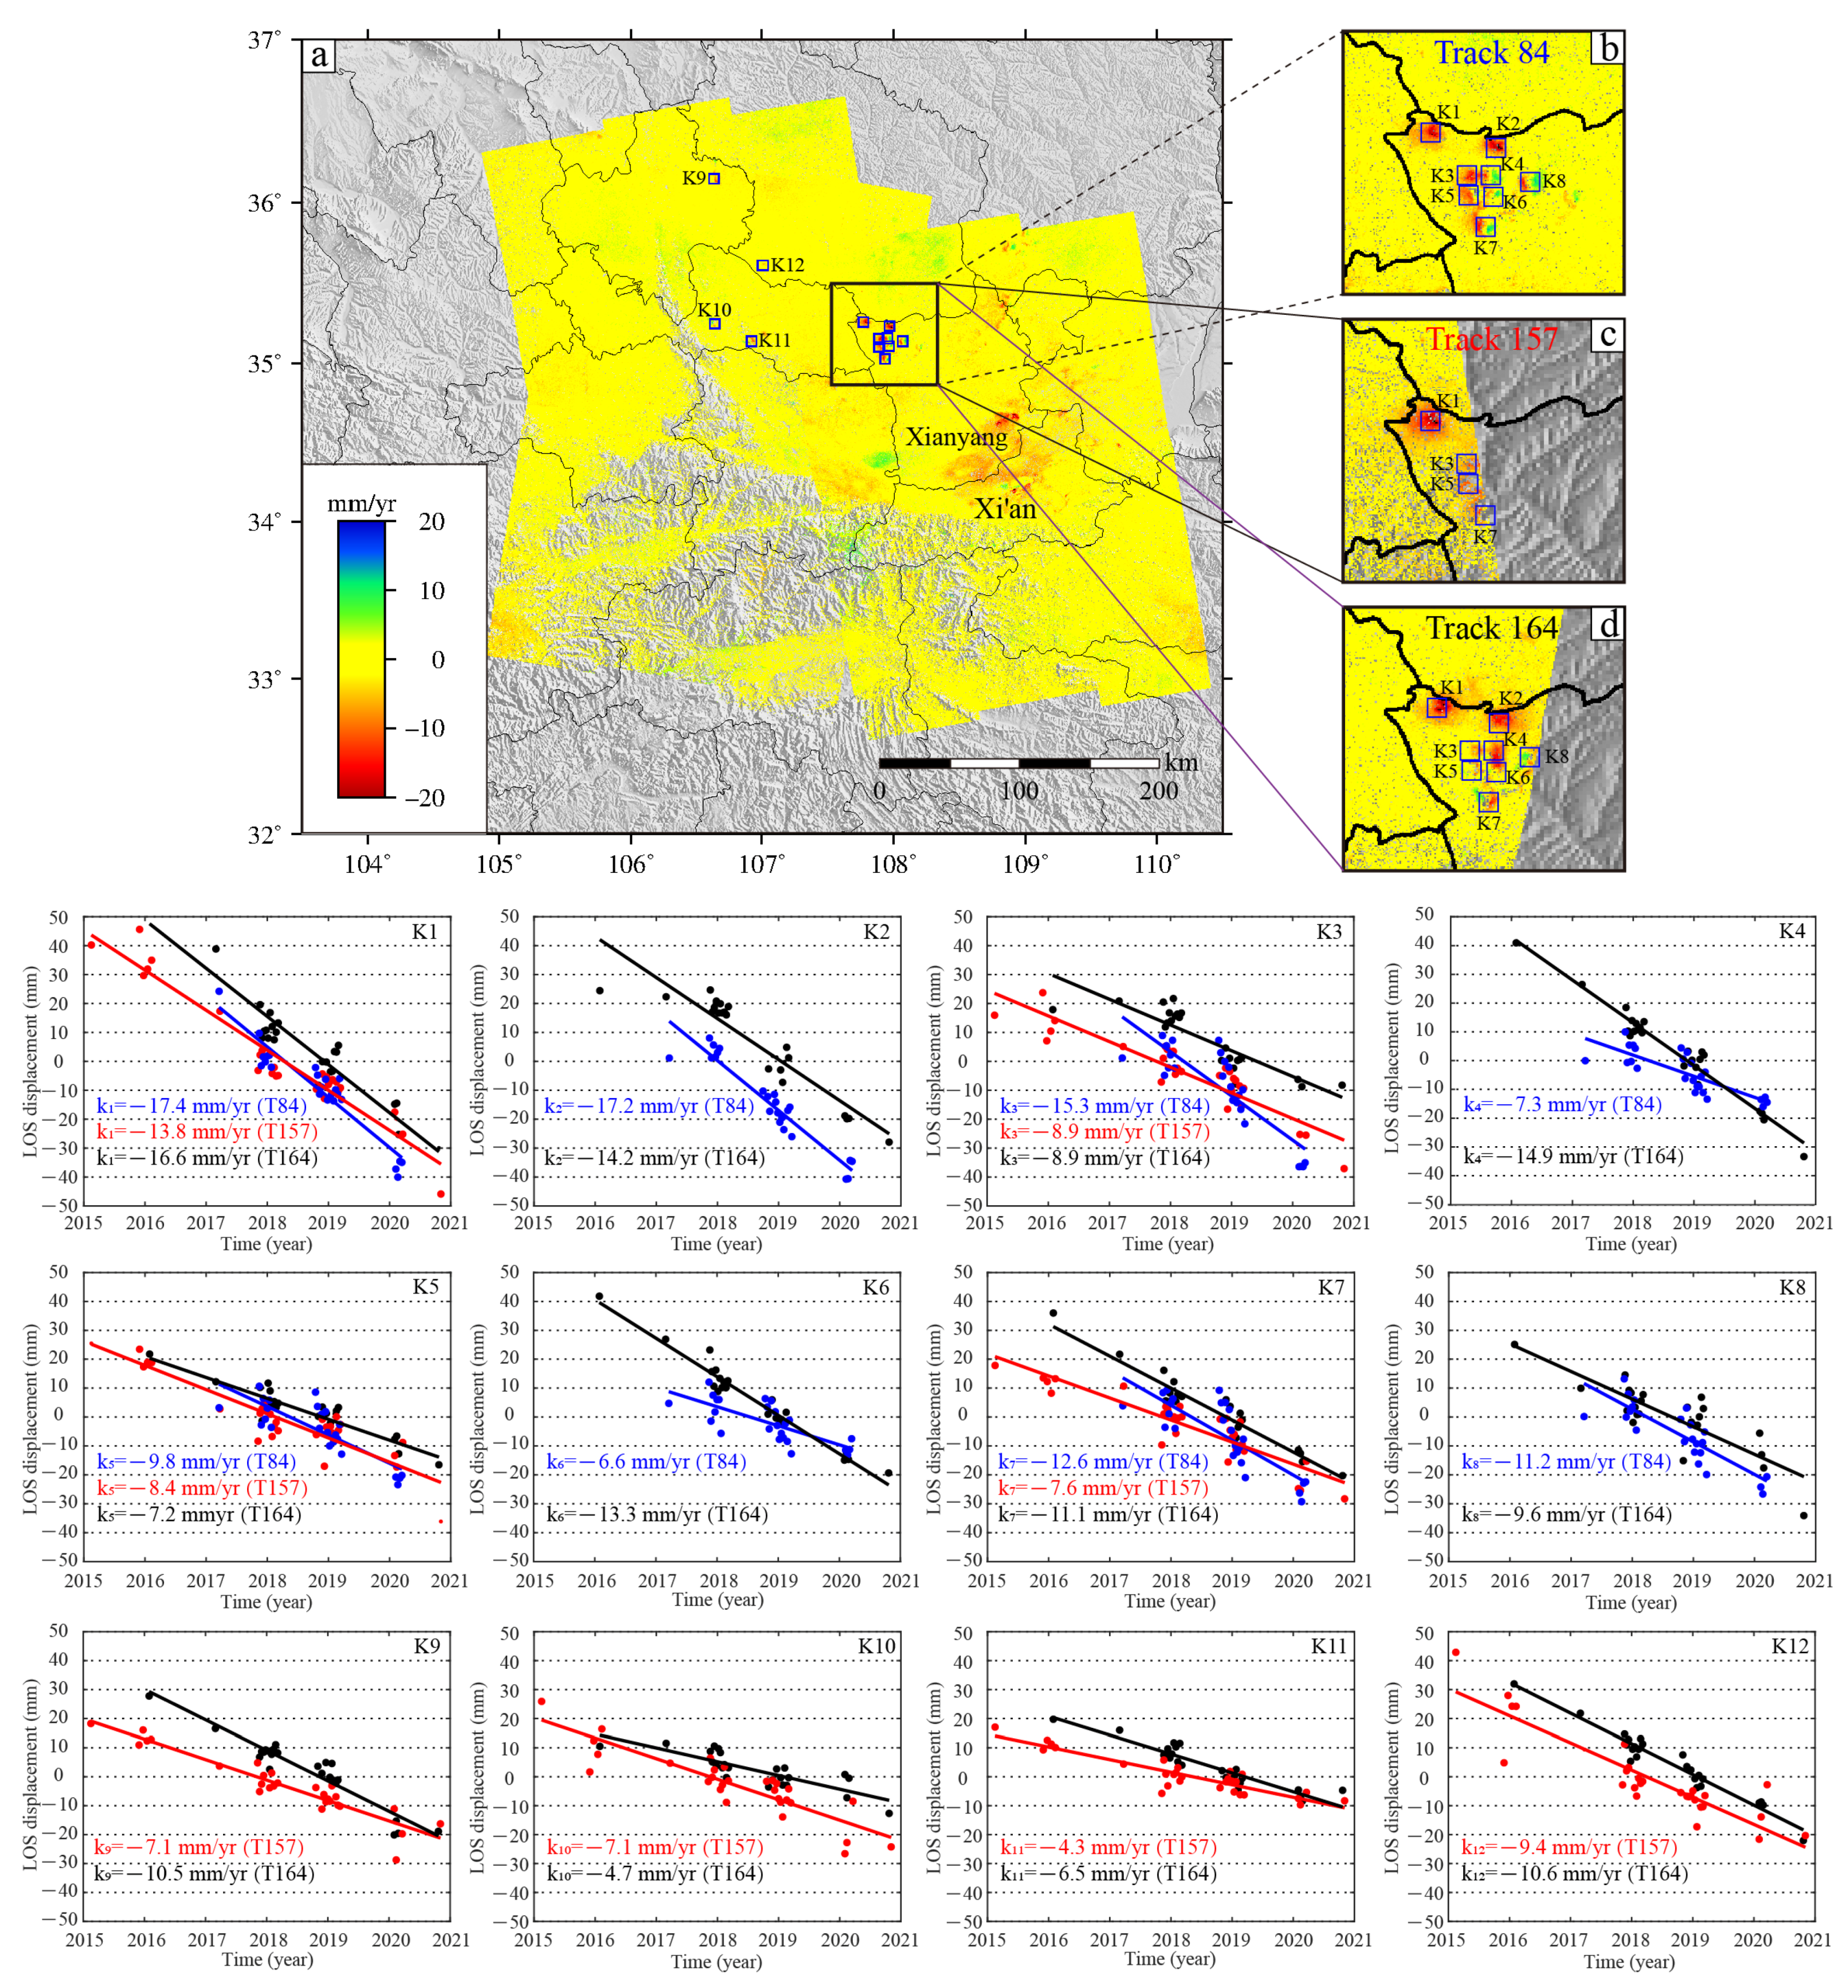
4.2. Mining-Induced Ground Deformation
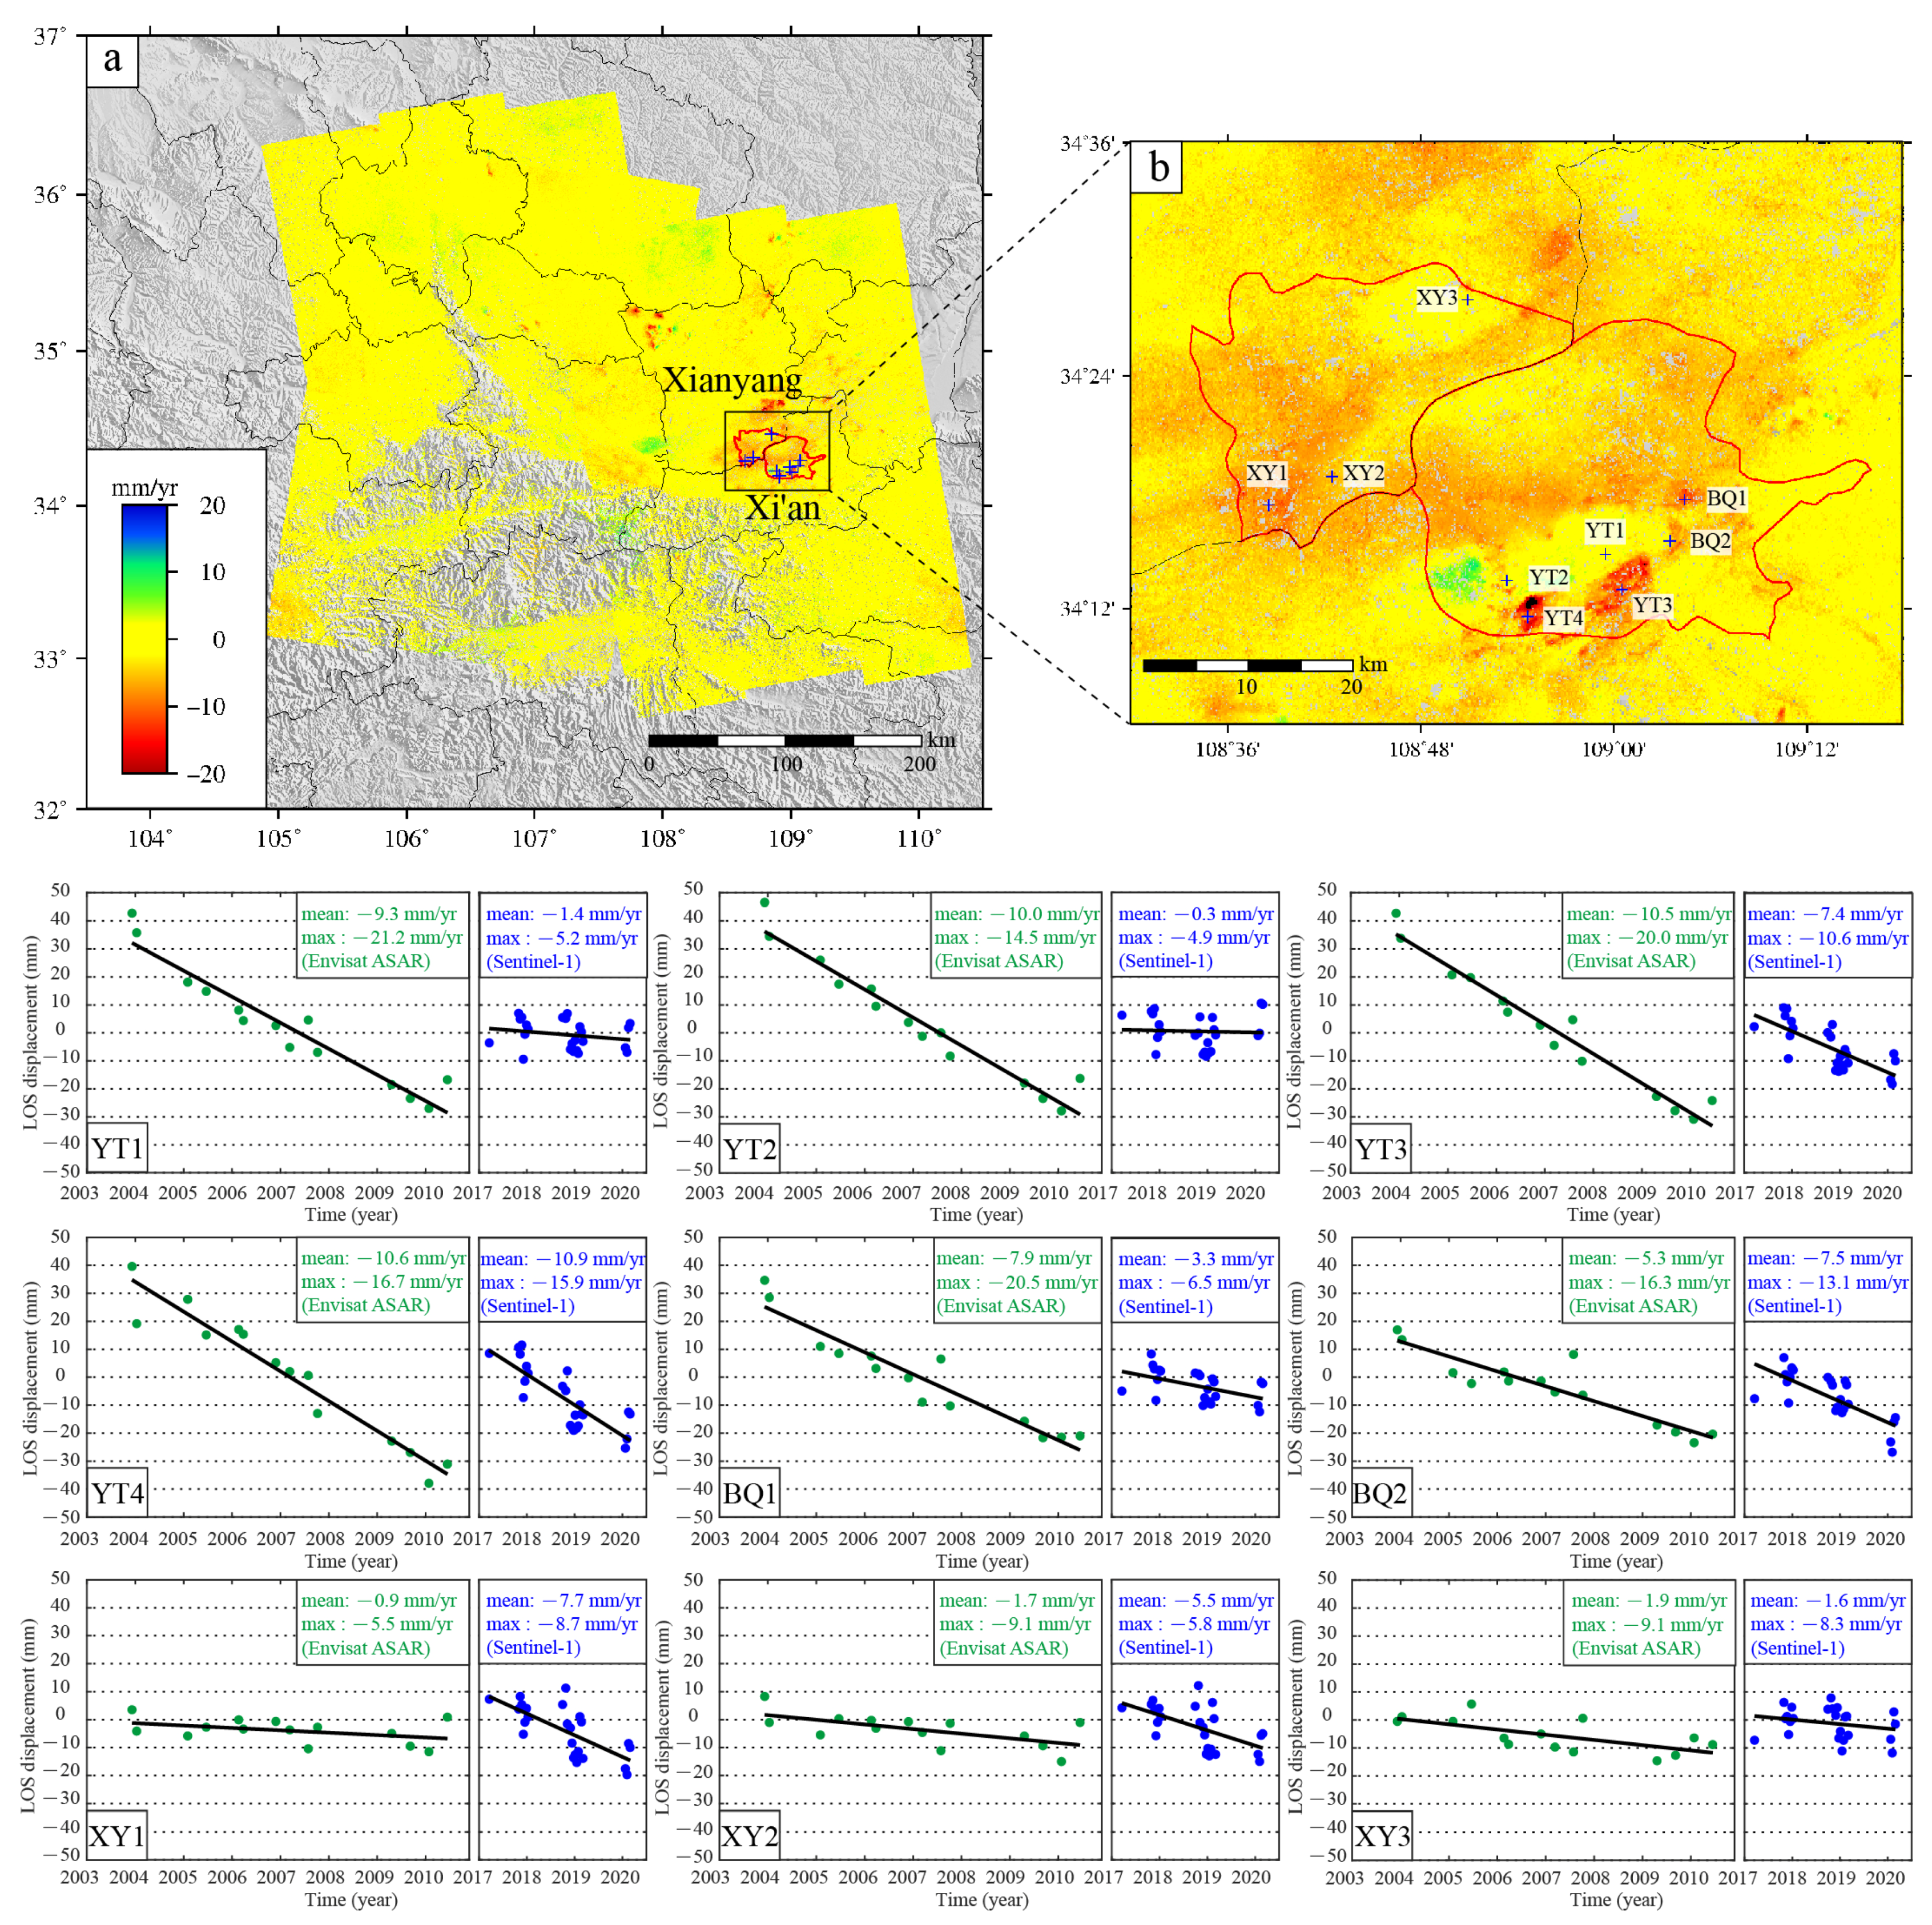
4.3. Decades of Land Subsidence in Major Cities
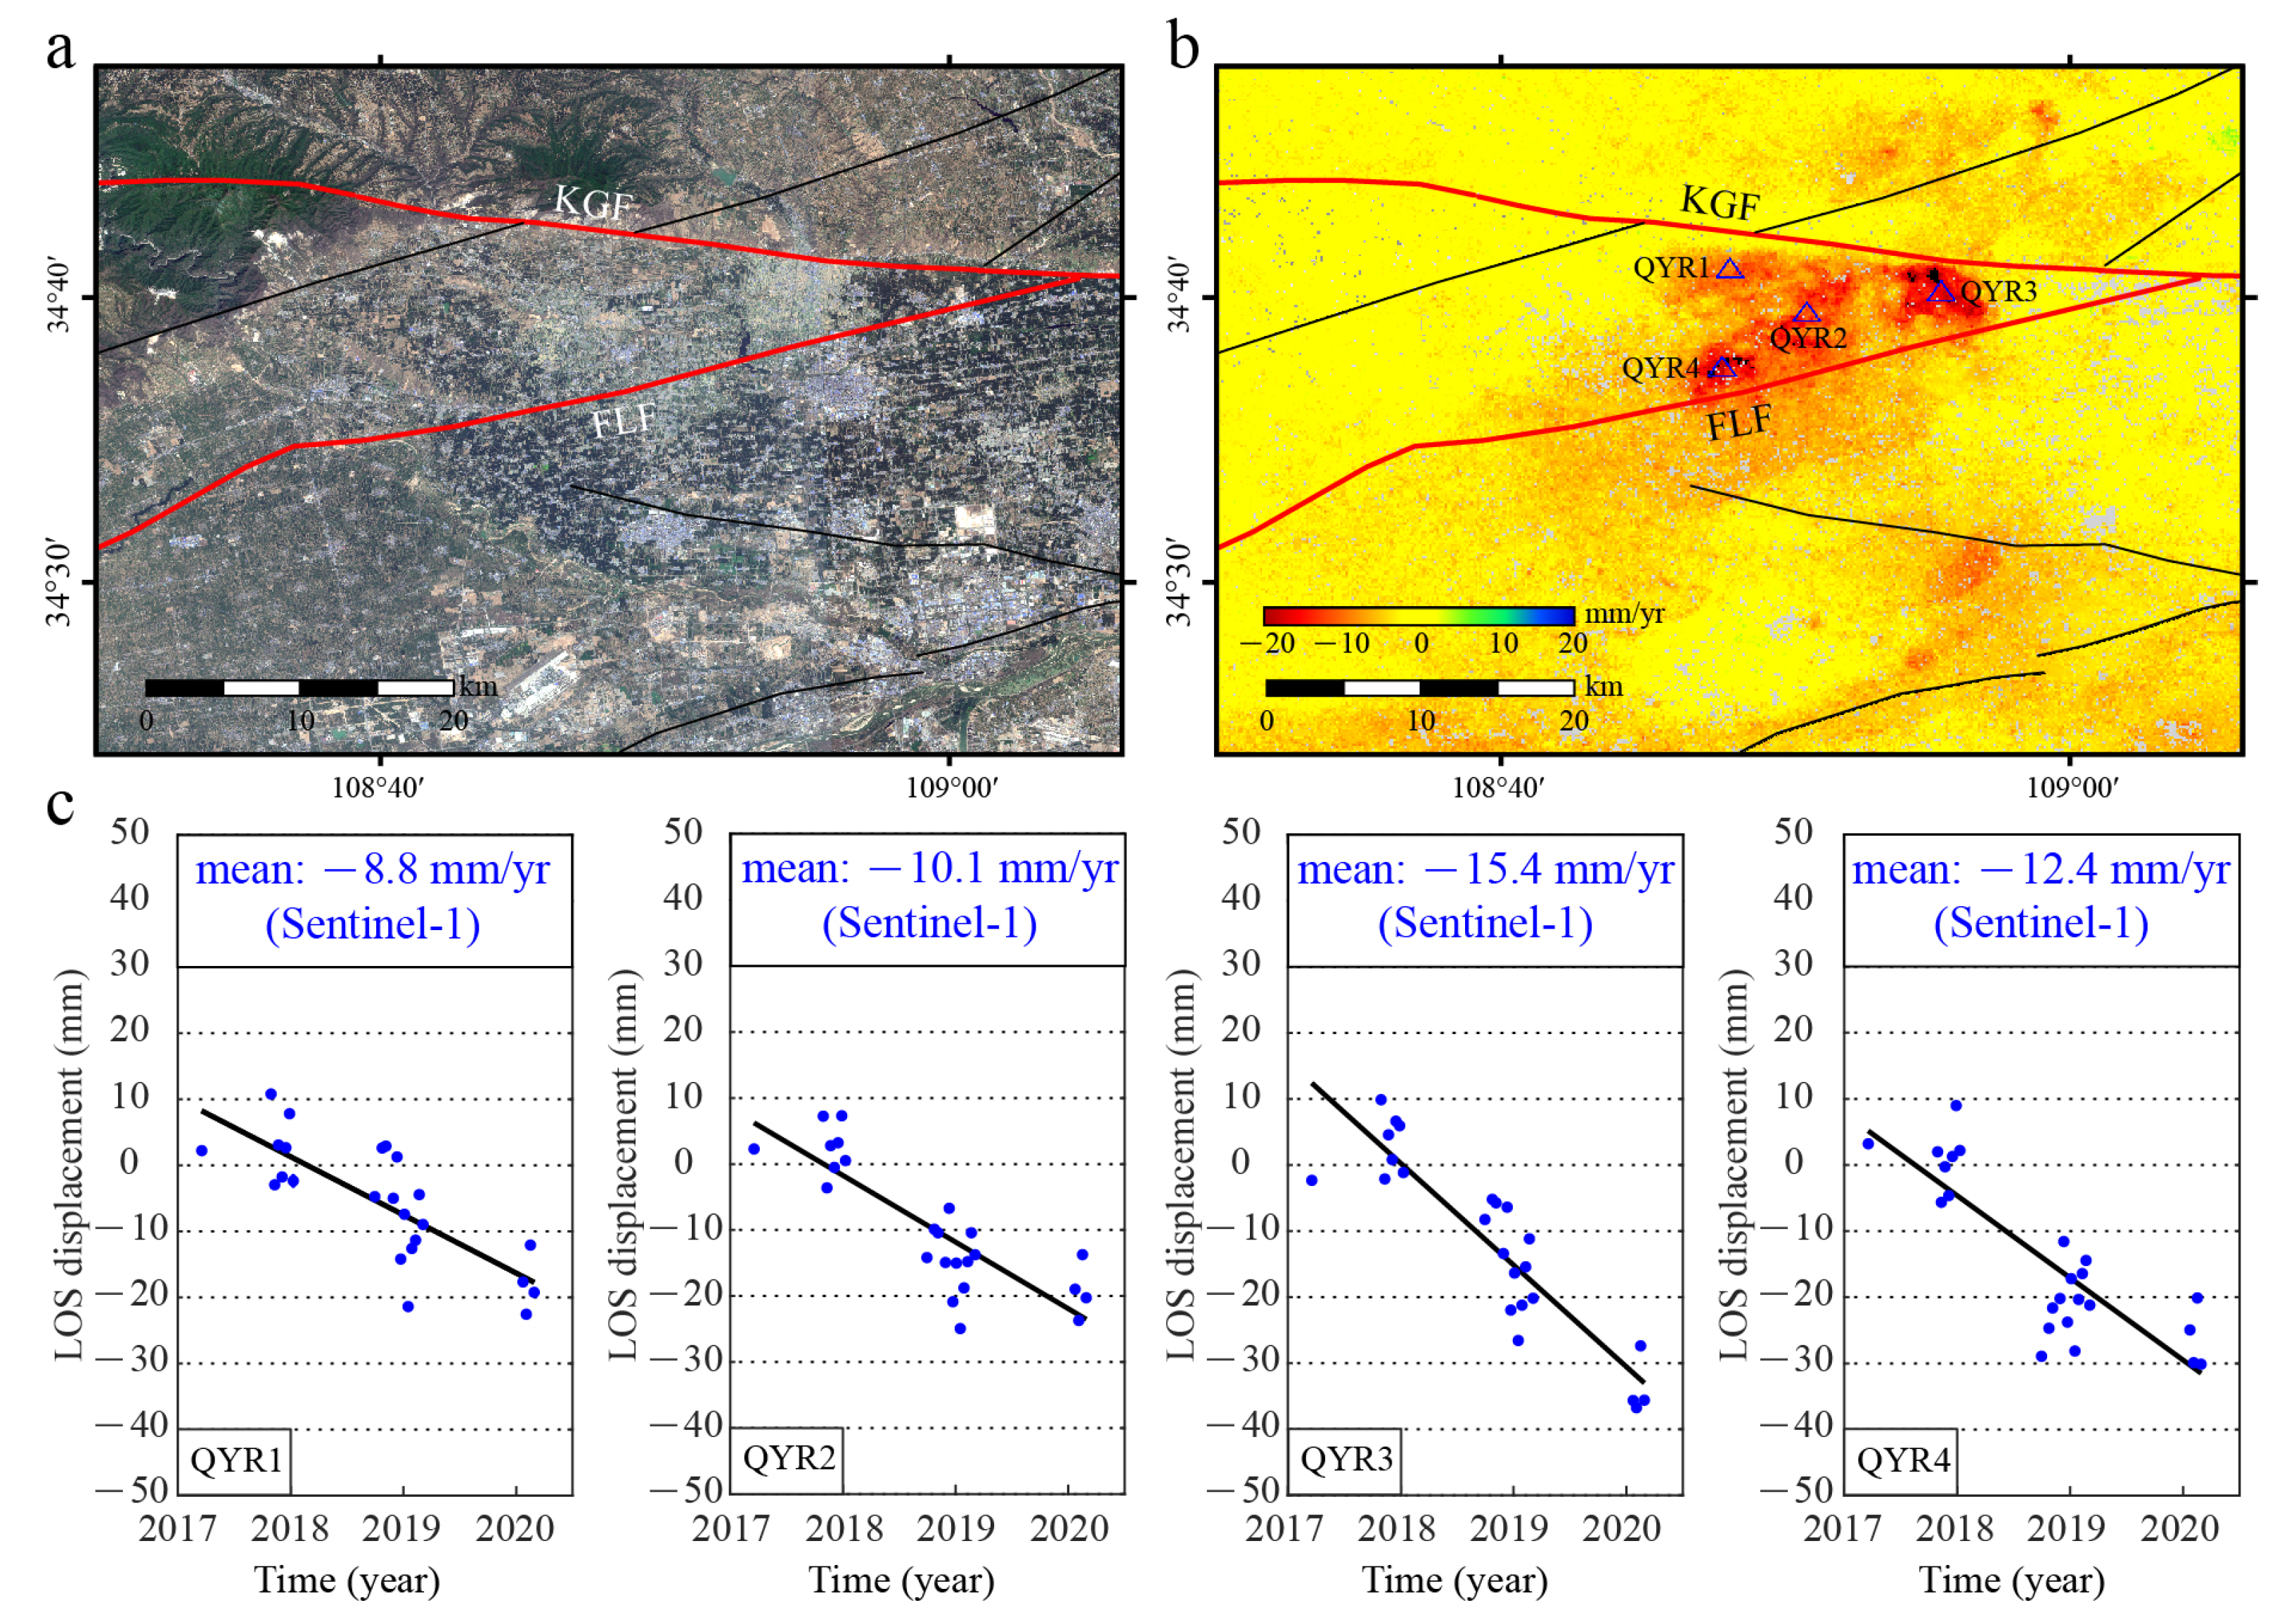
4.4. Subsidence-Induced Coulomb Stress Changes on Nearby Faults
5. Conclusions
Author Contributions
Funding
Data Availability Statement
Acknowledgments
Conflicts of Interest
References
- State Seismology Bureau. Active Fault System around Ordos Massif; Seismological Press: Beijing, China, 1988. [Google Scholar]
- Zhang, Y.Q.; Mercier, J.L.; Vergély, P. Extension in the graben systems around the Ordos (China), and its contribution to the extrusion tectonics of south China with respect to Gobi-Mongolia. Tectonophysics 1998, 285, 41–75. [Google Scholar] [CrossRef]
- Yuan, T.; Feng, X. The 1556 Huaxian Great Earthquake; Seismological Press: Beijing, China, 2010. [Google Scholar]
- Feng, X.; Ma, J.; Zhou, Y.; England, P.; Parsons, B.; Rizza, M.; Walker, R. Geomorphology and Paleoseismology of the Weinan fault, Shaanxi, central China, and the source of the 1556 Huaxian earthquake. J. Geophys. Res. Solid Earth 2020, 125, e2019JB017848. [Google Scholar] [CrossRef]
- Lin, A.; Rao, G.; Yan, B. Flexural fold structures and active faults in the northern–western Weihe Graben, central China. J. Asian Earth Sci. 2015, 114, 226–241. [Google Scholar] [CrossRef]
- Rao, G.; Lin, A.; Yan, B.; Jia, D.; Wu, X. Tectonic activity and structural features of active intracontinental normal faults in the Weihe Graben, central China. Tectonophysics 2014, 636, 270–285. [Google Scholar] [CrossRef]
- Wang, S.; Shi, Y.; Feng, X.; Tian, Z. Late Quaternary sinistral strike-slipping of the Liupanshan-Baoji fault zone: Implications for the growth of the northeastern Tibetan Plateau. Geomorphology 2021, 380, 107628. [Google Scholar] [CrossRef]
- Xu, X.; Han, Z.; Yang, X.; Zhang, S.; Yu, G.; Zhou, B.; Li, F.; Ma, B.; Chen, G.; Ran, Y. Seismotectonic Map in China and Its Adjacent Regions; Seismological Press: Beijing, China, 2016. [Google Scholar]
- Zhao, C.; Zhang, Q.; Ding, X.; Lu, Z.; Yang, C.; Qi, X. Monitoring of land subsidence and ground fissures in Xi’an, China 2005–2006: Mapped by SAR interferometry. Environ. Geol. 2009, 58, 1533–1540. [Google Scholar] [CrossRef]
- Qu, F.; Zhang, Q.; Lu, Z.; Zhao, C.; Yang, C.; Zhang, J. Land subsidence and ground fissures in Xi’an, China 2005–2012 revealed by multi-band InSAR time-series analysis. Remote Sens. Environ. 2014, 155, 366–376. [Google Scholar] [CrossRef]
- Jiang, J.; Lohman, R.B. Coherence-guided InSAR deformation analysis in the presence of ongoing land surface changes in the Imperial Valley, California. Remote Sens. Environ. 2021, 253, 112160. [Google Scholar] [CrossRef]
- Delgado Blasco, J.M.; Foumelis, M.; Stewart, C.; Hooper, A. Measuring urban subsidence in the Rome metropolitan area (Italy) with Sentinel-1 SNAP-StaMPS persistent scatterer interferometry. Remote Sens. 2019, 11, 129. [Google Scholar] [CrossRef]
- Wang, H.; Wright, T.J.; Yu, Y.; Lin, H.; Jiang, L.; Li, C.; Qiu, G. InSAR reveals coastal subsidence in the Pearl River Delta, China. Geophys. J. Int. 2012, 191, 1119–1128. [Google Scholar] [CrossRef]
- Abidin, H.Z.; Andreas, H.; Gumilar, I.; Fukuda, Y.; Pohan, Y.E.; Deguchi, T. Land subsidence of Jakarta (Indonesia) and its relation with urban development. Nat. Hazards 2011, 59, 1753. [Google Scholar] [CrossRef]
- Chaussard, E.; Wdowinski, S.; Cabral-Cano, E.; Amelung, F. Land subsidence in central Mexico detected by ALOS InSAR time-series. Remote Sens. Environ. 2014, 140, 94–106. [Google Scholar] [CrossRef]
- Cigna, F.; Tapete, D. Present-day land subsidence rates, surface faulting hazard and risk in Mexico City with 2014–2020 Sentinel-1 IW InSAR. Remote Sens. Environ. 2021, 253, 112161. [Google Scholar] [CrossRef]
- González, P.J.; Tiampo, K.F.; Palano, M.; Cannavó, F.; Fernández, J. The 2011 Lorca earthquake slip distribution controlled by groundwater crustal unloading. Nat. Geosci. 2012, 5, 821–825. [Google Scholar] [CrossRef]
- Farr, T.G.; Rosen, P.A.; Caro, E.; Crippen, R.; Duren, R.; Hensley, S.; Kobrick, M.; Paller, M.; Rodriguez, E.; Roth, L.; et al. The shuttle radar topography mission. Rev. Geophys. 2007, 45. [Google Scholar] [CrossRef]
- Hooper, A. A multi-temporal InSAR method incorporating both persistent scatterer and small baseline approaches. Geophys. Res. Lett. 2008, 35. [Google Scholar] [CrossRef]
- Hooper, A.; Bekaert, D.; Spaans, K.; Arıkan, M. Recent advances in SAR interferometry time series analysis for measuring crustal deformation. Tectonophysics 2012, 514, 1–13. [Google Scholar] [CrossRef]
- Bekaert, D.; Walters, R.; Wright, T.; Hooper, A.; Parker, D. Statistical comparison of InSAR tropospheric correction techniques. Remote Sens. Environ. 2015, 170, 40–47. [Google Scholar] [CrossRef]
- Yu, C.; Li, Z.; Penna, N.T.; Crippa, P. Generic atmospheric correction model for Interferometric Synthetic Aperture Radar observations. J. Geophys. Res. Solid Earth 2018, 123, 9202–9222. [Google Scholar] [CrossRef]
- Hao, M.; Wang, Q.; Cui, D.; Liu, L.; Zhou, L. Present-day crustal vertical motion around the Ordos block constrained by precise leveling and GPS data. Surv. Geophys. 2016, 37, 923–936. [Google Scholar] [CrossRef]
- Shen, L.; Hooper, A.; Elliott, J. A spatially varying scaling method for InSAR tropospheric corrections using a high-resolution weather model. J. Geophys. Res. Solid Earth 2019, 124, 4051–4068. [Google Scholar] [CrossRef]
- Qiao, X.; Zhou, Y. Geodetic imaging of shallow creep along the Xianshuihe fault and its frictional properties. Earth Planet. Sci. Lett. 2021, 567, 117001. [Google Scholar] [CrossRef]
- Gudmundsson, A. Active fault zones and groundwater flow. Geophys. Res. Lett. 2000, 27, 2993–2996. [Google Scholar] [CrossRef]
- Song, X.; Jiang, Y.; Shan, X.; Gong, W.; Qu, C. A fine velocity and strain rate field of present-day crustal motion of the Northeastern Tibetan Plateau inverted jointly by InSAR and GPS. Remote Sens. 2019, 11, 435. [Google Scholar] [CrossRef]
- Segall, P. Earthquake and Volcano Deformation; Princeton University Press: Princeton, NJ, USA, 2010. [Google Scholar]
- Li, D.; Du, J.; Ma, Y.; Xiao, A. Active faults and dip slip rates along the northern margins of the Huashan Mountain and Weinan loess tableland in the southeastern Weihe Graben, central China. J. Asian Earth Sci. 2015, 114, 266–278. [Google Scholar] [CrossRef]
- Yang, Z.; Li, Z.; Zhu, J.; Wang, Y.; Wu, L. Use of SAR/InSAR in Mining Deformation Monitoring, Parameter Inversion, and Forward Predictions: A Review. IEEE Geosci. Remote Sens. Mag. 2020, 8, 71–90. [Google Scholar] [CrossRef]
- Chen, Y.; Tong, Y.; Tan, K. Coal Mining Deformation Monitoring Using SBAS-InSAR and Offset Tracking: A Case Study of Yu County, China. IEEE J. Sel. Top. Appl. Earth Obs. Remote Sens. 2020, 13, 6077–6087. [Google Scholar] [CrossRef]
- Dong, S.; Samsonov, S.; Yin, H.; Ye, S.; Cao, Y. Time-series analysis of subsidence associated with rapid urbanization in Shanghai, China measured with SBAS InSAR method. Environ. Earth Sci. 2014, 72, 677–691. [Google Scholar] [CrossRef]
- Wetzler, N.; Shalev, E.; Göbel, T.; Amelung, F.; Kurzon, I.; Lyakhovsky, V.; Brodsky, E.E. Earthquake swarms triggered by groundwater extraction near the Dead Sea fault. Geophys. Res. Lett. 2019, 46, 8056–8063. [Google Scholar] [CrossRef]
- Bawden, G.W.; Thatcher, W.; Stein, R.S.; Hudnut, K.W.; Peltzer, G. Tectonic contraction across Los Angeles after removal of groundwater pumping effects. Nature 2001, 412, 812–815. [Google Scholar] [CrossRef] [PubMed]
- Fialko, Y.; Simons, M. Deformation and seismicity in the Coso geothermal area, Inyo County, California: Observations and modeling using satellite radar interferometry. J. Geophys. Res. Solid Earth 2000, 105, 21781–21793. [Google Scholar] [CrossRef]
- Segall, P. Earthquakes triggered by fluid extraction. Geology 1989, 17, 942–946. [Google Scholar] [CrossRef]
- Barbot, S.; Fialko, Y. Fourier-domain Green’s function for an elastic semi-infinite solid under gravity, with applications to earthquake and volcano deformation. Geophys. J. Int. 2010, 182, 568–582. [Google Scholar] [CrossRef]
- De Novellis, V.; Convertito, V.; Valkaniotis, S.; Casu, F.; Lanari, R.; Tobar, M.F.M.; Pino, N.A. Coincident locations of rupture nucleation during the 2019 Le Teil earthquake, France and maximum stress change from local cement quarrying. Commun. Earth Environ. 2020, 1, 20. [Google Scholar] [CrossRef]
- Amelung, F.; Galloway, D.L.; Bell, J.W.; Zebker, H.A.; Laczniak, R.J. Sensing the ups and downs of Las Vegas: InSAR reveals structural control of land subsidence and aquifer-system deformation. Geology 1999, 27, 483–486. [Google Scholar] [CrossRef]
- Chaussard, E.; Bürgmann, R.; Shirzaei, M.; Fielding, E.J.; Baker, B. Predictability of hydraulic head changes and characterization of aquifer-system and fault properties from InSAR-derived ground deformation. J. Geophy. Res. Solid Earth 2014, 119, 6572–6590. [Google Scholar] [CrossRef]
- Hwang, J.M.; Wu, C.M. Land subsidence problems in Taipei Basin. In Proceedings of the Tokyo Symposium on Land Subsidence, Tokyo, Japan, 17–24 September 1969; Volume 1, pp. 21–34. [Google Scholar]
- Guzy, A.; Malinowska, A.A. State of the art and recent advancements in the modelling of land subsidence induced by groundwater withdrawal. Water 2020, 12, 2051. [Google Scholar] [CrossRef]
- Li, Y.; Wang, Q.; Cui, D.; Hao, M. Analysis on the Faulting Origin of Kouzhen-Guanshan Fault in Weihe Basin. J. Geod. Geodyn. 2016, 36, 669–673. [Google Scholar]
- Stein, R.S. The role of stress transfer in earthquake occurrence. Nature 1999, 402, 605–609. [Google Scholar] [CrossRef]
- King, G.C.; Stein, R.S.; Lin, J. Static stress changes and the triggering of earthquakes. Bull. Seismol. Soc. Am. 1994, 84, 935–953. [Google Scholar]
- Tang, L.; Lu, Z.; Zhang, M.; Sun, L.; Wen, L. Seismicity induced by simultaneous abrupt changes of injection rate and well pressure in Hutubi gas field. J. Geophy. Res. Solid Earth 2018, 123, 5929–5944. [Google Scholar] [CrossRef]


Publisher’s Note: MDPI stays neutral with regard to jurisdictional claims in published maps and institutional affiliations. |
© 2021 by the authors. Licensee MDPI, Basel, Switzerland. This article is an open access article distributed under the terms and conditions of the Creative Commons Attribution (CC BY) license (https://creativecommons.org/licenses/by/4.0/).
Share and Cite
Chen, J.; Zhou, Y.; Chen, G.; Hao, M. Decades of Ground Deformation in the Weihe Graben, Shaanxi Province, China, in Response to Various Land Processes, Observed by Radar Interferometry and Levelling. Remote Sens. 2021, 13, 2374. https://doi.org/10.3390/rs13122374
Chen J, Zhou Y, Chen G, Hao M. Decades of Ground Deformation in the Weihe Graben, Shaanxi Province, China, in Response to Various Land Processes, Observed by Radar Interferometry and Levelling. Remote Sensing. 2021; 13(12):2374. https://doi.org/10.3390/rs13122374
Chicago/Turabian StyleChen, Jianlong, Yu Zhou, Gan Chen, and Ming Hao. 2021. "Decades of Ground Deformation in the Weihe Graben, Shaanxi Province, China, in Response to Various Land Processes, Observed by Radar Interferometry and Levelling" Remote Sensing 13, no. 12: 2374. https://doi.org/10.3390/rs13122374
APA StyleChen, J., Zhou, Y., Chen, G., & Hao, M. (2021). Decades of Ground Deformation in the Weihe Graben, Shaanxi Province, China, in Response to Various Land Processes, Observed by Radar Interferometry and Levelling. Remote Sensing, 13(12), 2374. https://doi.org/10.3390/rs13122374