Abstract
Most of the world’s glaciers have retreated significantly against the background of recent climate warming, while reports have indicated that the glaciers in the West Kunlun Mountains (WKL) may be in a relatively stable state, although there are some gaps in previous research. Based on Landsat series data, topographic maps, SRTM and TanDEM-x data, this paper extracts detailed glacial area information and glacial mass balance during different time periods from 1970 to 2018. We found that, the total area of glaciers in the WKL decreased by 8.0 km2 from 1972 to 2018. The area decreased by 12.0 km2 from 1972 to 1991 and increased by 4.7 km2 from 2010 to 2018. Glacier surface elevation change results in the WKL showed that the overall glacier thickness slightly decreased from 1970 to 2016, with an average of 1.9 ± 1.0 m. The glaciers thinned by approximately 2.5 ± 1.0 m from 1970 to 2000, while from 2000 to 2016, the glaciers thickened approximately by 0.6 ± 1.0 m. Overall, the glaciers in the WKL showed very slight retreat. In addition, the mass changes of glaciers were affected by glacial surging.
1. Introduction
Most of the glaciers in the Tibetan Plateau (TP) have retreated significantly against the background of recent climate warming [1,2,3,4,5,6]. In contrast, Karakoram glaciers have remained stable or advanced during the same period [5,7]. This pattern is known as the “Karakoram Anomaly” [7]. This phenomenon of heterogeneous glacier variations in TP regions is mainly attributable to different spatial patterns of climate change [5].
Glaciers in the Karakoram and West Kunlun Mountains (WKL) region are mainly affected by mid-latitude westerlies and receive minor influences from the Asian summer monsoons [1,5]. According to the China Glacier Inventory (CGI) [8], the WKL region is the most concentrated area of large mountain glaciers in China, attracting the attention of many scholars. The results of studies on the glacier mass balance in this region differ. Some studies have shown that the glacier is thinning, some have shown that it has remained basically the same, and some have shown that it is thickening. Wang et al. [9] showed that the mass balance was −0.06 ± 0.13 m w.e. a−1 from the 1970s–1999 in the WKL through topographic maps and Shuttle Radar Topography Mission (SRTM) data. For the same time period, Zhou et al. [10] used the results of glacier surface elevation obtained by the KeyHole-9 photographic satellite mission (KH-9)and SRTM to show that some glaciers in the region had a mass balance close to 0 or slight thickening. According to the ICESat altimeter, glaciers in this region thickened significantly during the period from 2003 to 2009 [4,8,11].
Studies on glacier area change have shown that the glacier area in the WKL has been decreasing over the past few decades. However, in later periods, especially after 2010, the glaciers exhibited a tendency to advance. Shangguan et al. [12] showed that the total glacier area decreased from 1970 to 2001 although with a slight increase from 1990 to 2001. The results from Bao et al. [11] concluded that the glaciers in the WKL decreased from 1970 to 2010 overall, while the glacier area on the south slope increased from 1990 to 2010. Wang et al. [9] found that from 1970 to 2016, the glacier area in this region also showed a decreasing trend. According to Han [13], the glacier area in the WKL decreased by 2.95% from 1977 to 2013, while Ma [14] showed that the glacier area showed a slight increase from 2010 to 2017.
Bao et al. [11] obtained a slightly positive mass trend of 0.23 ± 0.24 m through ICESat from 2003 to 2009. However, also based on ICESat, Ke et al. [8] found that the surface height changes were heterogeneous over 2003–2008. In addition, ICESat can provide information on only the changes of some footprints, and the time frame is limited to 2003–2009. Zhou et al. [10] used KH-9 and SRTM to show that glaciers in WKL exhibited an almost 0 or slight positive mass balance of 0.02 ± 0.10 m w.e. a−1 from 1970 to 2000. However, because of data problems, there are extensive spatial data gaps. However, Wang et al. [9] showed that the mass balance was −0.06 ± 0.13 m w.e. a−1 in the same time period through topographic maps and SRTM data.
The WKL is located in the northwest of the TP and is one of the highest elevation areas in the world (Figure 1). According to CGI-2, there are 433 glaciers in WKL with an area of 2961.3 km2 [6]. The glaciers have limited debris cover, accounting for approximately 3% of the total glacier area [15]. Of all the glaciers in High Mountain Asia, the WKL glaciers are located in the most continental climate because the WKL is the coldest and driest region on and around the Tibetan Plateau [16].
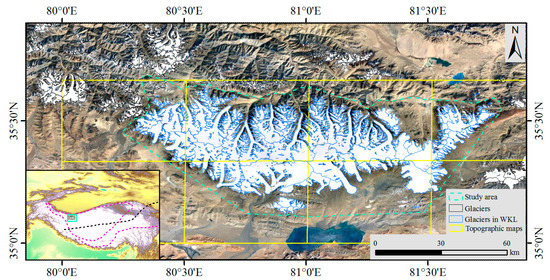
Figure 1.
Location of the Western Kunlun Mountains (WKL) on remote sensing images from Google Earth. The inset indicates the locations of the WKL and Tibetan Plateau. The black dotted line indicates the dividing line between monsoon and westerlies [17]. The pink dotted line indicates the dividing line between different glacier types [18]. The WKL glaciers are continental (polar)-type glaciers and influenced by westerlies.
According to previous studies, there may also be a phenomenon similar to the “Karakoram Anomaly” in the glaciers in the WKL [9]. However, the results of research by different scholars provide some contrasting results. In addition, previous studies have covered a short time span and lacked a continuous long-sequence study of glaciers. Furthermore, due to data reasons, many studies have studied only part of the glaciers in the study area and did not cover all glaciers in the WKL. Therefore, how the glaciers have changed in the WKL area over the past few decades requires a more comprehensive study of the area and mass changes over a long period of time. Hence, the purpose of this article is to (1) obtain continuous changes in the area of glaciers in the WKL area since 1970 through multi-source remote sensing images. (2) Obtain the changes in glacial mass in the WKL area since 1970 through multi-phase DEM.
2. Materials and Methods
This study calculated the glacier area change from the band ratio method and modified the results manually based on multitemporal Landsat series imagery. The ice elevation changes were calculated by differentiating digital elevation models (DEMs) constructed using topographic maps, SRTM and TanDEM-X.
2.1. Data
2.1.1. Landsat Images
Landsat series data (e.g., Landsat 1/2/3 MSS, 4/5 TM, 7 ETM+, 8 OLI) are most frequently used for glacier mapping. The time series of the Landsat scenes have been processed through standard terrain correction (level 1T). L1T satellite images were chosen from 1972 onward (Table 1) from the United States Geological Survey (USGS). As far as possible, images without cloud and snow influences were selected to depict the glaciers. As precipitation mainly occurred in the summer, the wintertime images were considered acceptable in the interest of minimizing seasonal snow and cloud cover. To obtain as many continuous changes in glacier area as possible, 18 Multispectral Scanner System (MSS)/Thematic Mapper (TM)/Enhanced Thematic Mapper Plus (ETM+)/Operational Land Imager (OLI) images (Table 1) were used to extract the glacier outlines from the USGS.

Table 1.
The remote sensing data selected in this study.
2.1.2. Topographic Maps
Eight topographic maps drawn by the China Military Geodetic Survey (CMGS) in October 1970 at a scale of 1:100,000 (Figure 1) was used here to generated the oldest DEM. The outline was digitalized manually, and then the Thiessen polygon method was used to convert it to a grid DEM (TopoDEM) with 30 m grid cells. The nominal vertical accuracy of these topographic maps is 3–5 m in flat and hilly areas (slopes < 6) and about 8–14 m in mountainsides and high mountain areas (slopes 6–25 and >25, respectively).
2.1.3. SRTM
The C-band and X-band SRTM DEMs were obtained from the USGS and the German Aerospace Center (DLR), respectively. The X-band SAR system had a swath width of 45 km, leaving large data gaps in the resulting X-band DEM [19]. Unfortunately, approximately only half of the WKL glaciers were covered by this data set. Therefore, the C-band SRTM DEMs were used to provide a reference altitude to monitor changes in glacial altitude. X-band SRTM DEMs were used to estimate the penetration depth of C-band radar in glacial areas. The SRTM C-band DEM data can represent the height of the glacier surface after the 2000 ablation period, and there is a slight seasonal variation [3,20,21]. The vertical errors indicative of SRTM C-band data range between 7.2 and 12.6 m [22].
2.1.4. TanDEM-X
The Tandem-X mission established the first spaceborne bistatic interferometer on 21 June 2010 and used two close flying satellites to generate global DEM with a resolution of 12 m. It has a height accuracy of 90% of 2 m on the medium terrain [23]. The first verification in Germany shows that the accuracy of 1–2 m can be achieved in relatively flat terrain [24]. The TanDEM-X data used multiple image pairs to generate DEM, and we chose the middle time of the collection cycle to represent the data [25].
2.2. Glacier Outline Mapping, Changes and Uncertainty
All images from USGS have been processed into standard L1T products through standard terrain correction for further pixel-level analysis [26]. Various techniques for automatic glacier mapping using optical satellite images have been successfully applied in different ice regions and the simple band ratio method emerged as the most suitable method [27]. Therefore, outlines of glaciers were derived from Landsat images using the band ratio method except for the MSS images. To retrieve glacial regions from MSS images without short-wave bands, ISODATA unsupervised classification was used, which iteratively clustered the pixel classes using the minimum distance technique [27]. Then all glacier outlines were modified by manual interpretation.
The uncertainty of terrestrial satellite images is estimated to be half a pixel (15 m) as a buffer zone [28,29,30,31]. The difference between the buffer zone and the glacier polygon is between 1.2% and 5.4%, which can be regarded as a rough assessment of the accuracy of mapping [26]. According to the error propagation law, the final uncertainty of the area change (EA) calculated according to Formula (1) [31] is 1.7–7.7%:
where EA1 and EA2 represent the uncertainties of the glacier outlines of time 1 and 2, respectively.
2.3. Glacial Elevation Changes and Uncertainty
The glacier elevation changes were derived from three DEMs (TopoDEM, SRTM-C and TanDEM-X). Bilinear resampling was performed on all DEM to achieve the same horizontal resolution of 30 m. Before any differential analysis can be performed, the DEM needs to be integrated to eliminate both horizontal and vertical offsets [20]. A method proposed by Nuth and Kääb [32] and Paul et al. [27] was used in this study to co-registration the DEMs. The relationship between the observed height difference and aspect ratio was used for relative adjustment (Figure 2). Depending on the effect, multiple iterations will be performed during the correction process. In addition, in order to remove the influence of extreme values on the results, it is necessary to delete them using thresholding [3,33]. Significant statistical features of these height differences are used to exclude pixels representing height differences outside the 5–95 percent range to correct for potential deviations [20,34].
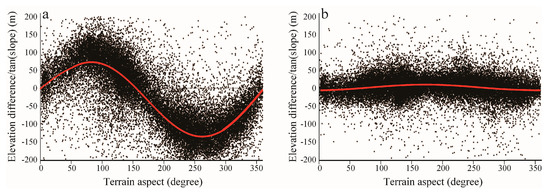
Figure 2.
Scatter plot of slope-standardized altitudinal differences in the terrain aspect for off-glacier areas. (a) Before co-registration and (b) after co-registration.
As noted in previous studies [35,36,37], the altitude-related vertical deviation in mountains can be attributed to the difference in the original spatial resolution between the two DEMs. Coarse DEM tends to underestimate the height of peaks or ridges with high topographic curvature because of their limited ability to represent frequent changes in slope. This deviation can be corrected by the relationship between elevation difference and maximum curvature on a glacier stabilized topography [3,37].
The penetration depth of the SRTM C-band radar beam in snow and ice should be taken into account when evaluating glacier height change [2,20,35]. Depending on different parameters, the penetration depth is generally 0–10 m [38,39]. As the approximation, since the penetration of SRTM X-band radar beam is close to 0, the elevation difference between SRTM c-band and x-band can generally be regarded as the penetration depth of SRTM C-band radar beam against snow and ice [2]. Therefore, the average penetration depth of SRTX C-band in the research is about 2.8 m, which is basically consistent with the results of Wang et al. [9].
After adjustment, we use the normalized median absolute deviation (NMAD; represented by 1.4826 × MED |; : elevational difference; : median) of non-glacier areas to estimate the uncertainty of the difference between DEMs [21,40,41]. In order to convert surface height changes into mass changes, density assumptions are needed. The volume averaged density used is 850 ± 60 kg m−3 (see [42]). The final uncertainty of mass balance (E) is calculated as [40]:
where t is the observation period, is the ice density (850 kg m−3), is the ice density uncertainty (60 kg m−3) and is the water density (1000 kg m−3).
3. Results
3.1. Glacial Area Changes
After band ratio and manual digitization, the glacial boundary between 1972 and 2018 in the WKL was obtained approximately every five years. In 1972, the area of glaciers was 2965.4 km2. In 2018, the area was 2953.4 km2. From 1972 to 2018, the total area of glaciers in the WKL decreased by 8.0 km2. The area decreased by 12.0 km2 from 1972 to 1991 and increased by 4.7 km2 from 2010 to 2018 (Table 2, Figure 3).
Table 2.
Glacial area and changes from 1972 to 2018 in the WKL (the area change is based on the glacier area in 1972).
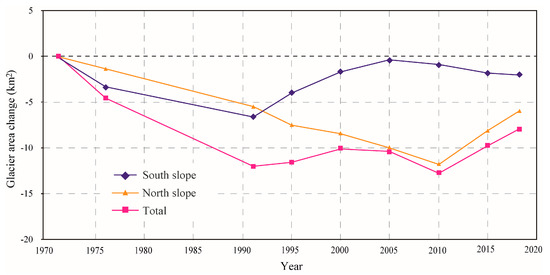
Figure 3.
The glacier area changes on the south slope, north slope and for the total WKL.
The area of the northern slope glacier decreased by 5.95 km2 from 1972 to 2018 including a continuous decrease of 11.8 km2 from 1972 to 2010 and an increase of 5.85 km2 from 2010 to 2018. The change in the area of the southern slope glacier was relatively small. The area of the southern slope glacier decreased by 2.0 km2 from 1972 to 2018, including a decrease of 6.5 km2 from 1972 to 1991 and an increase of 6.2 km2 from 1991 to 2005 (Table 2, Figure 3). The area of the glaciers on the south and north slopes of the WKL decreased notably from 1972 to 1991, resulting in a significant decrease in the total area of glaciers. From 1991 to 2010, the area of the north slope decreased and the area of the south slope increased, making the total area approximately stable with slight fluctuations. From 2010 to 2018, the increase in the total area of glaciers was mainly due to the contribution from the northern slope.
3.2. Glacier Surface Elevation Changes
The results showed that the glaciers in the WKL were nearly balanced with a slight and not notably mass loss within the period from 1970–2016. The glacier surface elevation change was approximately −1.9 ± 1.0 m from 1970 to 2016, with a mass balance of −0.03 ± 0.02 m w.e.a−1. However, over the entire period, the trend of the changes in the glacier surface elevation in the WKL was not consistent. Among these changes, the glaciers thinned overall from 1970 to 2000 and the average elevation of the glacier surface decreased by approximately 2.5 ± 1.0 m, while from 2000 to 2016, the glaciers thickened slightly overall, and the average elevation of the glacier surface increased by approximately 0.6 ± 1.0 m (Table 3).
Table 3.
The surface elevation change from 1972 to 2016 in WKL.
In addition, there were obvious spatial differences in the changes in glacial surface elevation and ice volume in the WKL, and the change trends of the southern and northern slopes were different (Table 3). The northern slope glacier thinned by approximately 4.5 ± 1.0 m during the entire period from 1970 to 2016. Among these changes, thinning was most obvious from 1970 to 2000, and the average elevation decreased by approximately −4.9 ± 1.0 m, while the glaciers thickened slightly from 2000 to 2016, and the average elevation increased by approximately 0.4 ± 1.0 m. The southern slope glacier thickened by approximately 2.4 ± 1.0 m from 1970 to 2016. During the two periods of 1970–2000 and 2000–2016, the glaciers thickened by approximately 1.3 ± 1.0 m and 1.1 ± 1.0 m, respectively (Table 3).
According to the spatial distribution of the glacier thickness changes in the WKL, the glacier thickness changes in this area exhibited large spatial differences (Figure 4). The pattern of the changes in the surface height of glaciers can be roughly divided into two categories. Category one, between 1970–2000 and 2000–2016, the distribution patterns of the glacial thickness changes were the same; category two, the distribution patterns of glacial changes were not consistent between the two time periods.
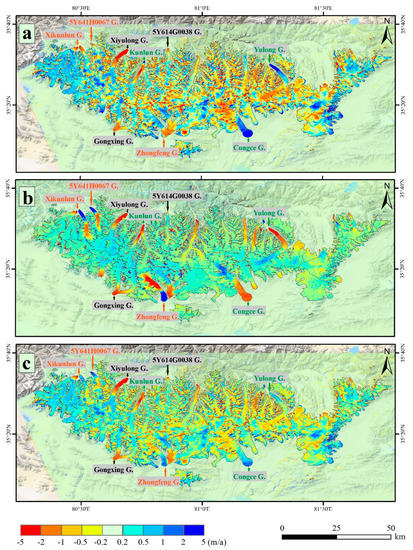
Figure 4.
Changes in glacier surface elevation over time periods: (a) 1970–2000; (b) 2000–2016 and (c) 1970–2016. The names of the glaciers are presented in the text.
Most glaciers exhibited almost the same thickness variation characteristics between 1970–2000 and 2000–2016. At lower elevations, there were large mass losses. As the altitude increased, glacier thinning gradually weakened. The upper part of the glacier thickened. These patterns are similar to most glacier changes around the TP, such as in the Gongga Mountains [43] or Qilian Mountains [41]. Figure 5 shows the distribution of surface elevation changes of three typical glaciers and their changes along the longitudinal section. For example, in Xiyulong G., glacier thinning was at its maximum at low elevations near the terminus. As the altitude increased, the thinning of the glacier gradually weakened. At 9 km from the terminus, the surface elevation change of the glacier changed to 0; when the altitude increased again, the surface elevation change of the glacier began to increase in the periods from 1970 to 2000, 2000 to 2016 and 1970 to 2016. The same glacier surface elevation change pattern also exists in Gongxing G. and 5Y614G0038 G (Figure 5).
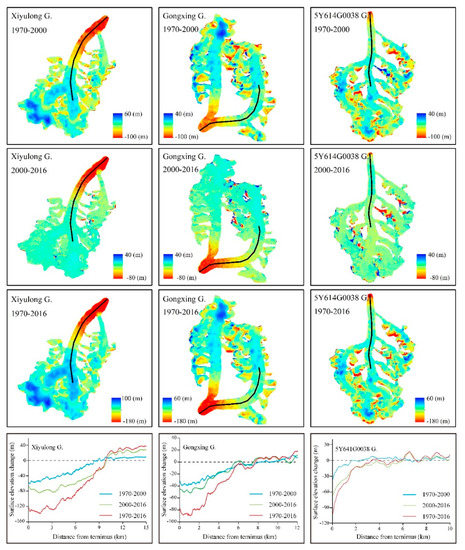
Figure 5.
Changes in glacier surface elevation over time periods and their changes along the longitudinal section in the Xiyulong Glacier (abbreviated as Xiyulong G., the same below), Gongxing G. and 5Y614G0038 G. The locations of glaciers are shown in Figure 4 in black font.
However, for some glaciers, the melting pattern of glaciers was reversed in certain periods of time. For example, in some glaciers, such as Zhongfeng G., Xikunlun G. and 5Y641H0067 G., from 1970 to 2000, the glaciers’ ablation pattern was normal. As the altitude decreased, the thinning of the glaciers increased. However, from 2000 to 2016, in areas with low glacier elevations, there was strong thickening, and the areas with the strongest thickening could reach 150 m (Figure 6). From 2000 to 2016, some glaciers thinned normally, but from 1970 to 2000, the phenomenon of thickening in low-altitude areas appeared, such as for the Congce G., Yulong G. and Kunlun G. (Figure 7).
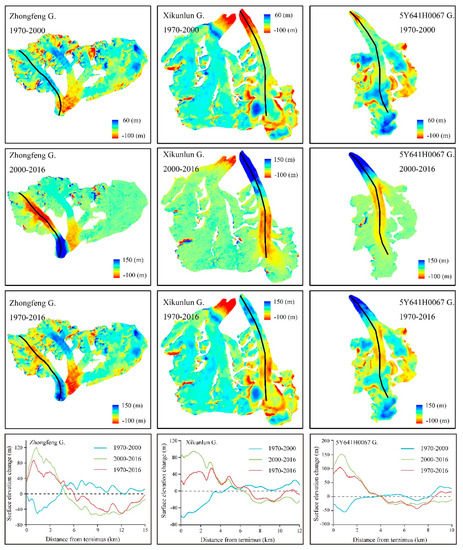
Figure 6.
Changes in glacier surface elevation over time periods and their changes along the longitudinal section in the Zhongfeng G., Xikunlun G. and 5Y641H0067 G. The locations of glaciers are shown in Figure 4 in brown font.
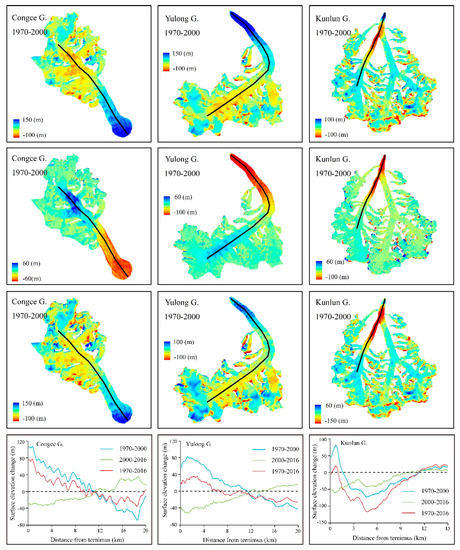
Figure 7.
Changes in glacier surface elevation over time periods and their changes along the longitudinal section in Congce G., Yulong G. and Kunlun G. The locations of glaciers are shown in Figure 4 in green font.
4. Discussion
4.1. Glacial Changes in WKL Compared with Others
Many scholars have studied the area of glaciers in the WKL [9,11,12,13,14]. However, most of the studies have coarse temporal resolutions, with only one or two periods of area changes on average. In this study, we obtained a total of eight epoch area changes from 1972 to 2018. In this way, more detailed characteristics of the changes in the area of glaciers are obtained. From 1970 to 1990, the results of all scholars showed that the glaciers were retreating. From 1990 to 2000, Wang et al. [9], Han [13] and Bao et al. [11] believed that the WKL glaciers were in a state of retreat, while Shangguan et al. [12] thought they were in a slightly expanding state, and this study also showed that they were in a overall slight expansion, but with spatial variability. From 2000 to 2010, Wang et al. [9] and Han [13] showed that the glaciers were in a state of retreat, while Bao et al. [11] and this study showed that they were in a state of slight retreat. From 2010 to 2018, Wang et al. [9] presented that the glaciers showed a trend of retreat, while Ma [14] and this study showed a state of expansion.
Scholars have also performed additional research on the mass balance of the WKL, mainly including the material balance from 1970 to 2000 based on the geodetic method [9,10] and the mass balance from 2003 to 2008 based on ICESat [8,11,44]. Zhou et al. [10] obtained a mass balance of 0.02 ± 0.1 m w.e. a−1 from the mid-1970s to 2000 based on KH-9 and SRTM. Wang et al. [9] obtained a mass balance of −0.06 ± 0.13 m w.e. a−1 from the 1970s to 2000 based on topographic maps and SRTM. In addition, according to Bao et al. [11], Neckel et al. [44] and Ke et al. [8], from 2003 to 2008, WKL’s mass balance was approximately 0.03 to 0.23 w.e. a−1 based on ICESat. In this article, we obtained the mass balance of glaciers in the WKL region from 1970 to 2016, a longer and continuous time series.
4.2. Influencing Factors of Glacier Changes
According to the two categories of thickness changes for the different glaciers in the WKL, we believe that the category one of glaciers are normal glaciers, which conform to the general glacier change patterns. The thickness of the ablation zone is thin, and the accumulation zone is thick. The thickness change pattern of the category two of the glacier should be caused by glacier surging. It is clearly seen that surge events occurred over the Congce G., Yulong G. and Kunlun G. from the 1970s to 2000 and the Zhongfeng G., Xikunlun G. and 5Y641H0067 G. from 2000 to 2016. Glacial surging will have a certain effect on the change in glaciers. When glacier surging occurs, the rapid movement transports the mass in the accumulation zone to the ablation zone and causes the glacier to advance and increase in area. At this time, the accumulation zone is thinned, and the ablation zone is thickened; after glacier surging, a large amount of mass is exposed to the ablation zone, causing subsequent rapid melting [45,46].
Overall, from 1970 to 2018, the glaciers in the WKL retreated slightly with fluctuations. Before 2000, especially before 1990, the glaciers showed a retreating trend; after 2000, especially after 2010, they showed an expansion. Before 2000, the glaciers showed a slight thinning phenomenon, and after 2000, they showed a slight thickening phenomenon. In 1985, the end-of-summer transient snowlines ranged from 5700 to 6120 m a.s.l., and the average equilibrium line altitude (ELA) was 5930 m a.s.l. [9,47]. The snowlines from 2003 to 2013 varied from 5929 to 6061 m, with a mean of approximately 5990 m [11]. This result means that the ELA of glaciers has shown a slight upward trend in the past few decades, but the increase is not obvious. The results of the ELA change also confirm that the glaciers of the WKL were in a slight retreat.
Climate change is generally considered to be the main factor causing glacier change [41,48]. To understand the relationship between climate and glacier change here, we analyzed meteorological data from six stations (Pishan, Hotan, Yutian, Mingfeng, Shijiehe and Geze). Meteorological data can be downloaded from the China Meteorological Data Sharing Service system (http://cdc.cma.gov.cn/). Using annual precipitation and summer (June, July and August) average air temperature data from 1973 to 2019, we present the climate change trend of WKL (Figure 8). The results show that from 1973 to 2019, the temperature showed a large upward trend, while the annual precipitation during the period increased slightly. Mass accumulation caused by increased precipitation is not enough to compensate for the mass loss caused by increased temperature. In detail, the expansion of glaciers during 2010–2018 was probably caused by increased precipitation and decreased temperatures during this period (Figure 8). Climate change has difficulty fully explaining the multiple fluctuations in glaciers from 1970 to 2018, which is most likely caused by glacial surging.
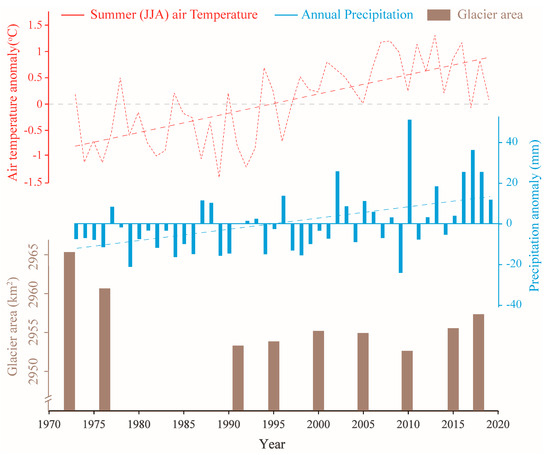
Figure 8.
Changes in mean annual precipitation and mean summer air temperature (June, July and August) based on the six nearest weather stations around the WKL as anomalies from the mean between 1973 and 2019. The red and blue dashed lines are the linear trend lines of air temperature and precipitation.
5. Conclusions
In this study, we analyzed the changes in glacier area and mass in the WKL region using topographic maps, Landsat series data, SRTM and TanDEM-x data from the 1970s to 2018. We found that from 1972 to 2018, the total area of glaciers in the WKL decreased by 7.99 km2. The area decreased by 12.02 km2 from 1972 to 1991 and increased by 4.70 km2 from 2010 to 2018. Glacial surface elevation and ice volume change results in the WKL showed that the overall glacier thickness slightly decreased from 1970 to 2016, with an average of −1.9 ± 1.0 m and a mass balance of −0.03 ± 0.02 m w.e. The glacier thinning was approximately 2.5 m from 1970 to 2000, while from 2000 to 2016, the glacier was thickened by approximately 0.6 m. Overall, the glaciers in the WKL showed a very slight retreat. Our conclusion also proves that there is indeed the existent of the “Karakoram Anomaly” phenomenon in the WKL in the past few decades. In addition, the mass changes of glaciers are largely affected by glacial surging.
Author Contributions
B.C. and B.P. led the project; W.G. and K.L. processed the data; B.C. and W.G. wrote the paper. Validation, Z.W.; Data curation, H.H. All authors have read and agreed to the published version of the manuscript.
Funding
This study was funded by the Second Tibetan Plateau Scientific Expedition and Research Program (STEP, grant No. 2019QZKK0205), National Natural Science Foundation of China (grant No. 41701057), the Ministry of Science and Technology of the People’s Republic of China (grant No. 2013FY111400). And the APC was funded by the Second Tibetan Plateau Scientific Expedition and Research Program (STEP, grant No. 2019QZKK0205).
Conflicts of Interest
The authors declare no conflict of interest.
References
- Bolch, T.; Kulkarni, A.; Kääb, A.; Huggel, C.; Paul, F.; Cogley, J.G.; Frey, H.; Kargel, J.S.; Fujita, K.; Scheel, M.; et al. The State and Fate of Himalayan Glaciers. Science 2012, 336, 310–314. [Google Scholar] [CrossRef] [PubMed]
- Gardelle, J.; Berthier, E.; Arnaud, Y. Slight mass gain of Karakoram glaciers in the early twenty-first century. Nat. Geosci. 2012, 5, 322–325. [Google Scholar] [CrossRef]
- Gardelle, J.; Berthier, E.; Arnaud, Y.; Kääb, A. Region-wide glacier mass balances over the Pamir-Karakoram-Himalaya during 1999–2011. Cryosphere 2013, 7, 1263–1286. [Google Scholar] [CrossRef]
- Gardner, A.S.; Moholdt, G.; Cogley, J.G.; Wouters, B.; Arendt, A.A.; Wahr, J.; Berthier, E.; Hock, R.; Pfeffer, W.T.; Kaser, G.; et al. A Reconciled Estimate of Glacier Contributions to Sea Level Rise: 2003 to 2009. Science 2013, 340, 852–857. [Google Scholar] [CrossRef] [PubMed]
- Yao, T.; Thompson, L.; Yang, W.; Yu, W.; Gao, Y.; Guo, X.; Yang, X.; Duan, K.; Zhao, H.; Xu, B.; et al. Different glacier status with atmospheric circulations in Tibetan Plateau and surroundings. Nat. Clim. Chang. 2012, 2, 663–667. [Google Scholar] [CrossRef]
- Guo, W.; Liu, S.; Xu, J.; Wu, L.; Shangguan, D.; Yao, X.; Wei, J.; Bao, W.; Yu, P.; Liu, Q.; et al. The second Chinese glacier inventory: Data, methods and results. J. Glaciol. 2015, 61, 357–372. [Google Scholar] [CrossRef]
- Hewitt, K. The Karakoram Anomaly? Glacier Expansion and the Elevation Effect, Karakoram Himalaya. Mt. Res. Dev. 2005, 25, 332–340. [Google Scholar] [CrossRef]
- Ke, L.; Ding, X.; Song, C. Heterogeneous changes of glaciers over the western Kunlun Mountains based on ICESat and Landsat-8 derived glacier inventory. Remote. Sens. Environ. 2005, 168, 13–23. [Google Scholar] [CrossRef]
- Wang, Y.; Hou, S.; Huai, B.; An, W.; Pang, H.; Liu, Y. Glacier anomaly over the western Kunlun Mountains, Northwestern Tibetan Plateau, since the 1970s. J. Glaciol. 2018, 64, 624–636. [Google Scholar] [CrossRef]
- Zhou, Y.; Li, Z.; Li, J.; Zhao, R.; Ding, X. Glacier mass balance in the Qinghai–Tibet Plateau and its surroundings from the mid-1970s to 2000 based on Hexagon KH-9 and SRTM DEMs. Remote. Sens. Environ. 2018, 210, 96–112. [Google Scholar] [CrossRef]
- Bao, W.; Liu, S.; Wei, J.; Guo, W. Glacier changes during the past 40 years in the West Kunlun Shan. J. Mt. Sci. 2005, 12, 344–357. [Google Scholar] [CrossRef]
- Shangguan, D.; Liu, S.; Ding, Y.; Li, J.; Zhang, Y.; Ding, L.; Wang, X.; Xie, C.; Li, G. Glacier changes in the west Kunlun Shan from 1970 to 2001 derived from Landsat TM/ETM+ and Chinese glacier inventory data. Ann. Glaciol. 2007, 46, 204–208. [Google Scholar] [CrossRef]
- Han, Y. Research on Glacier Change in the West Kunlun Mountains and Flow Velocity Estimation Based on Landsat Images (1977–2013); Nanjing University: Nanjing, China, 2015. (In Chinese) [Google Scholar]
- Ma, Q. Monitoring Glacier Change on West Kunlun Shan Based on Multi-Source Remote Sensing Data; Nanjing University: Nanjing, China, 2018. (In Chinese) [Google Scholar]
- Scherler, D.; Bookhagen, B.; Strecker, M.R. Spatially variable response of Himalayan glaciers to climate change affected by debris cover. Nat. Geosci. 2011, 4, 156–159. [Google Scholar] [CrossRef]
- Yasuda, T.; Furuya, M. Dynamics of surge-type glaciers in West Kunlun Shan, Northwestern Tibet. J. Geophys. Res. Earth Surf. 2015, 120, 2393–2405. [Google Scholar] [CrossRef]
- Chen, F.; Yu, Z.; Yang, M.; Ito, E.; Wang, S.; Madsen, D.B.; Huang, X.; Zhao, Y.; Sato, T.; Birks, H.J.B.; et al. Holocene moisture evolution in arid central Asia and its out-of-phase relationship with Asian monsoon history. Quat. Sci. Rev. 2008, 27, 351–364. [Google Scholar] [CrossRef]
- Shi, Y.; Liu, S. Estimation on the response of glaciers in China to the global warming in the 21st century. Chin. Sci. Bull. 2000, 45, 668–672. [Google Scholar] [CrossRef]
- Rabus, B.; Eineder, M.; Roth, A.; Bamler, R. The shuttle radar topography mission—A new class of digital elevation models acquired by spaceborne radar. ISPRS J. Photogramm. Remote. Sens. 2003, 57, 241–262. [Google Scholar] [CrossRef]
- Pieczonka, T.; Bolch, T.; Wei, J.; Liu, S. Heterogeneous mass loss of glaciers in the Aksu-Tarim Catchment (Central Tien Shan) revealed by 1976 KH-9 Hexagon and 2009 SPOT-5 stereo imagery. Remote. Sens. Environ. 2013, 130, 233–244. [Google Scholar] [CrossRef]
- Shangguan, D.H.; Bolch, T.; Ding, Y.J.; Kröhnert, M.; Pieczonka, T.; Wetzel, H.U.; Liu, S.Y. Mass changes of Southern and Northern Inylchek Glacier, Central Tian Shan, Kyrgyzstan, during—1975 and 2007 derived from remote sensing data. Cryosphere 2015, 9, 703–717. [Google Scholar] [CrossRef]
- Rodríguez, E.; Morris, C.S.; Belz, Z.E. A global assessment of the SRTM performance. Photogramm. Eng. Remote. Sens. 2006, 72, 249–260. [Google Scholar] [CrossRef]
- Rossi, C.; Rodriguez Gonzalez, F.; Fritz, T.; Yague-Martinez, N.; Eineder, M. TanDEM-X calibrated Raw DEM generation. ISPRS J. Photogramm. Remote. Sens. 2012, 73, 12–20. [Google Scholar] [CrossRef]
- Gruber, A.; Wessel, B.; Huber, M.; Roth, A. Operational TanDEM-X DEM calibration and first validation results. ISPRS J. Photogramm. Remote. Sens. 2012, 73, 39–49. [Google Scholar] [CrossRef]
- Huang, L.; Li, Z.; Han, H.; Tian, B.; Zhou, J. Analysis of thickness changes and the associated driving factors on a debris-covered glacier in the Tienshan Mountain. Remote. Sens. Environ. 2018, 206, 63–71. [Google Scholar] [CrossRef]
- Ke, L.; Ding, X.; Li, W.; Qiu, B. Remote Sensing of Glacier Change in the Central Qinghai-Tibet Plateau and the Relationship with Changing Climate. Remote. Sens. 2017, 9, 114. [Google Scholar] [CrossRef]
- Paul, F.; Bolch, T.; Kääb, A.; Nagler, T.; Nuth, C.; Scharrer, K.; Shepherd, A.; Strozzi, T.; Ticconi, F.; Bhambri, R.; et al. The glaciers climate change initiative: Methods for creating glacier area, elevation change and velocity products. Remote. Sens. Environ. 2015, 162, 408–426. [Google Scholar] [CrossRef]
- Bolch, T.; Menounos, B.; Wheate, R. Landsat-based inventory of glaciers in western Canada, 1985–2005. Remote. Sens. Environ. 2010, 114, 127–137. [Google Scholar] [CrossRef]
- Paul, F.; Barrand, N.E.; Baumann, S.; Berthier, E.; Bolch, T.; Casey, K.; Frey, H.; Joshi, S.P.; Konovalov, V.; Le Bris, R.; et al. On the accuracy of glacier outlines derived from remote-sensing data. Ann. Glaciol. 2013, 54, 171–182. [Google Scholar] [CrossRef]
- Wei, J.; Liu, S.; Guo, W.; Yao, X.; Xu, J.; Weijia, B.; Zongli, J. Surface-area changes of glaciers in the Tibetan Plateau interior area since the 1970s using recent Landsat images and historical maps. Ann. Glaciol. 2014, 55, 213–222. [Google Scholar]
- Zhang, Z.; Liu, S.; Wei, J.; Xu, J.; Guo, W.; Bao, W.; Jiang, Z. Mass Change of Glaciers in Muztag Ata–Kongur Tagh, Eastern Pamir, China from 1971/76 to 2013/14 as Derived from Remote Sensing Data. PLoS ONE 2016, 11, e0147327. [Google Scholar] [CrossRef]
- Nuth, C.; Kääb, A. Co-registration and bias corrections of satellite elevation data sets for quantifying glacier thickness change. Cryosphere 2011, 5, 271–290. [Google Scholar] [CrossRef]
- Berthier, E.; Schiefer, E.; Clarke, G.K.C.; Menounos, B.; Remy, F. Contribution of Alaskan glaciers to sea-level rise derived from satellite imagery. Nat. Geosci. 2010, 3, 92–95. [Google Scholar] [CrossRef]
- Wei, J.; Liu, S.; Guo, W.; Xu, J.; Bao, W.; Donghui, S. Changes in Glacier Volume in the North Bank of the Bangong Co Basin from 1968 to 2007 Based on Historical Topographic Maps, SRTM, and ASTER Stereo Images. Arct. Antarct. Alp. Res. 2015, 47, 301–311. [Google Scholar]
- Berthier, E.; Arnaud, Y.; Vincent, C.; Rémy, F. Biases of SRTM in high-mountain areas: Implications for the monitoring of glacier volume changes. Geophys. Res. Lett. 2006, 33, L08502. [Google Scholar] [CrossRef]
- Paul, F. Calculation of glacier elevation changes with SRTM: Is there an elevation-dependent bias? J. Glaciol. 2008, 55, 945–946. [Google Scholar] [CrossRef]
- Gardelle, J.; Berthier, E.; Arnaud, Y. Impact of resolution and radar penetration on glacier elevation changes computed from DEM differencing. J. Glaciol. 2012, 58, 419–422. [Google Scholar] [CrossRef]
- Fischer, M.; Huss, M.; Hoelzle, M. Surface elevation and mass changes of all Swiss glaciers 1980–2010. Cryosphere 2015, 9, 525–540. [Google Scholar] [CrossRef]
- Barandun, M.; Huss, M.; Sold, L.; Farinotti, D.; Azisov, E.; Salzmann, N.; Usubaliev, R.; Merkushkin, A.; Hoelzle, M. Re-analysis of seasonal mass balance at Abramov glacier 1968–2014. J. Glaciol. 2015, 61, 1103. [Google Scholar] [CrossRef]
- Zhang, Z.; Liu, S.; Zhang, Y.; Wei, J.; Jiang, Z.; Wu, K. Glacier variations at Aru Co in western Tibet from 1971 to 2016 derived from remote-sensing data. J. Glaciol. 2018, 64, 397–406. [Google Scholar] [CrossRef]
- Cao, B.; Pan, B.; Wen, Z.; Guan, W.; Li, K. Changes in glacier mass in the Lenglongling Mountains from 1972 to 2016 based on remote sensing data and modeling. J. Hydrol. 2019, 578, 124010. [Google Scholar] [CrossRef]
- Huss, M. Density assumptions for converting geodetic glacier volume change to mass change. Cryosphere 2013, 7, 877–887. [Google Scholar] [CrossRef]
- Cao, B.; Pan, B.; Guan, W.; Wen, Z.; Wang, J. Changes in glacier volume on Mt. Gongga, southeastern Tibetan Plateau, based on the analysis of multi-temporal DEMs from 1966 to 2015. J. Glaciol. 2019, 65, 366–375. [Google Scholar] [CrossRef]
- Neckel, N.; Kropáček, J.; Bolch, T.; Hochschild, V. Glacier Mass Changes on the Tibetan Plateau 2003–2009 Derived from ICESat Laser Altimetry Measurements. Environ. Res. Lett. 2014, 9, 014009. [Google Scholar] [CrossRef]
- Cuffey, K.M.; Paterson, W.S.B. The Physics of Glaciers, 4th ed.; Academic Press: Cambridge, MA, USA, 2010. [Google Scholar]
- Cogley, J.G.; Hock, R.; Rasmussen, L.A.; Arendt, A.A.; Bauder, A.; Braithwaite, R.J.; Jansson, P.; Kaser, G.; Möller, M.; Nicholson, L.; et al. Glossary of glacier mass balance and related terms. In IHP-VII Technical Documents in Hydrology No 86 IACS Contribution No 2; UNESCO-IHP: Paris, France, 2011. [Google Scholar]
- Zhang, Z.; Jiao, K. Modern glaciers on the south slope of West Kunlun Mountains (in Aksayqin Lake and Guozha Co Lake drainage areas). Bull. Glacier Res. 1987, 5, 85–91. [Google Scholar]
- Pritchard, H.D. Asia’s shrinking glaciers protect large populations from drought stress. Nature 2019, 569, 649–654. [Google Scholar] [CrossRef]


© 2020 by the authors. Licensee MDPI, Basel, Switzerland. This article is an open access article distributed under the terms and conditions of the Creative Commons Attribution (CC BY) license (http://creativecommons.org/licenses/by/4.0/).